
Abstract
Day reporting centers (DRCs) are increasingly popular alternative to traditional forms of supervision. Yet, studies that describe a fairly common set of programs and services among DRCs produce conflicting results regarding their efficacy, suggesting that as yet unobserved characteristics of DRCs might explain their varying efficacy. This article relies on a mixed-methods analysis of DRCs. Using quasi-experimental regression techniques and a conservative control group to estimate the average treatment effect of DRC participation, we analyze recidivism outcomes (arrests and convictions) after a 2-year follow-up period. We then draw on qualitative interview data to reveal which aspects of the DRC programs’ clients identify as most important for successful re-entry. Our analysis suggests that DRCs reduce recidivism for participants by 10.8 (convictions) to 12.8 (arrests) percentage points. Our interview data suggest that high levels of social support from justice-involved DRC staff amplify the effects of programming to help explain this outcome.
Reversing the practice of mass incarceration has become a priority within criminal justice policy reform in a number of U.S. states, including California and New York. This shift is executed through the implementation of alternative supervision or community corrections programming. Concurrently, scholars have examined how varied prisoner re-entry programs effect recidivism and overall reintegration success (see, Bender et al., 2016; Jonson & Cullen, 2015; Wilson & Petersilia, 2011). One of these programs is DRCs, which aim to provide services, resources, and skills linked to criminogenic needs for the formerly incarcerated who are still under supervision. DRCs have emerged within multiple states, yet Huebner (2013) notes there remains “scant literature on the efficacy of DRC programming” (p.113).
Despite strong a priori reasons to expect that DRCs will lessen recidivism rates, research on these programs have engendered decidedly mixed conclusions about their efficacy (for review, see Wong et al., 2019). In fact, studies that employ random assignment or quasi-experimental designs find that DRCs can reduce, increase, or have no effect on recidivism, even though most assess client risks and address their criminogenic needs via a fairly common set of services and programming (Bonta & Andrews, 2017). It remains unclear why some are effective while others are not. Even in cases with a shown DRC effect on recidivism, these programs are typically treated as something of a black box (Duwe, 2013), in part because scholars make minimal effort to understand how programming is delivered and by whom, which could reveal possible mechanisms that contribute to specific outcomes.
The U.S. Supreme Court’s decision in Brown v. Plata (2011) forced California’s hand to immediately address the state’s overcrowded prisons. Ordered to reduce the population of state prisons by 25% within 2 years, the legislature passed the Public Safety Realignment Act (AB 109) and Criminal Justice Realignment (AB 117), which vested California’s 58 counties with unprecedented responsibility for the physical custody and post-custodial monitoring of people with non-violent, non-serious, and non-sexual offenses. While each county received funding from the state, few stipulations were attached to these monies, which in turn granted them substantial discretion in developing their own custodial and post-custodial strategies. Throughout various counties, DRCs emerged as an alternative to traditional supervision based upon the belief that their model of integrated service delivery should, conceptually, aid in re-entry and reduce recidivism while also addressing prison and jail overcrowding.
Our study of three Riverside County’s DRCs involves a mixed-methods analysis to examine their effectiveness and identify the possible mechanisms at play (Riverside County Department of Mental Health, n.d.). Our deductive quantitative analysis focuses on the recidivism outcomes of arrests and convictions within a 2-year follow-up period using logistic and doubly-robust inverse probability weighting regression techniques. We also employ a control group of the subset of individuals on probation who could have completed the DRC but did not because they were employed or enrolled in alternative programming. We then turn to our qualitative interview data to inductively explore possible mechanisms that cultivate this outcome.
Do Day Reporting Centers Reduce Recidivism?
In response to ballooning prison and jail populations various community-based programs—including DRCs—emerged as an alternative to bridge custodial sentences and unsupervised release. Duwe (2013) describes DRCs as: “ . . . similar to prisoner reentry programs insofar as they are designed to reduce recidivism by increasing offender access to relevant programming” (p. 145). These physical sites are designed to facilitate successful re-entry through a “one-stop” model that offers a range of services that address criminological needs, including anger management, educational and vocational training, cognitive therapy, job placement services, drug addiction classes, connections to various social services, general life-skills training, and more. DRCs typically provide community-based programming to people released from incarceration.
Extant research on DRCs reveals mixed conclusions regarding efficacy. Though certain evaluations champion DRCs as an effective alternative to traditional custodial supervision that reduces recidivism (Carr et al., 2016; Champion et al., 2011; Craddock & Graham, 2001; Martin et al., 2003; Ostermann, 2009), others find they are ineffective (Boyle et al., 2013) or underscore the methodological limitations within this research that can overestimate outcome results (Wong et al., 2019). The only published meta-analysis concludes that DRCs do not produce consistent effects across studies (Wong et al., 2019).
How can one account for this inconsistency? One possibility is that DRCs vary on key characteristics that matter for their efficacy but these characteristics have not been identified in the literature. For example, it could be that DRCs vary widely in the degree to which they provide services and programming that are well matched to criminogenic needs and address risks (Bonta & Andrews, 2017). However, our review of this body of work does not support this claim. A recent meta-analysis by Wong et al. (2019) summarized the impact of DRCs on recidivism across nine studies. Of the eight accessible, six described a set of fairly common services offered to clients (though two provided almost no discussion of the programming offered). We reviewed an additional four papers not included in the meta-analysis (Carr et al., 2016; Champion et al., 2011; Kim et al., 2008; Spence & Haas, 2015), and the one with a detailed discussion described a range of services and programming quite similar to the six in the Wong et al. (2019) study.
In short, the empirical literature on the efficacy of DRCs is quite mixed. Where there is an adequate description of DRC programming in the literature, the DRCs examined offered a similar array of services—therapy, skills training, and substance abuse treatment—which are also documented as important in the correctional interventions literature (e.g., Bonta & Andrews, 2017; Gendreau et al., 2017). As a result, it seems unlikely that there is enough variation in the services provided across DRCs to account for the observed differences in their efficacy. While it is always possible that stochastic variation could explain the lack of consistent effects in the literature, it is also possible that there are unobserved differences between the DRCs that explain this variation. Therefore, it is plausible that some DRCs deliver “stickier” services and programming and thereby producer stronger treatment effects than others because they differ in systematic but unobserved ways. Within the broader criminological research on re-entry, scholars identify a source of potential stickiness that is linked to lower recidivism—social support—that likewise emerges in our study. In what follows, we review the literature on re-entry, recidivism, and social support to suggest the latter could provide a key role in the association between DRCs and recidivism.
Re-entry, Social Support, and Recidivism
Within the broader re-entry literature, scholars argue that supportive relationships between parole/probation officers and adults on supervision can affect recidivism outcomes (Kennealy et al., 2012; Taxman & Ainsworth, 2009). Probation and parole agents enact therapeutic and supervisory roles with clients, which correspond with “control” and “care” models, respectively (Skeem et al., 2007). Officers who adopt control enforce rules and use the “stick” of violation and incarceration to garner compliance, while those who prioritize care employ a therapeutic treatment approach and problem solving with clients (Klockars, 1972). Some combine these two approaches—referred to as the hybrid model (Trotter, 1999)—this is difficult to achieve in practice (Skeem & Manchak, 2008).
Re-entry research increasingly emphasizes the role of agent social support for those under supervision as it influences a wide array of outcomes for them, including recidivism (see Cobbina, 2010; Hayes, 2018). Lin (1986) defines social support as, “the perceived or actual instrumental and/or expressive provisions supplied by the community, social networks, and confiding partners” (p. 18). Cullen (1994) further contributes to this literature by arguing social support should not be overlooked in this research and adds several relevant caveats: (a) perceptions of support are important considerations, (b) it consists of both instrumental (goal acquisition, goods, services, advice) and expressive (affective activities that affirm individuals) forms, and (c) the source of support matters. Vaux (1988) explains how expressive support is accomplished: “These needs are met respectively through emotional support, feedback and social reinforcement, and socializing” (p. 21).
Building off this early work, more contemporary research investigates how and whether criminal justice agents—specifically parole and probation officers (POs)—provide social support to those under their supervision. As an indicator of social support, Morash and colleagues (2018) examined agent communication styles and how people on probation and parole interpreted them. To that end, they find a conversational communication pattern (that includes care, shared feelings, and trust) ultimately produced more beneficial outcomes for clients, including greater self-efficacy and decreased recidivism. A different study concluded that more holistic support messages from officers generated positive effects for clients, such as perceptions of emotional and esteem support (Roddy et al., 2019). In contrast, officer communication styles that evoked authoritarianism (toughness and low caring) were more likely to engender client recalcitrance and potentially disrupt a favorable re-entry transition (Smith et al., 2016). In a similar vein, other studies indicate an indirect effect where non-supportive, punitive relationships between POs and those under supervision were related to their reactance and anxiety, which in turn elevated recidivism (Angell & Mahoney, 2007; Morash et al., 2016).
Drawing on re-entry research, we suggest that varying degrees of social support could potentially explain why some DRCs are more effective than others in terms of client outcomes. When clients experience or perceive a high degree of social support from staff, they are likely more receptive to programming and other services offered at the DRC. Conversely, when clients experience or perceive a low degree of social support in these contexts, they may harbor heightened distrust or even resistance toward DRC programming and services. Consideration of social support and its implementation by different staff is absent in the DRC assessment literature. Yet, we believe that it may be an integral component of re-entry programs, such as DRCs, that ultimately influences client outcomes.
The Current Studies
Our analyses rests upon a mixed-methods approach that combines deductive and inductive strategies. Our research setting includes three DRCs run by the Riverside Probation Department in response to AB 109—Riverside (2012), Temecula (2015), and Indio (2016) (Riverside County Department of Mental Health, n.d.). Each DRC offers roughly the same core services that are described in extant DRC research, including those that address diverse needs (e.g., GED/vocational training, social values, self-control, wellness and empowerment, computer skills, anger management, successful living, criminal addictive thinking, substance abuse, etc.), tangible services (e.g., bus passes, food, clothing), counseling (either on site and/or referrals), and referrals for additional services (substance use treatment, college classes, social services). Deductively, we use quantitative data to examine Riverside County DRC effects on recidivism. We compare 2-year recidivism rates between those who complete the DRC and those who did not participate in the DRC because they were employed or enrolled in alternative programming. Arguably, this control group allows us to isolate the impact of social support as much as possible with our observational data, insofar as employment and alternative programming address many of the same criminogenic needs as the services provided by DRCs. It should also yield a conservative estimate of the treatment effect, and we consider this empirically. In addition, we conduct an inductive qualitative study that focuses on DRC client perceptions and experiences to illuminate possible mechanisms that could explain any outcomes.
Study 1: Quantitative Data and Analysis
Data
The data for these analyses come from the Riverside County Probation Department, the fourth most populous county in Southern California. We obtained the universe of cases referred to the DRC between 2013 and 2017 in connection with AB 109. The probation department provided data on demographics, prior convictions, date of referral to the DRC, and DRC location for people on probation. In addition, we obtained exhaustive detailed arrest and conviction records from 2013 to 2019 from the California Department of Justice, including data on arrests, offense dates, and convictions.
Approach to Analysis
People on probation were not randomly assigned to the DRC. Rather, nearly every post-release community service individual on probation was referred to DRCs, but participation was not typically mandatory and many self-selected out for a variety of reasons. Such self-selection makes it difficult to identify the effect of DRC participation on recidivism, since unmeasurable characteristics that reduce recidivism are likely correlated with selection into DRCs. Thus, we employ both standard (logistic) regression and quasi-experimental methods to examine the efficacy of DRC participation. In particular, we employ standard logistic regression with observable covariates, as well as two doubly-robust forms of probability weighting to account for selection into treatment: Inverse Probability Weighting with Regression Adjustment (Wooldridge, 2010) and Augmented Inverse Probability Weighting (Robins et al., 1995).
Conceptually, these latter approaches use observed covariates to estimate selection into treatment, weight each treated observation with the inverse of the probability of treatment and each untreated observation with the inverse probability of not being treated, and then estimate the outcome model using these weights. This adjusted outcome-regression is used to compute average outcomes for each treatment group, and the difference in these averages across treatment groups estimate the treatment effect.
These approaches are doubly robust because practitioners need only specify one of the models—the treatment or the outcome—correctly for the results to be valid. We use the teffects ipwra and aipw commands with the logit function in Stata 16.0. All standard errors are corrected for heteroskedasticity and autocorrelation within the zip code of people on probation’s place of residence. Zip codes are useful because probation officers are assigned based on the zip code of individuals on probation such that we can account for correlated errors within probation officers, as well as groupwise heteroskedasticity, by clustering our standard errors on zip code. We also considered DRC location as an alternative way of partitioning the VCV matrix, which yielded much smaller standard errors than those reported here. Like all propensity score methods, the validity of the estimated average treatment effects (ATEs) depends on the degree to which there is common support (i.e., that individuals in the treatment group could have been assigned to the control group and vice versa) and the observed covariates are balanced across treatment and control groups (i.e., the standardized mean differences approach zero). We assess these assumptions empirically below.
Dependent Variables
Our dependent variable is recidivism, measured in two ways: arrests and convictions. In particular, we dichotomize arrests (1 = yes; 0 = no) and convictions (1 = yes; 0 = no) for new crimes (not including technical probation violations) within 2 years of the DRC referral date in our sample. A strength of our 2-year follow-up period is that it is longer than most of the studies included in Wong et al.’s (2019) meta-analysis.
Independent/Selection Variables
Following previous work, we include demographic information as well as characteristics of prior criminal history to estimate our models (Carr et al., 2016; Hyatt & Ostermann, 2019). With respect to demographics, we include gender, race and ethnicity (Black, Hispanic and White; other races/ethnicities are the reference category), age, and education (1 = high school graduate or GED). With respect to criminal history, we employ total number of convictions prior to probation and the level of supervision (maximum supervision = 1). In addition, we follow economic accounts linking weight and height to criminological behavior. In one explication of this link, economists argue that physical attractiveness matters for labor market opportunities because of discrimination (Bodenhorn et al., 2012; Bodenhorn & Price, 2009; Price, 2009). In others, height and weight are indicators of the cumulative advantage or disadvantage that individuals attain from childhood (Steckel, 2009), and that these advantages are in turn correlated with criminal behavior at the individual level (Becker, 1994). Still others examine the degree to which physical stature and its economic and criminological effects reflect other heritable traits that are less observable (Beckley et al., 2014). Because such discrimination, cumulative disadvantage, or unobservable heritable traits could plausibly affect DRC completion, we also include it in our model of selection into treatment. Previous research highlights that any causal effects of height and weight imply social comparisons for which baseline values change over time or across social contexts (Bodenhorn & Price, 2009). Thus, we transform height and weight into dummy variables equal to 1 if the respondent’s height or weight is above the median. In preliminary analyses, each of these had a significant partial correlation with either selection into treatment, the outcome, or both. We also considered whether the person on probation had a felony conviction, but this was not a significant predictor of either the treatment or the outcome net of total previous offenses and supervision level. Finally, we also include fixed effects for year and DRC location to capture unobserved processes that vary across time and DRC location but not individuals.
Sample
Table 1 displays summary statistics for all variables by DRC participation status after omitting individuals on probation who were deceased or of ill-health during the period of observation. The first column reports summary statistics for the treatment group: people on probation who completed DRC services. In the context of these DRCs, “completion” means that a people on probation successfully completed one or more of the treatment modules provided by the DRCs. Columns 2 and 3 report summary statistics for two potential control groups: (a) those who did not participate because of work and/or education related scheduling conflicts, and (b) those who either participated but did not complete at least one DRC module and those declined participation for a variety of reasons. Of those in column three, 27.4% started but did not complete the DRC (discharged for either non-participation or behavioral issues), while the rest never started a DRC module.
Descriptive Statistics
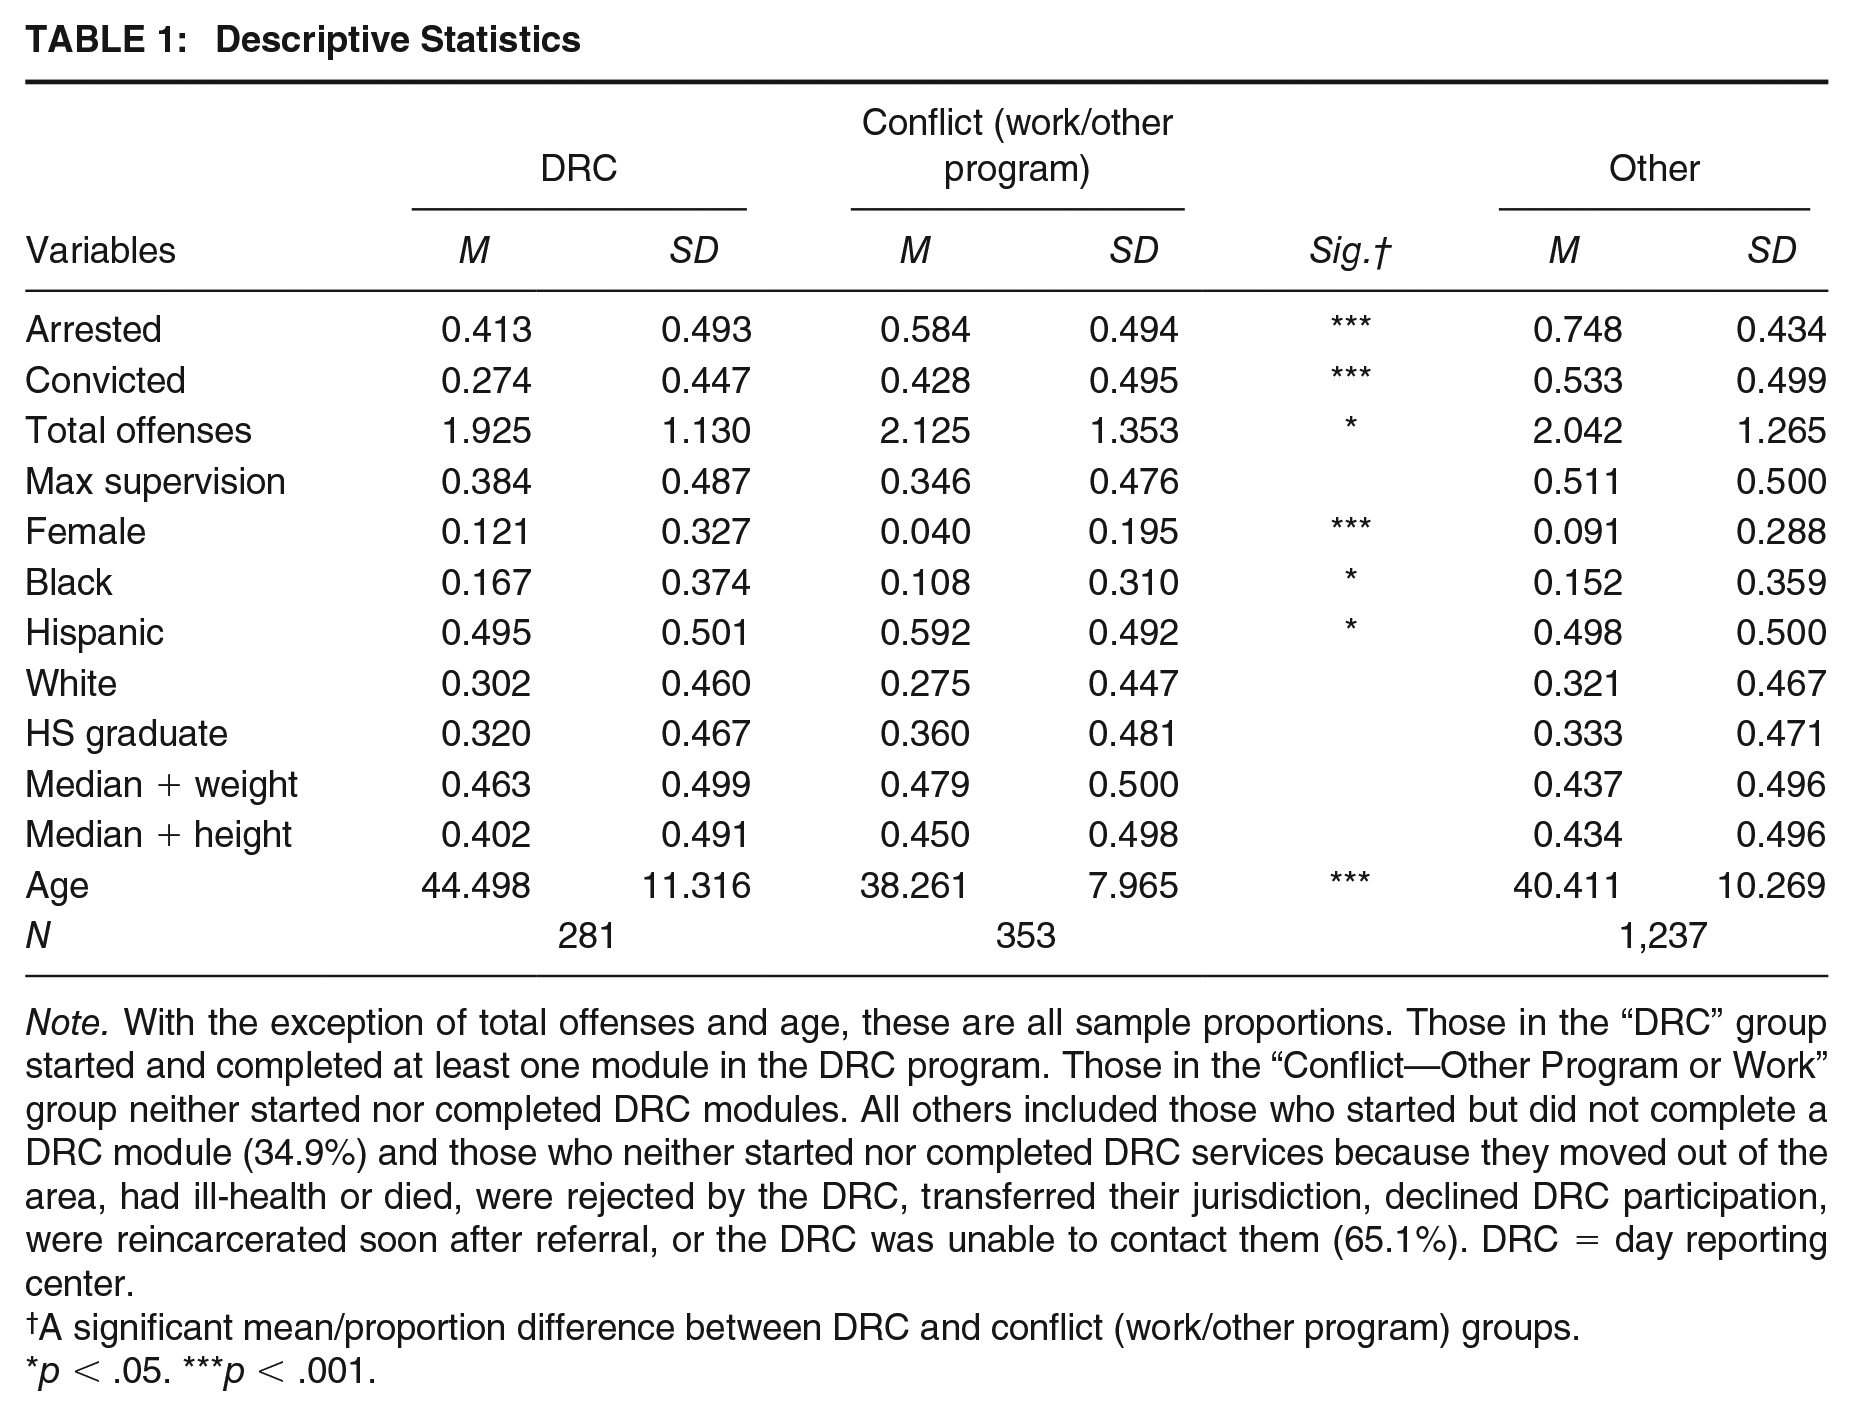
Note. With the exception of total offenses and age, these are all sample proportions. Those in the “DRC” group started and completed at least one module in the DRC program. Those in the “Conflict—Other Program or Work” group neither started nor completed DRC modules. All others included those who started but did not complete a DRC module (34.9%) and those who neither started nor completed DRC services because they moved out of the area, had ill-health or died, were rejected by the DRC, transferred their jurisdiction, declined DRC participation, were reincarcerated soon after referral, or the DRC was unable to contact them (65.1%). DRC = day reporting center.
A significant mean/proportion difference between DRC and conflict (work/other program) groups.
p < .05. ***p < .001.
By comparing these statistics across these conditions, it is fairly clear that those who did not participate/complete for the variety of reasons represented in column three are likely to differ significantly from the others on unobservable characteristics that would be correlated with both selection into successful treatment and subsequent recidivism. In particular, the people on probation in column three have higher rates of recidivism and level of supervision. Thus, to minimize the influence of these unobserved confounders on our estimate of the treatment effect, our preferred analyses excludes people on probation in Column 3 and utilizes people on probation in Column 2 as our control group. Our preferred strategy should yield a very conservative estimate of the treatment effect of DRCs because both treatment and control groups experience some level of skills training, labor market integration, or both. As we discuss below, we observe very little common support in the estimated propensity scores using the full sample from Table 1. Any bias that remains is likely to attenuate our estimate of the treatment effect insofar as working and pursuing an education reduce recidivism and correlate with unobservables that would predict selection into treatment. Nevertheless, we also compare estimates based on our preferred strategy to those with all available control subjects.
Quasi-Experimental Estimates of DRC Treatment Effects
We begin our empirical discussion by reporting results from logistic regressions that do not account for selection into treatment. The first row of Table 2 reports the coefficient on DRC completion, or the logged odds ratio of arrest (Columns 1 and 2) or conviction (Columns 4 and 5) for DRC completers relative to those who did not complete the DRC. The second row of Table 2 reports a statistic analogous to the ATEs, we report below with our inverse probability weighting models: the difference in the estimated probability of recidivism for treatment and control groups after conditioning on the controls. We call these “naïve” ATEs because they do not incorporate the inverse probability weights, but they are useful in demonstrating the effect of the weights on our subsequent results. Estimates in Columns 1 and 4 involve comparisons between DRC completers and all possible control subjects (Columns 2 and 3 in Table 1), while those in 2 and 5 are based on our preferred conservative control group. All of the statistics reported in Table 2 suggest that DRCs reduce recidivism. Consistent with our argument that the subjects in Column 2 of Table 1 represent a conservative control group, the estimated odds ratios are 88% (arrests) and 58% (convictions) larger in Columns 1/4 than in Columns 2/5. Similarly, the naïve ATEs are 81% and 74% larger in Columns 1/4 than in Columns 2/5.
Logistic and Inverse Probability Weighted Regression of Recidivism on DRC Completion and Controls
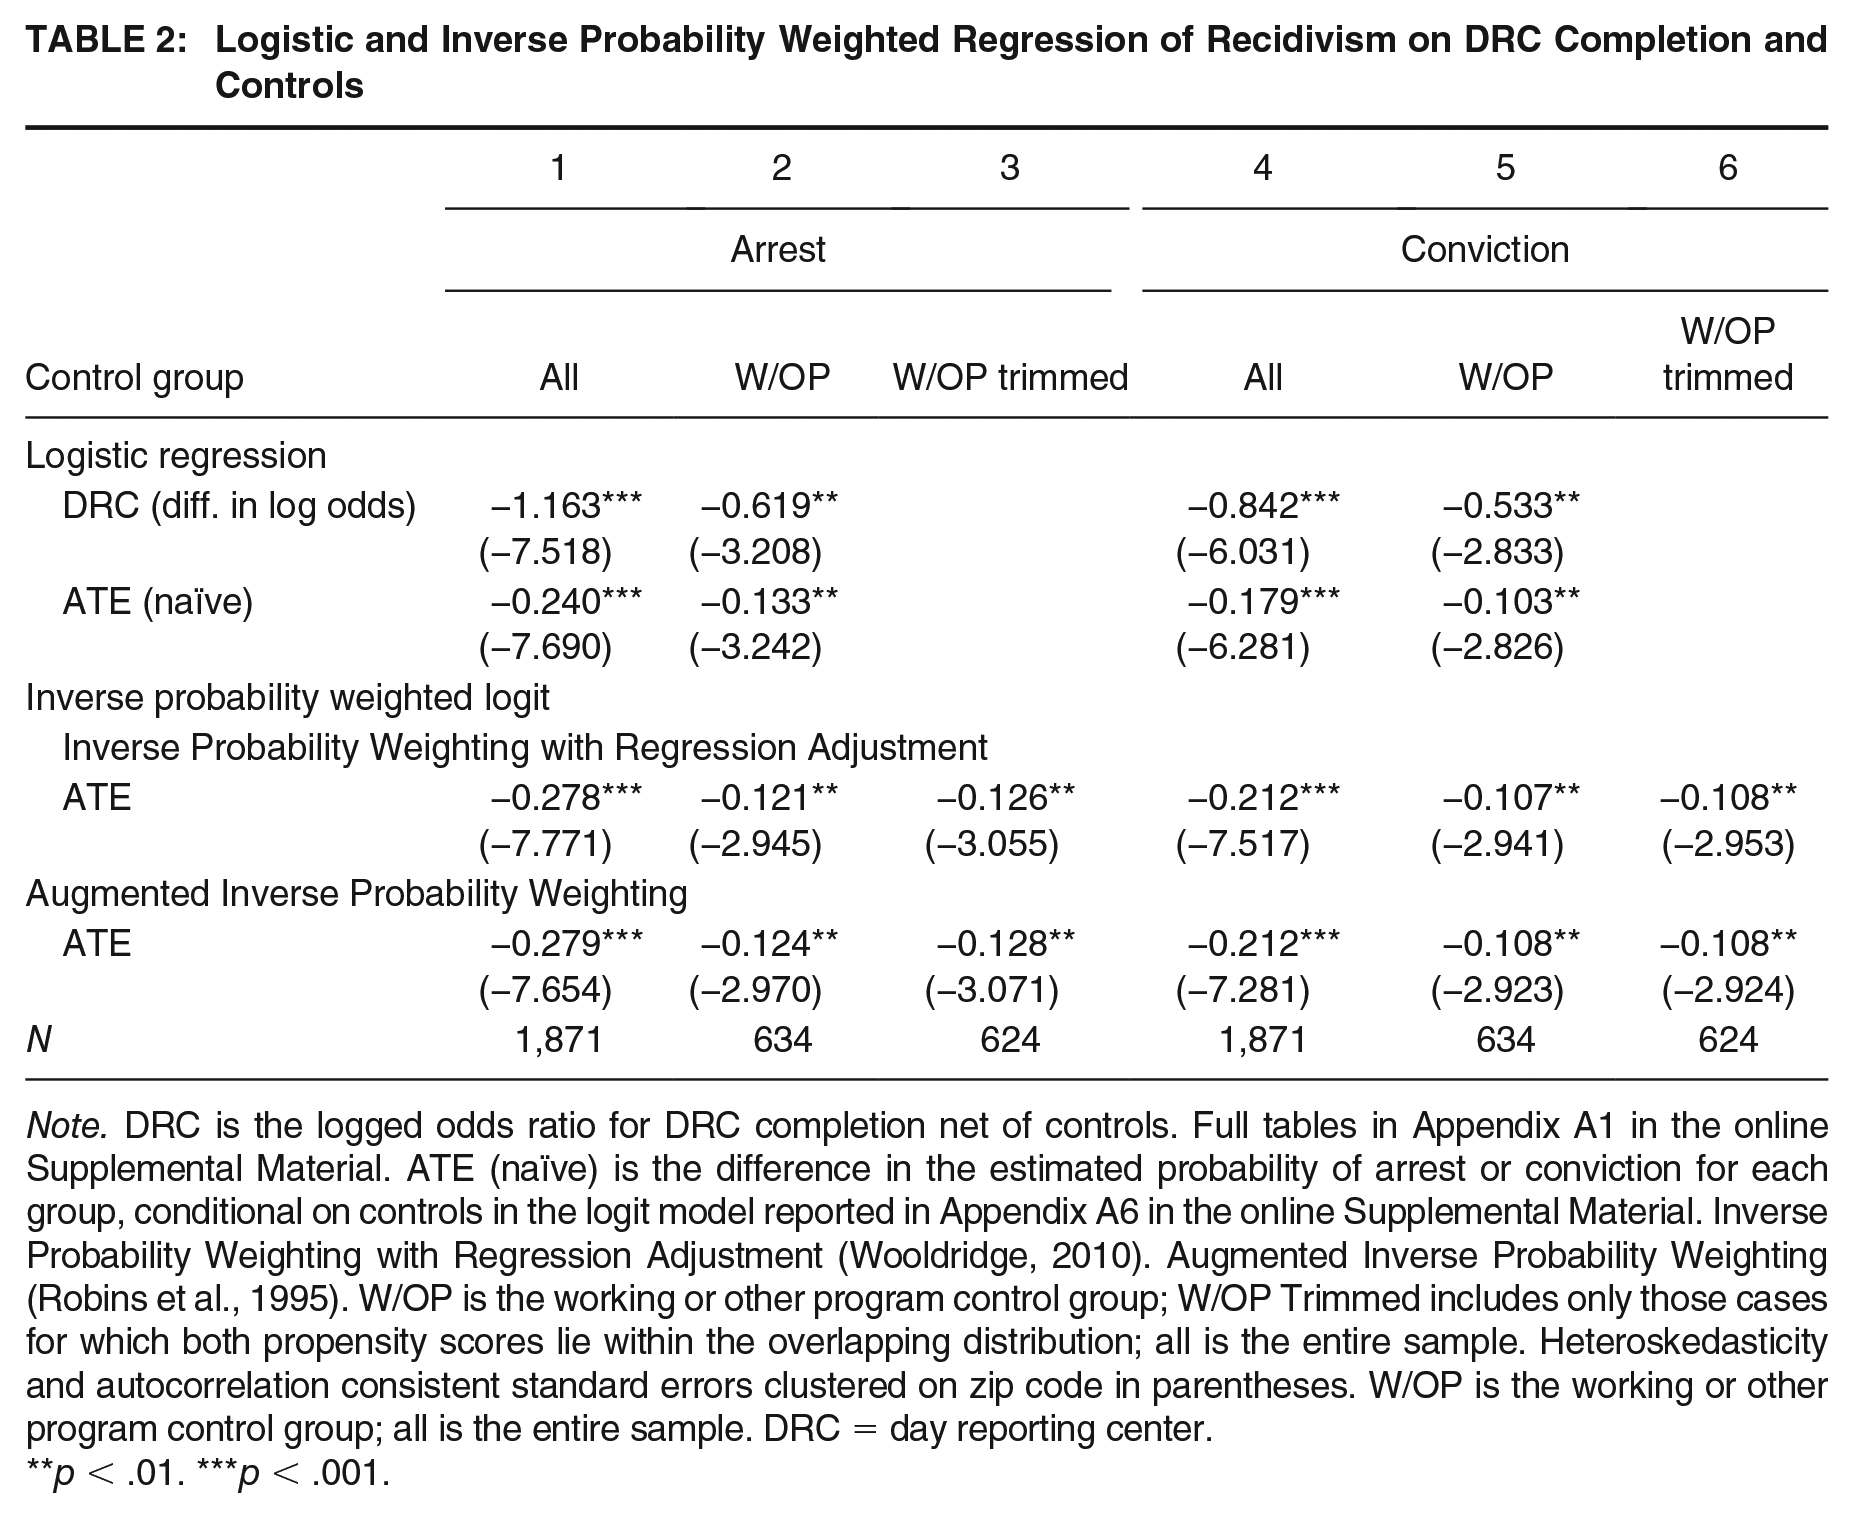
Note. DRC is the logged odds ratio for DRC completion net of controls. Full tables in Appendix A1 in the online Supplemental Material. ATE (naïve) is the difference in the estimated probability of arrest or conviction for each group, conditional on controls in the logit model reported in Appendix A6 in the online Supplemental Material. Inverse Probability Weighting with Regression Adjustment (Wooldridge, 2010). Augmented Inverse Probability Weighting (Robins et al., 1995). W/OP is the working or other program control group; W/OP Trimmed includes only those cases for which both propensity scores lie within the overlapping distribution; all is the entire sample. Heteroskedasticity and autocorrelation consistent standard errors clustered on zip code in parentheses. W/OP is the working or other program control group; all is the entire sample. DRC = day reporting center.
**p < .01. ***p < .001.
Before turning to the ATEs as estimated by our inverse probability weighted analysis, we begin by evaluating its requisite assumptions. Figure 1 reports an overlapping density plot for the propensity scores of the treatment for those in the treatment (solid line) and control group using our preferred (conservative) control group of the people on probation in Column 2 of Table 1. The figure suggests that the assumption of common support—that those in the treated group could have been assigned to the control group and vice versa—is met, insofar as there is no clustering near zero or one and the vast majority of observations in both groups overlap each other. Still, the overlap is not perfect: 10 observations have extreme scores that do not overlap. Therefore, we estimate our subsequent preferred models including both the full work/other programming sample and a trimmed work/other programming sample that excludes these 10 cases. Excluding these 10 cases eliminates any extreme observations on the propensity scores. By comparison, an analysis of common support utilizing the people on probation in Columns 2 and 3 of Table 1 yields very little common support. There is a significant degree of clustering at the extreme ends of the propensity scores and only 10 cases with propensity scores on both treatment and control that lie within the range of overlapping propensity scores, which further substantiates our argument that the control group in Column 2 is more similar to our treatment group than the rest of the people on probation in Column 3 of Table 1.
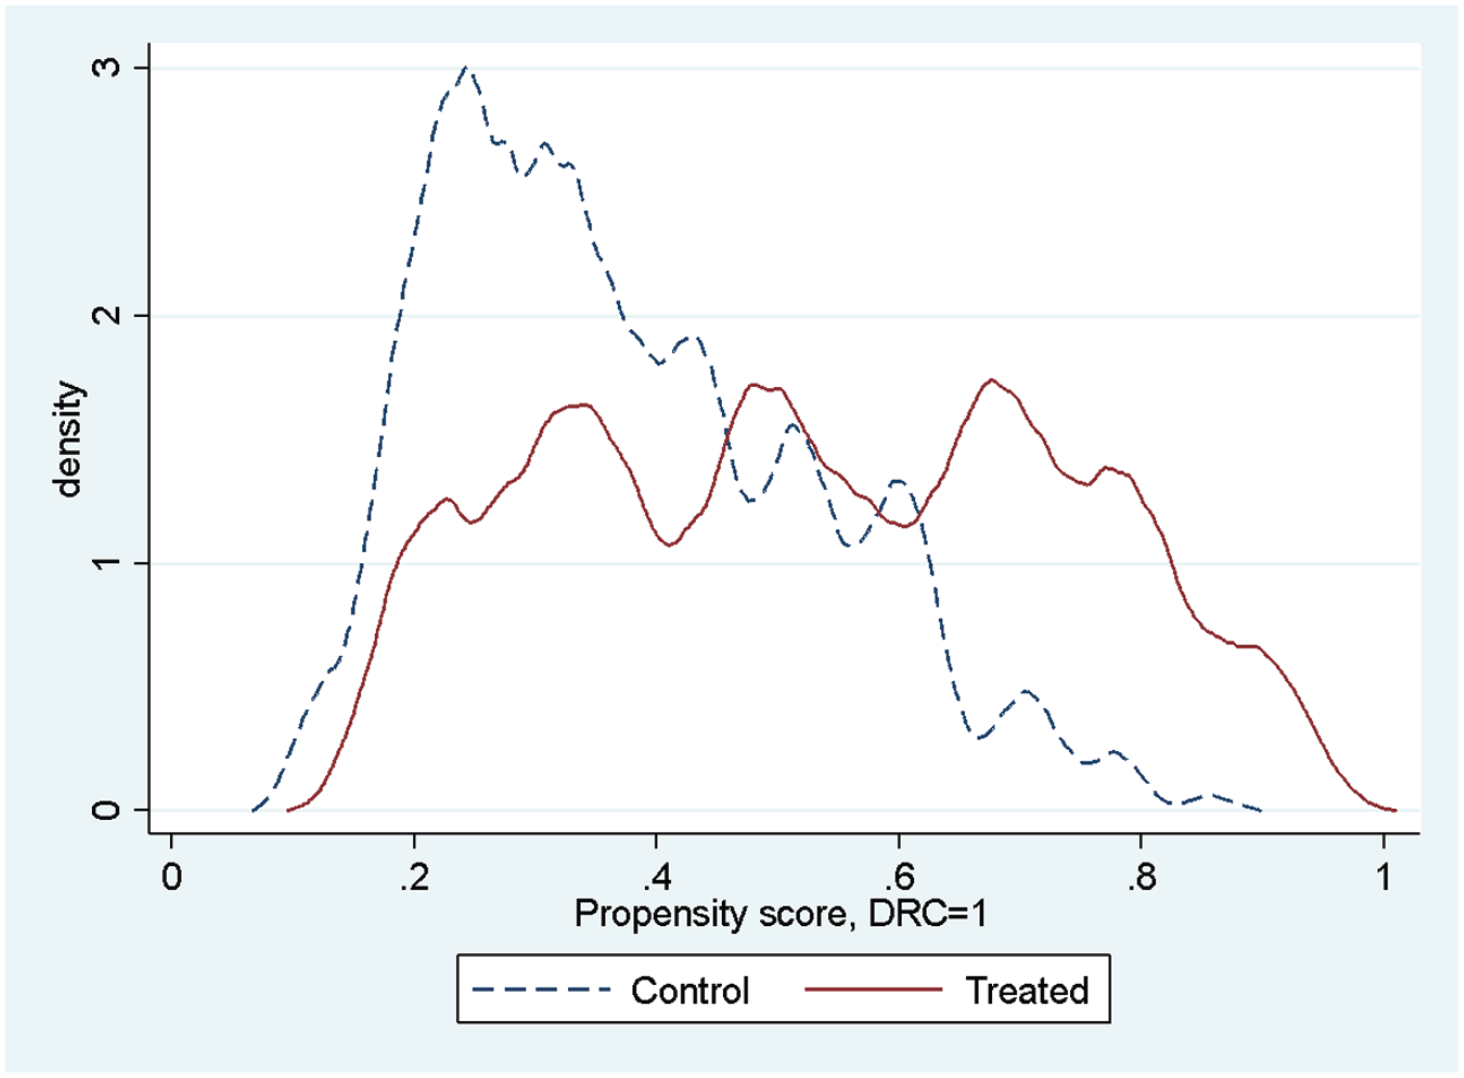
Overlap Assessment of Common Support for Work or Employed Only Control Group
Figure 2 reports a balance assessment for both the full and trimmed work/other programming sample. In both cases, our selection model appears to do a good job in balancing the observed covariates, as the weighted standardized differences between treatment and control groups approach zero. Even age at release, which was 6 years higher among the treated, is fairly close to zero in the weighted estimates. We also formally test the null hypothesis that the variables are balanced using Stata’s overid pos-estimation command. These tests are distributed chi-square with 16 degrees of freedom. We fail to reject this null hypothesis in both the full
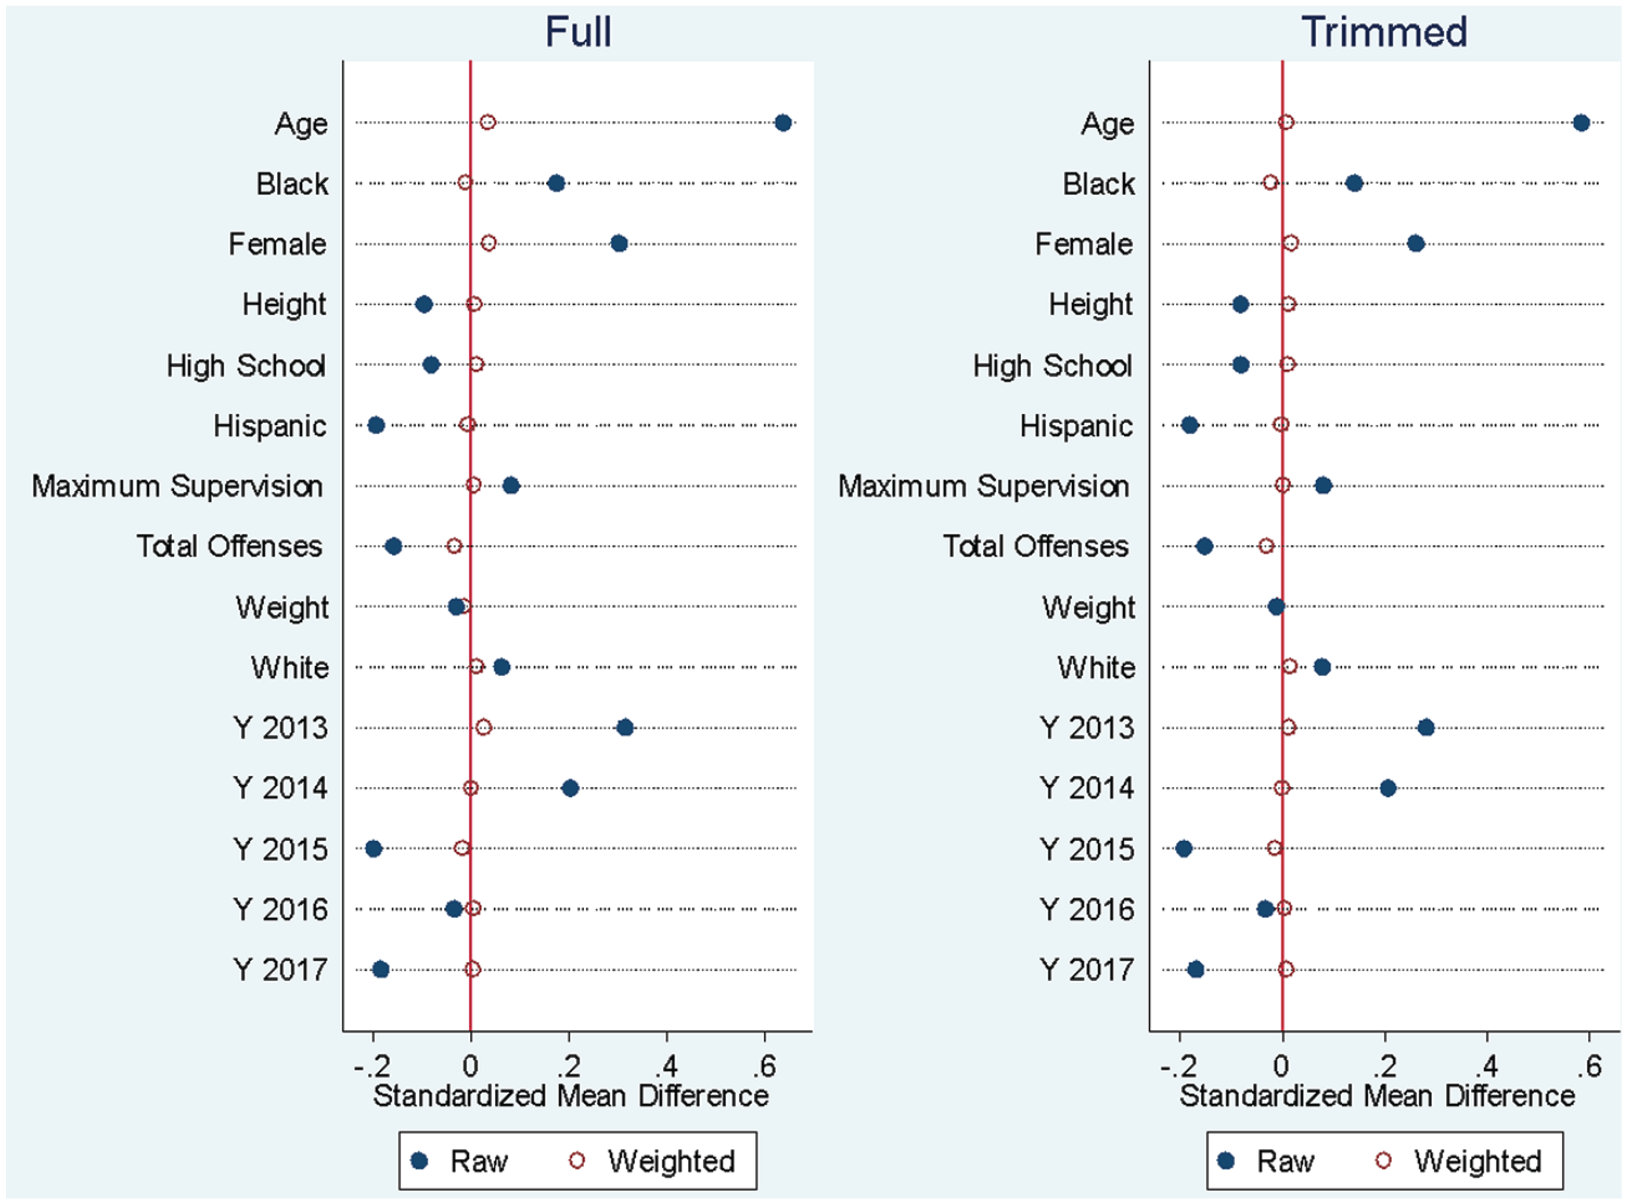
Standardized Mean Differences Across Treatment and Control Groups Before and After Weighting. N = 634
Having validated the requisite assumptions of our inverse probability weighting regression approaches for our preferred estimation strategy, we now turn to the estimated treatment effects displayed in the bottom rows of Table 2. While the available evidence is consistent with our argument that comparing subjects in Column 1 to Column 2 will provide a more conservative estimate of the treatment effect and better satisfies the requisite assumptions of our probability weighting methods, we nevertheless report results employing the full sample for comparison. In Table 2, the second and third set of rows correspond to the inverse probability weighted results. Column 1 refers to the entire sample, while Column 2 refers to the whole conservative sample and Column 3 refers to the trimmed conservative sample. All 12 estimates suggest that completing the DRC reduces recidivism. The trimmed conservative sample produces a slightly larger treatment effect for arrests, but the same treatment effect for convictions. With respects to arrests, the ATEs suggests a 12.1 (IPWRA, full) to 12.8 (AIPW, trimmed) point reduction in the probability of recidivism. With respect to convictions, the ATEs suggest a 10.7 to 10.8 point reduction in recidivism. Consistent with the logistic regression analysis and the overlap assessment discussed above, the ATEs employing the full sample are much larger in implying a 27.8/27.9 point reduction in rearrest and a 21.2 point reduction in conviction.
Tables A1–A4 in the online Supplemental Report report a number of robustness checks. First, we consider an alternative test of the null hypothesis by adding the subset of people on probation from Column 3 of Table 1 who started but did not complete a DRC module to the sample. Second, we control for length of supervision. Third, we assess the impact of missing data on zip code. Finally, we re-estimate our models after excluding height and weight. The results were substantively identical to those here and further buttress our conclusion.
Study 2: Qualitative Data and Analysis
Method
In our effort to holistically evaluate DRCs’ efficacy, there was a team of academic researchers who carried out a qualitative complementary study, which consisted of semi-structured interviews with DRC clients. It was conducted between June 2020 and September 2021, after receiving project approval from our university’s institutional review board. Two researchers (a faculty member and a graduate student) were involved in the data collection process: white women with qualitative research training and experience. In line with a recommended sample size and with intent to achieve thematic saturation, our sample size was at least 10 participants per DRC (30 total) (see Creswell, 2007). We exceeded that number and completed interviews with 39 DRC clients: 11 at Riverside, 15 at Temecula, and 13 at Indio.
Due to DRC restrictions related to the COVID-19 pandemic, we initially interviewed clients solely by phone across the sites (Riverside n = 6; Temecula n = 7; Indio n = 2). For this recruitment method, DRC staff advertised our study and provided our contact information for individuals to independently arrange a phone interview. To boost our low sample size, we then visited DRCs to recruit more participants once restrictions were lifted, which resulted in an additional 5 interviews at Riverside, 8 at Temecula, and 11 at Indio. While at DRC sites, we approached clients during multiple day visits to ask if they would participate in our study. For both recruitment strategies, participation in the study was confidential: we did not reveal to the DRC staff which individuals followed up or were interviewed. Interviews were voluntary and no compensation was provided due to restrictions set by the Probation Department. We further preserved participant anonymity by not including identifying information in this article.
The racial/ethnic breakdown across the sample was as follows: 56% identified as Hispanic/Latino/a, 28% as white (non-Hispanic), 8% as mixed race, 5% as Black, and 3% as Native American. The sample was overwhelmingly male (87%) while the remainder identified as female (13%). The race/ethnicity and gender distribution of the qualitative sample roughly approximates that of the quantitative treatment group. For example, 87% of this sample is male whereas 92% of the treatment group is male. Following suit, the racial/ethnic identification across both samples is quite similar as well. Approximately 56% of the qualitative sample identify as Hispanic and 28% as white (non-Hispanic), whereas about 50% and 30% of the treatment group identify as Hispanic/Latino/a and white (non-Hispanic), respectively.
Each interview lasted between 30 minutes and 1 hour, and was conducted via personal phones off site or in person within a private room at the DRC facility. All interviews were recorded, and participants only gave verbal consent to further protect confidentiality. Our interview questions were clustered according to the following themes: demographic information, overall assessments and evaluations of the DRC, its services, strengths and weaknesses of the program; interactions and support from DRC staff, and re-entry transitions, experiences, and outcomes. The relevant research and theories that examine re-entry programs and recidivism frequently cover these topics; thus, they shaped what questions were included to assess the efficacy of DRCs.
Once completed, all interviews were transcribed, uploaded to Dedoose analytic software, and subsequently coded over multiple rounds by different researchers. The same faculty member and a different graduate student researcher (Chicano man, also with training in and experience conducting qualitative research) applied thematic coding to each interview transcript, a well-known methodological procedure that helps identify, analyze and report data patterns (Braun & Clarke, 2006), which allows flexibility for both deductive and inductive approaches.
Coding was completed across multiple rounds. The first step was assigning broad open codes to the interview data that largely mirrored the main topics of foci in the questionnaire (e.g., evaluations of the DRC, re-entry outcomes, staff), thus making them more deductive as they were originally derived from established research and theories. In the second round, we applied focused codes to all interview data, which emerged inductively. For example, when re-reading the data demarcated by the “DRC staff” code, the following theme of “social support” emerged and became a new code, which was then further broken down into specific subcodes and accordingly applied to the data (e.g., “PO support,” “Instructor support,” “Peer Mentor support”). As a result, many data excerpts were often double or triple coded.
To ensure coding consistency across researchers, we met to code the first transcript together, creating codes and code descriptors (what each code captures) in consultation. Then, each person coded the next interview transcript independently, met to review the codes applied and discuss any discrepancies to foster agreement, and refined code descriptions and/or coded excerpts as applicable. In this fashion, the researchers proceeded to fully code all interviews in sets of 3 to 4, exchange them for review to bolster code consistency, and implement any coding modifications to both past and future transcripts. After coding concluded and themes were finalized, the faculty member researcher reviewed all data excerpts again by code to ensure consistency and appropriate fit, recoding them whenever necessary according to code descriptors. This iterative review process of each interview and its codes helped unify codes across researchers and foster code consistency.
To assess success, we produced several indicators of perceived program “success” among clients, and descriptively compared them across clients who cited secondary staff versus POs as their greatest source of support. These indicators emerged inductively from the sample and included self-evaluations of overall success in the program, open-ended responses to a follow-up question asking for examples of that success, and length of time in the DRC (a proxy to gauge recidivism). For the first indicator, we asked clients “So far, how successful has your re-entry into the community been?” We then coded their responses into very successful, successful, unsuccessful or very unsuccessful and collapsed the first two categories into “successful” and the latter two into “unsuccessful.” The second indicator consisted of open-ended responses to a follow-up question where we asked clients to provide concrete examples of their success. The answers consisted of the following: sobriety, school enrollment/GED obtainment, housing, car, job, reconnected with family, and improved mental health (self-esteem, happier). For each respondent, we counted the number of concrete examples. Finally, we considered the length of time in the DRC, which serves as a proxy for recidivism because clients who are re-arrested or incarcerated can no longer attend the DRC.
This data coding and analytical strategy was fruitful at revealing potential mechanisms that facilitated re-entry success, such as social support. Participants are hereafter designated by the abbreviation “Ptc.” and a number assigned to them.
DRC Context: Supervision and Staff
Riverside County DRC staff consist of primary staff (POs) and secondary staff (peer mentors and class instructors). They had routine interactions with clients and their jobs were situated on site. DRC POs differ from the traditional supervisory POs assigned to each client in that the former may teach classes, offer their services, support and advice to clients, and have frequent interactions with them but are not formally assigned to supervise individuals on probation. The client’s assigned PO is in a different building altogether and people on probation have check-in meetings with them but rarely meet them at the DRC. Of all the DRC staff members, DRC POs are most similar to traditional POs given their official title and training, and are the most likely to communicate assessments of clients to their supervising off site PO.
The secondary staff are comprised of class instructors and peer mentors. Both have significant interactions with clients, an expectation associated with these positions. Instructors have some training and teach a wide variety of courses at the DRC but also offer guidance and mentoring. Peer mentors may also teach classes but spend considerable time checking in with clients and assisting them in various ways, such as helping connect them to other social services, providing rides to appointments, offering guidance, and more. Peer mentors share the same background as clients given they are system-impacted while instructor may or may not have this history.
Social Support: A Mechanism That Facilitates Successful Re-entry
Drawing off the research on how social support impacts recidivism and re-entry outcomes, we investigate how adults on probation within DRCs perceive social support in these settings. Our findings not only suggest it plays an integral role in successful re-entry for DRC clients but that the source of support is crucial.
We begin our assessment by presenting client responses to this open-ended interview question, “What are the biggest strengths of the DRC?” The answers were as follows: social support (n = 32), classes (n = 1), social support and classes (n = 1), lunches (n = 1), provides accountability (n = 1), employment skills (n = 1), and didn’t know (n = 2). Although answers could have focused on the utility of services or classes, the results show an overwhelming majority of the sample mentioned social support as the biggest strength of the DRC, which underscores how valued it is among clients.
To better gauge the extent to which people on probation experienced social support at DRCs, we then presented the following closed-ended statements and asked them to indicate how much they agreed or disagreed with them: (a) I have at least one DRC staff member I can talk to if I have a problem, (b) I receive comforting and caring communication from DRC staff, and (c) I receive advice and guidance from DRC staff. Clients could answer strongly agree, agree, disagree, strongly disagree, or not applicable.
The first statement attempted to gauge whether clients had at least one DRC staff person they felt comfortable discussing personal problems with, which constitutes a form of expressive support. All respondents either strongly agreed (57%) or agreed (44%) with this statement. The second statement also focused on expressive support and whether they experienced this during communication with staff. Most answered affirmatively (56% strongly agreed, 37% agreed), while only 6% strongly disagreed or stated it was not applicable. For the last statement, we wanted to understand whether clients perceived that DRC staff provided instrumental support to them by offering advice and guidance. We find a vast majority either strongly agreed (57%) or agreed (44%) with this statement.
Aligning with past research, these responses strongly suggest most participants experienced at least some support from DRC staff. Most studies that assess support among those on probation almost exclusively focus on their relationships with supervisory agents (POs), but they rarely examine alternative actors in re-entry contexts that could fulfill this role. The above statements we posed to clients used the generic term “DRC staff,” offering no greater specificity about the source of support. Based upon these findings, one may assume all staff were equally supportive to those on probation within DRCs. However, to further flesh this out, we posed open-ended questions to clients about the extent to which they differentially experienced and relied upon support from various actors within the DRC. These responses yield important findings that underscore that while support matters, those within DRCs differentiate the source of support and rely much more so on some individuals compared to others for it.
Differential Social Support From DRC Staff
DRC staff who could potentially serve as sources of social support for clients included POs, peer mentors, and course instructors. We asked questions about each of these groups and whether DRC clients received support from them. Of the 31 clients who answered this question, 68% mentioned peer mentors, 23% identified instructors, and 26% cited DRC POs. These numbers exceed 100 since they could select more than one group. Overall, 81% of the sample perceived secondary staff—peer mentors and instructors—as sources of support for them. In contrast, 26% received this support from DRC POs.
The researchers then pressed clients to identify “the greatest source of support” for them in this setting. Of the twenty people who responded to this question, 55% stated peer mentors, 30% selected instructors, and 20% DRC POs. One client selected two people in their response, thus the percentages exceed 100. A vast majority (85%) identified secondary staff (those who are not POs) as the biggest source of support for them. We next explore why clients perceive these groups so differently in terms of social support, which influences whom they turn to for it.
Peer Mentors and Instructors
Clients often viewed peer mentors and instructors as more relatable, and particularly when they had a shared criminal history. Due to this, most DRC clients felt more comfortable during interactions with secondary staff, which enabled rapport and trust to quickly develop. One man in a DRC recounted his assessment of the peer mentor when he first arrived after being asked about the biggest strength of the DRC: Having somebody here—a peer mentor. When I walked in here as a client, the first person who met me out in the lobby was the peer. This guy walked out and he had tattoos everywhere and I could tell he had been in prison. Me being from that culture, that background, right away I had a different perspective of the DRC. Because it’s not just probation, it’s somebody who really understands what I’m going through. I just got out of jail, you know? I got butterflies in my stomach—I don’t know what’s going to happen—and somebody greets me with the same background as me. (Ptc. 29)
A different man likewise punctuated the importance of relatability, which engendered an openness and willingness to go to peer mentors for support: They were all great. I loved talking to them more than to the regular staff [POs]. They would go out of their way to help you . . . stop with what they’re doing and would give you time. They would say we have been where you have been. So, it feels more like a connection with somebody who has experienced something similar. (Ptc. 17)
Since clients were better able to identify with previously system-involved staff, they were less guarded in their interactions and engaged in more meaningful conversations with them. Some clearly viewed them as role models, individuals they were willing to learn from and even emulate. When asked to describe why he found peer mentors so supportive, one client emphasized this relatability inspired him: “Just his words . . . if he could do it, I can do it. He’s been on probation and all that so I know where he’s coming from. I could relate” (Ptc. 25). Another man reported how coming from a similar background as his peer mentor was pivotal to his goals: “He had done a lot of the same things I did, drugs and going to prison. That’s what helped me understand if he can do it—he’s been clean for 8 years—I can do it as well” (Ptc. 20).
As evident in these quotes, DRC clients derived expressive support from secondary staff in the form of care and concern about their well-being. Moreover, peer mentors (and certain instructors) provided other forms of instrumental support for clients. One man recounted his gratitude for his peer mentor, who encouraged him to enter a residential drug addiction program where he eventually attained sobriety: This peer mentor, he’s the one that pushed it. He called, “You got to be there. Please. You got to do it.” He took it under his wing, to make sure that I get in that car and go there. (Ptc. 36)
Peer mentors routinely promoted recovery for those who struggled with addiction by not only facilitating entry into treatment facilities when appropriate but also by prodding them to develop broader networks of support for long term sobriety. A client explained the peer mentor connected him to a local recovery center, which offers all types of services, including recreational and social activities, educational sessions, and individual treatment plans. He cited this as especially supportive: “He got me into the Renew Club [pseudonym], where I now take boxing” (Ptc. 31).
Another individual listed the instrumental support he received from the peer mentor—rides to the program—which he attributed for his regular DRC attendance: “He’s always saying, you want me to go pick you up? They support me. So how can I miss?” (Ptc. 36). A different man lavished praise on his peer mentor and instructor not only for emotional support but for helping him get enrolled in college and receive social services when he was unemployed: “Both referred me to a lot of colleges to help me further my education. The instructor even helped me when I didn’t have a job. He was trying to help me get unemployment and stuff like that” (Ptc. 34). A majority of adults enrolled in DRCs perceive that secondary staff—specifically system-involved peer mentors and instructors—enact care and are the greatest sources of support within this context.
DRC Probation Officers
While a handful of clients describe DRC POs as supportive, most experienced them as agents who enacted surveillance and control, and less relatable overall. DRC POs—especially compared to secondary staff—possessed higher status positions and were the most likely candidates to discuss clients’ progress with their outside supervising POs. Many clients viewed them with suspicion due to their general distrust of the criminal justice system and past experiences within it (see Phelps & Ruhland, 2022). Prominent in these critiques, participants often juxtaposed their perceptions of justice-involved secondary staff with DRC POs, emphasizing greater openness toward the former and skepticism about the latter. One man expressed his apprehension toward DRC POs due to his system-involved background: I actually connected with DRC PO first and then I connected with my peer mentor. But I had to get past the probation part because I’ve been incarcerated most my life and I was not too used to being around law enforcement people. That was another thing that I had a challenge with, being able to talk to a probation officer. (Ptc. 20)
Another client stated his aversion to POs while praising the peer mentor, indicating his receptiveness to each was rooted in their relatability: If a PO came out with a badge, we get resistant. We back away, put up a wall. When it’s somebody you can relate to, like a peer mentor, there’s no wall. It just changes your mindset, makes you more receptive to what they have here. (Ptc. 29)
A different client echoed these perceptions: “Some [staff] got the probation mentality and that’s not really helpful because it’s not probation, it’s classes. I think that’s the downfall . . . We are all convicts and don’t like to talk to cops, and POs are still cops” (Ptc. 17). Most adults on probation in this sample equate DRC POs as enforcers of surveillance, another agent of control within a larger carceral context (Skeem & Manchak, 2008). Given this sentiment, it is clear why fewer clients characterized POs as supportive or were even open to receive it from them.
Client Indicators of Re-entry Success
Thus far, we have shown that DRC clients view secondary staff as more supportive than DRC POs. To the extent that this characteristic is unique among DRCs, this would produce higher levels of social support overall and could thereby potentially explain the treatment effect we observe in the previous section. While we cannot explicitly link experiences of social support to recidivism outcomes analogously to the above quantitative analysis, we do compare three indicators of re-entry success across clients according to appraisals of staff supportiveness (secondary staff versus POs).
If social support is an important mechanism and secondary staff offer greater levels of it, we should expect to observe that clients in the former category describe more successful reentries. Our findings (online Table A5) reveal substantial differences across the two groups. Self-reports of overall success among clients were 53% (secondary staff) compared to 33% (POs). The average number of success categories per individual varied by group as well: 2.6 responses (secondary staff) versus 1 response (POs). For time enrolled in DRCs, the median duration was 10 months (secondary staff) and 6.4 months (POs), respectively. This latter finding may be particularly instructive because it implies a longer exposure to and thus potentially greater uptake of DRC programming. Together, these indicators suggest that social support among secondary staff was important for re-entry success outcomes among our DRC clients.
General Discussion
Within California, DRC re-entry programs are quite prolific given they are in at least half of the state’s counties, operated by either the California Department of Corrections and Rehabilitation or by county-level probation departments. Past research provides mixed conclusions about DRC efficacy and offers little understanding about what might differentiate successful from unsuccessful DRCs—the mechanisms that affect these outcomes (Huebner, 2013). Using a mixed-methods analysis to examine Riverside County DRCs, our pair of studies identifies both a treatment effect and a plausible mechanism for it.
Our quantitative analysis combines sensible logistic regression and doubly-robust inverse probability weighting with a control group that yields two distinct advantages. First, those who opt out of a DRC because they are employed or enrolled in alternative programming are in some sense receiving a similar set of services as those in the DRC: employed individuals are at least gaining on-the-job experience, while those in alternative programming are likely to receive both jobs training and other kinds of therapeutic interventions that parallel those offered by DRCs. Therefore, differences in recidivism between these groups can only be explained by (a) superior programming in the DRC, (b) the greater degree of social support in the DRC, or (c) other between group variance in unobservables like differences in the quality of program implementation (beyond social support) or average individual level characteristics. However, the programming offered by our DRCs appears standard vis-à-vis the broader literature on DRCs and criminogenic needs (e.g., Wong et al., 2019), and our preferred control group from Column 2 of Table 1 minimizes the influence of unobservable factors that are likely correlated with both selection into treatment and recidivism. Even our most conservative analysis suggests that DRC participation decreases recidivism by about 10.8 (conviction) to 12.8 (arrest) percentage points over 2 years.
In our qualitative analysis, high levels of social support from DRC staff emerged inductively as important determinants of clients’ perceived successful reintegration. Scholars contend that social support from POs contributes to lower recidivism among those they supervise (Cobbina, 2010; Kennealy et al., 2012), yet these studies rarely examine the experiences of individuals immersed in re-entry programs (Bender et al., 2016). The interview data underscore that social support may be key to DRC clients’ perceived successful (prosocial) transition back into the community. This phenomenon appears to cultivate greater psychological and behavioral “buy-in” to DRC programming and should thereby contribute to lower recidivism. However, differential staff support on effectiveness could be better determined through further quantitative research.
In particular, the qualitative data suggest that system-impacted peer mentors and instructors are key to the high levels of social support experienced by clients. These staff members offer varied kinds of support (instrumental and expressive) while simultaneously serving as mentors and role models. Along the care-control continuum (Skeem et al., 2007), most adults in our qualitative sample perceive that secondary staff enact “care” while DRC POs exhibit “control.” To that end, clients view those with higher status and authority—POs—as the least supportive largely because they associate them with the carceral system. Conversely, secondary staff have less status within DRCs yet clients are more receptive to their guidance and support given their shared backgrounds of system involvement. We conclude that the presence of justice-involved staff is largely responsible for the high level of social support experienced by DRC clients. If this is further substantiated in future studies, it is likely beneficial for DRCs to recruit more system-impacted staff members to boost clients’ receptivity to the services and resources offered, which can ultimately impact their overall well-being.
One clear implication of this research is that the efficacy of community-based supervision programs may vary by the quality of program implementation, of which social support could be a factor. Such a finding would not be terribly surprising, as “implementation fidelity” has been shown to matter across a range of different types of intervention settings (Breitenstein et al., 2010). Moreover, there are a host of factors that impact the quality of implementation which vary from characteristics of individual providers and clients to organizational and other contextual factors (Durlak & DuPre, 2008). Our argument is that when community-based supervision organizations cultivate a context in which clients feel supported, clients are more likely to be receptive to the services and programming offered and thereby have greater re-entry success. Put simply, we assert that social support should matter for the implementation quality of community-based supervision.
One limitation of our study is that we are unable to explicitly link social support to lower rates of recidivism via the quantitative analysis. That is, all the qualitative observations we made occurred after the period of observation covered by the quantitative analysis. We have no way of knowing the degree to which our qualitative sample is representative of our quantitative sample. It is impossible to link our qualitative cases to official recidivism data moving forward because of reasonable confidentiality requirements vis-à-vis arrest and conviction statistics at the individual level. Thus, it is certainly premature to make strong causal claims about the role of social support as it is entirely possible that our qualitative participants were an unusual subset of DRC completers and are more likely to commit crime. While our robust treatment effect and commentary from DRC clients improves the plausibility of our argument that social support increases the efficacy of these DRCs, we cannot draw this conclusion definitively.
Moving forward, then, we call for more explicit attempts in the DRC evaluation literature to combine experimental or quasi-experimental analyses with in-depth qualitative studies that investigate not only the range of services and programming offered but also how it implemented, who provides it, and how clients (and staff) gauge its effectiveness. Such studies should consider social support explicitly but may also uncover additional DRC characteristics that emerge inductively. As these types of studies accumulate in the literature, it would be easier to engage in more in-depth comparative analyses of such programs. While such comparative analyses are less advantageous for identifying causal effects than experiments, it is frequently difficult to convince administrative bodies to randomly assign individuals to programming that they believe is beneficial. It is even more difficult to convince them to design multiple programs that vary in ways that are likely correlated with efficacy. As a result, the kinds of comparative analyses across programs with varying structures and services envisioned here may be the only feasible way to shed light on the ways in which DRCs could be improved to better cultivate successful reintegration for the formerly incarcerated.
Supplemental Material
sj-docx-1-cjb-10.1177_00938548231187414 – Supplemental material for Day Reporting Centers and Recidivism: The Role of Social Support
Supplemental material, sj-docx-1-cjb-10.1177_00938548231187414 for Day Reporting Centers and Recidivism: The Role of Social Support by Sharon S. Oselin, Matthew C. Mahutga and Humberto Flores in Criminal Justice and Behavior
Footnotes
AUTHORS’ NOTE:
This evaluation was funded by the Riverside County Probation Department.
Supplemental Material
References
Supplementary Material
Please find the following supplemental material available below.
For Open Access articles published under a Creative Commons License, all supplemental material carries the same license as the article it is associated with.
For non-Open Access articles published, all supplemental material carries a non-exclusive license, and permission requests for re-use of supplemental material or any part of supplemental material shall be sent directly to the copyright owner as specified in the copyright notice associated with the article.