
Abstract
Most identity theft victims experience no personal monetary loss or other financial problems; rational choice theory suggests that this could lead people to not change their behavior, increasing their future risk of victimization. Consequently, the current study will investigate if and how the severity and incidence of identity theft affect individuals’ protective behavior using the 2016 Identity Theft Supplement (ITS) victimization survey. It uses ordinary least squares (OLS) regression to predict the number of protective measures practiced and multinomial logistic regression to predict self-reported motivation for use of protective measures. The results indicate that victims use more protective measures than nonvictims and that victimization has a greater impact if it occurs repeatedly and/or the victims personally lost money or experienced other financial problems. However, there is evidence of a threshold effect. The multinomial results indicate victims who lost money or experienced other financial problems are more likely to say they practice protective measures because of their victimization.
If one where to ask a random person what crime they were most concerned about, there is a reasonable chance they would answer “identity theft.” It is one of the fastest growing crimes of the 21st century with millions of people becoming victims every year (Copes et al., 2010; Holt & Turner, 2012). Furthermore, law enforcement is largely unable to prevent these crimes, leaving the onus on individuals to protect themselves (Albrecht et al., 2011; Gilbert & Archer, 2012; Reyns, 2013). Yet despite widespread concerns regarding identity theft, there are many who do very little or even nothing to protect themselves from it (Harrell & Langton, 2019; Roberts et al., 2013).
Although there is relatively little research on individual differences in use of identity theft protective measures, the rational choice perspective may provide a framework for these decisions. It suggests that people make choices based on the costs and benefits of perceived options. They choose the option that they perceive to have the greatest net utility compared with available alternatives (Hechter & Kanazawa, 1997; Hudik, 2019; Loughran et al., 2016; Matsueda et al., 2006). This calculus should apply to everyone in all contexts, including when it comes to decisions about protective behaviors. They weigh the perceived risks and costs of being victimized against the perceived benefits and costs of using protective measures. People base these perceptions on information from multiple sources, including personal experiences of victimization (Anwar & Loughran, 2011; Averdijk, 2011; Cook, 1986; Loughran et al., 2016; Wilcox & Land, 1996). Under the umbrella of the rational choice perspective, the process of Bayesian Updating suggests that individuals form subjective estimations or prior beliefs of their risk of identity theft victimization which change if they experience victimization, creating updated posterior beliefs (Anwar & Loughran, 2011). However, even when prior estimations or beliefs are updated, individuals may decide that it is not worth it to increase their use of identity theft protective measures.
Once insurance and/or other forms of reimbursement are considered, most people who experience identity theft pay nothing out of pocket, while institutions such as creditors take the losses (Harrell & Langton, 2019; Roberts et al., 2013). In addition, several identity theft protective measures (credit monitoring and security software) can cost hundreds of dollars. Even free ones such as checking credit reports or changing passwords require users to regularly devote time and effort to perform them. As a result, individuals may decide it is better to risk a potentially harmful event rather than use protective measures. This can be dangerous as past identity theft victimization can increase the likelihood of being victimized again (Burnes et al., 2020), causing even more harm to individuals and creditors. To avoid that, it is necessary to encourage the use of protective measures among the public; to be successful, it is necessary to understand what factors are considered when making decisions about the use of identity theft protective measures. The present study aims to further that understanding by analyzing whether and how the incidence and severity of identity theft victimization affect use of protective measures. More specifically, it focuses on whether respondents practice more protective measures if they have been victimized more than once, have lost money, and/or have experienced other financial problems because of their victimization. Furthermore, a secondary goal of this study is to attain a firmer grasp on the effects of demographic characteristics on use of protective measures. Previous research on identity theft protective measures has generated disparate findings on whether certain groups are more or less likely to use protective measures. As a result, the present study will utilize a large, nationally representative sample to aid in the identification of which groups, if any, may be less likely to utilize protective measures, leaving them more vulnerable to identity theft victimization.
Literature Review
Identity Theft
Despite its current pervasiveness, identity theft as it is understood today is a relatively recent phenomenon. Identity theft was not legally recognized as a distinct type of crime within the United States until the late 1990s (Allison et al., 2005; Newman & McNally, 2005). Before then, it was treated as various types of fraud by law enforcement. As such, there is less research on identity theft compared with other crimes although what there is suggests that it is a multifaceted offense. There are actually two different illegal actions that can be classified as identity theft: illegally obtaining someone’s personal information and using another’s personal information for illicit purposes (Gilbert & Archer, 2012; Seda, 2014).
Although identity theft is generally associated with the internet and information technology, there are many ways people commit it (Pratt et al., 2010; Roberts et al., 2013; Ylang, 2020). Scholars frequently divide people who commit identity theft and their methods into two broad categories based on how they acquire personal information: low-tech and high-tech (Allison et al., 2005; Holt & Turner, 2012). People who commit low-tech identity theft primarily obtain personal information through physical means. Common tactics include sifting through trash for intact documents or stealing a target’s mail. People who commit low-tech identity theft represent the majority of identity thieves or at least those who steal the information before selling it (Allison et al., 2005; Copes & Vieraitis, 2009; Roberts et al., 2013). On the other hand, people who commit high-tech identity theft rely on computers and other information technology. They employ tactics such as phishing, pretext calling, and hacking (Allison et al., 2005; Lai et al., 2012; Reyns, 2013).
Demographic Characteristics and Identity Theft Protective Measures
The overwhelming majority of the U.S. population practices some form of identity theft protection (Harrell & Langton, 2019). Yet there are wide disparities in the number of identity theft protective measures practiced, which seem to be partially linked to demographic characteristics. Different authors have utilized disparate measures of identity theft protective behavior, analysis methods, data sources, and sample sizes. Nevertheless, certain variables have been found to have fairly consistent effects. For example, education has been measured in different ways, from the “highest completed degree” (Ylang, 2020; Zou et al., 2020) to a simple dichotomous variable tapping whether respondents graduated from college (Milne et al., 2009). Whatever the measure, studies have generally found that those who rank higher in education use more protective measures than those who rank lower (Milne et al., 2009; Ylang, 2020; Zou et al., 2020). The one study that examines race of respondents concluded that White respondents use more protective measures than non-White respondents (Ylang, 2020).
However, disparate research designs have also likely contributed to divergent results which have left the effects of other variables unclear, including age, gender, and income. Milne et al. (2004) and Zou et al. (2020) observed that male respondents used more identity theft protective measures than female respondents, whereas Lai et al. (2012) and Ylang (2020) found the opposite. Ylang (2020) observed that older individuals were more likely to use identity theft protective measures, whereas Milne et al. (2004) found that older individuals use fewer identity theft protective measures. Meanwhile, other studies observed that age has no discernible effect on the use of identity theft protective measures (Lai et al., 2012; Milne et al., 2009). These contradictory findings regarding age may be the result of large-scale changes in the population between periods of data collection. The use of information technology skyrocketed among older individuals during the late 2000s and 2010s compared with the early 2000s (Elliot et al., 2014), although it remains unclear whether that is actually the reason for the discrepancy. The findings regarding the effect of income have also been inconsistent. Income has been found to have a positive relationship with the use of identity theft protective measures (Ylang, 2020), a negative relationship with them (Zou et al., 2020), or no relationship at all (Lai et al., 2012; Milne et al., 2004, 2009). As a result of these conflicting findings, the differences in identity theft protection across gender, age, and income are still unclear. More research is necessary to establish the precise effects of these variables. There is also some ambiguity surrounding the effect of the experience of identity theft victimization on an individual’s use of protective measures against it. This issue is the subject of the section to follow.
Victimization and Use of Protective Measures
Individuals are not powerless to prevent crime. They can engage in target hardening where they utilize various techniques to reduce their risk of victimization. The extent to which they engage in target hardening, particularly when it comes to their personal information, seems to be linked to perceived threat (Ireland, 2021). People who have been victimized are generally more concerned about crime and are more likely to engage in target hardening than those who have never been victimized (Averdijk, 2011; Cook, 1986; Liska et al., 1988; Turanovic et al., 2018; Wilcox et al., 2007; Wilcox & Land, 1996). However, most previous studies focus on how type of victimization, such as property or violent victimization, influences protective and risk-avoidance behavior. There do not appear to be any studies which explore financial losses or other consequences linked to the seriousness of the victimization. This matters because some evidence suggests that changes in perceptions and concern about victimization are crime-specific. Individuals will be more cognizant and cautious of the type of crime they experienced but not crime in general (Wilcox et al., 2007). So, only identity theft victimization may influence the use of identity theft protective measures. However, there are very few studies that examine the effect of identity theft victimization on identity theft protective measures. I have only managed to locate three peer-reviewed studies and one conference paper in that vein.
The studies that compare people who were and were not identity theft victims observe that victimization seems to have a positive effect on protective measures. Gilbert and Archer (2012) utilized principal factor analysis to see how misuse of personal information influenced protective and risk-inducing behavior. They found that people who were victimized used more protective measures and were more concerned about it than people who were not. Meanwhile, Ylang (2020) examined the influence of major demographic characteristics and past victimization. It was the first study to do so using a larger, nationally representative database in the form of the 2014 Identity Theft Supplement (ITS). It found that individuals who experienced fraud related to new or existing credit card or bank accounts were much more likely to say they practiced at least one identity theft protective measure rather than do nothing. Finally, Zou et al. (2020) asked online survey respondents whether and why they ever adopted, partially adopted, and/or abandoned certain online security, online privacy, and/or identity theft protective measures. People who were previously victimized were more likely to use all three kinds of protective measures. In fact, respondents typically adopted identity theft protective measures after they received some kind of warning about the threat of identity theft such as a data breach, a lost credit card, or anomalous activity appearing on a bank/credit statement.
However, not all identity thefts may have the same impact. Gilbert and Archer (2012) noticed that the strength of identity theft’s effect on protective measures seemed to vary by type; people who experienced credit card fraud had lower levels of concern and used fewer protective measures than those who experienced other kinds. This could be because the severity of an identity theft victimization may affect calculations regarding the costs and benefits of protective measures. Although people who experience identity theft might suffer serious physical and emotional distress (Golladay & Holtfreter, 2017; Siciliano et al., 2016), such health effects are often reactions to the financial severity of an identity theft incident (Li et al., 2019). Thus, for the purposes of this study, the severity of identity theft victimization is defined as how much money individuals lost because of identity theft and whether they experienced events that could damage their financial well-being such as loss of employment, loss of residence, and credit being ruined.
There is some evidence that individuals make decisions about protective measures based on victimization severity as Zou et al. (2020) observed that respondents were less likely to adopt identity theft protective measures compared with online security or online privacy protective measures. This could be because identity theft protective measures often required subscribing to a service and continual communication with the service, which many respondents found undesirable. Sufficiently severe identity theft victimization could cause individuals to adopt identity theft protective measures, but there is presently not much evidence. Despite calls to investigate the perceived prevalence and/or severity of identity theft victimization on protective behavior, only one study seems to have done so.
Li et al. (2019) used structural equation modeling to test the indirect effects of identity theft severity. They suggested that amount of money lost, the number of ways information was misused, and the amount of time to resolve the resultant issues should increase perceived identity theft victimization severity. That in turn should influence perceived distress, which will prompt individuals to change their behavior by purchasing identity theft protection services, refraining from online transactions, and/or refraining from online information disclosure. This model was tested using 197 individuals who reported experiencing identity theft through online survey. The researchers found that greater financial losses, time lost, and extent of misuse all contributed to greater perceived victimization severity, which increased perceived distress, which in turn increased the use of protective and risk-avoidance behaviors. Although no direct relationship between aspects of identity theft victimization and behavioral changes was observed, this conclusion serves as indirect evidence that identity theft victimization severity can affect protective measures.
In summary, there are few studies that examine the linkage between identity theft victimization and use of protective measures, but the small body of work supports a positive relationship. Moreover, there are preliminary indications that more severe victimizations result in more protective measures than less severe ones (Li et al., 2019). However, that finding is based on a single previous study to date—a study that utilized a very small, nonrepresentative sample and did not investigate important facets of identity theft victimization severity, such as controlling for those who lost nothing from victimization. That said, other research areas provide some grounds for victimization severity affecting protective behavior; specifically, there is a large literature on financial risk that shows that the desire to avoid major financial losses drives many investment and business decisions (Yang, 2019). However, the findings from this field are not entirely transferable given the wildly different circumstances in which individuals risk their money.
Consequently, we know little about whether there is a difference in protective measures between identity theft victims who suffered (severe) financial losses and those who did not. Furthermore, previous work has yet to explore the role in protection of other financial consequences of identity theft such as credit- or bank-related problems, loss of employment, or eviction. In short, it is critical for researchers to understand the effects of identity theft victimization on protective measures in more detail because if victims of less frequent and less severe identity thefts are indeed less likely to use more protective measures, then they are leaving themselves and others open to further harm (Burnes et al., 2020).
The Current Study
The current study seeks to establish what effect financial loss, other financial consequences, and number of victimizations have on protective measures using rational choice and Bayesian Updating. Rational choice perspectives assume that individuals weigh the perceived risks/costs of being an identity theft victim versus those of adopting identity theft protective measures. Building on this premise, Bayesian Updating suggests that a major component of beliefs about risk is the perceived probability that an event will occur (Anwar & Loughran, 2011; Loughran et al., 2016). Individuals should increase their perceived probability of an event each time they experience it and adjust their behavior accordingly. Therefore, people who experience identity theft should increase their use of protective measures each time they do so, leading to Hypotheses 1:
Another important component of risk beliefs is the perceived severity of an event (Anwar & Loughran, 2011). People will estimate the amount of harm an event may cause and factor that into their efforts to prevent it. The perceived severity of victimization can also be influenced by personal experience. The more money an individual lost or if they experienced other financial consequences, the more severe they will perceive potential future incidents to be. Thus, they may make a greater effort to prevent future victimization, as suggested by Hypothesis 2:
However, there is the possibility that financial loss may not have a linear relationship with protective measures. Neither rational choice perspectives nor Bayesian Updating state an increase in perceived risk is always met with a corresponding change in behavior (Anwar & Loughran, 2011; Loughran et al., 2016). Instead, the effect of loss on protective behavior may operate as a threshold effect. Essentially, if an individual’s perceived severity of identity theft victimization falls below a certain level, then that individual may decide against increasing protective behavior even if they are victimized. However, if the perceived victimization severity meets or surpasses that threshold, then an individual may increase their protective behavior even if the probability of being victimized is low. There appears to be some evidence of this, as both individuals who did and did not experience identity theft seem to prefer protective measures that cost less and are easy to use (Yang, 2019; Zou et al., 2020). This serves as the basis for Hypothesis 3:
The study will also investigate respondents’ self-reported motives for using protective measures. This is to address concerns about spuriousness and simultaneity within the relationship between protective measures and identity theft victimization. After all, individuals will likely practice more protective measures after victimization, but people who use none or very few protective measures are also more likely to be victimized in the first place. This may lead the analyses to underestimate the true impact of victimization. Moreover, as the study will be using cross-sectional data, there is the issue of establishing the time order between use of protective measures and respondent victimization. By directly inquiring respondents about the reasons why they decided to use their protective measures, a stronger argument can be made that victimization caused the increase in use of protective measures. Such inquiry led to Hypothesis 4:
Finally, a secondary goal of this study is to attain a firmer grasp on the effects of demographic characteristics on use of protective measures. It will attempt to replicate the findings of Ylang (2020) which used an earlier version of the data used herein. However, the present study will employ more detailed operationalizations of race and age. Non-White respondents will be separated into individual races to see whether all racial minorities are less likely to use identity theft protective measures than White respondents or only certain ones. I also plan on including both a continuous and square term of the age variable. It is puzzling why age has been observed to have a positive or negative effect. Studies that find a negative effect of age hypothesized that this was due to older individuals being less technologically literate, so they are less aware of the protective measures they should take (Milne et al., 2004, 2009). Meanwhile, studies that reported a positive effect reasoned that older individuals are more cautious, so they use more protective measures (Ylang, 2020). It is possible that both of these rationales are true, and age has a nonlinear effect.
Method
Data
The present study will utilize the 2016 ITS, a subset of the 2016 National Crime Victimization Survey (NCVS). The NCVS is a cross-sectional self-report victimization survey conducted every year on behalf of the Bureau of Justice Statistics. The target population includes all individuals in the United States aged 12 and above excluding those who are homeless, institutionalized, or members of the military. The ITS is conducted every 2 years and it is administered at the end of select NCVS interviews using computer-assisted personal interviewing (CAPI) or computer-assisted telephone interviewing (CATI). However, individuals below age 16 are excluded. I will only use the 2016 ITS because it represents the most recent and publicly available version of the ITS. Moreover, it contains around 125,000 individual respondents that should include thousands of identity theft victims within it based on findings from previous years of the survey. Thus, merging it with previous years should not be necessary.
Sample
Of the 125,000 respondents initially sampled in the NCVS, approximately 29,000 respondents did not answer any of the ITS questions because they could not be interviewed, they refused to be interviewed, they did not speak English and the interviewers could not locate a suitable translator, or the interview was done by a proxy. Therefore, only approximately 96,000 observations will be included in the sample. Of these observations, any that had missing data for any of the variables used in the analyses were excluded using list-wise deletion. Once this was completed, the final sample consisted of approximately 94,000 respondents. List-wise deletion was utilized instead of alternative techniques such as multiple imputation because these would have been ultimately unnecessary. Even with the absence of 29,000 potential respondents, the remaining sample is more than sufficiently large to estimate the potential effects of the selected variables. Moreover, supplementary analyses reveal that respondents who chose not to partake in the ITS do not seem to differ significantly from those who did in terms of demographics. Consequently, there is no reason to suspect that those who did not participate in the 2016 ITS represent a distinct subsample. Finally, once the nonparticipant respondents are taken out of consideration, list-wise deletion removes a relatively small amount of the remaining sample (less than 5%). The sample does not make use of any statistical weights other than those that are already incorporated into the ITS to adjust for nonresponse and sampling bias. The population controls used to calculate these weights can be found on the U.S. Census Bureau website (U.S. Department of Justice et al., 2016).
Measures
Dependent Variables
Number of identity theft protective measures
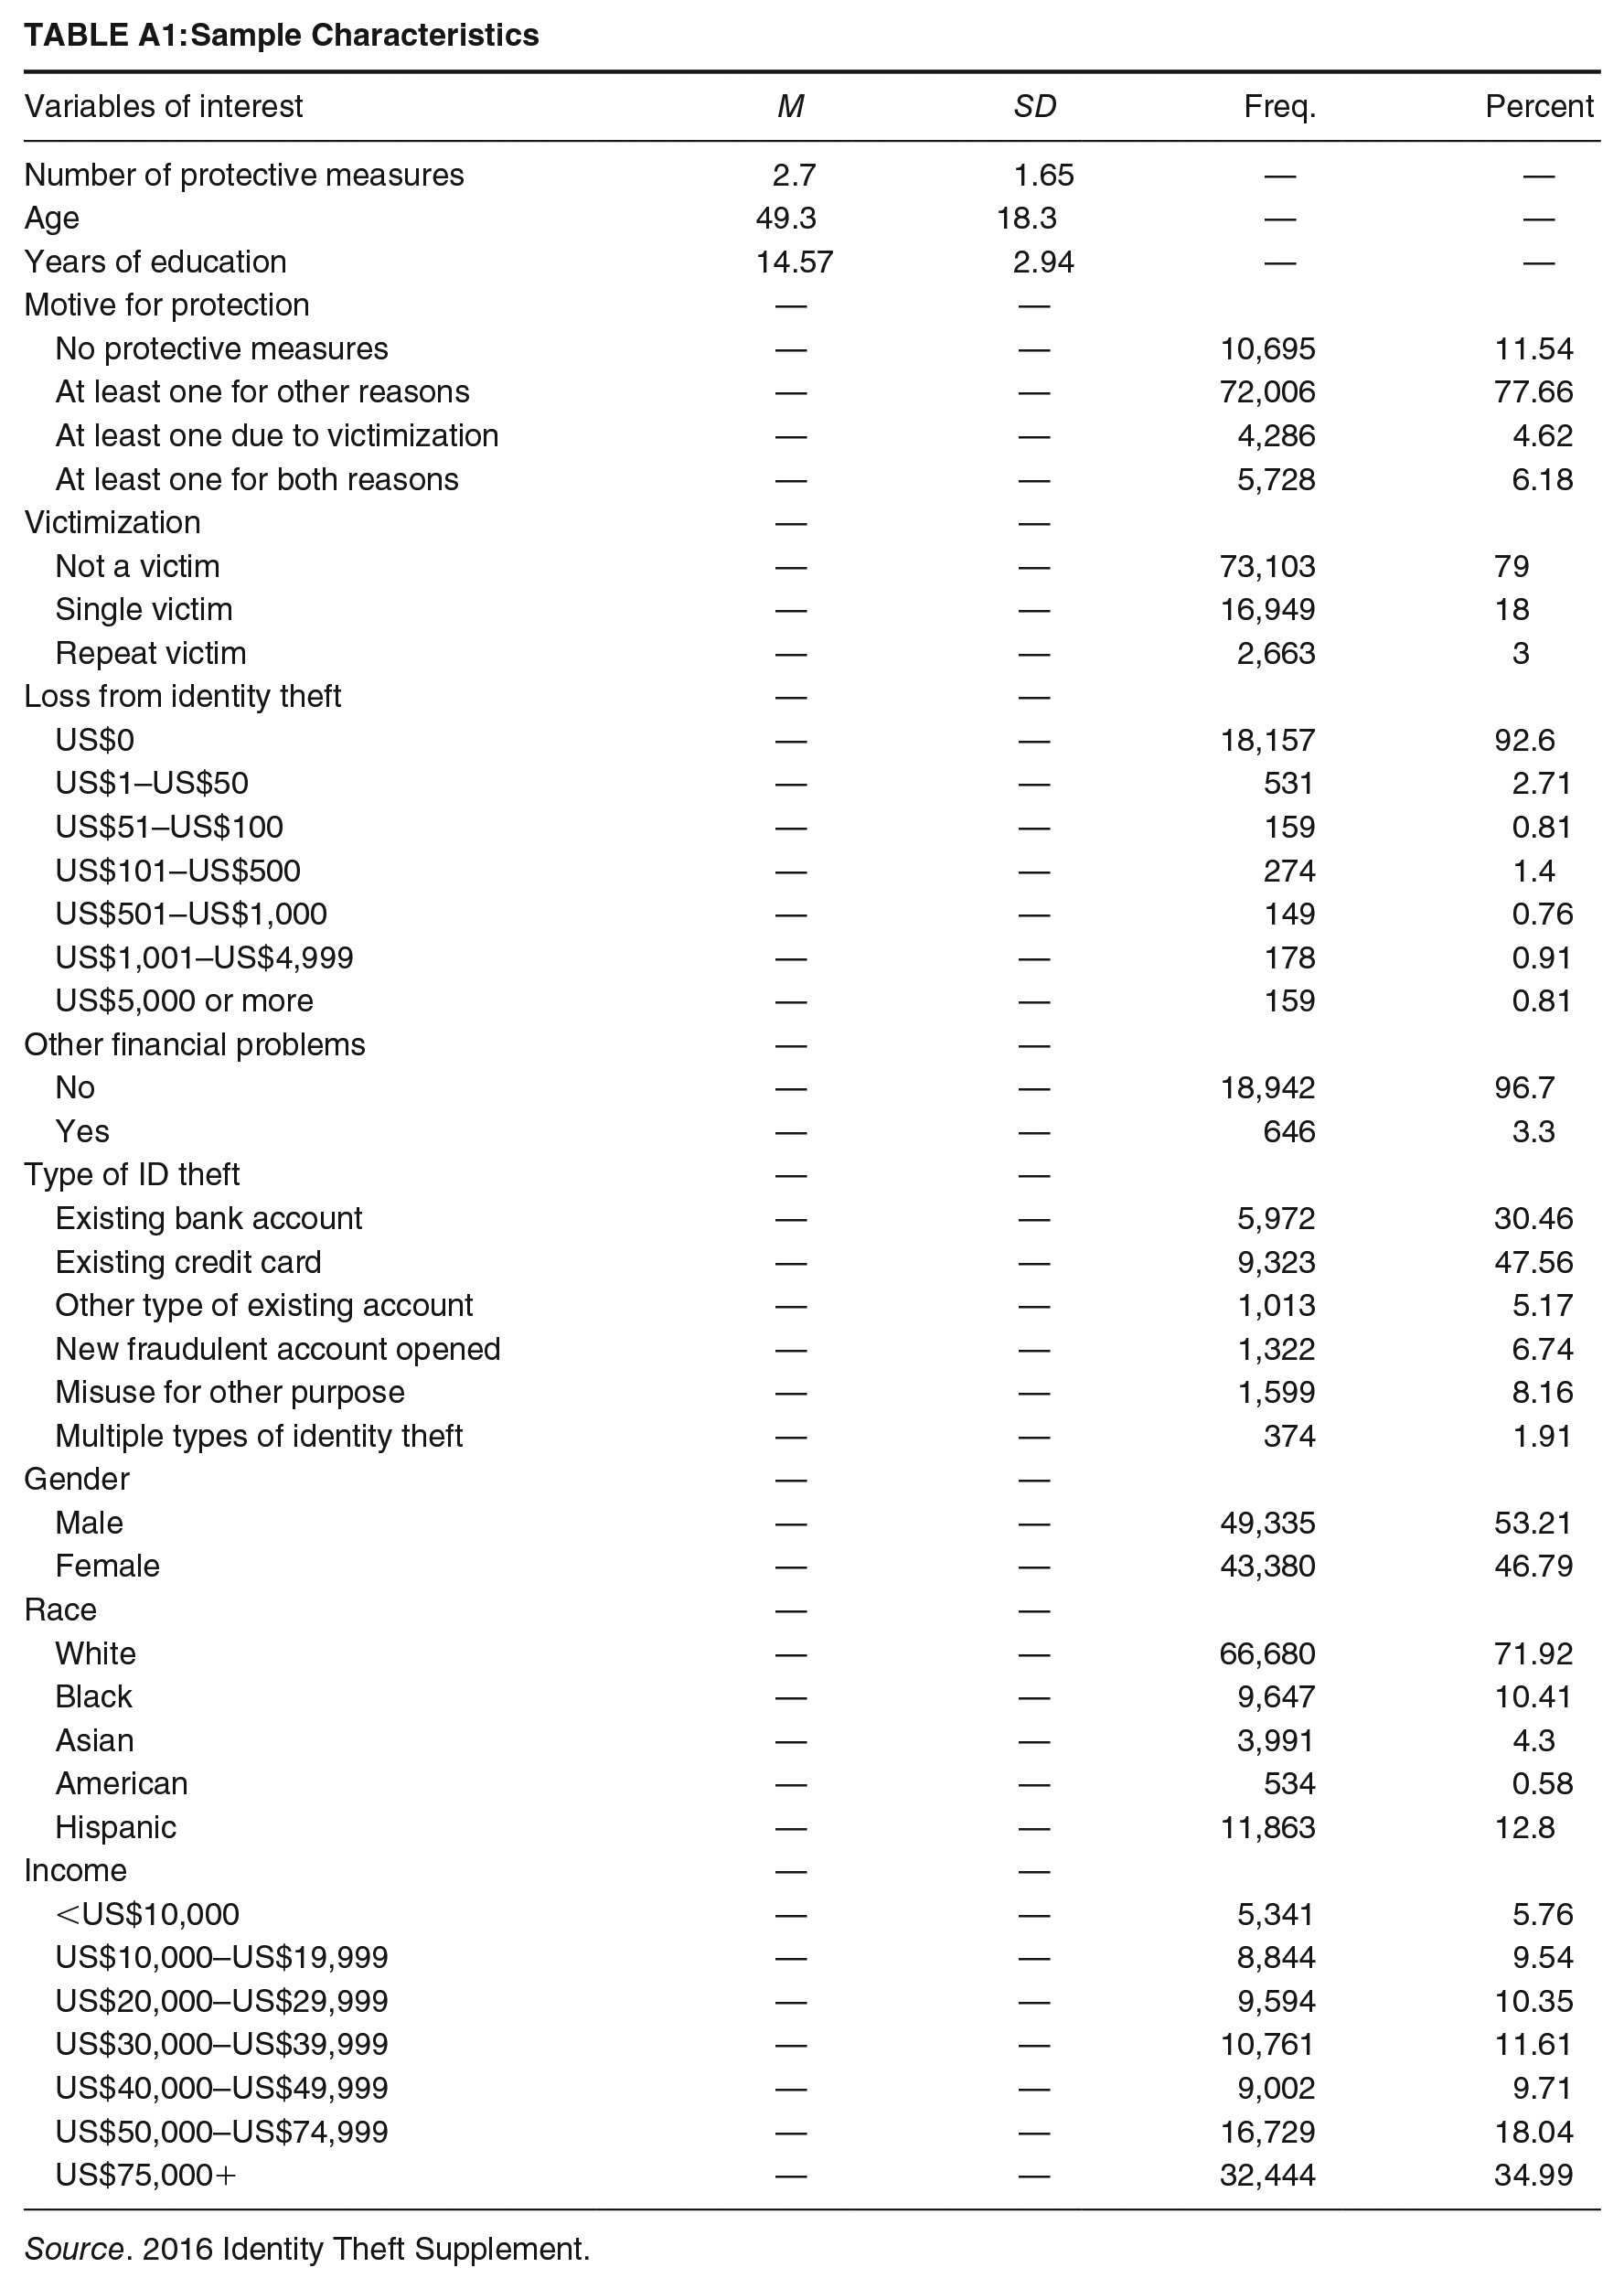
Respondents were asked whether they practiced any of the following behaviors in the past 12 months: checked your credit statement; checked your credit report; shredded sensitive documents; changed passwords on financial accounts; purchased credit monitoring and identity theft insurance; used security software; or bought identity theft protection. Respondents could have answered yes or no to each. Their responses to the seven questions were added together to create a continuous variable ranging from 0 to 7. Descriptive statistics, reported in the appendix, indicate that respondents engaged in an average of 2.7 protective measures.
Motivation for protective behavior
The ITS also asks respondents to self-report their motivation for practicing protective measures. The categories are as follows: practice no protective measures (reference), at least one protective measure due to victimization, at least one protective measure for a reason other than victimization, or at least one for both reasons. The categories are mutually exclusive.
Predictor Variables
Number of identity theft victimizations
The ITS contains two sets of questions regarding identity theft victimizations: one for those that occurred in the past 12 months and another tapping those that occurred prior to that time period. For each time period, a respondent is considered an identity theft victim if someone used their personal information for any of the following purposes: (1) to run charges on or take money from existing accounts, including credit cards, banks, medical insurance, telephone, utilities, online payments, investments, online shopping, entertainment, email, government programs, social media, tax, and/or insurance accounts (other than medical); (2) to open new accounts, including any of the aforementioned types of accounts; (3) to file fraudulent tax returns; (4) to get medical treatment; (5) to apply for a job; (6) to provide false information to police; (7) to rent an apartment or house; (8) to apply for government benefits; (9) to obtain goods or services; (10) to hack into a respondent’s email address or obtain cash. Based on their responses, respondents were classified as “never victimized,” “victimized once,” and “victimized more than once.” Those victimized once experienced it on only one occasion in either the past 12 months or during the period before that. In the series of questions concerning the past 12 months, respondents are specifically asked whether they experienced only one or more than one incident of identity theft. Unless respondents indicate there was more than one incident, they will be treated as victimized once even if they answer yes to more of the 10 offenses listed above as people who commit identity theft may use information in multiple ways in a short time frame. Those victimized more than once experienced identity theft on more than one occasion in the past 12 months or they experienced it in both periods. “Never victimized” is the reference when the entire sample is used, while “victimized once” is the reference category when only those victimized are considered.
Financial loss from identity theft victimization
The ITS measures the total amount of money a respondent paid out of pocket because of identity theft victimization, and it catalogs losses separately by time period. For victimizations that occurred during the 12 months before the ITS, respondents were asked to estimate the direct losses and additional costs of the single most recent identity theft incident. For victimizations that occurred prior to the previous 12 months, respondents were asked to estimate the out-of-pocket costs of all of the incidents that occurred during this period. Once the total losses for both periods were estimated, they were then added together to create the total loss of all identity theft victimizations. The response categories are as follows: US$0(the reference), US$1 to US$50, US$51 to US$100, US$101 to US$500, US$501 to US$1,000, US$$1,001 to US$4,999, and US$5,000+. However, there is a coding decision that should be addressed. There are a substantial number of respondents (especially among those who reported victimization prior to the past 12 months) who reported being victimized, but their out-of-pocket costs were not specified. Closer analysis of the data revealed that these individuals were counted as “out of scope” although the codebook did not provide a clear explanation of what that entailed. Given that the ITS questions regarding losses instructed respondents to exclude costs that were covered by third parties, I interpreted this as respondents not paying anything out of pocket due to their victimization, so the question was skipped. Consequently, “out of scope” was coded as having lost US$0. While some readers may question the grounds for this decision, it ultimately does not make much of a difference. This assumption was tested in analyses not presented, where I treated out-of-scope responses as missing data. The results were similar to those I present.
Other financial problems
The ITS asks respondents whether they ever experienced other consequences of identity theft that impact their financial well-being during the past 12 months or the period before that. These problems include: credit-related problems; banking-related problems; having been contacted by debt collectors; having utilities cut-off or a new service denied; having been turned down or lost a job; had legal issues; been subject to criminal arrest or proceedings; and/or had income tax issues. Although respondents may answer whether they have been subject to each individual problem, a small number of respondents indicated having experienced them; thus, I aggregated them together, creating a simple dichotomy (yes =1; no = 0) tapping whether respondents experienced any harmful “other” financial problems.
Controls
Type of identity theft experienced
The type of identity theft experienced is measured through a survey item asking respondents whether they experienced existing credit card fraud (reference), existing bank account fraud, fraud involving another existing account, creation of a new fraudulent account, identity theft for another purpose, or multiple kinds of identity theft. The rationale for including this variable is individuals seem to view certain kinds of identity theft as less serious compared with other (Gilbert & Archer, 2012; Zou et al., 2020). It could be because some types of identity theft merely involve fraudulent charges that respondents are not ultimately liable for, whereas others involve the loss of their own money.
Respondent demographic variables
The analyses will also control for respondent sex, race, household income, years of education, and age. Respondent sex refers to their biological sex and is treated as a dichotomous variable coded as female (0) and male (1). Respondent race refers to the racial group they identify as and is coded as White (reference), Black, Asian, Native American, Pacific Islander, and Hispanic. Hispanic individuals are treated as separate from other racial categories even if they technically describe themselves as Hispanic-White or as any other combination of Hispanic and another category. Those who describe themselves as belonging to multiple racial categories are classified by their primary label; for example, someone who identifies as White Black will be classified as White. Those who report they belong to more than two racial groups were counted as missing as very few belong to this category (less than 100 respondents). Household income is the annual income of the respondent’s household based on a single survey item: <US$10,000 (reference), US$10,000 to US$19,999, US$20,000 to US$29,999, US$30,000 to US$39,999, US$40,000 to US$49,999, US$50,000 to US$74,999, and US$75,000 or more. Years of education is a continuous variable that ranges from 0 to 22. It covers the standard K–12 and university track (including masters and doctorates). Finally, respondent age as allocated by the survey is measured as a continuous variable that ranges from 16 to 90+. Per the hypotheses discussed above, age squared was also included in this study’s analyses.
Analyses
The analyses will consist of three stages. The first is an ordinary least squares (OLS) regression of the number of protective measures that only contains victimization status and demographic characteristics (Model 1). The second stage is an OLS regression of the number of protective measures that adds various facets of identity theft severity such as financial loss, other financial problems, and type of identity theft as a control (Model 2). The final stage of analysis will consist of a multinomial logistic regression of motivation for use of identity theft protective measures, with all independent variables included. The multinomial model is included to create a stronger causal argument regarding the effect of identity theft victimization on use of protective measures. It will allow the present study to directly measure whether respondents change their use of protective measures in response to victimization rather than just inferring it. It is also an opportunity to test the discriminate predictability of identity theft severity. If more severe victimizations spur people to use more protective measures, then those with more severe victimizations should be more likely to say that they use measures either because of victimization alone or for both reasons. However, if victimization severity does not truly affect the use of protective measures, then no clear pattern should be observed. The first analyses will use the entire sample, while the latter two will employ a subsample consisting of respondents who were victimized because variables such as financial loss and type of identity theft only apply to that group.
Results
The goal of the ITS, like the greater NCVS, is to obtain an accurate illustration of patterns in crime victimization from nationally representative data. The descriptive statistics (located in the appendix), suggest that representativeness has been achieved. The demographic composition of the sample is generally consistent with the composition of the overall U.S. population, at least in regard to age, race, education, household income, and gender.
However, the descriptive statistics also suggest that identity theft victimization is a serious problem in the U.S. population. More than 20% of the sample reports being an identity theft victim at some point, although repeat victims appear to be quite rare. Most identity thefts involve the fraudulent use of existing credit card or bank accounts. However, many of these victimizations appear relatively minor, as only a small minority of identity theft victims reported any personal financial losses or other financial problems because of identity theft. This may be part of the reason why the average respondent only practices two to three protective measures. Moreover, those who practice protective measures are more likely to say they do so for reasons unrelated to identity theft, than in response to identity theft victimization.
Number of Protective Measures
Table 1 presents the results of the OLS regressions of the number of protective measures. The coefficients from Model 1 suggest that victimization does positively impact the use of protective measures. When considering the entire sample, individuals who experience a single identity theft incident practice .67 more protective measures than nonvictims on average. This effect is even stronger for individuals who experience repeat incidents as they practice .95 more protective measures than those who were never victimized. Thus, Hypothesis 1, which suggested that individuals who have been victimized on more occasions use more protective measures, appears to have been supported. As for the effects of demographic variables, they are as follows. White respondents use more protective measures than respondents of any racial minority. Female respondents use slightly more protective measures than male respondents. Education has an especially strong positive effect on use of protective measures, with each year of education slightly increasing the number of protective measures practiced. Income has a positive, substantial, and statistically significant linear effect that is independent of education.
Ordinary Least Squares Regression of Number of Protective Measures
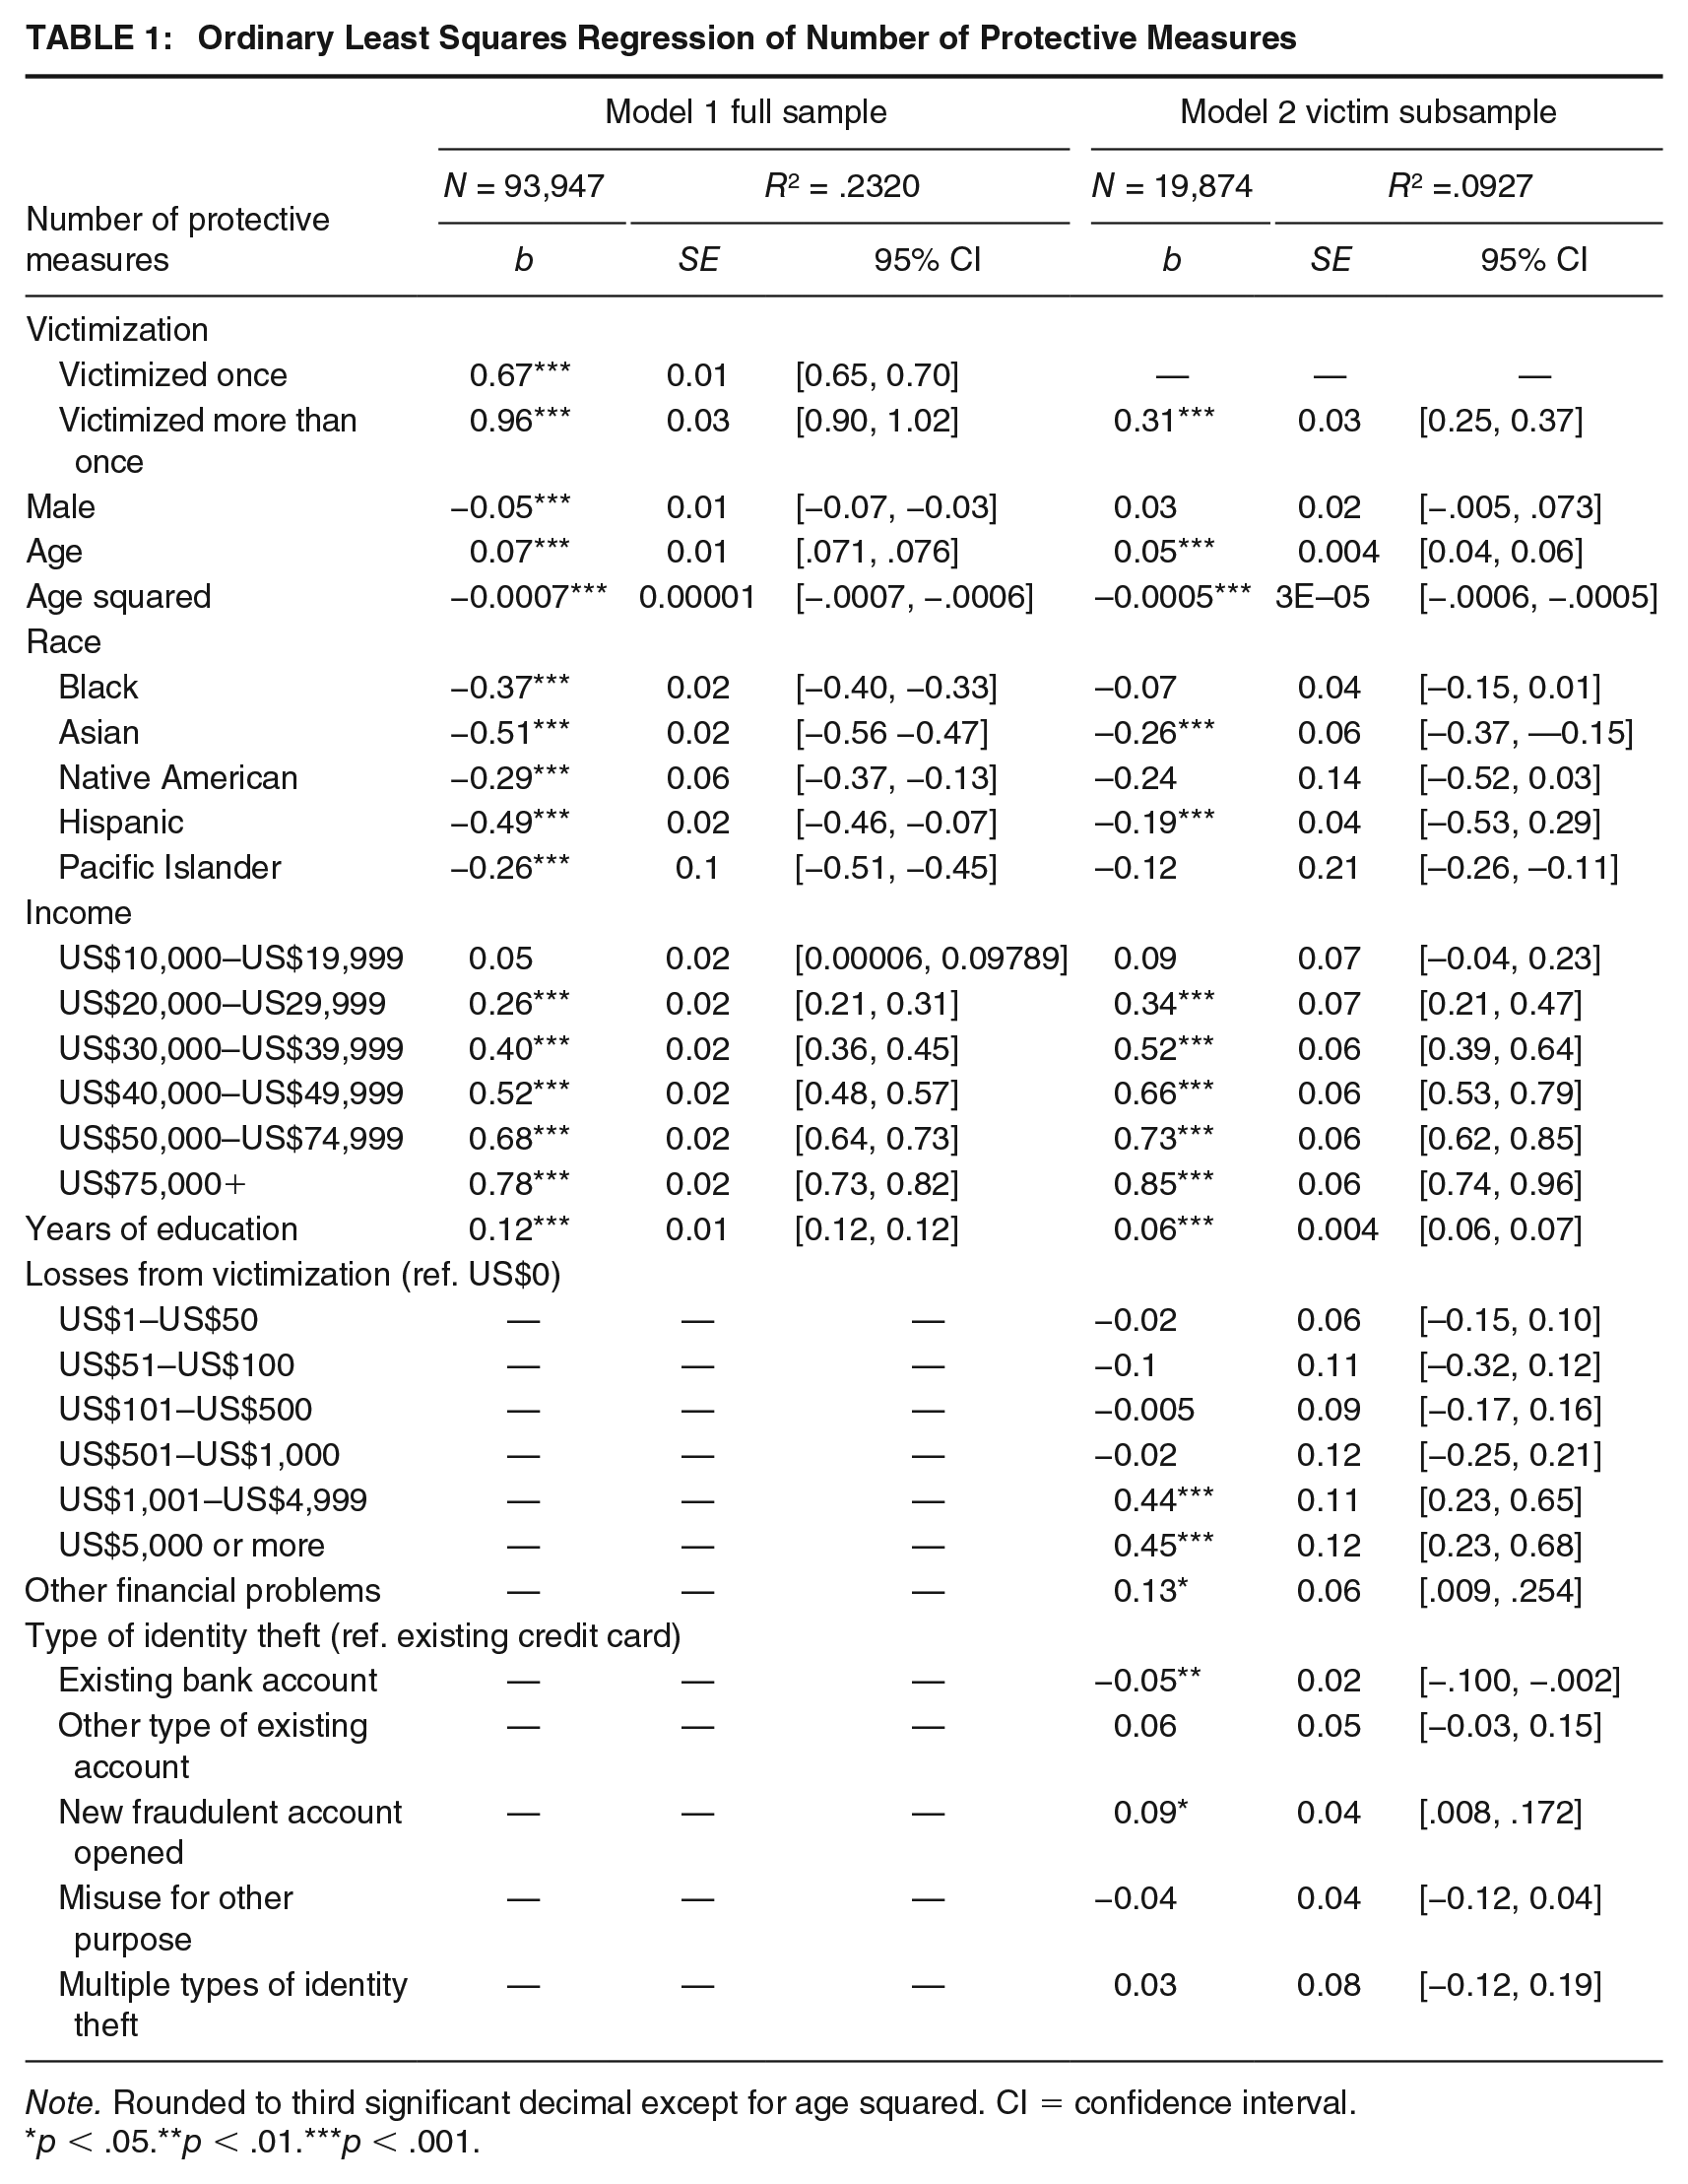
Note. Rounded to third significant decimal except for age squared. CI = confidence interval.
p < .05.**p < .01.***p < .001.
The most interesting results are those regarding age. The main effect of age indicates that people use more protective measures as they get older, whereas the square of age implies this positive influence grows weaker as respondents get older. However, it actually goes further than that. Figure 1 is based on the predicated probabilities of a respondent’s number of protective measures across age while holding all other variables constant. It shows that the number of protective measures practiced peaks between the ages of 40 and 60 until the predicted number of protective measures starts to decline. This continues until there is only a small difference between those under 20 and over 90. Consequently, age does seem to have a nonlinear relationship with use of protective measures.
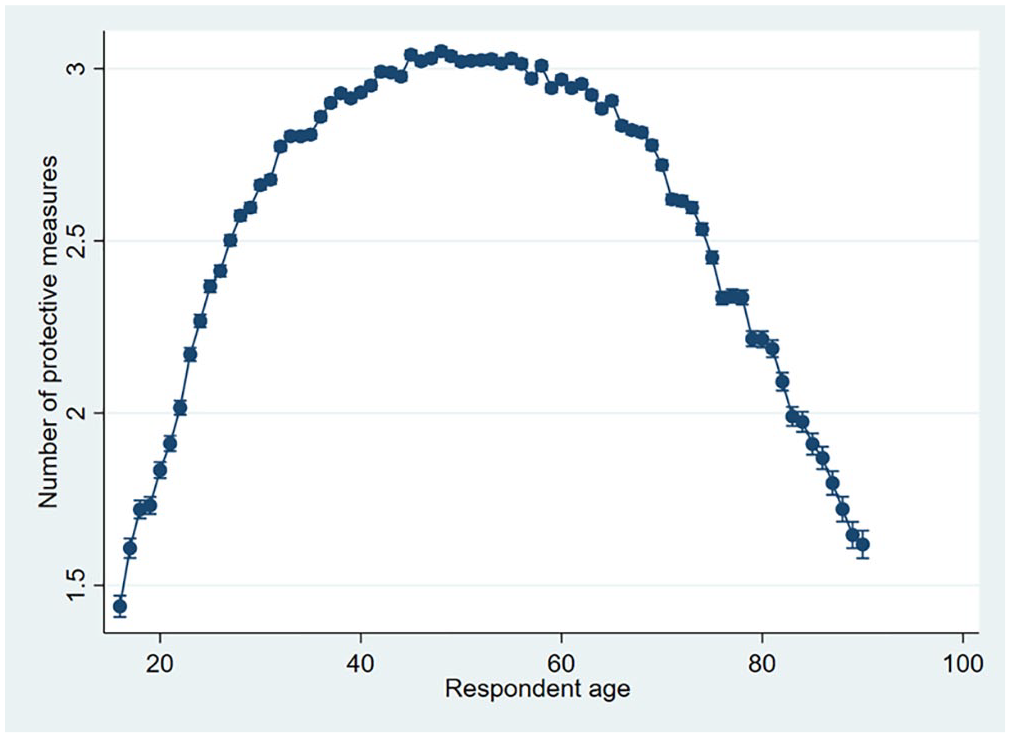
The Nonlinear Effects of Age on Protective Measures
Model 2 in Table 1 shows that, among the subsample of those who were victimized, identity theft severity in terms of financial loss does affect a respondent’s number of protective measures. However, financial loss has a nonlinear effect on the number of protective measures practiced. There is no substantial difference in the use of protective measures between respondents who lost nothing and those who lost less than US$1,000. Once that threshold is passed, financial losses have substantial positive effect on the number of protective measures. Other financial problems exhibit a positive and statistically significant effect on the number of protective measures practiced. Respondents who have experienced other problems use .15 more protective measures than those who do not. Finally, number of victimizations still has a substantial positive effect on number of protective measures when identity theft severity variables are included. Respondents who experienced repeat incidents still use more protective measures than single victims. Overall, findings largely support Hypothesis 2, which posited that the degree of financial loss and other negative consequences was positively tied to the number of protective measures Also, supportive of Hypothesis 3, the relationship between financial loss and protective measures is nonlinear.
As for the control variables, most of the demographic effects observed in Model 2 (Table 1) are still present albeit smaller in size than those reported in Model 1. Overall, type of identity theft does not seem to exert a substantial effect on the number of protective measures. It could be that once differences in financial losses and other consequences are accounted for, type of identity theft is not truly relevant for changes to protective behavior.
Motivation for Protection
Table 2 shows the results of the multinomial regression of motivation for use of protective measures. It largely upholds earlier conclusions reached from the OLS regressions although there are some noticeable departures. The first column (victimization) compares individuals who attribute their use of protective measures to identity theft victimization with those who did not use protective measures. The results suggest that victimization severity matters for them. Respondents who experienced repeat victimizations are much more likely to practice identity theft protective measures because of victimization versus no measures. Those who experienced other financial problems are more likely to use protective measures because of victimization, although the effect is not statistically significant. In contrast, the effect of loss on motive for protection is more nuanced. Consistent with Table 1, the findings reported in Table 2 indicate that respondents are much more likely to say they use protective measures because of victimization when they experienced financial losses of over US$1,000. However, contrary to the earlier results, financial losses of US$1 to US$100 also seem to make respondents substantially more likely to use protective measures because of victimization. This is problematic because if only financial losses exceeding US$1,000 had an effect, that would be further evidence toward the existence of a threshold as observed earlier. Yet these results suggest that both very large and very small losses seem to make respondents more likely to practice protective measures because of victimization. Nevertheless, the effect still does not appear to be linear. Thus, this again supports Hypothesis 3, which states that the relationship between loss and number of protective measures is nonlinear and the results from Tables 1 and 2 seem to support that.
Multinomial Regression of Motivation for Protection, Victim Subsample
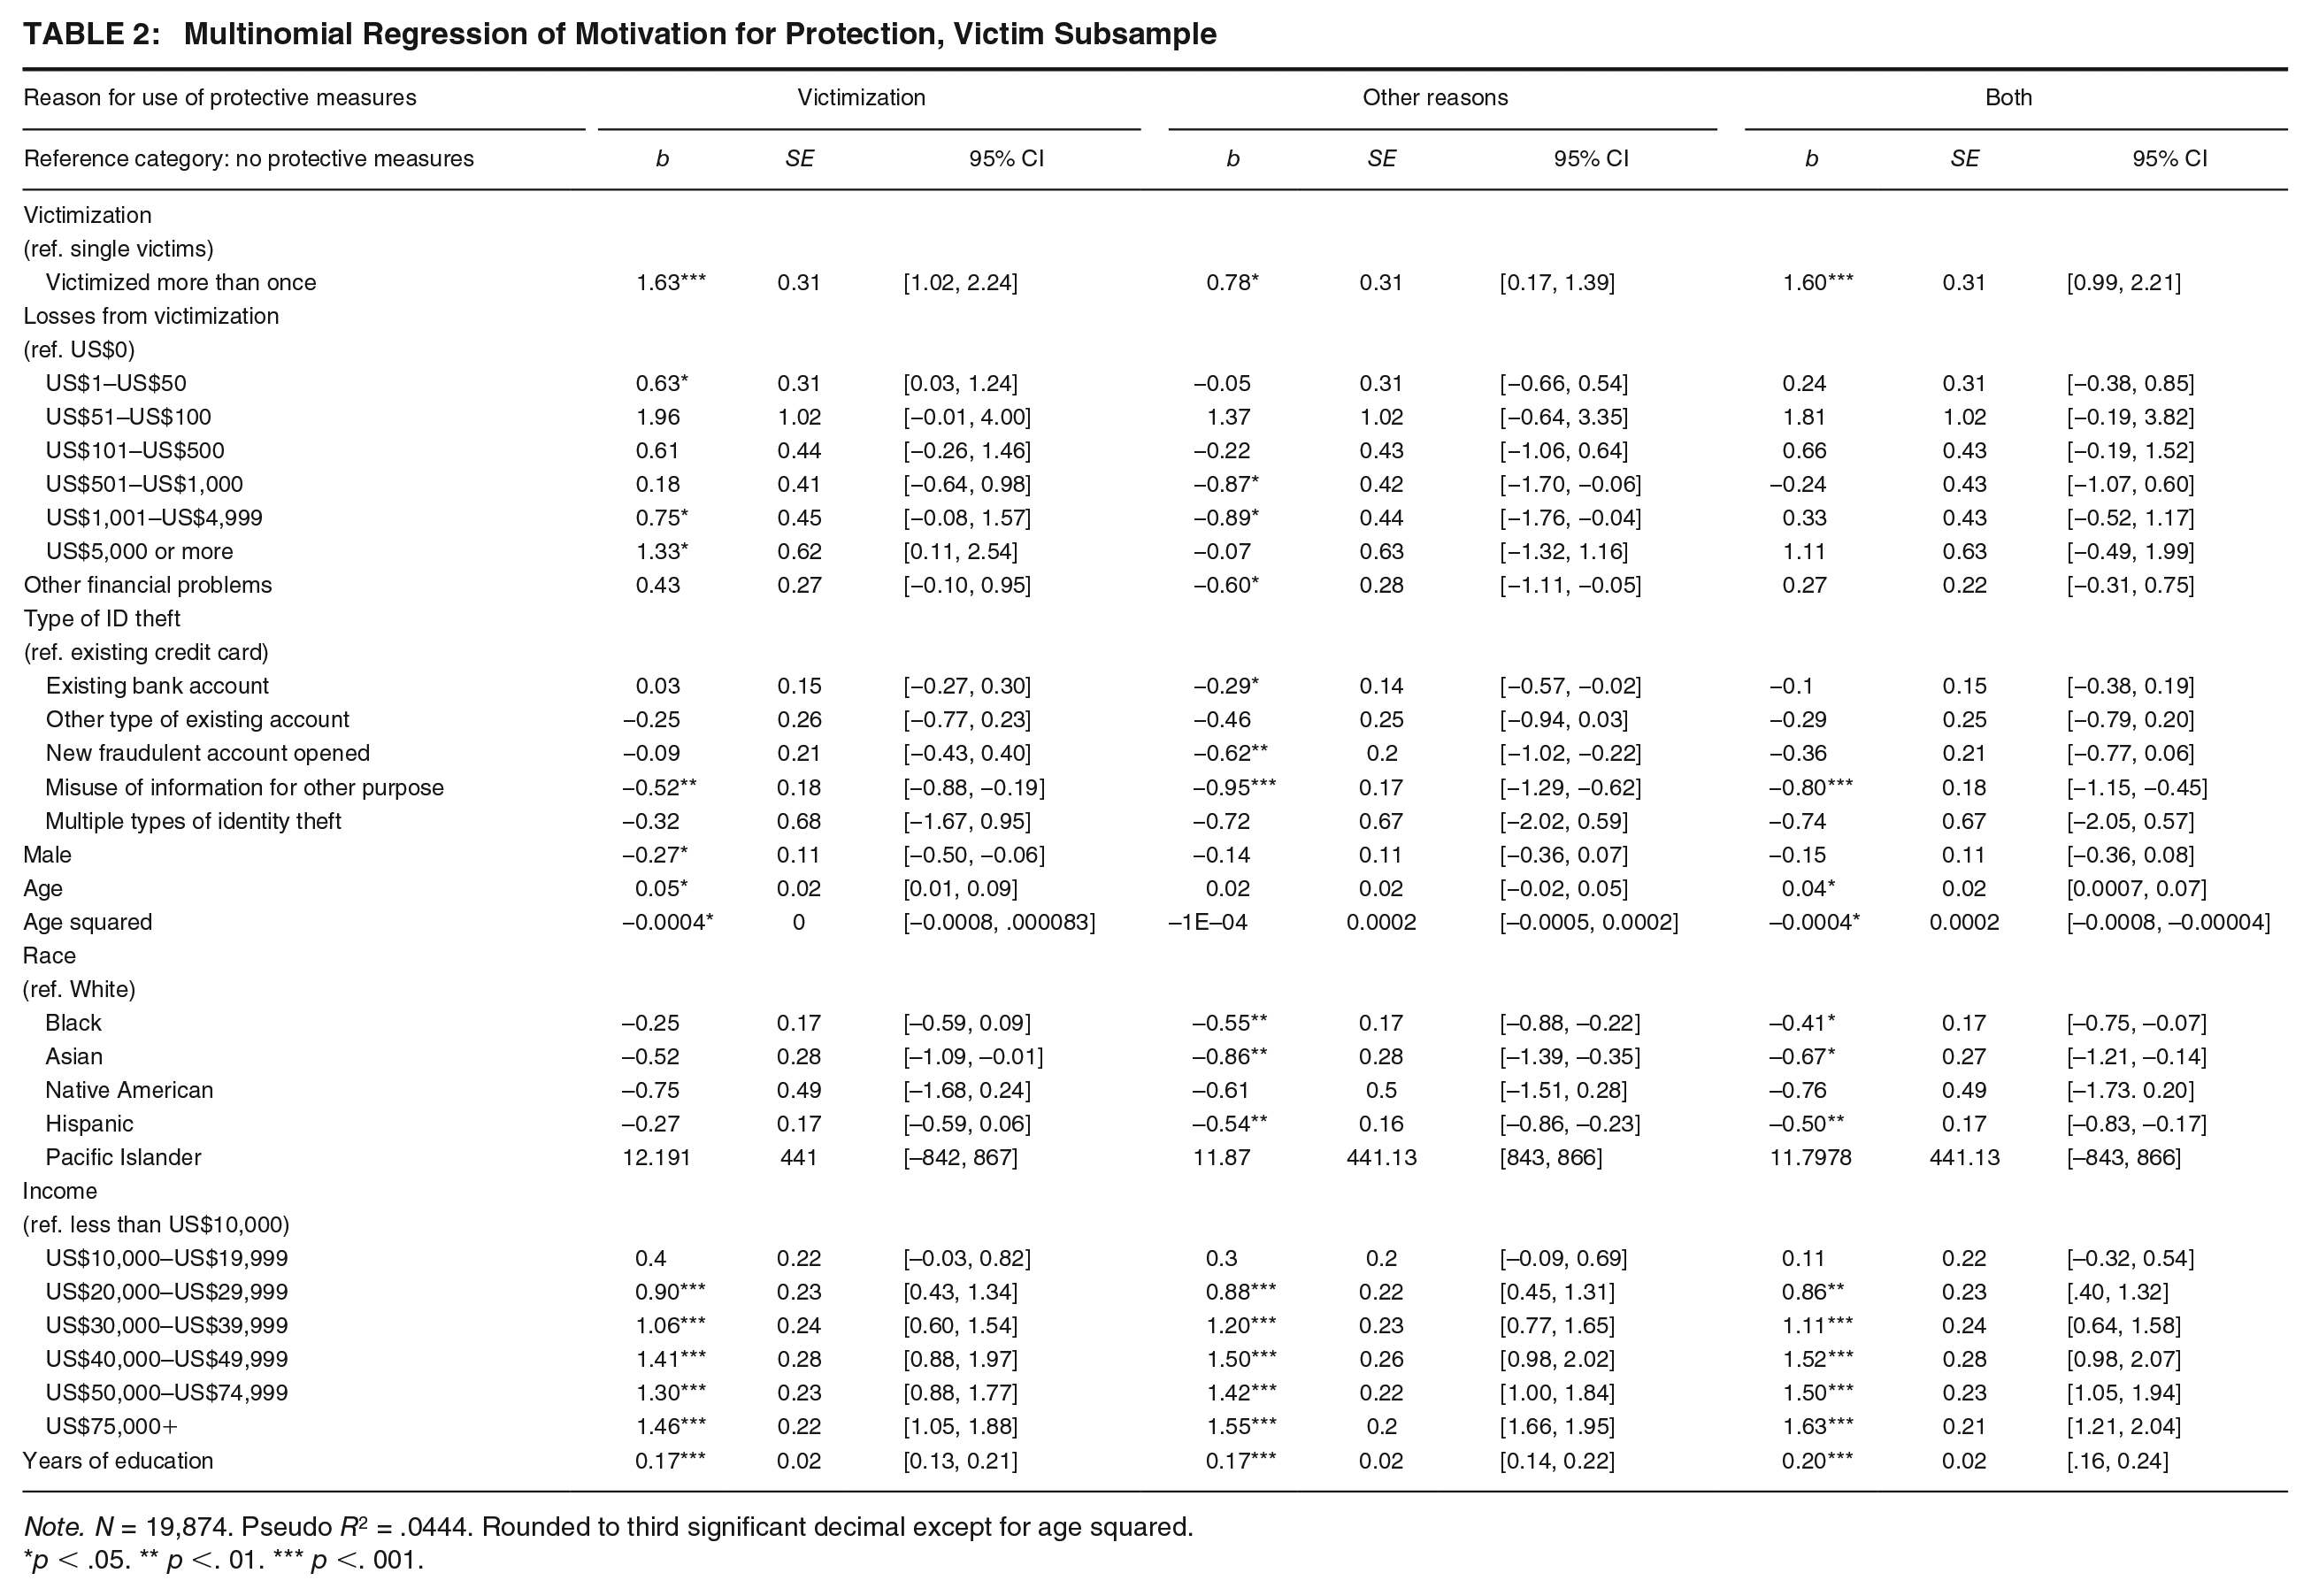
Note. N = 19,874. Pseudo R2 = .0444. Rounded to third significant decimal except for age squared.
p < .05. ** p <. 01. *** p <. 001.
The second panel, at least one measure for other reasons, contains respondents who practiced protective measures prior to identity theft victimization and did not change their protective measures because of it. These respondents were meant to show the discriminate predictability of the multinomial regression: Incidence and severity of victimization should have much weaker positive effects (or none at all) on use of protective measures for other reasons. The results seem to support this. Financial loss from identity theft victimization does not have a discernible effect on using protective measures for other reasons versus doing nothing. Furthermore, respondents who suffered other financial consequences are less likely to use protective measures for other reasons versus doing nothing. Repeat victimization has a substantial positive effect on use of protective measures for other reasons, which is surprising. However, it is much smaller than the effect of repeat victimization on respondents who only practice protective measures because of victimization.
The third category, at least one measure for both reasons, contains respondents who practiced protective measures prior to victimization and adopted more after their victimization. The study did not have any expectations for them. Respondents who experienced repeat victimization are much more likely to use protective measures for both reasons versus doing nothing. Other financial consequences have a substantial positive effect although it is not statistically significant. On the other hand, financial losses do seem to have less of an impact here compared with respondents who only practice protective measures because of victimization.
The effects of the demographic control variables in the multinomial regression are generally consistent with the OLS regression results. Still, it appears the effects of the controls may differ by motivation for protection. Male respondents are less likely to report using protective measures when they are solely used in response to victimization. The effects of gender are not statistically significant in any other case. Non-White respondents are generally less likely to practice identity theft measures for other reasons than White respondents. However, only Black respondents are less likely than White respondents to use protective measures in response to victimization. Meanwhile, age only seems to have a statistically significant effect for those motivated solely by victimization. Older respondents are more likely to practice protective measures in response to victimization than young ones, although the negative coefficient of age squared suggests this effect tapers off as one grows older. Finally, respondents with greater household incomes and with more years of education are more likely to practice protective measures for any reason compared with those who are lower in either respect. These potential interactions may bear investigating in future research.
Supplemental Analyses
The present study conducted several supplementary analyses intended to answer some lingering questions readers may have. The first was if the impact of identity theft victimization and its consequences on protective behavior varied across respondent race, gender, age, education, and household income. I found no evidence of any substantial interaction between victimization and any of these variables. Second, some readers may notice that the effect of other financial problems is relatively small compared with financial loss when both are included in the regression models. However, this is not an indication they are alternative measures of each other. Granted, the two measures are substantially correlated with each other, so I ran two separate OLS regressions where one variable was excluded. It became apparent that both ate into the effect of the other as coefficient sizes increased slightly when the other was absent. Nevertheless, both variables maintain substantial and statistically significant effects when they are both included in the analyses. Therefore, there is merit in including both financial loss and other financial problems as separate variables. Third, to address concerns regarding time ordering, I conducted the analyses of protective measures used in the last 12 months and the motivation for protection using only individuals who were victimized prior to the previous 12 months. The results were not significantly different from those shown here. Fourth and finally, some readers may have some concerns about the appropriateness of OLS models for predicting the number of protective measures. In response, I ran Tobit and Poisson regressions of number of protective measures using the same variables that I did in the OLS models. The results (which are not shown here but are available on request) were not substantially different from those observed above.
Discussion
Identity theft is a major public concern as it affects millions of people every year. However, police and other institutions are limited in their capacity to safeguard individuals from these crimes, so people are often responsible for protecting themselves (Albrecht et al., 2011; Gilbert & Archer, 2012; Reyns, 2013). Despite this, surveys show there are noticeable disparities in knowledge and use of protective measures. Part of this appears to be due to demographics; the study observed that education and income both had positive effects on the use of protective measures and that male respondents use fewer protective measures, upholding the findings from Ylang (2020). However, the results went beyond previous research; it seems only certain racial minorities use fewer protective measures than White individuals and that age seems to have a nonlinear effect. Yet there are still disparities in protective measures that remain unexplained. Rational choice perspectives, particularly Bayesian Updating, suggest that these disparities could be partially due to differences in perceived risk of identity theft victimization. Individuals base the degree to which they engage in their protective behavior (target hardening) on how likely and how harmful future incidents may be; a major source of information on these considerations is a victim’s own experience (Averdijk, 2011; Cook, 1986; Liska et al., 1988; Wilcox & Land, 1996). Consequently, individuals with disparate identity theft victimizations may practice protective behavior to different degrees. The present study’s results suggest that people who experience identity theft actually do this. Individuals who have been victimized use more protective measures than those who were not and individuals repeatedly victimized use more protective measures than those who experienced it once. Furthermore, individuals are more likely to practice protective measures when they experienced either financial loss or other financial problems from their victimizations. In contrast to previous research (Gilbert & Archer, 2012; Ylang, 2020), type of identity theft does not seem to exert substantial effects on either the number of protective measures or the motivation to practice them. It is possible it is not actually a major component of the perceived severity of identity theft once other factors are controlled.
These findings have implications for rational choice/Bayesian Updating and how it may be applied to future research into victimization. These perspectives suggest individuals change their behaviors because they increase their estimations of being victimized and the costs associated with it (Anwar & Loughran, 2011; Loughran et al., 2016). The consistently positive and substantial effect of victimization on the number of protective measures can be interpreted as individuals increasing the perceived probability of future identity theft victimization. Consequently, the effect of frequency of victimization seems relatively straightforward. However, the implications for the effect of victimization severity seem more complicated as the findings for financial loss are not completely consistent. Analyses of number of protective measures show the effect of financial losses to be nonlinear as only losses exceeding US$1,000 produce substantial increases. This could be evidence of a threshold effect, which is compatible with rational choice/Bayesian Updating. However, the contrasting results from the analyses of number of protective measures and motivation for protection leave it unclear where exactly the threshold is. Consequently, while it is highly likely that victimization severity does increase the use of protective measures, it is uncertain how severe a victimization has to be.
Nevertheless, there are numerous directions future research can go. While all protective measures require something, some are considerably more costly (Ireland, 2021; Roberts et al., 2013). It is cheaper to check credit statements and credit reports than it is to purchase identity theft protection or credit monitoring services. A subsequent study could separate protective measures by their relative cost and prevalence to see whether the severity of victimization makes individuals more likely to adopt some types of protective measures over others. In fact, future studies can go even further. The protective measures the ITS asked about are not the only behaviors that affect the risk of identity theft. Certain routine activities can increase exposure such as shopping online or giving out personal information on websites or over the phone; research shows victimization does affect them (Pratt et al., 2010; Reyns, 2013; Reyns & Henson, 2016). However, they were excluded from the current study as the ITS does not possess much information about them. Subsequent studies can check whether financial losses, other financial problems, or other negative consequences affect routine activities which affect exposure to identity theft.
Future studies could also compensate for some of current work’s limitations. The ITS only measures protective behavior in the 12 months before the survey. Consequently, I cannot control for how protective measures affect victimization prior to the past 12 months or vice versa. However, the relationship between victimization and protective measures practiced should operate as observed regardless of the time period. Another important limitation is the small number of observations within certain categories, particularly those at the higher levels of financial loss. The limited number of respondents in these groups means that there is the possibility that coefficients estimated from them may not represent the true effects of loss. This could also be the source of the ambiguous threshold observed in the multinomial analyses. Nevertheless, that an effect was observed even with so few respondents points to something being there, meriting further investigation. The last noteworthy limitation is the exclusion of respondent self-control from the analyses. Self-control influences the estimation of costs and risks of future events. Consequently, those with low self-control may be less inclined to practice protective measures and more willing to engage in risky behavior. Unfortunately, self-control could not be controlled for because the ITS does not have information on self-control or associated personality characteristics.
Nonetheless, clear contributions have been made to both identity theft and victimization research. The finding that age has a curvilinear effect on identity theft protective measures can help settle the debate on its real effect. Moreover, it has allowed for the identification of two subpopulations (the very old and very young) that are relatively more vulnerable to identity theft. The existence of these two subpopulations could be the result of the increased information technology literacy and use among emerging adults and the middle-aged (Elliot et al., 2014) although it will be up to future research to confirm this. More importantly, there is evidence that rational choice/Bayesian Updating can partially explain an identity theft victim’s response to victimization. That more frequent victims use more protective measures suggests victims revise their estimation of future victimization upward, leading to them taking more precautions. Meanwhile, although the relationship between victimization severity and protective behavior is murkier, the nonlinear effect of financial losses on protective behavior suggests individuals are sensitive to costs and gains. Losses from identity theft over a certain threshold seem to lead to more protective measures. Consequently, future studies of identity theft protective measures and individual responses to victimization should consider perceived costs of alternatives.
Finally, there is practical impact of the study. Interviews of identity theft professionals (fraud examiners, private investigators, and victim service providers) often emphasize the importance of educating the public, particularly at-risk populations (Green et al., 2021). Individuals need to learn the various ways that their information is collected and how it can be acquired by criminals so that they can act to mitigate risk. One way these professionals could motivate potential victims to do so is to emphasize the high potential financial costs of identity theft (losses in the thousands) in public service announcement and other educational outreach tools. This way, they could convince reluctant potential victims that it is ultimately less costly to invest in a series of protective measures than having identity theft derail their life. Furthermore, these announcements should be specifically targeted toward groups that are more vulnerable to identity theft given their relatively low levels of protective behavior, namely, individuals who are very old and very young who may the least capable of dealing with the consequences of identity theft.
Footnotes
Appendix
Sample Characteristics
| Variables of interest | M | SD | Freq. | Percent |
|---|---|---|---|---|
| Number of protective measures | 2.7 | 1.65 | — | — |
| Age | 49.3 | 18.3 | — | — |
| Years of education | 14.57 | 2.94 | — | — |
| Motive for protection | — | — | ||
| No protective measures | — | — | 10,695 | 11.54 |
| At least one for other reasons | — | — | 72,006 | 77.66 |
| At least one due to victimization | — | — | 4,286 | 4.62 |
| At least one for both reasons | — | — | 5,728 | 6.18 |
| Victimization | — | — | ||
| Not a victim | — | — | 73,103 | 79 |
| Single victim | — | — | 16,949 | 18 |
| Repeat victim | — | — | 2,663 | 3 |
| Loss from identity theft | — | — | ||
| US$0 | — | — | 18,157 | 92.6 |
| US$1–US$50 | — | — | 531 | 2.71 |
| US$51–US$100 | — | — | 159 | 0.81 |
| US$101–US$500 | — | — | 274 | 1.4 |
| US$501–US$1,000 | — | — | 149 | 0.76 |
| US$1,001–US$4,999 | — | — | 178 | 0.91 |
| US$5,000 or more | — | — | 159 | 0.81 |
| Other financial problems | — | — | ||
| No | — | — | 18,942 | 96.7 |
| Yes | — | — | 646 | 3.3 |
| Type of ID theft | — | — | ||
| Existing bank account | — | — | 5,972 | 30.46 |
| Existing credit card | — | — | 9,323 | 47.56 |
| Other type of existing account | — | — | 1,013 | 5.17 |
| New fraudulent account opened | — | — | 1,322 | 6.74 |
| Misuse for other purpose | — | — | 1,599 | 8.16 |
| Multiple types of identity theft | — | — | 374 | 1.91 |
| Gender | — | — | ||
| Male | — | — | 49,335 | 53.21 |
| Female | — | — | 43,380 | 46.79 |
| Race | — | — | ||
| White | — | — | 66,680 | 71.92 |
| Black | — | — | 9,647 | 10.41 |
| Asian | — | — | 3,991 | 4.3 |
| American | — | — | 534 | 0.58 |
| Hispanic | — | — | 11,863 | 12.8 |
| Income | — | — | ||
| <US$10,000 | — | — | 5,341 | 5.76 |
| US$10,000–US$19,999 | — | — | 8,844 | 9.54 |
| US$20,000–US$29,999 | — | — | 9,594 | 10.35 |
| US$30,000–US$39,999 | — | — | 10,761 | 11.61 |
| US$40,000–US$49,999 | — | — | 9,002 | 9.71 |
| US$50,000–US$74,999 | — | — | 16,729 | 18.04 |
| US$75,000+ | — | — | 32,444 | 34.99 |
Source. 2016 Identity Theft Supplement.
Authors’ Note:
I have no conflicts of interest to disclose.