
Abstract
Research is needed focusing on the predictive nature of dynamic risk and strength score changes. The current study includes 11,953 Canadian men under community supervision with Service Planning Instrument re-assessment data. Using a retrospective, multi-wave longitudinal design, hierarchical linear modeling (HLM) was conducted to assess patterns of change in total dynamic risk and strength scores across three to five timepoints over 30 months. Change parameters from the HLM were incorporated into regression models, linking change to three reoffending outcomes: technical violations, new charges, and new violent charges. Results indicated that total dynamic risk scores decreased over time and total dynamic strength scores increased over time, although the rate of change for both was gradual. Change in total dynamic risk scores was predictive of all outcomes, whereas change in total dynamic strength scores only predicted technical violations. Results demonstrated the utility of re-assessing dynamic risk and strength scores over time.
Assessing an individual’s risk to reoffend while on community supervision is a fundamental task of correctional organizations. Similarly, it is important to be able to detect changes in risk to reoffend to improve case management practices and assist with preventing failure while on community supervision. To accurately assess an individual’s risk to reoffend, risk assessment tools and protocols are utilized to assess various factors that are predictive of criminal behavior. These risk factors are classified into one of two categories: static or dynamic risk factors. Static risk factors are historical factors that are unchangeable as a function of intervention. That is, static risk factors either do not change, such as “age at first arrest,” or if they do change, it is not as a function of intervention, such as “number of prior convictions.” These factors, therefore, cannot act as treatment targets but are useful for classifying an individual’s degree of risk for reoffending (Mann et al., 2010). In contrast, dynamic risk factors are changeable factors that can be targeted through correctional intervention, as they are modifiable via treatment (Bonta & Andrews, 2017). As such, dynamic risk factors, often used interchangeably with the term “criminogenic needs,” measure an individual’s propensity to commit an offense within a proximal time frame and can help inform rehabilitation efforts (Bonta & Andrews, 2017). Some examples of dynamic risk factors include engaging with antisocial peers, criminogenic attitudes, or poor use of leisure time. While static and dynamic risk factors aid in determining who will recidivate and when they are most likely to recidivate, empirical findings also illustrate that strengths can influence an individual’s risk to reoffend and can aid in informing rehabilitation efforts (Jones et al., 2015). In brief, strengths can be classified as protective factors if they moderate the relationship between risk and recidivism among those who are high-risk, reducing the likelihood of reoffending (Jones et al., 2015), or classified as promotive factors if they negatively correlate with recidivism regardless of one’s overall risk level.
Although research has highlighted the importance of dynamic risk factors (e.g., Bonta & Andrews, 2017), less is known about how these dynamic factors fluctuate over time (Lloyd, 2015). This information is essential for providing successful and timely intervention methods. Furthermore, when discussing the various categories of risk assessments, the inclusion of positive factors, or strengths, is often missing. Thus, the purpose of this study is to examine how dynamic strength and dynamic risk factors change over time and how they may change in conjunction, which is essential to further advance not only the correctional field of risk assessment, but also how we approach treatment and rehabilitative efforts.
Multi-Wave Assessment of Dynamic Risk
Although many studies have employed multi-wave designs to assess dynamic risk factors (e.g., Labrecque et al., 2014; Olver et al., 2007), most of these studies have used small samples or a two-way design. While research employing two-way designs can meaningfully examine change prior to and after an intervention takes place, when assessing change over a longer time period without examining the effects of an intervention, it has been suggested that studies include at least three timepoints to increase the accuracy of detecting change over time (Brown et al., 2009), and this is particularly true when the nature and/or frequency of intervention(s) is unknown. Recently, studies have been conducted examining the predictability of dynamic re-assessments using three or more timepoints among samples of youth (e.g., Clarke et al., 2019), forensic inpatients (e.g., Quinsey et al., 2004), and sex offenders (e.g., Babchishin, 2013). To date, seven studies have used a three-point (or more) multi-wave approach to assess dynamic risk scores among justice-involved men in general (e.g., Brown et al., 2009), with only three studies examining change in strengths over time (Davies, 2019; Hanby, 2013; Lloyd, 2015).
Three-Point Studies Assessing Dynamic Risk
Several multi-wave studies have examined change in dynamic risk factors among justice-involved men. Studies conducted by Brown et al. (2009), Howard and Dixon (2013), and Jones et al. (2010) will be discussed in detail. Brown et al. (2009) examined the extent to which dynamic factors add to the prediction of recidivism over and above static risk factors. Using a sample of 136 justice-involved men released from federal institutions in Ontario, Canada (assessed at pre-release, 1-month post-release, and 3-month post-release), Cox regression with time-dependent covariates and receiver operating characteristics (ROC) analyses revealed the re-assessment of dynamic risk factors significantly predicted recidivism over and above static risk factors alone (i.e., area under the curve [AUC] = .89 vs. AUC = .81, p < .01). Jones et al. (2010) expanded on this study by incorporating an additional timepoint (6-month post-release) and used a longer follow-up time (6.5 years). Results remained consistent with dynamic re-assessments providing the strongest predictive validity; the findings were similar regardless of whether the assessments were based on the researcher’s judgment (AUC = .86) or that of parole officers (AUC = .83). While Cox regression with time-dependent covariates is useful for comparing the predictability of models using data from different timepoints and can inform the predictability of incremental change among assessments, it does not examine a person’s overall rate of change and how that change predicts reoffending.
Howard and Dixon (2013) used a large multi-wave dataset of 196,493 cases on community supervision in England and Wales who were assessed between 1 and 12 times over a 48-month period. Cox regression with time-dependent covariates was used to examine the predictive validity of the Offender Assessment System (OASys; Howard, 2006) Violence Predictor (OVP) using repeated assessments. Change in OVP scores were found to significantly predict violent reoffending (hazard ratio = 1.06) and homicide/ wounding reoffending (hazard ratio = 1.08), indicating that change in scores were found to improve prediction over initial scores. Cox regression with time-dependent covariates has been found to be an effective method to handle multi-wave measures assessed at irregular time periods (Yang et al., 2017) but does not allow for the examination of change patterns or how patterns of change differ for individuals.
Multi-Wave Studies Assessing Dynamic Strengths
To date, there have been three multi-wave studies examining the re-assessment of dynamic risks and strengths: Davies (2019), Hanby (2013), and Lloyd (2015), all of which used re-assessment data from the Dynamic Risk Assessment of Offender Re-entry (DRAOR; Serin, 2007). Both Hanby (2013) and Lloyd (2015) used a sample of 3,498 individuals on parole from New Zealand (predominately men) and examined re-assessments over a 12-month period. Hanby (2013) used hierarchical linear growth modeling (HLGM) and Cox regression survival analysis to assess monthly re-assessments of the stable, acute, and protective domains. Results demonstrated that, over time, dynamic risk variables decreased whereas protective factors increased; however, in the month prior to reoffending, strength scores tended to drop. Cox regression results indicated that later assessments had lower predictive accuracy than earlier assessments. That is, monthly average stable risk scores predicted reconvictions immediately following parole start and over the 12-month re-assessment period; however, monthly average protective factor scores predicted reconvictions for only the first 4 months after the start of parole. Monthly average acute risk scores were not predictive of reconvictions in any of the re-assessments following start of parole. Although assessing the predictability of scores at each time, this study did not explicitly examine how change in scores predicted reconvictions.
In contrast, Lloyd (2015), who used the same dataset as Hanby (2013), examined whether proximal DRAOR stable, acute, and protective domain assessments were more predictive than distal assessments using a discrete-time hazard model (which is a variant of logistic regression models). Three models were compared: Model 1 included only static risk scores from the Risk of Reconviction × Risk of Re-Imprisonment scale (RoC*RoI; Bakker et al., 1998); Model 2 included static scores and initial stable, acute, and protective domain scores; and Model 3 included static scores and change scores for the stable, acute, and protective domains. Overall, results demonstrated that the model including initial stable, acute, and protective scores added incrementally to the prediction of static risk scores (χ2 = 158.85, p < .001). However, the model including change scores of the stable, acute, and protective domains added incrementally to the prediction of static risk scores to a higher degree (χ2 = 294.86, p < .001). Upon examining the individual domain scores independently, it was found that incorporating change scores improved prediction for all domains—stable, acute, and protective, over the initial scores.
In a similar study, Davies (2019) focused on the timing of re-assessments and whether the most proximal assessment predicted reoffending. Through a replication of Lloyd’s approach, Davies examined 13,714 DRAOR assessments completed for 966 high-risk men on Parole in New Zealand. It was found that scores on each of the domains changed between the first and last assessment, whereby an average decrease of half a point on the stable and half a point increase on the protective domains were found, as well as almost a full-point increase on the acute domain. Results also indicated that proximal assessments of each of these three domains were better predictors of recidivism, in comparison to initial scores.
Overall, the results from these studies demonstrate that the incorporation of dynamic risk factors, in combination with static risk factors, improves the prediction of recidivism. However, most of these studies tend to assess incremental change among timepoints (e.g., Brown et al., 2009; Jones et al., 2010), rather than examine how overall change over time is related to reoffending outcomes. This area of research, with the exception of Davies (2019), Hanby (2013), and Lloyd (2015), has focused solely on the dynamic nature of risk factors rather than strengths. As such, additional longitudinal re-assessment data are needed to clarify the relationship between dynamic risks, strengths, and reoffending outcomes.
Using the Service Planning Instrument to Assess Change Over Time
To assess change in dynamic factors over time, re-assessment information is required. One assessment tool that assesses various dynamic factors—including risk and strength factors—is the Service Planning Instrument (SPIn; Orbis Partners, 2003). The SPIn incorporates a variety of dynamic factors from various content domains and these items are measured on a Likert-type scale rather than dichotomously (yes/no), which improves the tool’s ability to capture change over time (i.e., tool is more sensitive to change). For these reasons, the SPIn was determined to be an appropriate tool to use to capture change in dynamic scores. To date, only single-wave studies have demonstrated the predictive nature of SPIn-assessed dynamic risk and strength scores (see Brown et al., 2020; Jones et al., 2015).
Purpose
The main purpose of this study is to examine the dynamic nature of dynamic risk and strength scores assessed by the SPIn. To date, no studies have assessed how SPIn-assessed total dynamic risk and strength change over time or how change patterns in SPIn-assessed total dynamic risk and strength scores predict recidivism. The current study uses multi-wave re-assessment data with a large sample of men on community supervision to assess (a) patterns of change in total dynamic risk and strength scores, and (b) the relationship between changes in total dynamic risk and strength scores and reoffending outcomes.
Method
Participants
The sample consisted of a cohort of justice-involved men who initially started community supervision between 2009 and 2012 in Alberta, Canada. Each individual was serving a provincial community sentence, 1 including stand-alone community supervision, or supervision upon release from a provincial correctional facility. The final sample comprised 11,953 men and contained between three and five completed SPIn assessments per individual (M = 3.9, SD = .87, Mdn = 4.0). The average time between assessments was 5.64 months (SD = 3.49, range: 0–30). There was a fixed 3-year follow-up period from the time of the initial assessment. The sample consisted of only those individuals with initial assessments that occurred within 90 days of the start of supervision, as assessment information later than this timepoint is not reflective of true initial scores and thus, would not be an accurate representation of individuals’ change trajectory. The average age was 33.6 years old and just over a quarter (16.6%) were Indigenous.
Measures
The Service Planning Instrument (SPIn)
The SPIn (Orbis Partners, 2003) is a risk, need, and strength assessment and case management planning instrument. This tool can be used with adults in both institutional and community-based justice settings, and incorporates information from a semi-structured interview, file-information, and collateral sources. The full SPIn assessment contains 90 items; 35 are used to calculate a Pre-Screen risk score and Pre-Screen strength score (11 items). The current study focuses on the SPIn Full Assessment, as the Pre-Screen is only assessed once and is predominately made up of static risk and strength factors.
Each of the 90 items are either measured on a poled Likert-type scale with scores ranging from 0 to 2 for strength and 0 to 2 for risk, or they are measured as pure risk or strength items (i.e., either dichotomous yes/no items, or “check all that apply” items). For the items measured on a Likert-type scale, a score of 0 typically indicates a neutral score, where as a score of 1 typically indicates that the item is “sometimes” or “somewhat” present, and finally a rating of 2 indicates that an item is “always present.” These items are organized within 11 domains: criminal history (e.g., prior convictions), response to supervision (e.g., institutional misconducts, violations), aggression (e.g., aggression, frequency of conflicts), substance use (e.g., frequency of use), social influences (e.g., negative and prosocial peers), family (e.g., marital and parental factors, employment and education (e.g., job search skills, marketability), attitudes (e.g., attitude toward criminal justice system), social and cognitive skills (e.g., hostility, problem solving), stability (e.g., living situation, financial situation), and mental health (e.g., suicidal ideations).
Most domains contain both static and dynamic items with the exception of criminal history and response to supervision which are composed entirely of static items. The mental health flag does not contribute to the total static or dynamic risk score. In contrast, social influences, attitudes, and social/cognitive skills are composed entirely of dynamic items. The majority of domains include the assessment of both strength and risk items—however, criminal history, response to supervision, mental health flag, and substance use domains do not contain any strength items (see Jones & Robinson, 2018 for more details on the various SPIn domains). The various dynamic domain scores are aggregated to calculate a total dynamic risk score and a total dynamic strength score, and static risk domains can be aggregated to calculate a total static risk score. The total dynamic risk scores range from 0 to 75+ (with scores over 75 considered very high), and total dynamic strength scores range from 0 to 57+ (with scores over 57 considered very high). For the current study, only the total dynamic risk, dynamic strength, and static risk scores from the full SPIn assessment will be included. Notably, the interrater reliability of the SPIn has not yet been examined (Jones & Robinson, 2018). Although, the Pre-Screen SPIn has predicted well across various outcomes in both community and custody samples of men and women (AUCs ranging from .64 to .87), the domain scores have evidenced lower AUCs (range: .54–.76; Jones & Robinson, 2018).
In Alberta, policy stipulates that initial SPIn assessments should be conducted within 45 days of the start of court-ordered community supervision or release from custody. SPIn re-assessments should be completed every 6 months. The SPIn is not required if the supervision period is 3 months or less if the court order does not have a reporting condition placed on the client, if the client is convicted of a new charge and there is already a recent completed assessment, or if the client will be leaving the province within 45 days of the start of supervision.
Criminal Outcome
Three dichotomous (yes/no) measures of reoffending were used based on reoffense records indicating recontact with correctional services in the province of Alberta. The outcomes were (a) any new charge(s), which includes any new charges that are non-violent, sexual, or violent in nature, but excludes any technical violations; (b) any new violent charge(s): which includes uttering threats, all forms of assault (including causing bodily harm, assault with a weapon, assault of a peace officer, and simple assaults), any weapon-related offenses (including pointing a firearm, possession, and careless storage), harassment, robbery, dangerous driving or operation causing bodily harm, damage by arson, and any murder charges. Violent charges exclude any technical violation, any new non-violent charges, and any new sexual charges. And finally, (c) technical violation(s) include any breaches of court-ordered or community supervision conditions resulting in a failure to comply or failure to appear. Each outcome was assessed over a 3-year fixed follow-up from the initial SPIn Full Assessment.
Analytic Approach
Prior to running analyses, measurement invariance (a preliminary step to change analysis) was examined using MPlus software version 8.3 (Muthén & Muthén, 1998–2017). Measurement invariance assesses whether the domains in the scale (in this case, total dynamic risk and total dynamic strength scores) assess the same construct in the same way across time. When there is a violation of measurement invariance, the measure may not accurately assess true change in scores over time, but rather change in scores may be due to measurement error. Exploratory structural equation modeling was used to examine two types of measurement invariance models: the configural (baseline) model and the scalar model. Achieving scalar measurement invariance provides evidence to support the utility of mean comparisons across time, indicating that the same underlying construct is being measured at each timepoint. Total dynamic strength and total dynamic risk were found to achieve scalar measurement invariance over time (see Table 1).
Model Fit Indices and Nested Model Comparisons for Testing Invariance of Total Dynamic SPIn Strength and Risk Scores
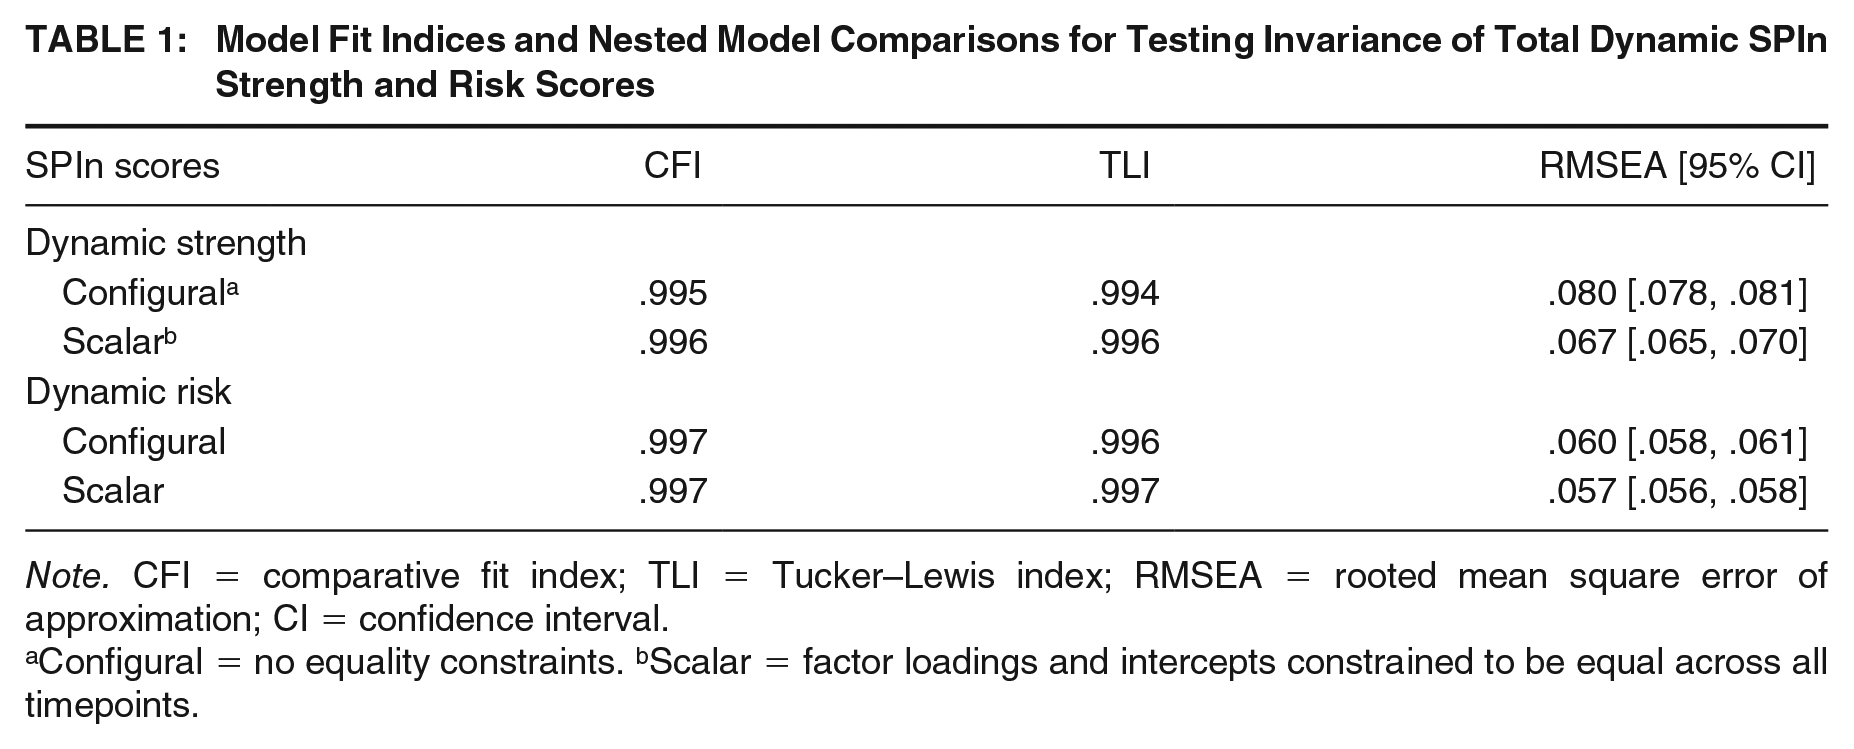
Note. CFI = comparative fit index; TLI = Tucker–Lewis index; RMSEA = rooted mean square error of approximation; CI = confidence interval.
Configural = no equality constraints. bScalar = factor loadings and intercepts constrained to be equal across all timepoints.
To examine patterns of change and how these patterns relate to criminal outcome, a two-stage HLM was conducted using SAS software version 9.4 (SAS Institute Inc., 2016). Although this approach has not been widely used in forensic and criminal justice psychology, Yang and colleagues (2017) argue that this approach can account for various challenges faced in the field of correctional risk assessment: irregular data collection intervals (risk assessment periods), missing data, drop-outs during follow-up, and different data collectors. Stage 1 involves HLM which examines data clustered into groups where patterns of change within individuals and change between individuals are examined. This approach explores average growth trends while providing an understanding of the types of variables that explain variability in the observed growth trends. Stage 2 involves running a regression model using the change parameters (intercepts and slopes) calculated during the HLM stage to link these change patterns to reoffending outcomes. Parameter estimates from the conditional model that included between-individual effects (Level 2 predictors such as Indigenous status, age, and static risk scores) were retained. Indigenous status was particularly important to include as a Level 2 predictor in the current study due to the large proportion of Indigenous men in the data. As such, it is important to consider whether there are differences in change scores for Indigenous and non-Indigenous men. These covariates were not entered again into the second stage. See Yang et al. (2017) for more details on the two-stage HLM approach.
Results
Sample Descriptives
Based on the SPIn Full Assessment static risk scores, almost half the sample were low-risk (49.7%), a third were moderate-risk (37.1%), and few were high-risk (12.8%). In terms of index offenses 23.9% committed a non-violent offense, 5.2% committed an administration of justice offense, 42.5% committed a violent offense, and 4.2% committed a sexual offense. For the SPIn initial Full Assessment, the average total dynamic risk score was considered to be Low-Moderate (M = 19.3, SD = 15.8), and the average total dynamic strength score was considered Moderate (M = 27.8, SD = 16.4). Finally, 16.2% were charged with a violent offense, 22.8% committed a technical violation, and 29.1% were charged with any new offense within the 3-year follow-up.
Data Screening
There was a large amount of missing assessment information at later timepoints due to time of measurement (e.g., participant recidivated, period of supervision was not long enough). For example, 51.5% (n = 6,153) did not have an assessment 4 timepoint, and 77.0% (n = 9,201) did not have an assessment 5 timepoint. However, there is also assessment information deemed true missing data; that is, assessment information not present, despite success in the community with adequate follow-up time. The amount of true missing data across each of the assessment timepoints is minimal, comprising less than 4% (range: 0%–3.6%). Data were also screened for outliers, normality, linearity, and multicollinearity, and there were no violations.
Hierarchical Linear Modeling
Model Building Process
Three models were created using the SPIn Full Assessment total dynamic risk score or the total dynamic strength score as an outcome variable. The unconditional means model describes the variation in initial total dynamic risk scores or total dynamic strength scores and does not consider change. The unconditional growth model includes time as the only predictor in the model to examine within-individual effects (e.g., Level 1). The conditional model includes time and Level 2 predictors (age, Indigenous status, and SPIn static risk scores) to examine both within- and between-individual effects.
Fit Statistics, Assumptions, and Time
To assess goodness of model fit for each of the three models, multiparameter tests such as Akaike information criterion (AIC) and Bayesian information criterion (BIC) statistics were used, as well as −2 log likelihood (−2LL) values, ideal for nested models (Singer & Willett, 2003). Time can be entered into the model as either a linear, quadratic, or cubic trend. To determine which trend best fit the data, the log likelihood ratio test was used. The unconditional growth model was used to examine the shape of each person’s trajectory of change. Timepoints were centered around the initial assessment in months, allowing for ease of interpretation (i.e., initial assessment is deemed timepoint 0, each subsequent month is considered a new timepoint).
Patterns of Change: Total Dynamic Risk Scores
The initial total dynamic risk scores ranged from 0 to 225 (M = 19.32, SD = 15.83). Subsequent assessments occurred at intervals spanning 3 to 30 months post initial assessment and these total dynamic risk scores ranged from 0 to 176 (M = 19.04, SD = 15.23). The log likelihood value associated with the random effects linear function (308,705.9) was smaller than the log likelihood value associated with the quadratic function (317,417.2), and as such, the likelihood ratio test could not be assessed indicating that the linear random effects trend best fit the data. Given that the linear function fit the data better than the quadratic function, the cubic function was not examined. When interpreting the results from the unconditional means model to assess variance between individuals, the intraclass correlation coefficient (ICC) was found to be .849 (197.33/(35.06 + 197.33)). This indicates that 84.9% of the variance in initial dynamic risk scores can be explained by differences between men (see Table 2).
Two-Level Linear Growth Models Examining Changes in Total Dynamic Risk Scores Over Time
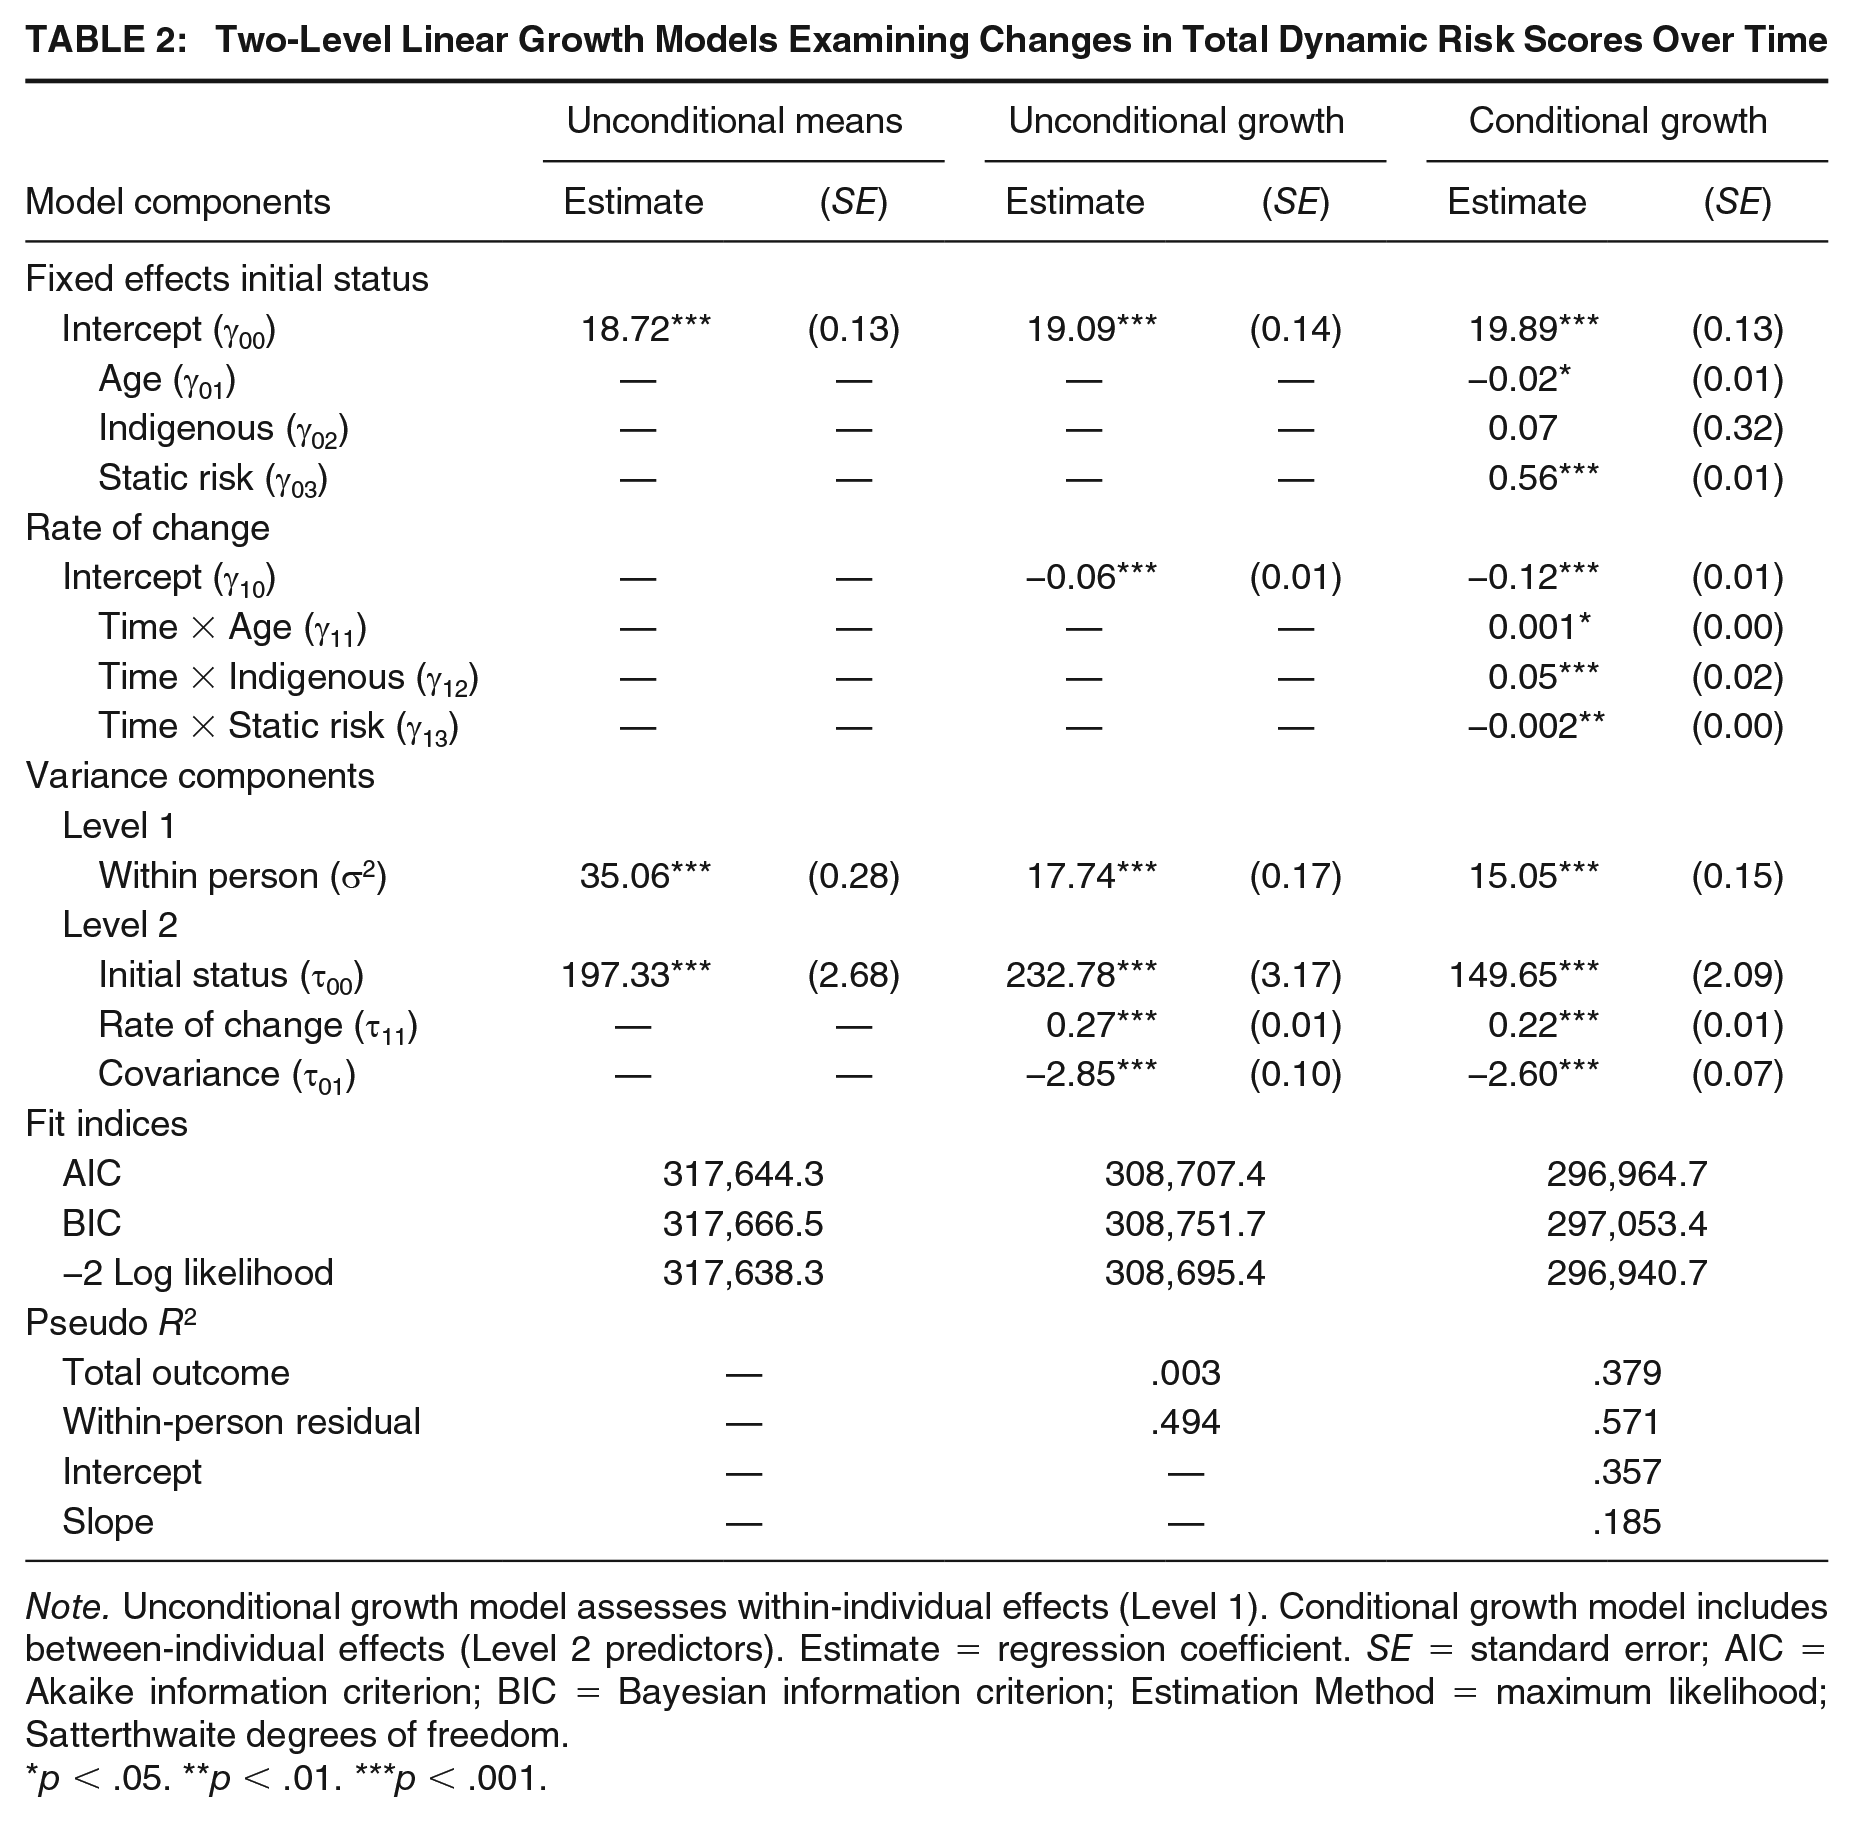
Note. Unconditional growth model assesses within-individual effects (Level 1). Conditional growth model includes between-individual effects (Level 2 predictors). Estimate = regression coefficient. SE = standard error; AIC = Akaike information criterion; BIC = Bayesian information criterion; Estimation Method = maximum likelihood; Satterthwaite degrees of freedom.
p < .05. **p < .01. ***p < .001.
Unconditional Growth Model: Level 1 Change Over Time
As seen in Table 2, results indicated that, on average, the initial total dynamic risk score for men was 19.09 and the average rate of change was a decrease in scores by −.06 points per month while on community supervision. The variance in initial status (τ00 = 232.78) and rate of change (τ11 = .27) were both significantly different from zero (p < .001), indicating that there was significant variability in both initial total dynamic risk scores and in the rate of change on these scores. The covariance between initial score and change over time suggests that men with higher total dynamic risk scores at initial assessment evidenced a greater decrease in scores over time relative to men with lower total dynamic risk scores at initial assessment.
Conditional Model: Variation as a Function of Level 2 Predictors
As seen in Table 2, initial total dynamic risk scores did not vary as a function of Indigenous status; however, scores did vary as a function of age and total static risk score. That is, those who were younger and those with higher static risk scores were more likely to score higher on total dynamic risk at the time of initial assessment. Age, Indigenous status, and total static risk scores were found to influence rate of change; however, the magnitude of the rate of change as a function of age and total static risk scores was small. Results indicated that non-Indigenous men had total dynamic risk scores that decreased at faster rates over time than Indigenous men.
Pseudo R2 Results
As indicated in Table 2, pseudo R2 results indicated that less than 1% of variance is explained by the unconditional growth model, whereas 37.9% of variance is explained by the conditional growth model. The proportion of within-individual variation explained by time was higher in the conditional growth model rather than the unconditional growth model. Adding Level 2 predictors was found to further explain unexplained outcome variation for the initial total dynamic risk scores and the change in total dynamic risk scores.
Patterns of Change: Dynamic Strength Scores
The initial total dynamic strength scores ranged from 0 to 89 (M = 27.80, SD = 16.40). Subsequent SPIn assessments occurred at intervals spanning 3 to 30 months post initial assessment and these total dynamic strength scores ranged from 0 to 89 (M = 28.23, SD = 16.34). The log likelihood value associated with the random effects linear function (301,051.3) was smaller than the log likelihood value associated with the quadratic function (309,261.5). As such, the likelihood ratio test could not be assessed, indicating that the linear random effects trend best fit the data. Once again, given that the linear function fit the data better than the quadratic function, the cubic function was not examined. When interpreting the results from the unconditional means model to assess variance between individuals, the ICC was .903 (241.92/(25.86 + 241.92)). This indicates that 90.3% of the variance in initial total dynamic strength scores can be explained by differences among the men (see Table 3).
Two-Level Linear Growth Models Examining Changes in Total Dynamic Strength Scores Over Time
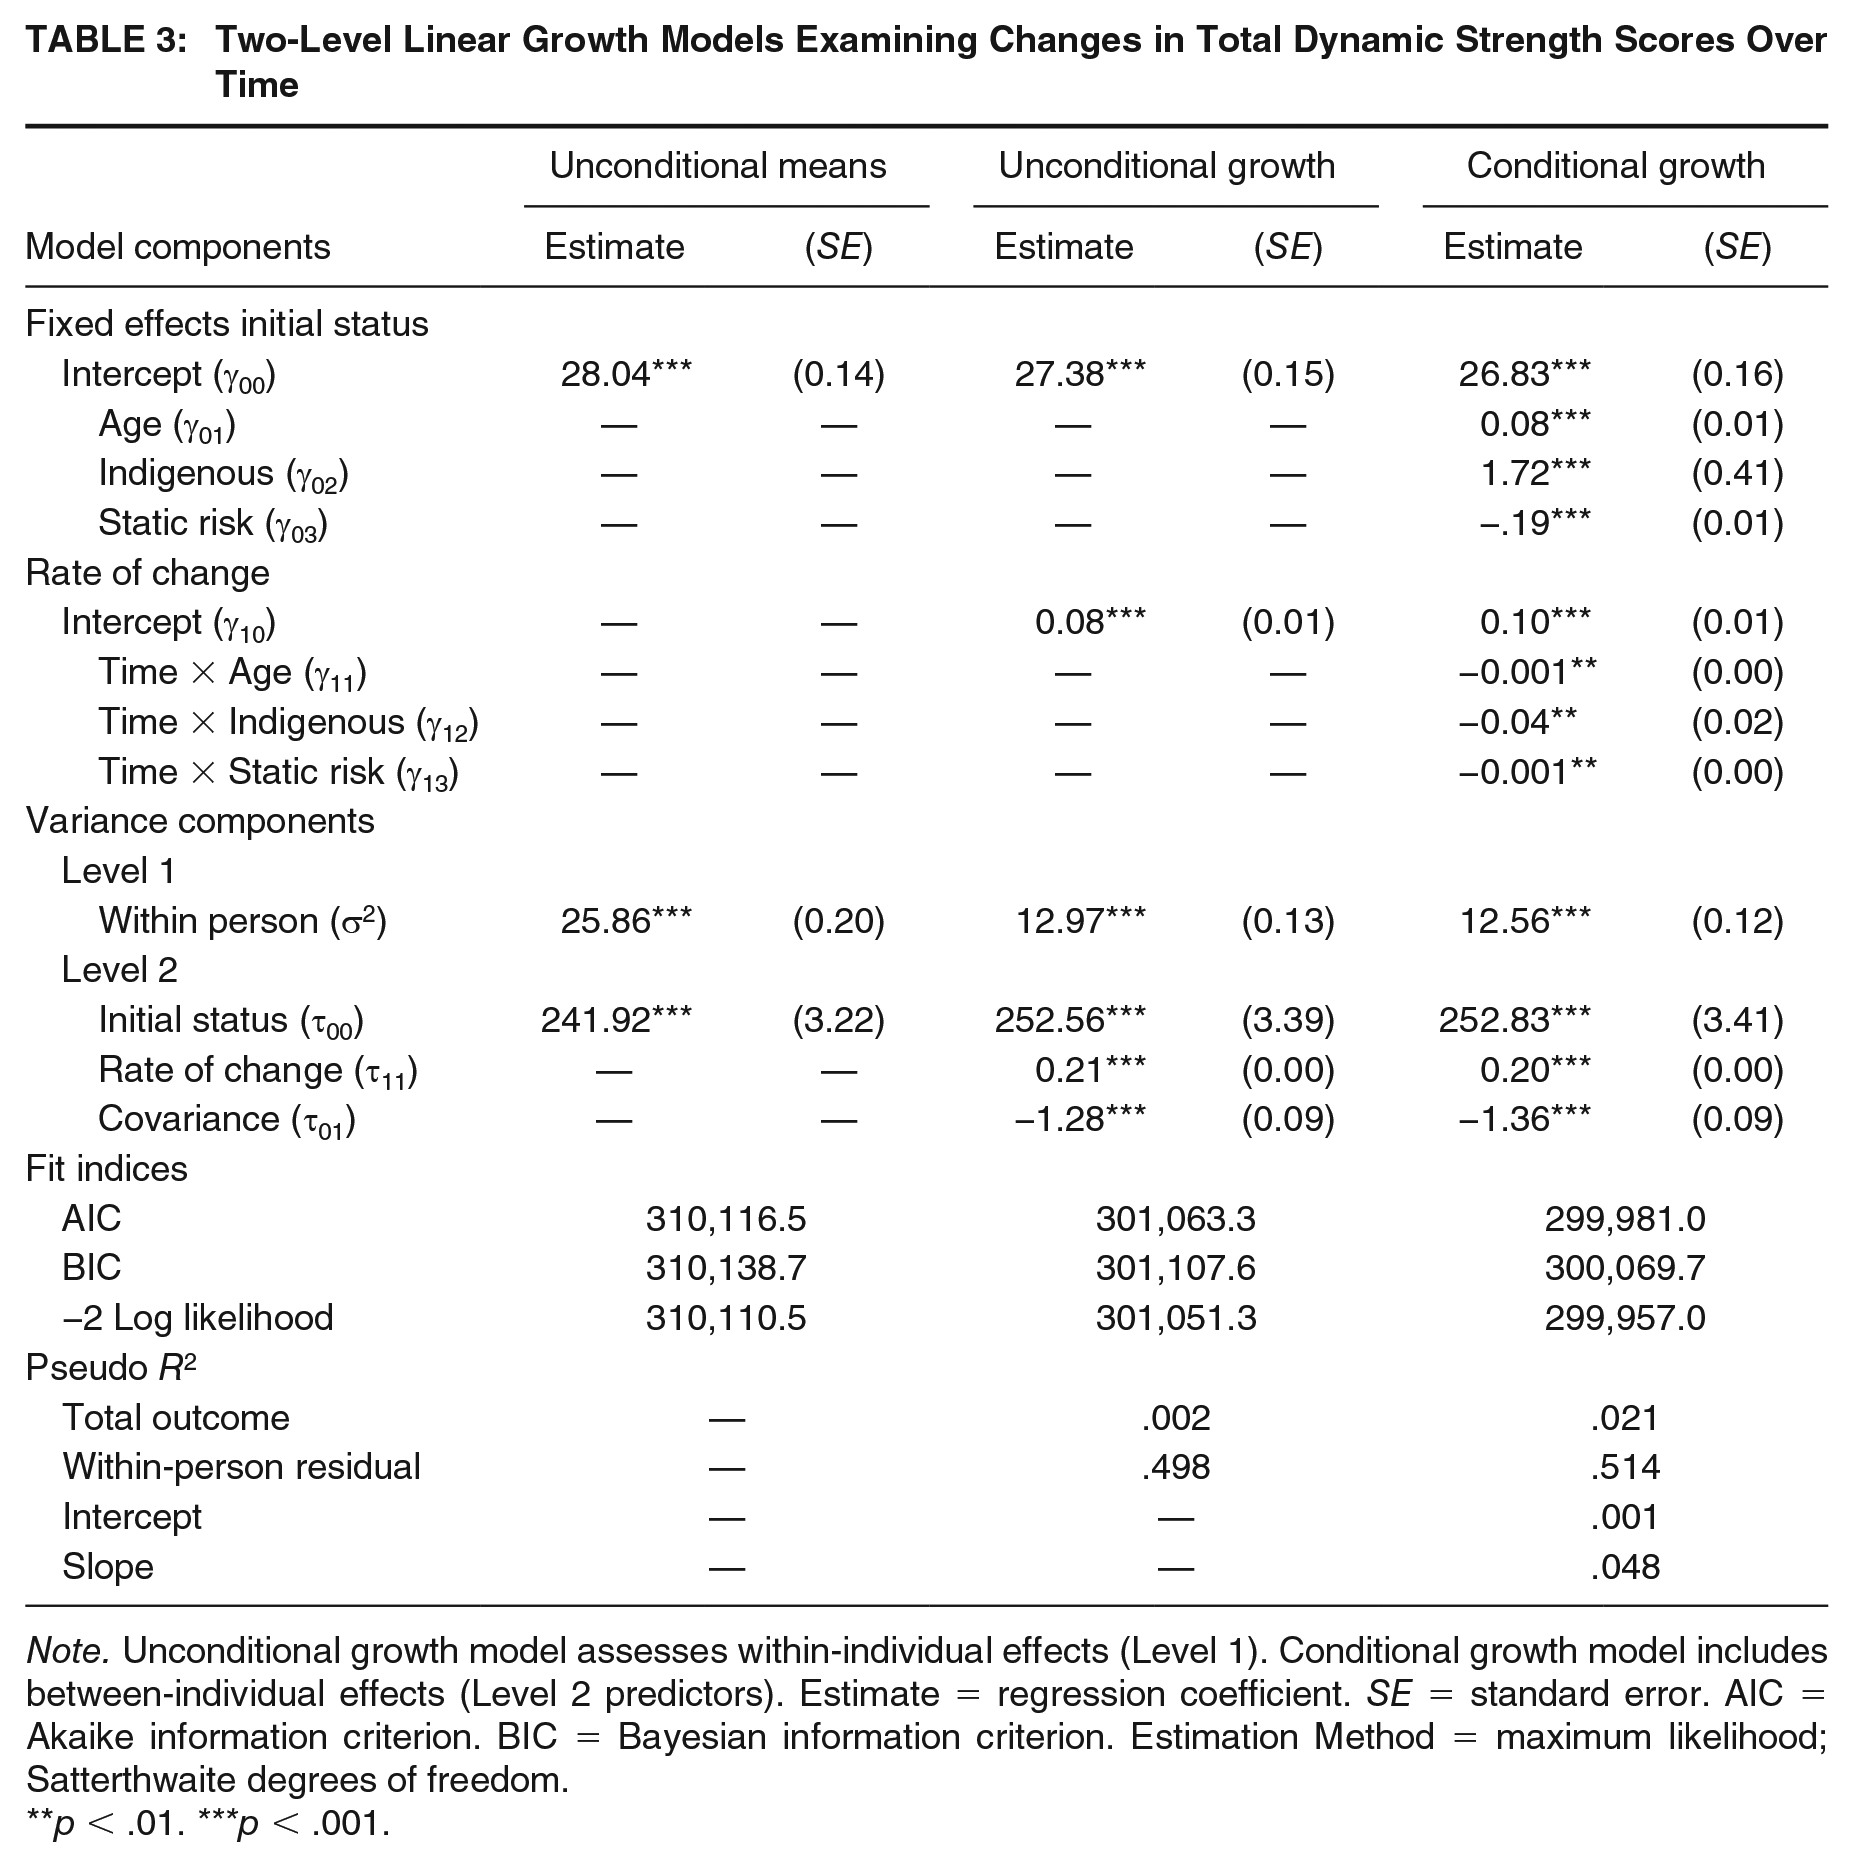
Note. Unconditional growth model assesses within-individual effects (Level 1). Conditional growth model includes between-individual effects (Level 2 predictors). Estimate = regression coefficient. SE = standard error. AIC = Akaike information criterion. BIC = Bayesian information criterion. Estimation Method = maximum likelihood; Satterthwaite degrees of freedom.
**p < .01. ***p < .001.
Unconditional Growth Model: Level 1 Change Over Time
As seen in Table 3, results indicated that, on average, the initial total dynamic strength score was 27.38 and the average rate of change was an increase in scores by .08 points per month. The variance in initial scores (τ00 = 252.56) and rate of change (τ11 = .21) were both significantly different from zero (p < .001), indicating that there was significant variability in initial total dynamic strength scores and in the rate of change on these scores. The covariance between initial score and change over time suggests that men with lower initial total dynamic strength scores evidenced a greater increase in scores over time relative to men with higher initial total dynamic strength scores.
Conditional Model: Variation as a Function of Level 2 Predictors
As seen in Table 3, initial total dynamic strength scores varied as a function of Indigenous status, age, and total static risk scores; however, the magnitude of this effect was greatest for Indigenous status whereby men who were Indigenous had significantly higher initial total dynamic strength scores than non-Indigenous men (28.03 vs. 25.61). However, Indigenous status was also found to influence change in total dynamic strength scores over time, and findings indicated that non-Indigenous men had total dynamic strength scores that increased at faster rates over time.
Pseudo R2 Results
As seen in Table 3, pseudo R2 results indicated that less than 1% of variance is explained by the unconditional growth model, whereas 2.1% of variance is explained by the conditional growth model. The proportion of within-individual variation explained by time was greater for the conditional growth model in comparison to the unconditional growth model. Adding Level 2 predictors was not found to explain unexplained outcome variation for the initial total dynamic strength scores, but was found to explain some unexplained outcome variation on change in total dynamic strength scores over time.
Using Change in Dynamic Risks and Strengths to Predict Outcome
Due to the large number of observations/large sample size, the parameter estimates could not be saved for the entire sample due to program constraints (i.e., insufficient memory of the statistical program). As such, a subsample of 3,845 men (13,800 observations) was included, which was the maximum number of observations that could be analyzed by the program. To ensure the random subsample was representative of the entire sample, potential differences were examined among the various predictor, covariate, and outcome variables. As seen in Table 4, no significant differences emerged, indicating the subsample was representative of the full sample.
Comparing the Subsample to the Full Sample of Justice-Involved Men Used for Analyses
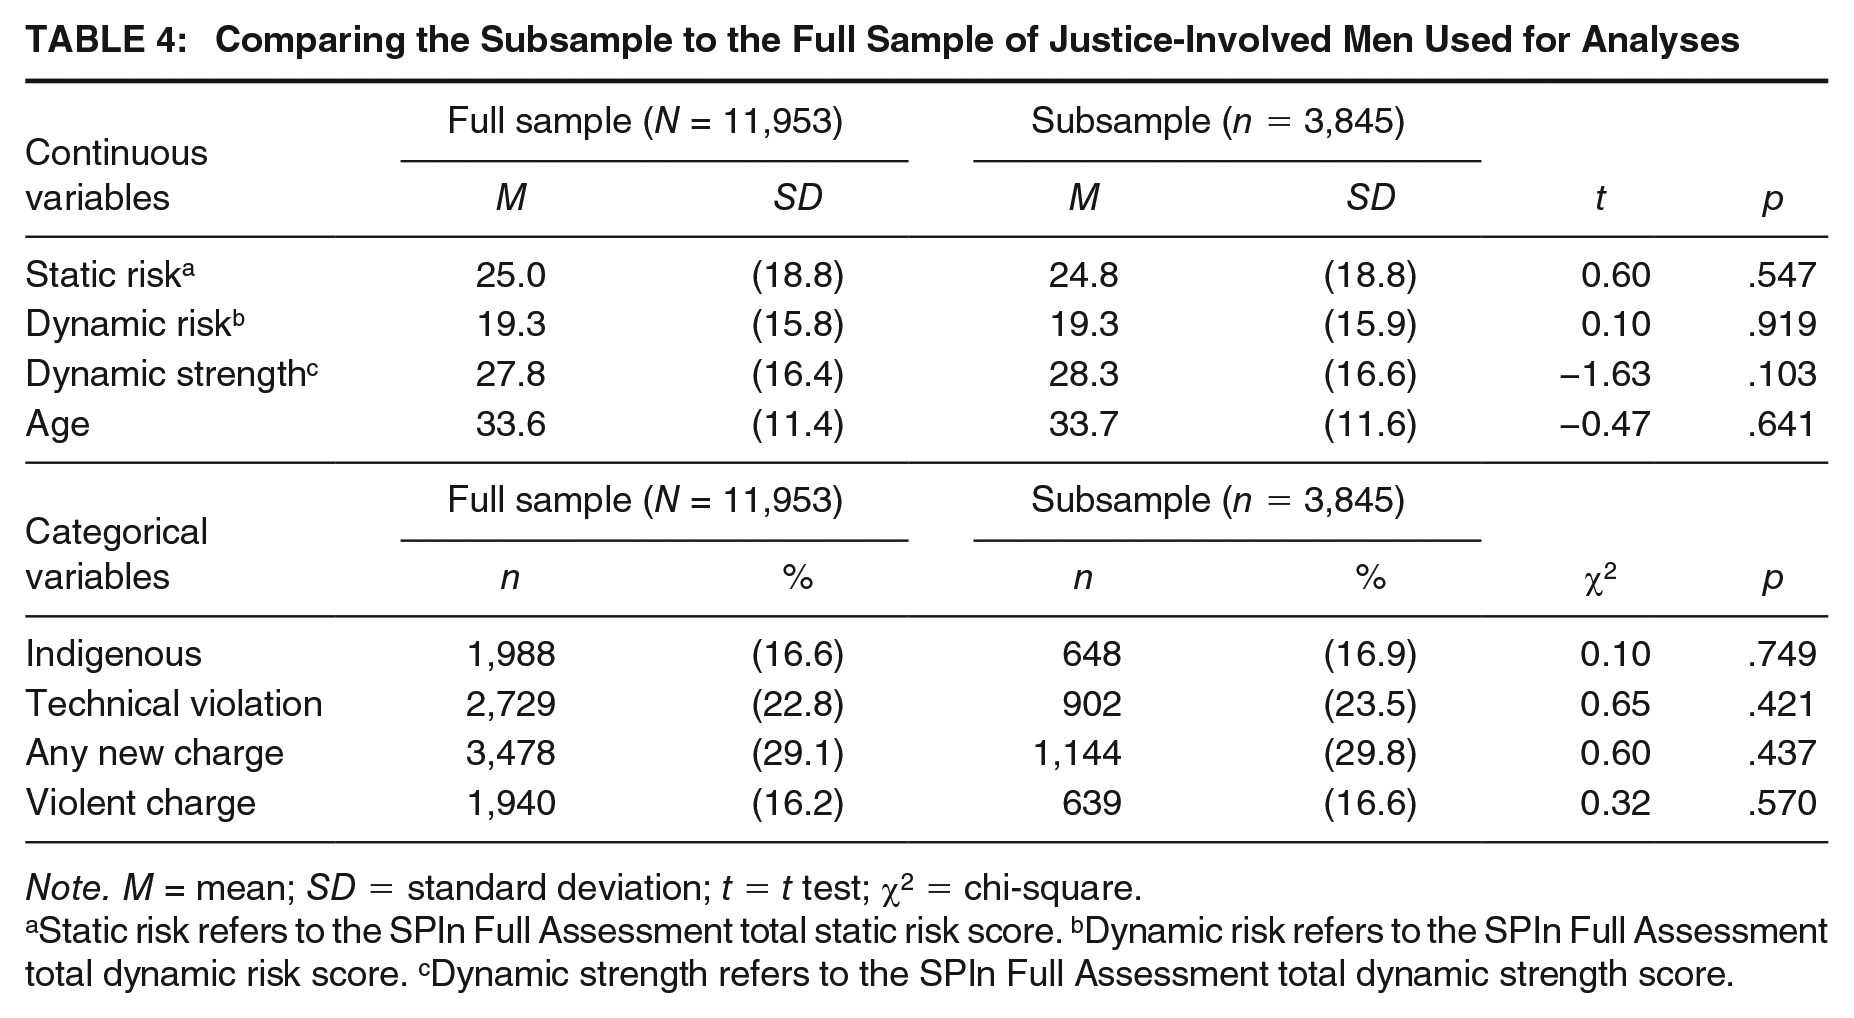
Note. M = mean; SD = standard deviation; t = t test; χ2 = chi-square.
Static risk refers to the SPIn Full Assessment total static risk score. bDynamic risk refers to the SPIn Full Assessment total dynamic risk score. cDynamic strength refers to the SPIn Full Assessment total dynamic strength score.
Logistic Regression Results—Total Dynamic Risk Scores
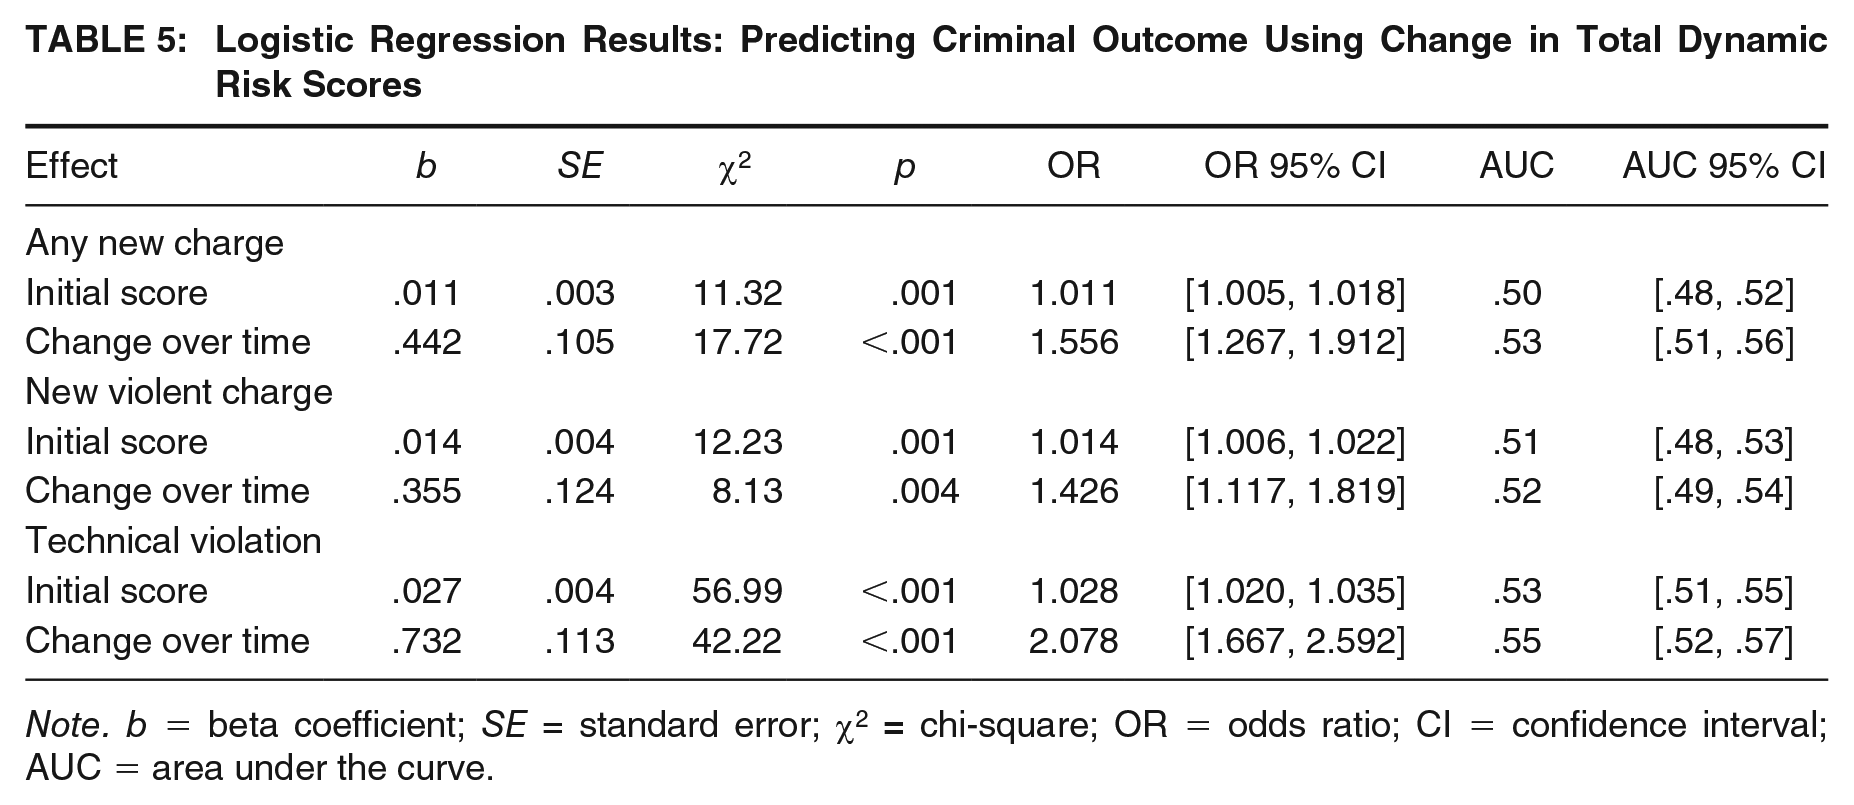
The results of the logistic regressions for each of the three criminal outcomes are presented below (see Table 5). Unfortunately, despite overall significant predictive findings, AUC results were poor, indicating that the initial scores and the change in scores on total dynamic risk were not adequate measures of discrimination for men on community supervision in terms of reoffending outcomes. The initial total dynamic risk score was a significant predictor of new charges (odds ratio [OR] = 1.011, 95% confidence interval [CI] [1.005, 1.018]), violent charges (OR = 1.014, 95% CI [1.006, 1.022]), and technical violations (OR = 1.028, 95% CI [1.020, 1.035]). Specifically, higher initial scores increased the likelihood of reoffending across all three outcomes. In contrast, change in total dynamic risk scores over time was a stronger predictor of any new charges (OR = 1.556, 95% CI [1.267, 1.912]), new violent charges (OR = 1.426, 95% CI [1.117, 1.819]), and technical violations (OR = 2.078, 95% CI [1.667, 2.592]). This indicates that increases in scores over time increased the likelihood of reoffending across all three outcomes.
Logistic Regression Results: Predicting Criminal Outcome Using Change in Total Dynamic Risk Scores
Note. b = beta coefficient; SE = standard error; χ2
Logistic Regression Results—Total Dynamic Strength Scores
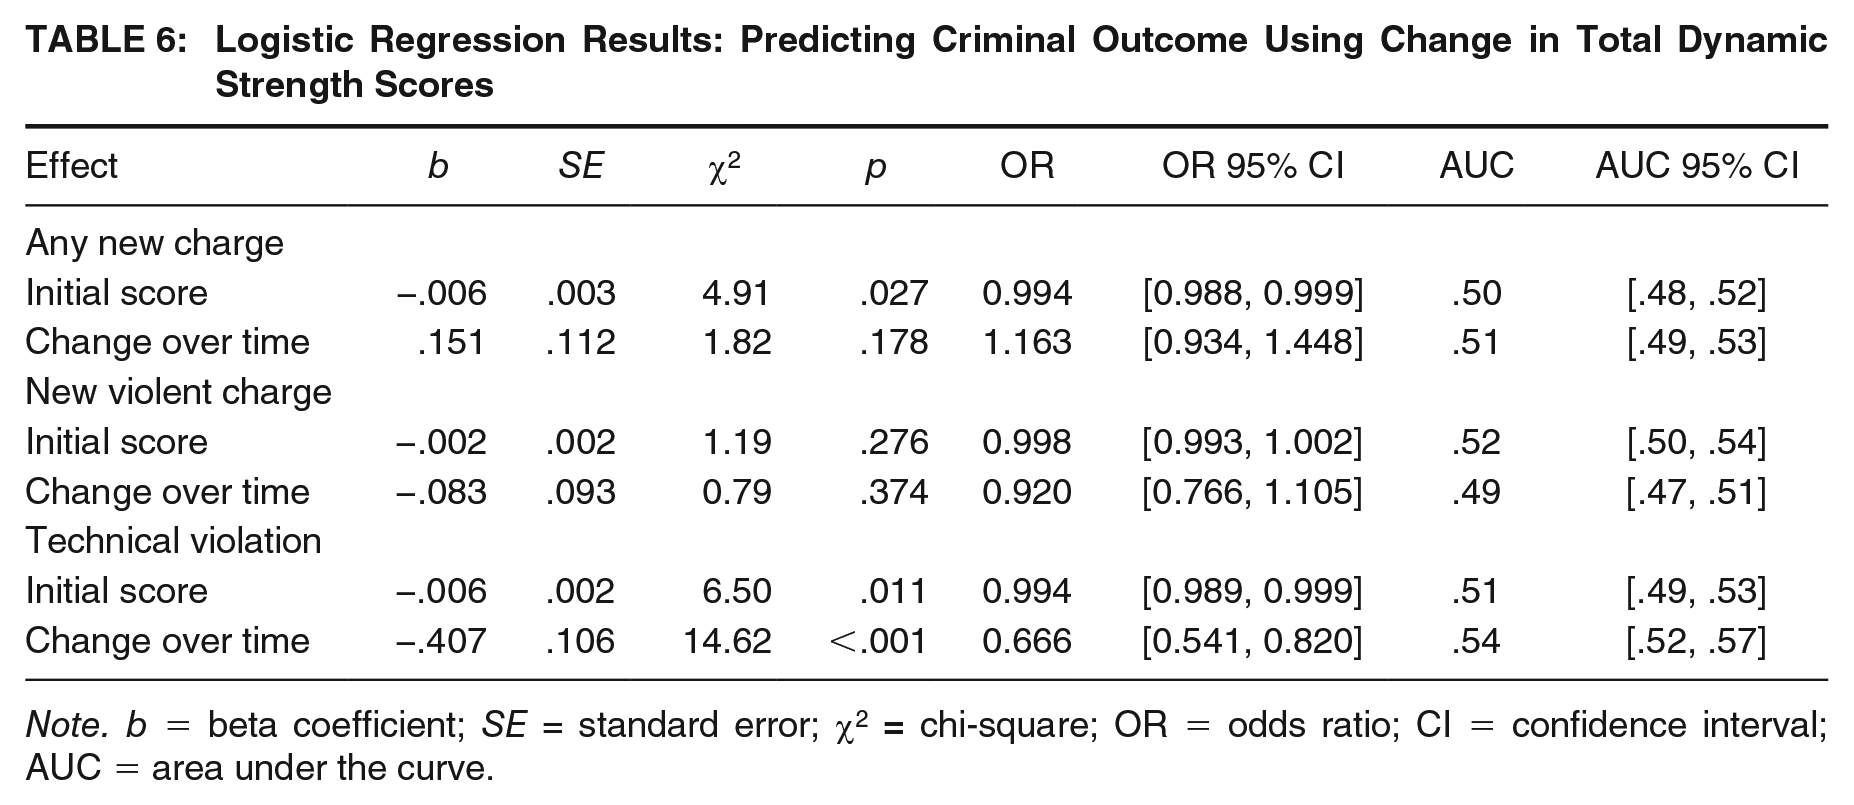
The results of the logistic regressions for each criminal outcome are presented below (see Table 6). Similar to the dynamic risk findings, AUC results were poor, indicating that the initial scores and the change in scores on total dynamic strength were not adequate measures of discrimination for men on community supervision in terms of reoffending outcomes. The initial total dynamic strength score was a significant predictor of any new charges (OR = 0.994, 95% CI [0.988, 0.999]) and technical violations (OR = 0.994, 95% CI [0.989, 0.999]). That is, those with higher scores were less likely to reoffend. The initial total dynamic strength score, however, did not predict new violent charges (OR = 0.998, 95% CI [0.993, 1.002]). In contrast, change in dynamic strength scores over time was a stronger predictor of technical violations (OR = 0.666, 95% CI [0.541, 0.820]), whereby increases in strength scores over time decreased likelihood of incurring a technical violation. However, change in dynamic strength scores did not predict new charges (OR = 1.163, 95% CI [0.934, 1.448]) or new violent charges (OR = 0.920, 95% CI [0.766, 1.105]).
Logistic Regression Results: Predicting Criminal Outcome Using Change in Total Dynamic Strength Scores
Note. b = beta coefficient; SE = standard error; χ2
Discussion
This study was one of the first to examine changes in dynamic risk factors and strength factors over time and examine how these changes are related to various criminal outcomes. To date, only three studies have assessed the dynamic nature of strengths and how these changes are related to offending outcomes (Davies, 2019; Hanby, 2013; Lloyd, 2015); however, strengths were measured using the DRAOR (Serin, 2007). Hanby (2013) used Cox regression to assess the incremental change among the various 12 timepoints and found that although strengths increased over time, these scores over time were not predictive of reconvictions. However, Lloyd (2015) assessed changes in strengths over time using a discrete-time hazard model and found that incorporating change in strength scores added to the predictive accuracy of assessing initial strengths scores over static scores alone. Given the lack of research on changes in both dynamic risk and strength scores and the predictive nature of these change scores, the current study aimed to address this gap.
Patterns of Change in SPIn-Assessed Total Dynamic Risk Scores
To assess patterns of change, HLM was used, and static risk score, age, and Indigenous status were included as covariates to explain variability in initial and change scores. Initial dynamic risk scores were related to static risk scores (i.e., those who had a higher static risk score had a higher initial dynamic risk score). Although not as influential as static risk, it was found that age influenced initial dynamic risk scores; that is, those who were younger had slightly higher initial dynamic risk scores than those who were older. The rate of change in dynamic risk scores over time was minimal. The biggest difference in rates of change on total dynamic risk scores was between Indigenous and non-Indigenous men, where non-Indigenous men had a slightly faster decrease in scores over time. Given that the total dynamic risk scores can range considerably, it was surprising to see that with every month that passed, the scores changed by only a fraction of a point. However, model results indicated that there was unexplained variance, indicating that model specification can be improved to explain the remaining variance.
One consideration is that change over time may be a biproduct of raters having more information about an individual’s needs and having a better sense of their true score on the risk assessment as time progresses. For instance, it is plausible that at the start of supervision, probation officers may have very limited information for rating all the SPIn items, and thus choose to rate cautiously until more information is gathered (Lloyd, 2015). This would indicate that change depicted in the findings is not reflective of true change, but rather a more accurate assessment rating of the individual’s risks. Furthermore, how a rater assesses a person may be dictated by whether the individual has committed a new offense or violated a condition of their release at other points of time. Or, if that person has been successful in the community for an extended length of time, a rater may be more likely to rate positively than if they had been successful for a much shorter time period. Jones and colleagues (2010) have also suggested that raters’ expectations of level of functioning may change as time progresses, thus how the items are rated may fluctuate, which could also impede the detection of genuine individual change. However, based on the results from the assessment of measurement invariance for the current study, this is not the case (i.e., same construct measured at each assessment period).
Patterns of Change in SPIn-Assessed Total Dynamic Strength Scores
Similar to the total dynamic risk scores, the results indicated that the rate of change for total dynamic strength scores was minimal. Age, Indigenous status, and static risk scores each significantly influenced initial total dynamic strength scores, although the most influential covariate was Indigenous status. That is, Indigenous men scored higher on initial dynamic strengths than non-Indigenous men. Static risk score, age, and Indigenous status also explained significant variability in changes in dynamic strength scores over time. Indigenous status, however, explained the most variability in change in dynamic strength scores, where the rate of change (increase over time) was slightly faster for non-Indigenous men.
The reasons for such gradual change for both total risk and strength scores could be due to a number of reasons, including the fact that a high proportion of the sample was made up of low-risk men. It could also be the case that probation officers are using scores from previous assessments to pre-populate SPIn scores input into the computerized SPIn software. Personal communications with the Programs and Policy Development unit from Alberta Justice and Solicitor General (January 28, 2020) indicated that the SPIn has a “carry-forward” function that can be used for re-assessments during a period of ongoing supervision. This allows probation officers to focus on the risk/needs/strength changes when re-assessing clients. While this function is useful for saving time for the probation officer, it may increase the likelihood of maintaining similar scores across timepoints. Furthermore, Bonta et al. (2019) found that the average caseload for probation officers in Alberta was 71 clients. Given the large caseloads and the large number of items to assess, it is probable that the pre-population function would be used frequently. Nonetheless, the current study found results that were comparable to other studies assessing change in dynamic risk and strength scores (e.g., Hanby, 2013; Lloyd, 2015).
Upon examining the pseudo R2 results, a large proportion of variance was explained by the variables included in the models—static risk, age, and Indigenous status. However, there may be additional variables that are pertinent to explaining the remaining variability in both the dynamic risk and strength models, such as probation officer conscientiousness or program information. A greater deal of variation was explained in the dynamic risk model, which indicates that the strength model may require additional variables that were not included in the current study, and these variables may be unique to the strength model.
Prediction Results
The second goal was to examine the predictive ability of change in dynamic risk and strength scores. Results indicated that both the initial dynamic risk score and the change over time in dynamic risk were predictive of all three criminal outcomes. However, the change over time in dynamic risk was a stronger predictor of each of the three criminal outcomes. These results align with the results of Brown et al. (2009), Davies (2019), Howard and Dixon (2013), Jones et al. (2010), and Lloyd (2015) who found that dynamic re-assessment information was predictive of recidivism over and above the predictive ability of initial dynamic risk scores. Although results demonstrated that change scores predicted various reoffending outcomes, they also indicated that the change scores either failed to discriminate or poorly discriminated those who reoffended from those who did not reoffend, and this was seen across all outcomes and for both risks and strengths. This is not entirely surprising, given that the amount of change was minimal, the effects were small, and the majority of the men were deemed low-risk, limiting the amount of variability in scores between those who reoffended and those who did not.
Results also indicated that the predictive ability of initial dynamic risk and change in dynamic risk scores was strongest for technical violations. As discussed in Lloyd (2015), dynamic risk scores may be most predictive of technical violations because the SPIn assessments can be rated by probation officers, who can also support a breach of condition. In other words, the supervising officer who is responsible for assessing an individual is, in some cases, also responsible for initiating a breach. Given that it is unknown how long a supervising officer was considering to support or initiate a technical violation for a client breaching his conditions, risk assessment ratings could potentially have been influenced by rater knowledge of the potential for non-compliance (Lloyd, 2015). However, because this knowledge is most likely to influence the more proximal SPIn assessment ratings, and since the change scores used in the current study are reflective of an average change rate of SPIn scores over time, it is unlikely that this is the sole reason for the relationship between change scores and technical violations. Furthermore, the initial SPIn dynamic risk scores were most predictive of technical violations, indicating that despite the argument that more proximal ratings are being influenced by the knowledge of an upcoming breach, there is evidence to suggest that SPIn assessments are accurately predicting technical violation outcomes. In contrast, initial strength scores were predictive of any new charges and technical violations, although the magnitude of these effects were extremely small. Specifically, men with higher initial strength scores were less likely to be charged with a new offense or a technical violation in compared with those with lower initial strength scores. Change in strength scores were only predictive of technical violations, whereby increases in strength scores over time decreased the likelihood of a technical violation.
Implications
True Dynamic Factors
According to Brown et al. (2009), to be considered truly dynamic, a factor should demonstrate significant change over time and should be significantly related to the prediction of recidivism. Results indicated that the total dynamic risk score can be deemed truly dynamic as it demonstrated significant change over time and predicted new charges, violent charges, and technical violations. In most cases, the change in scores was a stronger predictor of various criminal outcomes, in comparison to the initial assessment score.
Importance of Strengths
Although previous prospective research has found that strengths measured on the SPIn add incrementally to risk in the prediction of recidivism (Jones et al., 2015), this was the first study to use a multi-wave longitudinal design to examine the predictability of the initial assessment total strength scores and the change in total strength scores over time. Results indicated that initial strength scores were predictive of technical violations and any new charges; however, changes in strengths were only predictive of technical violations. As such, this may have practical implications on how to approach case management practices and community programming. Specifically, this highlights the importance of offering community strengths-based interventions and case management planning at the start of community supervision to assist with reducing the number of technical violations.
Indigeneity
Indigenous Peoples are vastly overrepresented in the criminal justice system in Canada. In the current study, at the time of the initial SPIn Full Assessment, 16.6% of men (n = 1,988/11,953) identified as Indigenous, in comparison to 6.5% of the general population in Alberta who identify as Indigenous (Malakieh, 2018). This overrepresentation may be due to the unique needs of Indigenous men—increased substance use, mental health issues, residential school experiences, intergenerational trauma, welfare involvement, family history of suicide, and extreme poverty and poor living conditions on reservations (Office of the Correctional Investigator, 2015). As such, it is important to consider how well items on the SPIn capture the unique circumstances around risk and need factors for Indigenous men. Future research is encouraged to examine how Indigenous men change over time on both dynamic risks and strengths that incorporate the examination of more culturally relevant factors.
Change-Related Research
Research is needed assessing how changes in risk and strength scores are related to various criminal outcomes, including reconvictions and sexual offenses. Given that the current study was not able to identify whether the most proximal assessment was the most predictive of future offending, research is needed to assess whether the last assessment prior to reoffending is the most predictive or whether there is a certain point in time where assessments no longer add incrementally to the initial change score (e.g., analyses using Cox regression survival analyses can help pinpoint incremental change between timepoints; Brown et al., 2009; Hanby, 2013). There are benefits to assessing incremental change in scores—namely, the ability to see how factors change from one timepoint to another, and the ability to determine which factors change rapidly (e.g., acute dynamic factors) versus those that change gradually (e.g., stable dynamic factors), which is useful for informing treatment and case planning. As such, research is also needed examining changes in specific dynamic domains (risks and strengths) to see whether there are specific areas that are most predictive of reoffending.
More research is needed assessing change in dynamic risk and strengths using the two-stage HLM approach. As discussed in Yang et al. (2017) this approach is not commonly used in conjunction with risk assessment data. Given that the current study was one of the first to use this approach to assess patterns of change and use that change to predict reoffending outcomes, future research is encouraged to continue to use this advanced statistical approach. The two-stage HLM can examine multiple reoffending outcomes and can examine how patterns of change differ for individuals, which cannot be assessed using Cox regression.
Limitations
Generalizability Concerns
The sample was comprised predominately of low-risk men. Upon reviewing the literature, Bonta (2009) found that treating high-risk cases resulted in an 11% reduction in recidivism whereas for low-risk cases, treatment resulted in a 3% reduction in recidivism. Low-risk cases should, thus, receive minimal services and limited contact with probation officers, as correctional interventions may be ineffective and may increase risk of reoffending (Cohen et al., 2016). As such, given that changes in low-risk men are found to be minimal, and given that the sample was predominately low-risk, the changes found in the current study align with previous research. In addition, this study used formal re-contact information with the province of Alberta as the reoffending outcome. This means that any contact with the criminal justice system in other provinces was not considered, nor were arrests and charges that did not result in convictions. The inclusion of this information may pose a more accurate depiction of negative outcomes and could potentially result in increased predictive accuracy, particularly among lower risk samples with lower base rates of re-contacts. Future research is encouraged to examine how change in SPIn scores is related to arrest outcomes, and how SPIn scores change among higher-risk cases to attain a better understanding of change among each level of risk classification.
Calibration of the SPIn
Given that risk assessment tools differ among provinces, comparability of rate of change, even among classification risk levels, poses challenges. For instance, in Alberta the median score on the SPIn is considered low-risk; however, the median score on the Saskatchewan Primary Risk Assessment (SPRA; Saskatchewan Ministry of Corrections, 2009) is considered moderate-risk (Bourgon et al., 2018). Moreover, the recidivism rates for those deemed high-risk on the SPIn do not align with the recidivism rates for those deemed high-risk on the Level of Service Inventory: Ontario Revision (LSI-OR; Andrews et al., 1995), indicating variability in what is meant by “high-risk” across jurisdictions (Bourgon et al., 2018). Given the variability between the SPIn and other risk assessment tools, future research should further examine the calibration of the SPIn. Classification levels can have many implications on justice-involved populations in terms of frequency of contact and access to programming. Ensuring that men classified as low-risk are in fact “low-risk” to reoffend is important for ensuring successful rehabilitation efforts.
Psychometric Data and Ability to Assess Change
Another limitation is the lack of psychometric data available for the SPIn. While there has been some research conducted on the validity and internal consistency of the SPIn, no research has been conducted on the interrater reliability of the tool (Jones & Robinson, 2018). Given that there is no information on whether scores are being assessed in the same way across probation officers, this may have affected the change results. In addition, whether the SPIn is discriminant (that is, whether the SPIn can adequately classify cases to low-, moderate-, or high-risk categories) is largely unknown; although research examining the predictability of the tool has indicated that individuals classified as high-risk are in fact more likely to reoffend, than those classified as low- or moderate-risk (Jones et al., 2015). More research is needed looking at the psychometric properties of the SPIn, especially among different subgroups of justice-involved individuals.
Due to the minimal amount of change over time for both the total dynamic risk and strength scores, another potential concern is the tool’s ability to measure true change. The current study was the first to assess change in SPIn scores. As a first step, measurement invariance was assessed to examine whether exhibited change over time was in fact true change or whether it was due to issues with the assessment’s ability to measure certain constructs over time. It was found that over time, the SPIn is measuring what it is intending to measure; however, this analysis was done at the domain level and should also be examined at the item level.
Sensitivity of Item Scores
Some SPIn items are measured on a poled Likert-type scale with the scores ranging from 0 to 2 for strength and 0 to 2 for risk. A score of 0 typically indicates a neutral score, whereas a score of 1 typically indicates that the item is “sometimes” or “somewhat” present, and finally a rating of 2 indicates that an item is “always present.” It may be that the SPIn is not sensitive enough to capture change or the probation officer does not have enough information to distinguish between a score of 1 and a score of 2 on items. Similarly, given that the SPIn comprises 90 items, it is entirely possible that there is not enough discrimination between items, thus affecting the tools sensitivity to detect change. Future research is encouraged to examine the factor structure of the SPIn, as well as identify the items that are deemed to explain the most variability in domain scores.
Regardless, to improve risk assessment accuracy, those who use the SPIn are provided with a detailed administration guideline manual that assists with scoring the risk assessment; raters use a semi-structured interview, along with file review information, to assist with gathering accurate and detailed information on the individual. Also, in contrast to other risk assessment tools who score items dichotomously (such as the Inventory of Offender Risk, Needs, and Strengths [IORNS]; Miller, 2006), having the SPIn items scored on a Likert-type scale, allows for more item variability. Orbis Partners suggest that scoring items on Likert-type scales enhances measurement sensitivity and increases a tool’s ability to quantify incremental change (Jones & Robinson, 2018). However, it is possible that additional scoring options (i.e., a larger Likert scale) would enhance the sensitivity of the tool, increasing variability in scores on the items.
Lack of Program Information
One final limitation is the lack of data on program information. Because program interventions were out of scope for the current study, potential reasons for individual change could not be examined. It would be worthwhile for future research to examine change in relation to completed programming to see how much correctional programming is influencing rates of change in dynamic risk and strength scores over time. In Alberta, programming is often completed by other areas of government or non-government organizations (Programs and Policy Development unit from Alberta Justice and Solicitor General, personal communication, January 28, 2020). As such, there may be differences among jurisdictions due to resources and client needs. Future research should examine whether there are jurisdictional differences in change on total dynamic risk and strength scores.
Conclusion
Despite the aforementioned limitations, this study was the first to use a rigorous statistical approach to assess change and prediction of SPIn-assessed dynamic risk and strength total scores. Results suggested that total dynamic risk scores decreased over time, as success in the community continued. Individuals with dynamic risk scores that decreased at faster rates over time were less likely to reoffend across all outcomes—technical violations, new charges, and any violent charges. In contrast, strengths increased over time as success in the community continued, and change scores were predictive of technical violations only. Overall, results demonstrated the utility of re-assessing dynamic risk and strength scores over time.
Footnotes
Authors’ Note:
The authors thank Orbis Partners Inc. and Alberta Justice and Solicitor General for providing access to SPIn and reoffense datasets. This article is based on Kayla Wanamaker’s doctoral dissertation (2020) entitled A Multi-Wave Longitudinal Examination of How Strengths and Risks Inform Risk Assessment and Treatment Profiles for Justice-Involved Men and Women Using the Service Planning Instrument (SPIn).