
Abstract
Despite calls for strength-focused approaches in juvenile justice, there is little research on the role of strengths in probation case management. This is one of the first studies to examine whether strengths function as specific responsivity factors as proposed by the risk–need–responsivity model, through mediating and moderating effects, and findings lend preliminary support to this conceptualization. In a sample of 261 justice-involved youth, the relationship between strengths and recidivism was found to be partially mediated by the service-to-needs match rate, even while controlling for risk—suggesting that strengths have an important indirect effect on recidivism through their impact on youth’s engagement in and completion of services. Strengths, however, did not moderate the relationship between service-to-needs match and reoffending, suggesting that appropriately matched services are essential irrespective of a youth’s strength profile. Research corroborating these findings and examining the feasibility of front-line use of strengths information is warranted.
Introduction
Beyond ensuring public safety, one of the main aims of youth criminal justice policy is rehabilitation: To help justice-involved individuals reduce and eventually cease offending (Bonta & Andrews, 2017). The risk–need–responsivity (RNR) framework is an empirically supported and widely implemented model of rehabilitation for justice-involved individuals (Andrews et al., 1990; Bonta & Andrews, 2017) that guides both risk assessment and case management. The risk principle posits that the intensity of services should match an individual’s risk level (i.e., higher risk individuals will receive higher intensity interventions; Bonta & Andrews, 2017). The need principle states that services should address risk factors empirically established as strong and direct predictors of reoffending; termed criminogenic needs, for youth, these comprise Antisocial Attitudes, Antisocial Personality Factors, Antisocial Peers, Substance Abuse, Family Dysfunction, Challenges in Education/Employment, and Inappropriate Use of Leisure Time (Bonta & Andrews, 2017). The responsivity principle asserts that services should focus on cognitive-behavioral and social learning strategies to maximize effectiveness (general responsivity) and should take personal characteristics into account (e.g., sex, culture, strengths), as these “regulate an individual’s . . . ability and motivation to learn” (specific responsivity; Bonta, 1995, p. 2).
The most common sanction for youth entering the justice system is a period of probation, and this is true for youth in both Canada (Statistics Canada, 2019) and the United States (U.S. Department of Justice, 2019). Research looking into the efficacy of probation services that follow the RNR model has found that matching probation services to youth’s individually identified criminogenic needs is linked to reduced reoffending, with higher proportions of met needs associated with significantly lower rates of reoffending (Luong & Wormith, 2011; Vieira et al., 2009); these findings lend support to the idea that probation and appropriate case management are important for supporting pathways out of crime. Unfortunately, it appears that overall, few criminogenic needs are successfully met over the course of probation, due to a combination of factors, including referral practices, service availability and accessibility, youth’s ability to engage in services, as well as the fact that youth generally present with a high number of identified needs (Peterson-Badali et al., 2015; Singh et al., 2014).
In addition to the focus on risk factors (i.e., criminogenic needs), growing interest in positive psychology and strength-based interventions has sparked calls to assess strength factors to enhance correctional practices. Indeed, critics of the RNR framework have argued that it suffers by focusing too heavily on deficits and could be improved by considering strengths alongside risk (Kleeven et al., 2020; Ward & Maruna, 2007). Strengths can be understood as personal and/or environmental characteristics that are associated with positive outcomes, such as desistance from offending. Although some scholars conceptualize strengths to include the weak pole of a risk dimension (e.g., not having antisocial peers; McAra & McVie, 2016; Stouthamer-Loeber et al., 2002), others assert that strengths must provide unique information (e.g., having prosocial peers) that cannot be inferred from the measurement of risk factors (Borum et al., 2006; de Vogel et al., 2009). Measures of risk and strength do tend to be moderately to highly negatively correlated (de Vries Robbé et al., 2011; Kleeven et al., 2020; Viljoen et al., 2020), which calls into question their utility in adding unique information to the prediction of risk (e.g., to reoffend, for violence). A systematic review conducted by Dickens and O’Shea (2017) found that while youth with higher scores on the protective factors section of a well-known risk assessment measure (Structured Assessment of Violence Risk in Youth [SAVRY]; Borum et al., 2006) were somewhat less likely to reoffend than other adolescents, there was no evidence that this measure improved the predictive accuracy over known risk factors. However, recent work (Chu et al., 2020; Kleeven et al., 2020) using a more comprehensive measure of strengths (Structured Assessment of Protective Factors for Violence Risk-Youth Version [SAPROF-YV]; de Vries Robbé et al., 2015) did find evidence for incremental predictive validity over risk factors.
Furthermore, predicting re-offense is not the only objective when working with justice-involved individuals. Understanding an individual’s strength profile may also contribute important information to the case management process (Viljoen et al., 2014) such that interventions may be more effective when youth’s strengths are considered—a perspective that is consistent with the conceptualization of strengths as specific responsivity factors (Bourgon & Bonta, 2014). Taxman (2014, p. 33) conceptualizes specific responsivity as operating at the individual level, noting that specific responsivity factors will “affect the likelihood of success in programming” where success refers to “short-term changes such as initiating treatment or engaging in treatment.” Bourgon and Bonta (2014) similarly assert that adherence to the responsivity principle would only distally affect reoffending; they suggest that research attempting to measure responsivity efforts should instead focus on client engagement in services (which might be operationalized as lower attrition rates, increased program attendance, or client participation) and client learning (which might be operationalized as client recall of information taught or client use of skills taught). Client engagement and learning is likely to result in “greater impacts on the treatment targets” (Bourgon & Bonta, 2014, p. 11; e.g., the criminogenic needs), which may then have an indirect effect on reoffending. To date, there is little empirical work in this area.
One of the only studies that has investigated using strengths in a juvenile justice treatment context, rather than in a risk prediction context, appears to be Singh et al. (2014). They examined how risk and strength factors were addressed in the treatment plans of 120 adolescents living in residential correctional facilities in the southern United States. Assessment information was gathered on both risks and strengths, with youth’s criminogenic needs addressed in service plans about 50% of the time, while strengths were addressed only about 25% of the time. Similar to the extant research on matching services to criminogenic needs (Luong & Wormith, 2011; Vieira et al., 2009), Singh et al. (2014) found that when service plans showed higher proportions of interventions matched to youth’s identified risks, the likelihood of externalizing behaviors decreased. Similarly, as the match between the number of identified strengths and the number of strength-based interventions increased, the likelihood of externalizing behavior decreased. Interestingly, neither relationship was significant for female justice-involved youth, although the female sample was very small (n = 24). Although this study provides preliminary evidence for the benefit of considering strengths when creating service plans, research on the effects of measuring and addressing strengths alongside risk, and in relation to reoffending, remains to be investigated.
The Present Study
In this study, we examined the relationships between measures of risk, strength, criminogenic needs, probation services, and recidivism in a sample of Canadian community-sentenced youth to further our understanding of the role of strengths in the rehabilitation process. Unlike Singh et al. (2014), we did not conceptualize strengths as treatment targets. Instead, we conceptualized strengths as specific responsivity factors (described above), and investigated two distinct models. First, we explored a mediation model: It was hypothesized that strengths would be associated with reduced recidivism (controlling for risk) and that this relationship would be mediated by service-to-needs match. In other words, based on the supposition that strengths function as factors that improve program engagement (Bourgon & Bonta, 2014; Taxman, 2014), we hypothesized that youth possessing a greater number of strengths would end up having a higher proportion of identified criminogenic needs met via services provided over the course of probation and that this would account at least in part for the reduced recidivism among these youth. We also examined whether the mean service-to-needs match rate differed based on the presence versus the absence of individual strength factors to determine the relative importance of specific strength factors. Second, we tested a moderation model: We examined whether strengths interact with service-to-needs match to predict reoffending. We hypothesized that strengths would moderate the relationship between service-to-needs match and reoffending, such that at higher levels of service-to-needs match, youth with a greater number of strengths would be even less likely to reoffend than youth with fewer strengths because of their enhanced ability to engage and, therefore, benefit from the services provided.
Method
Participants
Participants were 85 female and 176 male youths on probation who completed a court-ordered assessment at a youth forensic service in Toronto, Canada between 2001 and 2017. These assessments were completed to aid in sentencing decisions and youth provided consent for their information to be used for research purposes. To address the gender imbalance in sample size that characterizes many youth criminal justice studies, all consenting female youth were included in the sample as well as a random sample of male youth for whom data were available over the same assessment period. As Table 1 shows, youth were charged with index offenses that included violent offenses (e.g., assault, armed robbery), nonviolent offenses (e.g., theft, possession of a substance), or sexual offenses (e.g., sexual assault). Males were more likely to have a sexual index offense than females; there were no significant sex differences in age, race/ethnicity, rate of recidivism, or time to recidivism for those who did reoffend.
Demographic and Criminal Justice Variables for Total Sample and Separated by Sex
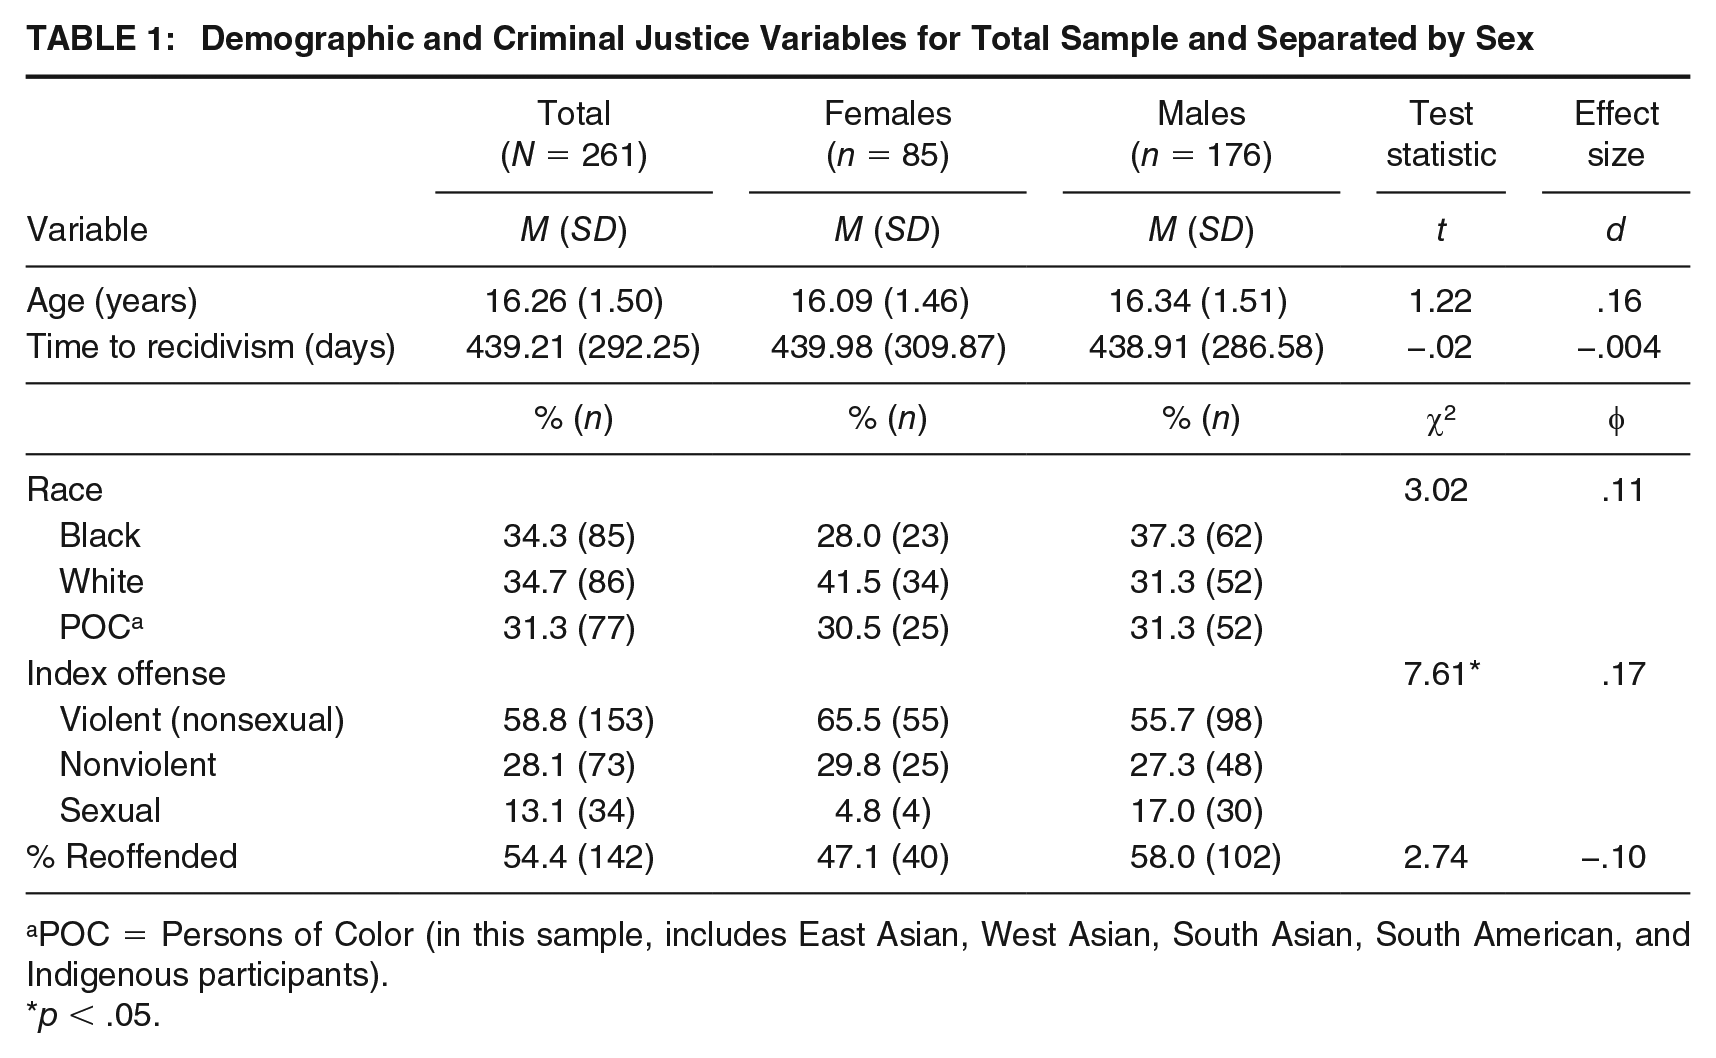
POC = Persons of Color (in this sample, includes East Asian, West Asian, South Asian, South American, and Indigenous participants).
p < .05.
Data Sources
Forensic Assessment Charts
Clinicians (psychologist, psychiatrist, or social worker) on the forensic team conducted comprehensive assessments with information gathered from multiple sources (youth, parents, collateral sources such as teachers and probation officers) and using multiple methods, including structured interviews, parent and youth questionnaires, and standardized tests. Based on this information, clinicians completed the Youth Level of Service/Case Management Inventory (YLS/CMI; Hoge & Andrews, 2002, 2011) to determine reoffense risk and criminogenic needs and to make intervention recommendations. Demographic (e.g., age, sex, and race/ethnicity) and offense information (e.g., type of charge leading to the assessment) and clinicians’ service recommendations were also obtained from the resulting comprehensive assessment reports. Youth’s assessment charts were reviewed by the first author to retrospectively code strengths using the SAPROF-YV (see “Measures” section).
Probation Case Notes
Following assessments, clinicians’ reports are provided to the court and shared with youth’s probation officers, who provide case management and coordinated services to address clients’ needs. Officers record supervision and case management information in electronic case notes that include entries on all communications with or about the youth, exchanges with collaterals such as parents, schools, or treatment centers, and system information such as time spent in detention or custodial settings. Probation case notes for each youth were obtained from the provincial youth justice ministry. Information obtained from case notes, which were coded for 3 years following assessment or until the date of a youth’s first reconviction, is described below (see “Coding Procedures” section).
Criminal Records
Information about reoffending was provided by a national police criminal record database (see “Coding Procedures” section).
Measures
Youth Level of Service/Case Management Inventory
The YLS/CMI is a standardized instrument that assesses youth’s criminogenic needs and risks to reoffend. It includes 42 items across eight subscales: Offense History, Family Circumstances/Parenting, Education, Peer Relations, Substance Abuse, Leisure/Recreation, Personality/ Behavior, and Attitudes/Orientation. Each item is coded as present or absent, and items are summed to create a total risk score (ranging from 0 to 42; Hoge & Andrews, 2002, 2011). Previous studies report moderate to strong internal consistency for total and subscale scores (Rowe, 2002; Schmidt et al., 2005); in the current study, we found moderate to strong internal consistency (α >.70) for all subscales except for leisure (α = .56). Significant correlations between the YLS/CMI and Child Behavior Checklist domain scores provide evidence for convergent validity (Schmidt et al., 2005). The predictive validity of the total risk score is well established for general and violent reoffending in juvenile populations (area under the curve ranging from .66 to .77; Bechtel et al., 2007; Olver et al., 2012; Onifade et al., 2008). The YLS/CMI was coded prospectively by clinicians at the assessment stage and the detailed scoring of the measure was available for each youth.
Structured Assessment of Protective Factors for Violence Risk-Youth Version
The SAPROF-YV is a structured professional judgment tool, designed to be used in conjunction with risk assessments tools, to measure protective factors for violence in justice-involved youth (de Vries Robbé et al., 2015). It is comprised of 16 items assessing various strength factors, including Social Competence, Coping, Self-Control, Perseverance, Future Orientation, Treatment Motivation, Attitudes toward Agreements and Conditions, School/Work, Leisure, Parents/Guardians, Peers, Other Supportive Relationships, Pedagogical Climate, Professional Care, and Court Order. Each item is typically rated on a 3-point scale (0 = absent; 1 = somewhat present; 2 = fully present), although an alternative 7-point scale also exists. Following the procedure used in previous studies (Bhanwer, 2016; de Vries Robbé et al., 2011), we used the 3-point scale and summed items to create a total strength score. However, because the medication item was rated as “not applicable” for more than 75% of the sample, this item was not included; possible scores, therefore, ranged from 0 to 30. There is evidence for strong internal consistency as well as convergent validity of the SAPROF-YV as evidenced by strong positive correlations with the SAVRY protective scale and negative correlations with the SAVRY risk scale (Bhanwer, 2016; de Vries Robbé et al., 2015; Kleeven et al., 2020). There is also some evidence of predictive validity, with the SAPROF-YV total score predicting minor verbal aggression (AUC = .82, p < .001) and minor physical aggression (AUC = .64, p < .01; Bhanwer, 2016), as well as violent and nonviolent reoffending (Chu et al., 2020; Kleeven et al., 2020).
In this study, the first author retrospectively coded the SAPROF-YV using information contained in the comprehensive clinical reports. Interrater reliability was assessed by having a trained research assistant code the SAPROF-YV for 20% of the sample. There was substantial interrater agreement as measured by linear weighted kappa computed for each item, mean kw = .79, ranging from kw = .63 (95% CI = .30, .96), p < .001 to kw = .90 (95% CI = .79, 1.0), p < .001.
Coding Procedures
Coding Services and Matching of Clinician-Identified Criminogenic Needs
Each of the seven YLS/CMI dynamic criminogenic need domains was coded as an “identified criminogenic need” if the clinician highlighted the need domain in the clinical summary or recommendation section of the assessment report. Where there was no mention of the need domain in these sections of the report, the need was coded as absent. Using a previously established coding system (Peterson-Badali et al., 2015; Vieira et al., 2009; Vitopoulos et al., 2012), for each identified criminogenic need domain, probation case notes were reviewed by the researchers to determine whether the youth received services from their probation officer or from community treatment providers that adequately addressed that need.
Consideration of both the quality (e.g., whether the service was evidence-based and delivered by trained professionals) and quantity (e.g., the length of the program and the frequency with which the youth attended) of the service was used to determine whether the need was adequately addressed; each identified domain was, therefore, rated as either 0 (inadequate match) or 1 (adequate match). For example, if Substance Abuse was identified as a need, a score of 0 was assigned if no substance use treatment was received or if the service only partially met the recommended quality (e.g., the service was drop-in peer support) or the recommended quantity (e.g., it was a 2-day workshop, or the youth attended fewer than 75% of sessions). A score of 1 was assigned if the youth received services related to substance use that was adequate in quality (e.g., a CBT program delivered by a registered counselor) and quantity (e.g., it was a 3-month program; the youth attended 75% of sessions or more). Similarly, if Leisure was identified as a need, a match score of 0 was assigned if no services were provided or if the service only partially met the recommended quality (e.g., unstructured program, such as using the recreation center gym) or the recommended quantity (e.g., drop-in program or the youth attended less than 75% of the time). A score of 1 was assigned if the youth received services related to leisure that were adequate in quality (e.g., PO secured funding for youth to attend organized and supervised basketball program) and quantity (e.g., program was offered weekly for several months and the youth attended at least 75% of the time).
A percentage match score (the “service-to-needs match”) for each participant was then calculated by dividing the total number of matched need domains (i.e., the number of identified criminogenic need domains adequately addressed during probation) by the total number of identified criminogenic need domains. For example, for youth whose assessment report identified five criminogenic need domains requiring service, if two of those domains were adequately addressed, the youth’s service-to-needs match score would be 2/5 or 40%. Percentage match can range from 0% to 100%. Service-to-needs match score is designed to capture both what the probation officer/community program provided and what the youth accessed to reflect real-life service completion. Interrater reliability for coding of service match was very strong (Landis & Koch, 1977), with a Cohen’s Kappa of .86 (p < .001).
Coding Reoffense Data
Criminal records were reviewed and any new conviction (including violent, sexual, nonviolent offenses, and technical violations) that occurred within a 3-year fixed period following the youth’s assessment was recorded as a reoffense. Criminal records were reviewed against the offense history summary in youth’s clinical reports to eliminate any offenses committed prior to assessment, but resulting in convictions following assessment due to delays in processing.
Results
Preliminary Analyses
Descriptive statistics for the key variables of interest were examined overall and as a function of sex (see Table 2). The sample was in the moderate risk range overall on the YLS/CMI, with few identified strengths on the SAPROF-YV measure. Females had significantly higher YLS/CMI total risk scores than males; however, the effect size was small (Cohen, 1988). No significant sex differences were observed for the SAPROF-YV total score, the number of identified criminogenic needs, or the overall service-to-needs match score. The mean service-to-needs match rate was relatively low, with youth having on average just over one third of their needs met over the course of probation.
Risk, Strengths, Needs, and Service-to-Needs Match for Total Sample and Separated by Sex
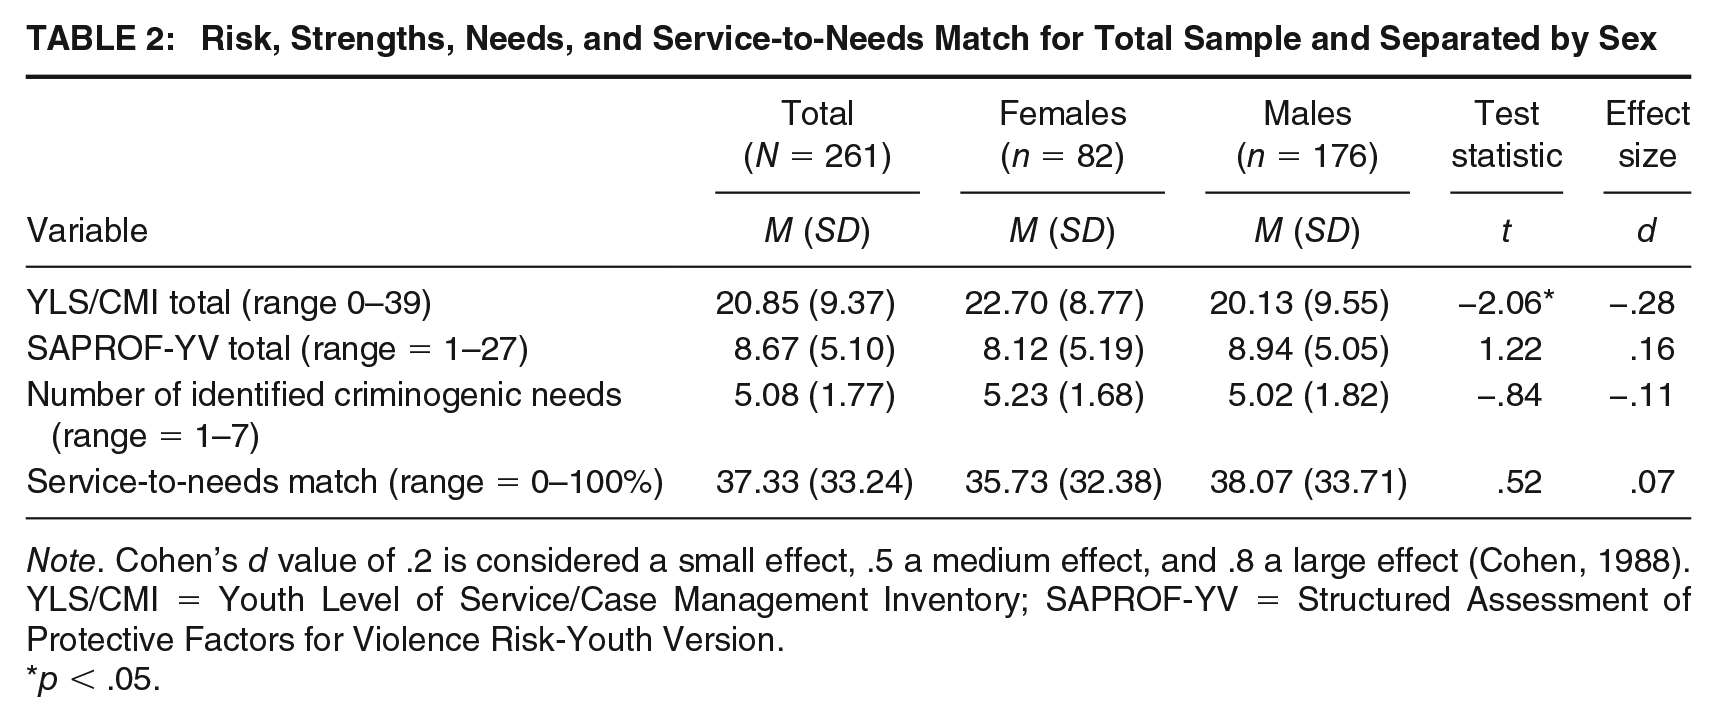
Note. Cohen’s d value of .2 is considered a small effect, .5 a medium effect, and .8 a large effect (Cohen, 1988). YLS/CMI = Youth Level of Service/Case Management Inventory; SAPROF-YV = Structured Assessment of Protective Factors for Violence Risk-Youth Version.
p < .05.
Correlations for the key variables were also examined using Spearman’s ρ due to the positively skewed strength data. Not surprisingly, the YLS/CMI risk score was robustly and negatively correlated with the SAPROF-YV (ρ = −.62, p < .01). Risk was negatively related (ρ = −.22, p < .01), and the strength measure positively related (ρ = .28, p < .01), to the service-to-needs match. The opposite was true for recidivism; while the risk measure was positively correlated with reoffending (ρ = .35, p < .01), the strength measure was negatively related to recidivism (ρ = −.29, p < .01). Finally, service-to-needs match and recidivism were negatively correlated (ρ = −.34, p < .01).
To investigate RQ1, a simple mediation analysis was performed using the PROCESS macro (Hayes, 2018) in SPSS. The outcome variable for the analysis was recidivism. The predictor variable was the SAPROF-YV total strength score. The mediator variable was the service-to-needs match score. Risk, as measured by the YLS/CMI criminal history domain score, was included as a control variable given its significant negative correlation with the outcome variable (r = −.29, p < .01). Criminal history was used rather than the YLS/CMI total score due to the considerable overlap between and YLS/CMI total score and the service-to-needs match score (which is in part derived from youth’s YLS/CMI dynamic criminogenic needs). Criminal history and total risk were robustly correlated (r = .66, p < .01), supporting criminal history as a valid proxy for total risk. The assumptions of linearity, independence, homoscedasticity, and normality were all met.
As Figure 1 illustrates, the path between strengths and service-to-needs match (direct effect; path a) was statistically significant (B = .02, SE = .004, p < .001), as was the direct path between service-to-needs match and recidivism (B = −1.72, SE = .47, p < .001; path b). The total direct effect of strengths on recidivism (without the inclusion of service-to-needs match; path c) was also significant (B = −.10, SE = .03, p = .001). As predicted, the direct effect of strengths on recidivism decreased with the inclusion of the service-to-needs match variable but remained statistically significant (B = −.07, SE = .03, p < .05; path c’). The indirect effect of strength on recidivism, via the mediator service-to-needs match, was tested using nonparametric bootstrapping. If the null of 0 falls between the lower and upper bounds of the 95% confidence interval, than the inference is that the population indirect effect is 0. If 0 falls outside the confidence interval, then the indirect effect is inferred to be nonzero and considered significant at the p < .05 level (Hayes, 2018). In this analysis, the indirect effect (IE = −.03) was statistically significant (95% CI = −.05, −.01). The effect size for a mediation analysis can be calculated with percent mediation (the percent of the total effect accounted for by the indirect effect; Hayes, 2018). In this analysis, the mediator could account for between a quarter and a third of the outcome (PM = .29), while strengths (direct effect) continued to account for approximately 70% of the recidivism outcome, while controlling for risk.
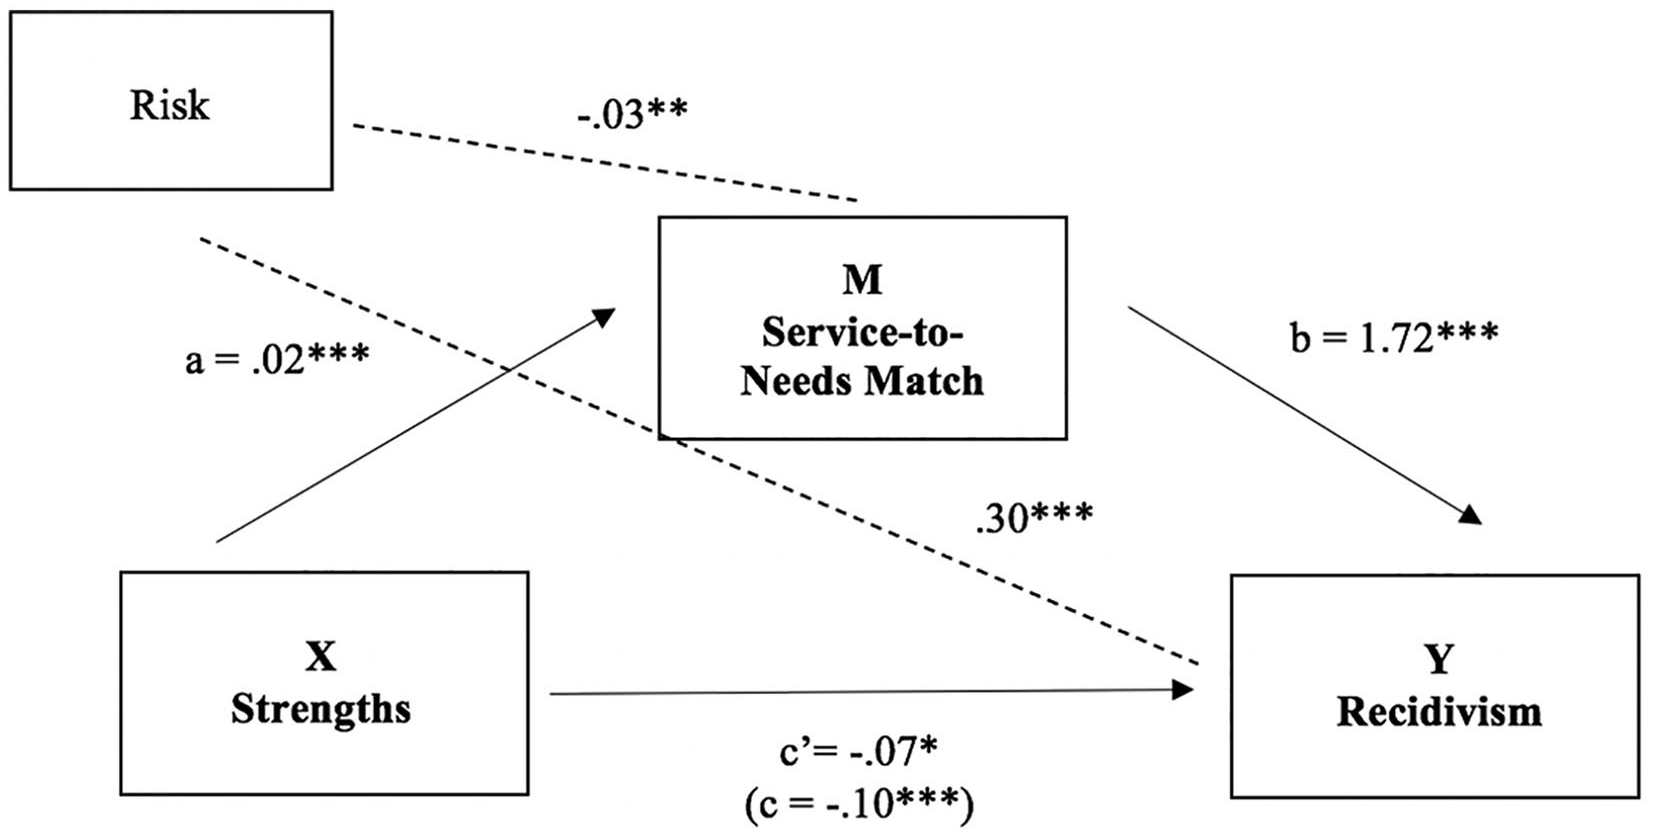
The Relationship Between SAPROF-YV Strengths and Recidivism as Mediated by Service-to-Needs Match While Controlling for Risk
To explore the relationship between strengths and service-to-needs match more closely at the level of individual strength items on the SAPROF-YV, a series of t-tests were conducted (see Table 3). For each SAPROF-YV item, we assessed whether the mean service-to-needs match score differed significantly between youth who possessed that strength and youth who did not. For many of the SAPROF-YV items, the mean service-to-needs match score did not differ significantly regardless of whether the strength was present or absent. However, medium effect sizes were found for Coping, Self-Control, and Positive Attitudes toward Agreements and Conditions on the SAPROF-YV; youth who displayed strengths in these areas had a greater proportion of identified criminogenic needs successfully targeted compared with youth who did not present with strengths in these areas. Significant differences in mean service-to-needs match scores—with small to medium effect sizes—were also found between youth who exhibited Social Competence, Perseverance, Motivation for Treatment, Commitment to School/Work, and who had Other Supportive Relationships and youth who did not possess strengths in those domains.
Differences in Service-to-Needs Match Mean Score by Absence vs. Presence of Individual Strength Items on the SAPROF-YV
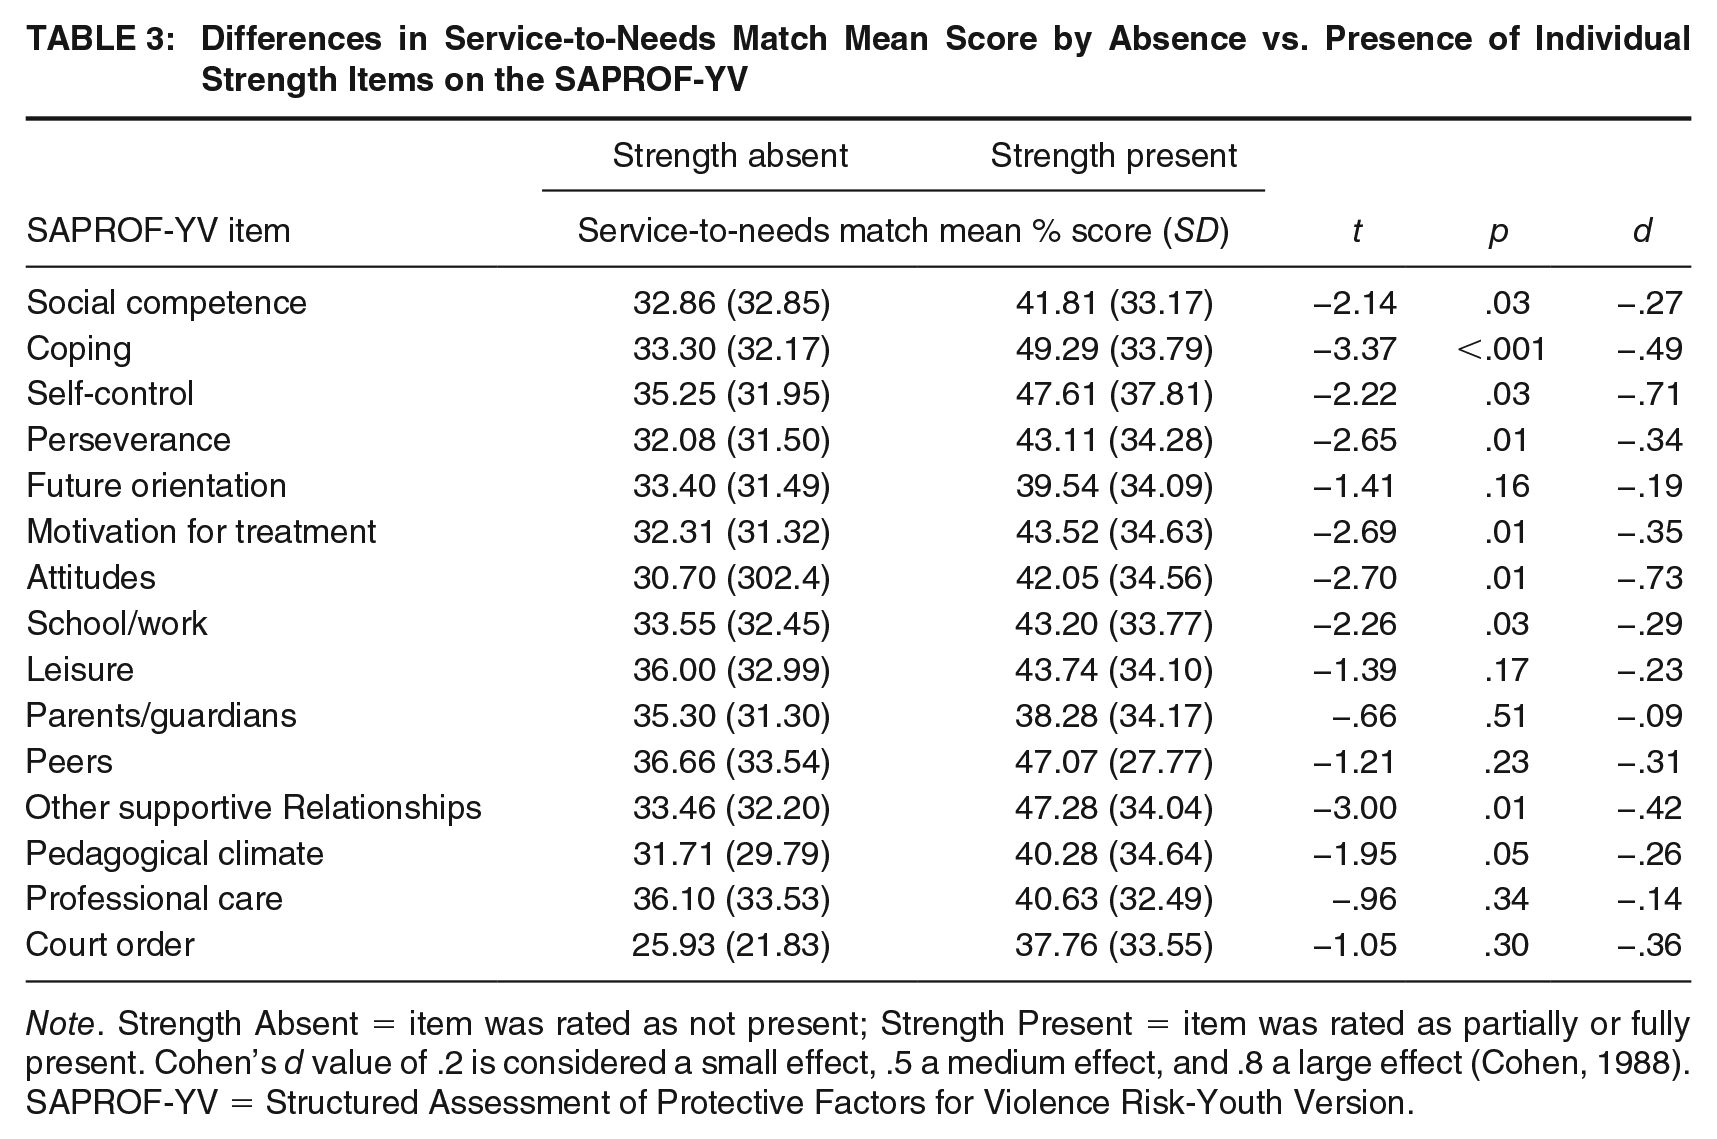
Note. Strength Absent = item was rated as not present; Strength Present = item was rated as partially or fully present. Cohen’s d value of .2 is considered a small effect, .5 a medium effect, and .8 a large effect (Cohen, 1988). SAPROF-YV = Structured Assessment of Protective Factors for Violence Risk-Youth Version.
RQ2 was investigated via hierarchical logistic regression (see Table 4). The assumptions of independent observations, little multicollinearity, and linearity of log-odds were met. Recidivism was the outcome variable. Criminal history and sex were included as control variables in Step 1, given their significant correlations with recidivism. Criminal history was used as a proxy for total risk for the same reasons outlined in the mediation analysis. The service-to-needs match and the strength total scores were then entered as predictor variables in Step 2. The inclusion of an interaction term (Service-to-Needs Match × Strength Total) was used in Step 3 to test for a moderation effect. Both the static risk score and sex were significant predictors of reoffending in each step of the analysis: Higher static risk scores and being male were associated with increased odds of reoffending. Strengths significantly predicted reoffending: for every one-point increase in the total strength score, the odds of reoffending decreased by 7% (odds ratio [OR] = .93). Matching services to identified criminogenic needs was also significantly associated with reoffending, such that the odds of reoffending were 6 times lower for every 1% increase in service-to-needs match score (OR = .17); while this appears to be a large effect, it should be interpreted with caution given the large confidence interval (.07, .43). As seen in Step 3 of Table 4, the interaction term was not significant, indicating that youth’s total strength scores did not moderate the relationship between service-to-needs match and recidivism. Unfortunately, given the sample size and inadequate power, we were not able to include a sex interaction term.
Hierarchical Logistic Regression Examining the Interaction Between Service-to-Needs Match and SAPROF-YV Strengths when Predicting Recidivism, Controlling for Risk and Sex
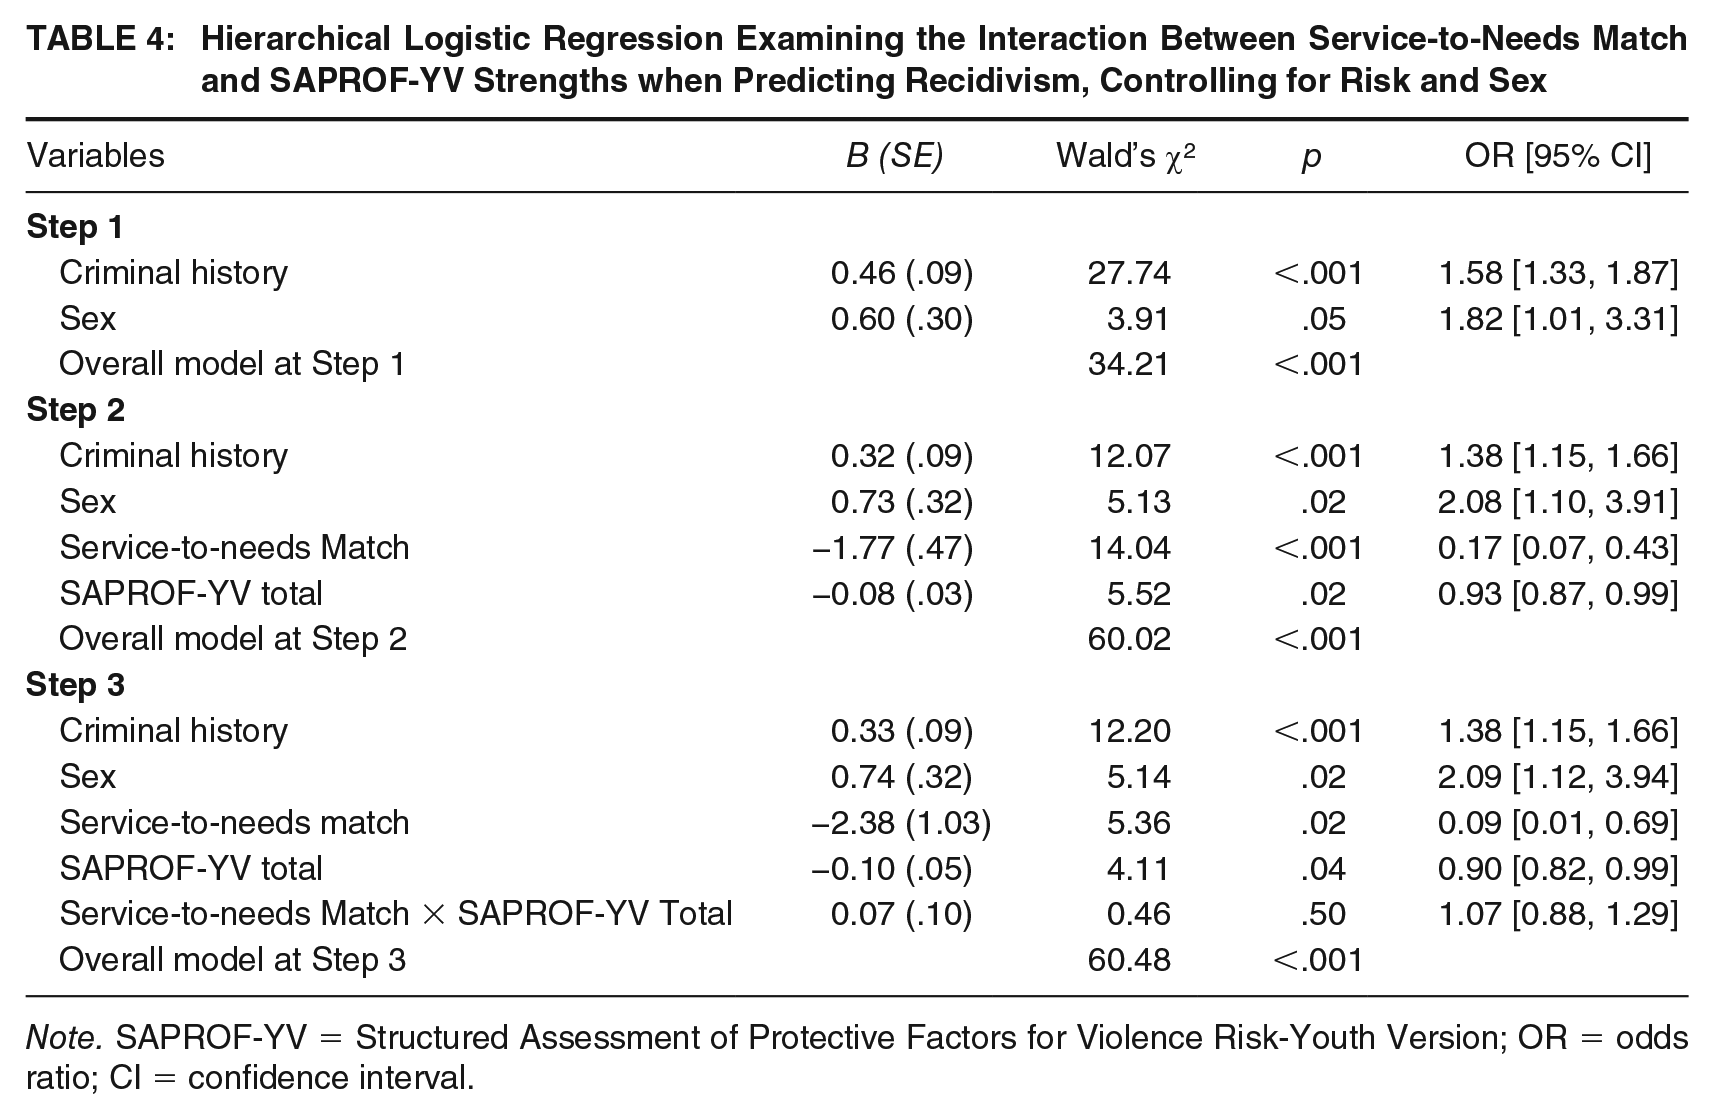
Note. SAPROF-YV = Structured Assessment of Protective Factors for Violence Risk-Youth Version; OR = odds ratio; CI = confidence interval.
Discussion
The current study examined strengths (measured on the SAPROF-YV) in relation to risk to reoffend, criminogenic needs, probation services (service-to-needs match), and recidivism to better understand how strength factors fit into the rehabilitation process and—specifically—whether they function as specific responsivity factors as defined by the RNR model. Participants in this study were justice-involved youth completing probation sentences; these youth scored in the moderate risk range (Myls/cmi = 20.85), presented with few strengths overall (Msaprof-yv = 8.67), and were identified by clinicians as possessing, on average, approximately five domains of need across the seven criminogenic need domains. Over the course of probation, participants were found to have just over a third of their identified needs addressed in treatment, adding to the literature indicating that many of youth’s needs are not being met through service provision (Kapoor et al., 2018; Singh et al., 2014). Interestingly, there were no significant differences between male and female youth with regards to mean strength, identified criminogenic needs, or service-to-needs match scores.
As hypothesized, results indicated that higher strength scores are associated with decreased odds of reoffending, even when controlling for risk, and that this relationship is partially explained by the mediating variable of service-to-needs match; in fact, service-to needs match accounted for approximately 29% of the variance in recidivism. This is the first study to our knowledge that has investigated this relationship and the findings point to strengths functioning as specific responsivity factors. In other words, as theorized by others (Bourgon & Bonta, 2014; Taxman, 2014), youth possessing more strength factors appear to have higher proportions of their criminogenic needs appropriately addressed over the course of probation and, consequently, are less likely to reoffend more than the next 3 years.
An investigation at the individual item level of the SAPROF-YV revealed that youth who were identified as possessing Social Competence, Coping, Self-Control, Perseverance, Motivation for Treatment, Positive Attitudes toward Agreements and Conditions, Commitment to School/Work, and Other Supportive Relationships had a significantly higher proportion of their identified needs met; the effect sizes for these differences ranged from small to medium (Cohen, 1988). These important individual strength items appear to represent factors related to personal motivation (i.e., Perseverance and Positive Attitudes toward Agreements/Conditions) and social support (i.e., Other Supportive Relationships), both of which have been highlighted as impacting treatment engagement and participation in the wider clinical literature (Mallinckrodt, 1992; Taft et al., 2004). Youth’s initial level of motivation has been noted as one of the strongest predictors of treatment completion (Taft et al., 2004), and the importance of collaborative goal setting for facilitating engagement and change has been emphasized in previous discussions around responsivity (Haqanee et al., 2015; Schwalbe, 2012).
It has also been proposed that strength factors function by moderating the effect of criminogenic needs treatment on reoffending (Bourgon & Bonta, 2014). However, our hypothesis, based on this conceptualization, was not supported; youth who had a greater proportion of criminogenic needs addressed were less likely to reoffend regardless of their strength score. This is the first study to examine this moderation effect, and the finding highlights the significant impact that appropriate, responsive, probation services can have on youth’s recidivism outcomes, regardless of youth’s personal characteristics.
These results emphasize two important considerations for the case management of justice-involved youth. First, the lack of evidence for a moderation effect in this study suggests that appropriately matching probation services to youth’s individually identified criminogenic needs is an essential component of rehabilitation for youth at any point along the strengths spectrum.
Second, it seems that the more strengths a youth possesses (and certain strengths appear particularly influential), the more likely that youth is to have a higher proportion of their criminogenic needs met via probation services (even when probation officers are not made aware of their strength profile) and, consequently, the less likely they are to reoffend 3 years later. This finding suggests that youth with more strengths have an advantage when it comes to achieving matched services, although how this advantage operates is not yet known. To ensure all youth, despite their number of strengths, are provided with and engage in criminogenic need services, there may be a need for youth justice system staff to focus additional attention on low strength youth to ensure these youth receive matched services—especially given that service-to-needs match appears beneficial to all youth. More research is needed to better understand whether the pinch point is ensuring that lower strength youth are referred to the appropriately matched service or provided with the support they require to appropriately engage in and complete that service.
One further consideration that was not investigated in this study but that warrants empirical investigation is the question of whether strength profiles could potentially provide information about how to tailor criminogenic needs-focused services so that youth are able to benefit to the full extent possible from those services. For example, a youth who possesses a strength in the domain of parents/guardians and who has an identified criminogenic needs of substance abuse might do best in family therapy to address the substance abuse concerns, compared with a youth with the same identified need but without a strength in that domain, who may benefit most from individual or group substance abuse counseling. In addition, building on youth’s strengths may remove specific barriers that would otherwise interfere with rehabilitation; a youth’s strength profile may, therefore, reveal important targets for preliminary service provision which would then prepare youth to make better use of criminogenic needs programming. Empirical investigation of these hypotheses would help inform practice implications.
de Vries Robbé and Willis (2017) have attempted to explicate different ways in which the consideration of strength factors can enhance clinical practice with justice-involved youth. Two of their suggestions are particularly relevant to the case management context. First, they highlighted that focusing attention on youth strengths “alter[s] the way in which frontline workers view and engage with those in the criminal justice system” (de Vries Robbé & Willis, 2017, p. 60). Intuitively, this makes sense but research evidence to this effect is lacking. One could hypothesize that youth with more strengths are easier to case manage and that, for this reason, probation officers may be especially motivated to ensure that these youth are provided with appropriate services. Furthermore, conducting structured strength assessments would likely highlight to probation officers the presence of youth’s strengths thereby potentially positively affecting the way probation officers and frontline workers manage the youth with whom they work. This has yet to be empirically investigated.
Second, these authors assert that “focusing on strengths in addition to risks also hold[s] promise for improving the therapeutic alliance” (de Vries Robbé & Willis, 2017, p. 60). Indeed, treatment alliance is found to be associated with behavioral change in justice system clients (Serran et al., 2003; Skeem et al., 2007). It is suggested that strength-focused assessments and collaborative goal setting offer clients a sense of hope and the promise of potential change; moreover, such an approach provides youth with the impression that the clinician thinks positively of them and believes in their capacity for change (Attrill & Liell, 2007); again, research is needed to examine whether strength assessments and collaborative goal setting are in fact associated with improved treatment alliance.
Limitations
This study relied on a retrospective chart review to determine youth strengths. Although retrospective file/chart review is consistent with the majority of research in this area to date (Campbell et al., 2009; Kleeven et al., 2020), such an approach does present challenges, and the prospective assessment of strength variables is recommended for future studies to improve the validity of the information collected (Viljoen et al., 2020). Furthermore, the sample size was relatively small and included many more males than females, limiting the feasibility of more complex analyses. Future research should examine whether the findings in this study apply to males and females in a comparable manner. This sample consisted of youth who were originally referred by a judge to a forensic mental health clinic for a comprehensive pre-sentencing assessment and, therefore, may not be representative of a general youth justice sample; the average risk score for youth fell in the moderate range and was comparable to the risk scores of custodial youth and higher than the average score for youth on community supervision (Hoge & Andrews, 2011). Finally, the youth’s service-to-needs match score was operationalized as service provision, which combines system-level variables (such as program availability) and individual-level variables (such as attendance). However, future studies should consider using different or multiple measurements of service-to-needs match, such as youth-completed questionnaires evaluating motivation/engagement, an assessment of skills gained from treatment, or probation officer-completed questionnaire to capture their referral decisions.
Concluding Thoughts
This study was one of the first to examine strengths in a probation case management context, and in relation to the RNR principle of specific responsivity, and as such makes an important contribution to the extant research. The findings provide initial support for the hypothesis that strengths function as specific responsivity factors—in particular, that strengths indirectly impact recidivism by influencing service-to-needs match. There is a pressing need for additional research examining strengths as specific responsivity factors and how this conceptualization might be transferred into practice. The small body of literature that has examined strengths in the youth justice context has focused on the role of strengths in offsetting (or protecting against) risk; results have largely failed to find support for this conceptualization of strengths as important contributors to risk prediction (Dickens & O’Shea, 2017), although more complex measures of strengths such as the SAPROF-YV will perhaps be more promising in this regard (Kleeven et al., 2020). Nevertheless, this study provides important preliminary evidence that strengths may be important for justice-involved youth—particularly in the rehabilitation and case management context—regardless of their role in risk prediction (de Vries Robbé & Willis, 2017; Taxman, 2014).
Footnotes
Sonia Finseth is now at the Eating Disorders Program South Vancouver Island, Child and Youth Mental Health, Ministry of Children and Family Development. The study was funded by the Social science and Humanities Research Council of Canada.