
Abstract
The current investigation was a prospective field validity study examining the discrimination and calibration properties of a general risk-need tool (Level of Service Inventory–Saskatchewan Youth Edition [LSI-Sk]) in a diverse sample of 284 court adjudicated youths, rated by their youth workers on the measure and followed up an average of 9.3 years. The overall risk level and need total demonstrated moderate predictive accuracy for general, violent, and nonviolent recidivism in the aggregate sample, although area under the curve (AUC) magnitudes fluctuated among gender and Indigenous ethnocultural subgroups. Variability in AUC values for the measure’s eight criminogenic need domains further reflected greater salience of certain needs among subgroups. Finally, clinician rated level of gang involvement incrementally predicted recidivism to varying degrees after controlling for overall risk and need. Implications for responsible use of risk assessment tools as part of individualized and gender/ethnoculturally responsive risk assessment practices with youth are discussed.
Risk and need assessment with justice involved youth serves important functions, such as evaluating recidivism risk to inform the intensity, priority, and foci of services to help prevent future justice system contacts. In Canada, the youth crime rate has declined over the last decade, with some noteworthy exceptions. In some provincial and territorial jurisdictions, such as Saskatchewan, youth crime has remained relatively consistent at more than double the Canadian average (Department of Justice Canada, 2016). Provinces such as Saskatchewan also have a particularly large overrepresentation of Indigenous youth involved in the justice system, a problem that is further compounded by the proportion of youth involved in street gangs (Tanasichuk et al., 2010). Across jurisdictions, however, there has been debate about the use of structured risk-need assessment measures with diverse justice involved youth (e.g., Indigenous peoples, females), and there has been even less formal structured evaluation of risk and need among gang involved youth. As such, this study endeavors to examine issues of sociocultural diversity (i.e., Indigenous ancestry, gender, and gang involvement) in the predictive properties of a general risk-need assessment tool on a sample of court adjudicated youth.
Although Indigenous persons, which include First Nations, Métis, and Inuit peoples, comprise less than 10% of the general Canadian population, they are overrepresented by approximately eightfold to tenfold in youth and adult corrections (Malakieh, 2018). Indigenous persons also tend to score higher on conventional risk measures, they are more frequently classified as high-risk, and they have higher rates of recidivism and returns to custody (Rugge, 2006). Arguments have been advanced that the item content of risk instruments capture variables that tend to be overrepresented among Indigenous persons owing to their social, historical, and contextual circumstances (e.g., racism, abuse, poverty), contributing to higher scores and poorer reintegration prognoses (Clark, 2019).
The applicability of risk instruments for females has also been questioned. Ongoing discussions and debates have frequently included two poles referred to as gender neutral versus gender specific with extant research arguably demonstrating a gender responsive middle ground (Olver & Stockdale, 2021). Thus, the use of conventional risk assessment tools with female youth and those of diverse ethnocultural backgrounds has been the focus of much discussion. Although such debates have captured both assessment and intervention approaches, this brief review focuses on risk assessment given the focus of the present study.
Level of Service Measures
The Level of Service (LS) measures refer to a collection of general risk-need tools developed for justice involved youth and adults, male and female. More than a dozen variants of the LS measures exist, a common thread being that the item content can be grouped around a collection of risk and need domains that Andrews and Bonta (2010) have termed the Central Eight: Offense History, Employment/Education, Family/Marital, Antisocial Peers, Drug/Alcohol Problems, Leisure/Recreation, Antisocial Attitudes, and Antisocial Pattern. The family of LS measures are the most frequently used risk instruments, with more than one million administrations annually worldwide (Luong & Wormith, 2011). These measures are designed to apply the risk-need-responsivity principles (Andrews & Bonta, 2010) by identifying the individual’s level of risk and profile of criminogenic needs to inform intervention, case management, and community supervision (Olver et al., 2014).
The first youth variant emerged in the form of the Youth Level of Service Inventory (YLSI; Andrews et al., 1984), and several others would follow including the Young Offender-Levels of Service Inventory (Shields & Simourd, 1991), and the most widely used, Youth Level Service/Case Management Inventory (YLS/CMI; Hoge & Andrews, 2003) along with its Screening Version (YLS/CMI-SV; Hoge & Andrews, 2001). Jurisdiction-specific variants of the LS measures have also been developed with generally the same content and structure as the family of LS tools, such as the Level of Service Inventory–Ontario Revision (LSI-OR; Andrews et al., 1995), which served as a pilot version for the Level of Service/Case Management Inventory (LS/CMI; Andrews et al., 2004) and the Level of Service Inventory–Saskatchewan Youth Edition (LSI-Sk; Andrews et al., 2001).
Olver et al.’s (2009) meta-analysis of youth measures included variants on LS, including the YLS/CMI and the LSI-Sk, over a mean follow-up time of 28.4 months. The LS youth variants had strong predictive validity for violent (rw = .26, k = 9, n = 1,995), nonviolent (rw = .29, k = 3, n = 520), and general (rw = .32, k = 19, n = 5,722) recidivism. Although prediction of general (i.e., any recidivism) was highest (consistent with the purpose of the tool), each effect size would be classified as broadly moderate (rpb = .24–.36) in magnitude (Rice & Harris, 2005). Subsequently, Olver et al. (2014) conducted an updated meta-analysis of all LS variants that examined sources of variability in predictive accuracy, finding that the YLS/CMI, specifically, had strong predictive accuracy for violent (rw = .23, k = 13, n = 2,916) and general (rw = .28, k = 30, n = 15,447) recidivism. Additional lines of research have examined how these findings may be moderated by gender and ethnocultural considerations, with implications for the use of the LS measures among diverse youth groups.
Diversity Considerations in Risk-Need Assessment With the LS Measures
Ethnocultural Heritage
Meta-analyses of the LS measures have broadly demonstrated significant predictive accuracy for recidivism among ethnocultural minority and nonminority groups. Olver et al. (2009) found youth variants of the LS scales to have moderate to high predictive accuracy for general recidivism for both Indigenous (rw = .35, k = 5, n = 860) and non-Indigenous (rw = .32, k = 5, n = 462) youth. Olver et al. (2014) further found the LS measures (youth and adult combined) had significant and comparable predictive accuracy among Indigenous (rw = .30, k = 13, n = 5,354), Asian (rw = .32, k = 4, n = 2,299), and Black (rw = .32, k = 8, n = 3,790) samples, and slightly but significantly lower predictive validity magnitudes for U.S. Hispanic persons (rw = .22, k = 6, n = 3,288).
Gutierrez et al. (2013) conducted a meta-analysis on the predictive validity of the Central Eight risk factors for justice involved Indigenous youth and adults for general and violent recidivism. Each of the Central Eight risk factors significantly predicted general (d = .19–.56) and violent recidivism (d = .11–.45) for Indigenous persons, although Criminal History (ddiff = –.24), Alcohol/Drug Use (ddiff = –.16), and Antisocial Pattern (ddiff = –.24) had significantly higher predictive accuracy for non-Indigenous persons with respect to general recidivism (Gutierrez et al., 2013). There were no significant differences in predictive validity for violent recidivism between Indigenous and non-Indigenous groups. Wilson and Gutierrez (2014) subsequently used meta-analysis to examine the predictive accuracy of the LS risk-need domains and total scores for recidivism as a function of Indigenous group membership. Although the LS need domains had significant predictive accuracy for general recidivism (ds = .24–.57), as did the total score (d = .62), five domains had significantly higher predictive accuracy for non-Indigenous persons (Criminal History, Employment/Education, Companions, Alcohol/Drug, Procriminal Attitudes, Antisocial Pattern).
Gender
Olver and Stockdale (2021) conducted a meta-meta-analysis of LS meta-analyses that have examined predictive accuracy of LS scores and need domains for recidivism as a function of gender in youth and adult samples. Aggregating five meta-analyses (Olver et al., 2009, 2014; Pusch & Holtfreter, 2018; Schwalbe, 2008; Smith et al., 2009), variants of the LS scales demonstrated medium to high predictive effects for general recidivism for both male (median r = .30, k = 4–80, n = 772–77,920) and female (median r = .31, k = 3–45, n = 204–17,802) samples, and medium effects for violent recidivism (male, median r = .24, k = 4–45, n = 974–28,406; female, median r = .26, k = 4–12, n = 350–8,810).
These lines of research have also provided evidence for some need domains to have gender salience (i.e., be uniquely predictive or informative), such as Substance Use and the Personal/Emotional domain for females. For instance, Andrews et al. (2012) found that Alcohol/Drug was more predictive of female youth recidivism and suggested that female youth should have a Big Five (i.e., the Big Four criminogenic needs—Criminal History, Attitudes, Peers, and Antisocial Personality—plus Alcohol/Drug). In all, the extant research provides support for using the LSI with female populations as well as the existence of gendered pathways into crime.
Risk-Need Assessment and Gang Affiliation
The existing research has demonstrated gang membership in and of itself to be criminogenic, as a particularly serious exemplification of antisocial peers from the Big Four and Central Eight. For instance, a Quebec study of street gangs found gang affiliated men had higher scores on the LS/CMI and most of the Central Eight, and they were more frequently classified as very high-risk, and had higher rates of recidivism compared with non-gang members (Guay, 2012). Youth gang activity has been a social concern across Canadian provinces that has generated policing, justice, and correctional system responses. For instance, a Saskatchewan-based evaluation of 540 justice involved youths further found 16% of the youth to be gang affiliated, of whom 81.5% reoffended over a 2-year follow-up (Baum, 2012). A British Columbia based intervention program found that 95% of youth identified as gang involved were classified as moderate- or high-risk on the YLS/CMI (Public Safety Canada, 2012). Elsewhere, internationally, in a Singaporean sample of 165 justice involved youths, Chu et al. (2011) found gang and non-gang involved youth to have similar criminogenic profiles on the YLS/CMI. Further analyses on this sample by Chu et al. (2012), however, found that gang affiliated youth had higher YLS/CMI total scores as well as significantly higher rates of violent and general recidivism, compared with non-gang involved youth. Thus, consistent with findings on adult samples, there is evidence to suggest that gang involved youth present with higher levels of criminogenic risk-needs and rates of criminal recidivism.
Archival Retrospective Versus Prospective Field Evaluations of Risk and/or Need Measures
A final consideration that transcends issues concerning the psychometric properties of risk and/or need measures among special and diverse populations is the notion of field validity and reliability. Valuable inroads have been made from retrospective archival research examining the validity and reliability of risk/need measure ratings scored by trained raters via comprehensive file review, and in turn, linking these ratings to recidivism outcomes. The practice, however, does not reflect how tools are implemented in field settings (e.g., probation, justice, forensic mental health), by frontline service providers who may vary in terms of training, scoring fidelity, case loads, and experience. Issues such as rater drift, incomplete information, and a scarcity of time and resources can all impact rating quality and accuracy. This situation underscores the value of true prospective field evaluations of risk and/or need tools as they are implemented in the field. The critical importance of this issue led Edens and Boccaccini (2017) to devote an entire special issue of Psychological Assessment to the matter of field validity and reliability, or what they collectively termed “field utility.”
This Study and Rationale
The present investigation sought to build on previous work to examine the predictive properties of general risk-need tools (vis-à-vis the LSI-Sk) as a function of gender, Indigenous group membership, and gang affiliation. First, previous investigations of the LSI-Sk have only examined general recidivism as a single outcome variable, and only in the short-term (i.e., less than 2 years), and often without controlling for length of follow-up. Accordingly, this study examined the predictive properties of the LSI-Sk for additional recidivism outcomes (e.g., violent) over multiple follow-ups while controlling for variability in length. Second, most prior research examining the predictive properties of risk-need tools as a function of gender or Indigenous membership have done so at a broad, aggregate level; as such, this study examined the properties of the LSI-Sk within male and female Indigenous subgroups. Third, results of meta-analysis suggest that criminogenic need domains may have differential relevance and/or salience as a function of gender (Olver et al., 2014) or Indigenous group membership (Gutierrez et al., 2013). This had tended to be underexplored in diverse samples of justice involved youth, and so this study explored with respect to the LSI-Sk.
Fourth, there is a need for greater field validity research for risk assessment tools in general, including local validation of a tool such as the LSI-Sk that is implemented province wide. As such, this study is a true prospective examination of the LSI-Sk as administered in the field. Relatedly, this study examined the calibration properties of the LSI-Sk (i.e., rates of recidivism associated with LSI-Sk risk levels). New metrics, such as the E/O index, are applied to compare recidivism rates observed at different LSI-Sk risk levels with those expected from the original normative sample (Rector et al., 2007). Beyond the LSI-Sk, the use of the E/O index methodology has broader implications; specifically, for evaluating the extent to which recidivism norms from a reference group translate to other settings and jurisdictions for risk and/or need measures in general. E/O index methodology has been applied frequently in the sexual violence risk field, and only one study to our knowledge has examined this with the LS measures (Olver & Kingston, 2018), all of which have been on adult samples.
Finally, given the limited research examining the risk-need relevance of gang involvement among diverse youth, particularly given the severity of this issue in Saskatchewan, the present study examines the criminogenic properties of clinician field ratings of level of gang affiliation as a function of LSI-Sk measured risk and need.
Method
Participants
All participants were identified based on consecutive referrals to an outpatient community mental health clinic that provides assessment, treatment, and stabilization services to court adjudicated youth in custody and community settings. In total, 451 youths were identified between 2006 and 2012, of whom, 284 had an LSI-Sk rated by a youth worker as part of a presentence evaluation that could be extracted from file; youth receiving services not tied to a recent court disposition often may not have had the LSI-Sk based presentence evaluation on file. The final sample consisted of 218 (76.8%) male and 66 (23.8%) female youths (total N = 284). Most (71.5%) of the sample identified as Indigenous, 20.4% were non-Indigenous (i.e., White or other ethnocultural group), and 8.1% were unknown. The mean age of the participants at the time of assessment was 16.6 years (SD = 1.5 years). Most youth had not been attending school at the time of assessment (59%) and had a mean completed grade of 8.2 (SD = 1.5). All youth had been court adjudicated under the Canadian Youth Criminal Justice Act. Most youths (72.2%) had a violent index conviction, 76.1% had any previous conviction, and 44.0% a previous violent conviction.
Measures
LSI-Sk
The LSI-Sk (Andrews et al., 2001) is a jurisdiction specific variant of the LSI in which the item content of the LSI-OR (and hence, LS/CMI) was developmentally adapted for youth and then implemented and validated in Saskatchewan. It is composed of 45 binary items that directly map onto the Central Eight risk factor domains (Luong & Wormith, 2011). LSI-Sk total scores can be arranged into five risk levels: Level 1 (very low risk, 0–4), Level 2 (low risk, 5–10), Level 3 (medium risk, 11–19), Level 4 (high-risk, 20–29), and Level 5 (very high-risk, 30–45). The higher the score or number of concerns identified on the LSI-Sk, the higher the youth’s risk level and thus prioritization for services.
The LSI-Sk is administered by a youth worker (youth justice equivalent to a probation officer) employed by the Ministry of Corrections and Policing to every youth on their caseload to assess risk and to inform case management (e.g., supervision intensity, intervention services). Most commonly, the LSI-Sk is rated in the context of a presentence evaluation that identifies the youth’s risk level, which need areas are sufficiently present to warrant risk management, and possible areas of strength for the youth. For the present study, the following pieces of LSI-Sk information could be extracted from presentence reports: (a) the youths’ categorical LSI-Sk risk rating generated from the total score (Level 1 Very Low through 5 Very High), (b) the LSI-Sk need areas, coded in a binary manner (1–0), identified as requiring attention for services (i.e., Moderate, High, or Very High) versus not requiring attention (i.e., Very Low or Low); and (c) the need areas were summed to generate a need total ranging from 0 to 8 as done elsewhere (Guay, 2012). Continuous LSI-Sk need and total scores were not available as this specific information is not reported in the presentence reports.
Three formal evaluations have examined the psychometric properties of the LSI-Sk, all of which have been based on prospective field administrations of the tool. The first evaluation (Rector et al., 2007) formed the basis of the tool’s norms and comprised 872 justice involved youth with a mean follow-up of 503 days (~17 months, range 202–984 days). LSI-Sk total scores had high predictive accuracy for general recidivism (rpb = .38) and successively higher rates of recidivism were observed with each increment in risk band: Very Low/Level 1 (15%), Low/Level 2 (23%), Medium/Level 3 (36%), High/Level 4 (53%), and Very High/Level 5 (75%). LSI-Sk total scores also significantly predicted recidivism among male (n = 664, rpb = .40), female (n = 208, rpb = .29), Indigenous (n = 624, rpb = .37), and non-Indigenous (n = 248, rpb = .33) youth subgroups. Two additional evaluations of the LSI-Sk have generated support for its predictive validity for general recidivism in youth samples as a whole (Baum, 2012; area under the curve [AUC] = .77, N = 540), as well as among male (n = 141, rpb = .39, AUC = .73), female (n = 51, rpb = .40, AUC = .74), Indigenous (n = 123, rpb = .25, AUC = .64), and non-Indigenous (n = 51, rpb = .51, AUC = .79) youth subgroups (Luong & Wormith, 2011).
Gang Affiliation
The LSI-Sk risk-need domains include companions, which refer to having antisocial peers and few or no prosocial acquaintances or friends; however, this need domain does not include gang involvement specifically. As such, we examined level of gang affiliation, as rated on a 1- to 5-point ordinal scale (n = 213) by agency clinicians at the time of referral as part of routine agency practice. Higher scores represent greater levels of gang involvement as appraised by the clinician as follows: 1 (n = 72, 33.8%), 2 (n = 81, 38.0%), 3 (n = 32, 15.0%), 4 (n = 27, 12.7%), 5 (n = 1, 0.5%).
Recidivism
This study examined recidivism for a 3- and 5-year follow-up period, as well as total recidivism employing an unfixed follow-up. Recidivism was examined according to three subtypes of violent, nonviolent, and general recidivism. Recidivism was defined as any criminal conviction of the youth following release from custody or post assessment (for youth in the community). Violent recidivism was coded as any new conviction for an offense committed with the potential for serious physical or psychological harm to another individual (e.g., death, injury) including sexual offenses, attempted or actual use of physical violence, and threatening behavior (e.g., robbery, arson). Nonviolent recidivism included new convictions for nonviolent offenses (e.g., drug offenses, theft, breaches). General recidivism included any new conviction for a violent or nonviolent offense. Recidivism was coded in a binary manner (yes or no) along with the conviction date to permit survival analysis.
Procedure
Ethical approval was provided by the University of Saskatchewan Behavioural Research Ethics Board (Beh No. 18-30), legal approval by the chief administrative judge for the Saskatchewan Law Court, operational approval by the Saskatchewan Health Authority, and ministerial approval by the Acting Deputy Minister of Ministry of Justice: Corrections and Policing. LSI-Sk ratings (risk level and needs identified as present vs. absent) were extracted by the first and second authors from presentence reports completed for the youth’s current disposition that prompted referral for services and contained on file. Once coding was complete, recidivism data were obtained from Canada’s nationwide electronic database of official criminal charges and convictions, the Canadian Police Information Centre (CPIC), maintained by the Royal Canadian Mounted Police (RCMP). CPIC criminal record data were updated by the RCMP in 2019, provided to the senior (i.e., last) author, and coded by the authorship team. Recidivism data were coded as a group to facilitate resolving queries as they arose to ensure consistency and continuity in coding.
Data Analytic Strategy
Analyses were conducted using SPSS 25.0. First, to examine possible differences in risk and need as a function of gender and ethnocultural subgroup, male–female, and Indigenous–non-Indigenous group comparisons were conducted on LSI-Sk risk level, needs, and need total via ANOVA (for continuous variables) and chi-square analyses (for categorical variables). Second, to examine the predictive properties of the LSI-Sk risk level, need total, and individual need domains for differentiating recidivists from non-recidivists, a series of discrimination analyses were conducted. The primary analyses employed AUC, which generates a statistic between 0 and 1.0 representing the probability that a randomly selected recidivist would obtain a higher score (or elevated risk classification) than a randomly selected non-recidivist. With .50 representing chance-level predictive accuracy, AUC values of .56, .64, and .71 correspond to small, medium, and large effects, respectively (Rice & Harris, 2005). AUCs were computed at fixed 3- and 5-year follow-ups—that is, ensuring all youth had an equal time at risk with recidivism occurring within the follow-up window coded—as well as at unfixed, variable, follow-ups for each outcome. These analyses were conducted on the aggregate sample first, followed by analyses performed at male–female and Indigenous–non-Indigenous subgroup levels. For space considerations and given the duration of follow-up, subgroup analyses were conducted for 5-year outcomes only.
Third, LSI-Sk risk level, need total, and individual need domain associations with recidivism were examined for Indigenous male and female youth and non-Indigenous male youth; insufficient sample (n = 11) was available to examine non-Indigenous female youth. The analyses would represent to what extent the predictive properties of the LSI-Sk extend to specific gender and ethnocultural subgroups. Given that AUCs can be attenuated by loss of variance (e.g., as with binary variables), phi (ϕ) correlations were also conducted for binary need associations with recidivism, and for continuity, point biserial correlations (rpb) were reported for risk level and need total associations with recidivism. The phi correlations can be interpreted as the percent difference in 5-year recidivism between youth with and those without a given need area identified. Per Rice and Harris (2005), correlations of .10, .24, and .37 corresponded to small, medium, and large effects, respectively. A set of exploratory Cox and logistic regression analyses was then conducted within each Gender × Ethnocultural Subgroup to identify salient criminogenic predictors of recidivism and extend bivariate findings.
Fourth, the rates of recidivism associated with LSI-Sk risk levels (i.e., calibration) were examined overall and as a function of gender and Indigenous composition. Kaplan-Meier survival analyses were conducted to examine trajectories of recidivism over time across the three outcomes with differences in rates of recidivism among the five risk levels examined through pairwise contrasts. The calibration analyses were extended to examine the rates of recidivism at the five LSI-Sk risk levels observed in the current sample, to those expected by Ministry of Corrections and Policing norms (Rector et al., 2007). As the norms employed a variable follow-up of approximately 17 months (minimum 6 months and maximum > 2 years), we employed a fixed 18-month follow-up to approximate the normative follow-up. The E/O (expected/observed) index was computed to generate a ratio of the number of recidivists expected from a reference group (e.g., norms) to that observed in a comparison group (e.g., present study sample). Values of 1.0 indicate perfect calibration, values below 1.0 indicate underprediction by the reference group, and above 1.0, overprediction; the E/O index is significant if the 95% confidence interval (CI) does not contain 1.0 (see Hanson, 2017). The E/O index was also computed to examine expected versus observed differences in recidivism between male–female and Indigenous–non-Indigenous youth at each of the LSI-Sk risk levels in the present sample.
The final set of analyses examined the role and relevance of gang affiliation in the prediction of recidivism controlling LSI-Sk risk and need levels. Street gang activity is a pervasive problem among justice involved youth on the Canadian Prairies; it is a serious variant of antisocial peers, characterized by sanctioned and at times coordinated involvement in criminal activity. These analyses examine to what extent degree of gang affiliation is associated with general or violent recidivism after controlling for individual differences in LSI-Sk risk level and need total through Cox regression survival analyses. Given that not all youth had gang affiliation information, and Indigenous youth tend to be overrepresented among street gangs provincially (Dunbar, 2017), the analyses were conducted on the overall sample and stratified by gender.
Results
Descriptive Statistics
Table 1 reports means and frequencies for LSI-Sk risk levels and needs. The sample was broadly higher risk, with nearly three quarters (72.3%) of youths scoring high (Level 4) or very high (Level 5) and a mean rating of 4.0 (SD = 1.1). Males and females did not differ significantly on their representation among the five LSI-Sk risk levels; however, the Indigenous group proportionately had a greater number of youth classified as high-risk (80.8%) than the non-Indigenous group (44.8%), χ2(1, 261) = 29.46, p < .001, phi = .34. The same trend applied to the need total and presence versus absence of identified need areas. This youth sample had an average of 5.2 (out of a possible 8) need areas identified as meriting attention by their case managers; there was no significant difference between male and female youth on the need total; however, Indigenous youth had significantly more needs identified than non-Indigenous youth by nearly one full standard deviation (Mdiff = 2.0, d = 0.91). Finally, in terms of individual need domains, problems with education, leisure, companions, substance use, and antisocial pattern were particularly prevalent in this sample, with about two third to more than three quarters of youth meriting attention. There were no significant male–female differences on the frequency with which a need was identified; however, Indigenous youth had a significantly higher frequency of each need for all eight areas (ϕ = .15–.39, p = .014 to p < .001).
LSI-Sk Descriptive Statistics: Overall Sample and Gender and Ethnocultural Comparisons

Note. LSI-Sk = Level of Service Inventory–Saskatchewan Youth Edition.
Denotes significant difference within group category.
Recidivism Information
The sample had a mean follow-up of 9.3 years (SD = 1.3 years, range = 4.2–12.9 years), post assessment (community referrals) or post release (custody dispositions). The base rates of violent, nonviolent, and general recidivism overall and at fixed 3- and 5-year follow-ups are reported in Table 2. Nearly three quarters of the youth sample were convicted for any new offense (general recidivism) or a nonviolent offense during the total follow-up while slightly more than half were convicted for a violent offense. Male youth had significantly higher base rates of recidivism than female youth during the total follow-up and at the fixed 3- and 5-year follow-ups for all three outcomes: violent recidivism (ϕ = .16–.18, p < .01) and general and nonviolent recidivism (ϕ = .20–.24, p < .001). There were no significant differences in rates of general and nonviolent recidivism between Indigenous and non-Indigenous youth; however, Indigenous youth had significantly higher rates of violent recidivism overall and at the fixed follow-ups (ϕ = .13–.15, p < .05).
Predictive Accuracy of LSI-Sk Risk Level for Recidivism Criteria: Overall Sample, Gender, and Ethnocultural Subgroups

Note. LSI-Sk = Level of Service Inventory–Saskatchewan Youth Edition; BR = Base rate; AUC = area under the curve; CI = confidence interval.
p < .05. **p < .01. ***p < .001.
LSI-Sk Discrimination Properties
LSI-Sk Risk Level
Table 2 presents AUCs for the LSI-Sk risk levels across the three recidivism outcomes over fixed and unfixed follow-ups, in the overall sample and among demographic subgroups. LSI-Sk risk levels demonstrated significant and broadly moderate predictive accuracy for general and nonviolent recidivism in the overall sample and among male–female subgroups, with AUC magnitudes being slightly higher for fixed follow-ups. Small to medium AUCs were found for violent recidivism, and the LSI-Sk did not significantly predict this outcome for female youth. Finally, the LSI-Sk demonstrated small to medium accuracy among Indigenous youth and medium to high predictive accuracy for non-Indigenous youth.
LSI-Sk Criminogenic Need
Predictive accuracy for the eight criminogenic needs and the need total for the overall sample are presented in Supplemental Table S1 (available in the online version of this article). The need total had moderate predictive accuracy (AUCs = .64–.68) for the three outcomes irrespective of follow-up. For instance, with an AUC = .66 (5-year general recidivism), there is a 66% probability that a youth reoffending within 5 years has a greater number of criminogenic needs than a youth not reoffending within that time frame. The need domains had small to medium AUCs, with the strongest predictors being Criminal History, Education/Employment, and Companions (all p < .05), followed by Antisocial Attitudes, Substance Use, and Antisocial Pattern (small AUCs, most associations p < .05), and the smallest and fewest significant associations for Family Circumstances and Leisure.
Prediction of Youth Recidivism in Indigenous and Gender Subgroups
Bivariate Prediction
The next set of analyses examined the predictive accuracy of LSI-Sk individual needs and their summation (need total) for the three recidivism outcomes among Indigenous–non-Indigenous and male–female subgroups (Supplemental Table S2, available in the online version of this article). First, the need total had broadly medium AUCs for male youth, large effects for female and non-Indigenous youth, and small to moderate effects for Indigenous youth. Second, Education/Employment was a particularly consistent predictor of the three outcomes among the four subgroups, followed by Criminal History and Substance Use. Third, Antisocial Attitudes and Companions were most predictive for male and non-Indigenous youth subgroups, but not for female and Indigenous subgroups (with exception of companions with violence for the latter), while Antisocial Pattern had medium AUCs for non-Indigenous youth. Finally, Family Circumstances and Leisure had the weakest AUCs, and none significantly predicted any of the outcomes for the subgroups.
These analyses were then repeated for Indigenous male and female youth and non-Indigenous male youth (Table 3). The need total had significant and broadly moderate predictive effects among female Indigenous youth, and small in magnitude, but also significant effects for Indigenous males. The LSI-Sk 5-tiered risk scheme showed weaker discrimination of outcome by comparison, although significantly predicting the three outcomes with small effects for Indigenous males and yielding small to moderate associations that did not attain significance for females. Both LSI-Sk aggregate measures had high predictive accuracy among non-Indigenous male youth.
Predictive Accuracy of LSI-Sk Criminogenic Needs for Fixed 5-Year Recidivism Criteria Within Indigenous and Gender Subgroups (AUC and rpb/ϕ)

Note. Correlations: rpb computed for risk level and need total, ϕ computed for binary need areas. Insufficient sample to conduct non-Indigenous female analyses (n = 11). LSI-Sk = Level of Service Inventory–Saskatchewan Youth Edition; AUC = area under the curve; CI = confidence interval.
p < .05. **p < .01. ***p < .001.
For the individual need domains, among Indigenous female youth Education/Employment (all three outcomes), Substance Use (general and nonviolent recidivism), and Criminal History (violent recidivism) were most predictive, yielding moderate effects (AUCs and ϕ). For instance, female youth with Substance Use identified as a need area requiring attention had a 35% higher rate of general and nonviolent recidivism than girls who were not flagged as having a problem in this area. Or alternatively, there is a 64% probability that a female youth reoffending within a 5-year time frame had Substance Use identified as a need area than a female youth who did not reoffend. By contrast, these three domains were not particularly predictive among Indigenous male youth; instead, the only consistent predictor was Companions, with small to moderate effects across all three outcomes. Finally, for non-Indigenous males, Education/Employment, Companions, and Antisocial Pattern had large effects for all outcomes; Attitudes had a medium effect for violence, and Substance Use, and a medium effect for general and nonviolent recidivism.
Multivariate Prediction
The bivariate prediction analyses informed a series of exploratory multivariate analyses of the incremental predictive validity of the eight need domains for the three Indigenous-gender subgroups (Supplemental Table S3, available in the online version of this article). For Indigenous male youth, Companions was the only need domain that incremented the prediction of recidivism and was associated with a five to eightfold increase in the potential for future violence. None of the predictors in the multivariate model achieved significance in the prediction of general recidivism for Indigenous youth, although Companions was associated with a twofold increase in the odds of general recidivism. For male non-Indigenous youth, Antisocial Pattern incremented the prediction of violent recidivism, followed by Antisocial Attitudes—the sum of these domains demonstrated a large effect (AUC = .77, 95% CI = [.64, .89], p = .002) for 5-year violence. Education/Employment and Companions incrementally predicted general recidivism and the two needs as a composite had a large effect for this outcome (AUC = .77, 95% CI = [.64, .91], p = .001). Finally, among female Indigenous youth, Substance Use, Criminal History, and Education/Employment demonstrated the largest incremental effects—the sum of these three need areas generated large effects for general (AUC = .74, 95% CI = [.61, .87], p = .002) and violent (AUC = .77, 95% CI = [.62, .91], p = .002) recidivism.
LSI-Sk Calibration
The next set of analyses examined the recidivism rates associated with LSI-Sk risk levels over time and relative to defined reference groups. Figure 1 presents the results of Kaplan-Meier survival analysis and log rank χ2 pairwise comparisons among the five risk levels. There was little difference in the recidivism trajectories among Levels 1 and 2 youth, with successively steeper recidivism trajectories observed for Levels 3, 4, and 5. Level 5 youth had significantly higher and faster rates of general and nonviolent recidivism than each of the four risk levels; the differences in the survival curves were also significant between Levels 4 and 2. For violent recidivism, Levels 3, 4, and 5 all had higher rates of recidivism than Level 2 youth. No other group comparisons were significant.
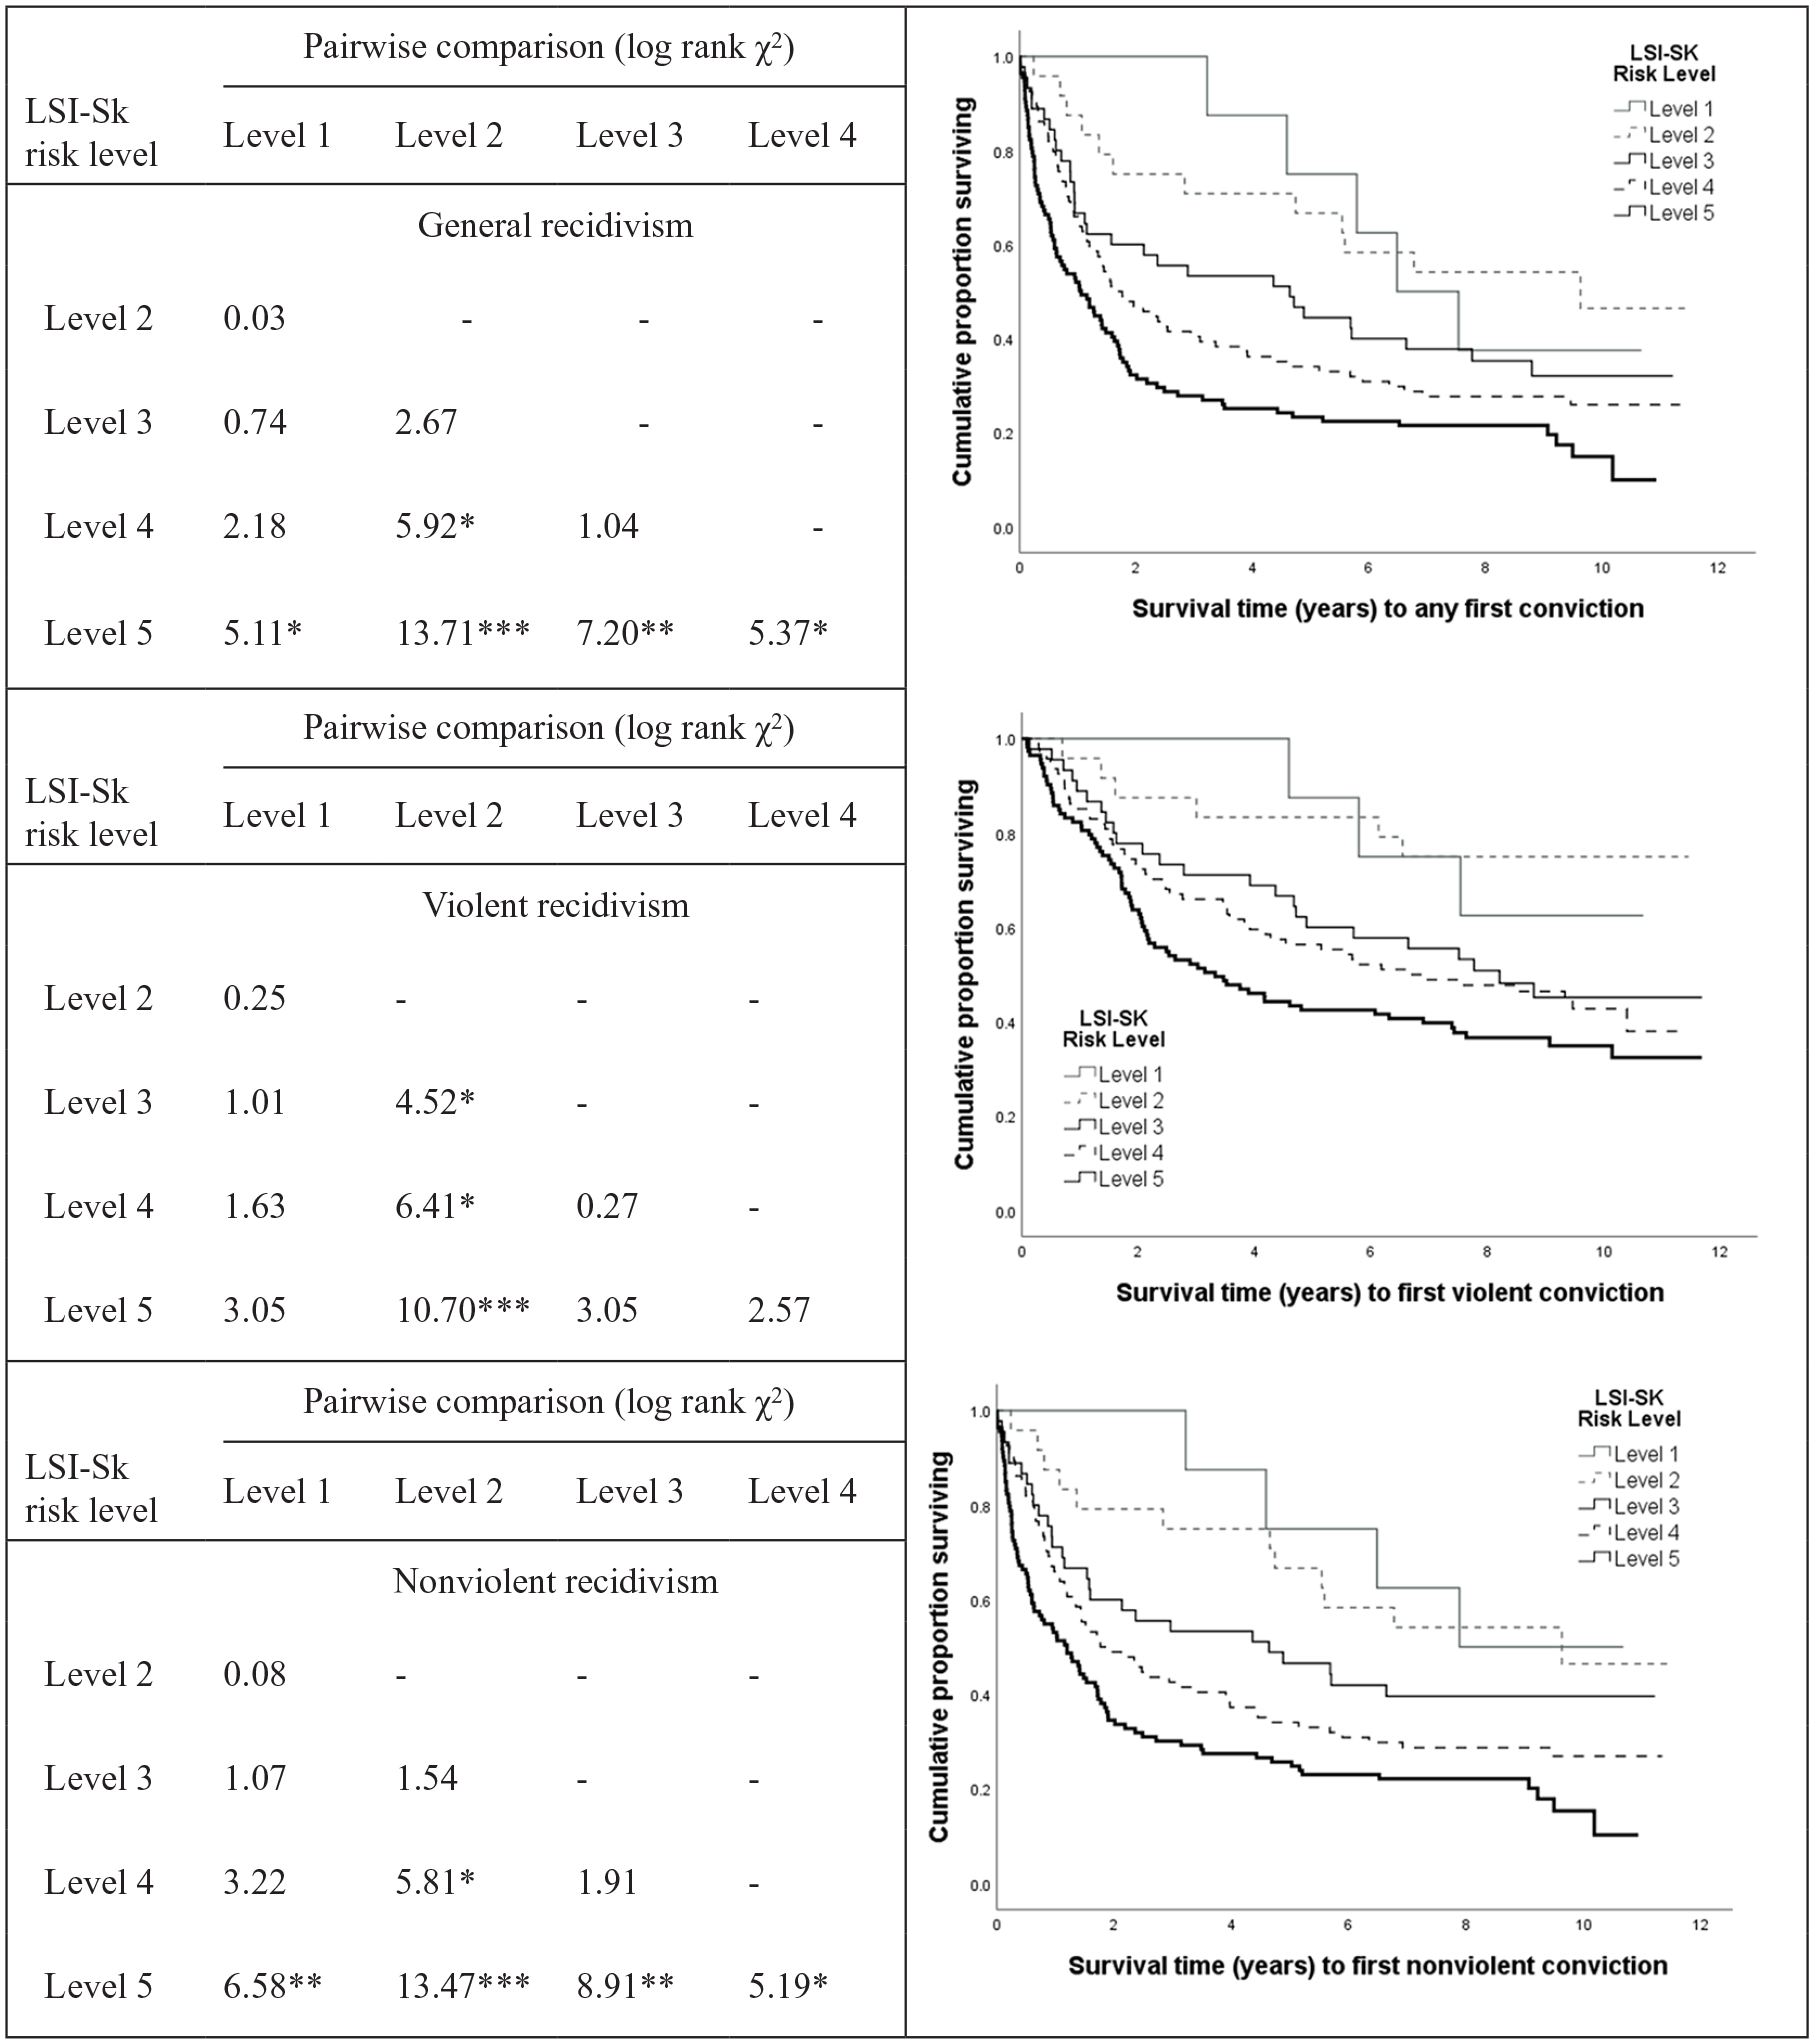
Kaplan-Meier Survival Curves: Cumulative Recidivism Rates as a Function of the Level of Service Inventory–Saskatchewan Youth Edition (LSI-Sk) Risk Level
The results of E/O index comparisons over a fixed 18-month follow-up (per the LSI-Sk norms) are presented in Table 4. The top third of the table presents gender comparisons by risk level. Given that there were no female youth at Level 1 and no recidivists at Level 2, an E/O index could not be computed for those levels. Significant E/O indexes (higher recidivism rates for males) were observed for Levels 3 and 5, as well as overall. For Level 3, the LSI-Sk recidivism rate for males was nearly 600% higher than for females, and at Level 5, 39% higher; calibration at Level 4 was nearly perfect. In the middle band of the table, E/O index values are computed comparing Indigenous and non-Indigenous youth. None of the E/O index values were significant, and they hovered around 1.0, indicating that the number of recidivists observed among non-Indigenous youth at a given risk level was very similar to that expected for Indigenous youth at the same risk level, despite Indigenous youth having higher rates of recidivism overall. Finally, the bottom portion of the table presents E/O index values for the number of recidivists observed at each risk level in the current sample, compared with that expected from the normative sample over a comparable follow-up. These comparisons showed strong calibration for Levels 2, 3, and 4; however, the E/O index for Level 5 demonstrated an overprediction of recidivism of 27% by the Saskatchewan norms relative to the current sample.
LSI-Sk Risk Level Calibration (E/O Index) for General Recidivism (Fixed 18-Month Follow-up)

Note. Significant E/O index in bold font. LSI-Sk = Level of Service Inventory–Saskatchewan Youth Edition.
Gang Affiliation, Risk and Need: Linkages to Recidivism
The final set of analyses examined the association of clinician rated level of gang affiliation and baseline risk/need to general and violent recidivism over time through Cox regression survival analysis (Table 5). Preliminary AUC analyses demonstrated gang affiliation level predicted general (AUC overall sample = .68, 95% CI = [.60, .76]; AUC male = .64, 95% CI = [.54, .74]; AUC female = .77, 95% CI = [.64, .90]) and violent (AUC overall sample = .68, 95% CI = [.60, .76]; AUC male = .64, 95% CI = [.54, .74]; AUC female = .77, 95% CI = [.64, .90]) recidivism. Gang affiliation was also significantly positively correlated with LSI-Sk risk level (r = .41, p < .001) and need total (r = .44, p < .001), indicating gang affiliated youth to be higher risk and greater need.
Cox Regression Survival Analysis: Incremental Associations of LSI-Sk Risk/Need and Gang Affiliation to General and Violent Recidivism

Note. LSI-Sk = Level of Service Inventory–Saskatchewan Youth Edition; CI = confidence interval. Significant p-values are in bold font.
The first set of Cox regressions showed that increasing LSI-Sk risk level was significantly associated with increased hazard of general and violent recidivism over time (Model 1a). Specifically, each increment in LSI-Sk level was associated with a 35% increase in the hazard of violence, and 25% increase in the hazard of any reoffending in general. When entered in the next step, however, gang affiliation uniquely significantly predicted each outcome, but LSI-Sk risk level did not. The most notable drop was for general recidivism (LSI-Sk eB = 1.075, p = .408) while the decrease in magnitude for violence was less apparent (LSI-Sk eB = 1.211, p = .068). Each increment in level of gang affiliation was associated with a 50% increase in the hazard of any reoffending and 36% increase in the hazard of future violence, controlling for LSI-Sk risk level. For Model 2a, the LSI-Sk need total significantly predicted increased general and violent recidivism; that is, the addition of each criminogenic need was associated with a 19% increase in the hazard of future violence and a 12% increase in the hazard of any reoffending. When entered in the second block, gang affiliation uniquely predicted general recidivism while the need total did not, while both predictors significantly uniquely predicted violent recidivism.
For male youth, the same prediction patterns emerged for general recidivism as with the overall sample. For violent recidivism, however, LSI-Sk risk level (Model 1b) and need total (Model 2b) each significantly, uniquely predicted future violence among male youth, while gang affiliation level did not. For female youth, gang affiliation level incremented the predictions of general and violent recidivism, whether controlling for LSI-Sk risk level (Model 1c) or need total (Model 2c). Only the need total significantly predicted general recidivism, despite the hazard ratios for the risk and need measures for females being larger in effect size than for males.
Discussion
This study was a prospective field examination of the predictive properties of a general risk-need tool (LSI-Sk) in a diverse sample of court adjudicated youth. These youth were referred for specialized assessment and/or treatment services at a community mental health clinic, with nearly three quarters having been assessed by community youth workers as high or very high-risk on the LSI-Sk and an average of five of eight need areas identified as criminogenic. The analyses sought to contribute new knowledge about the discrimination and calibration properties of general risk-need tools for diverse youth subgroups.
Discrimination Properties of Assessed Levels of Risk and Need
The primary set of predictive analyses examined the discrimination properties of the LSI-Sk risk levels, binary needs, and a summative need total; the latter served as a proxy to LSI-Sk total scores, with a broader range and greater variance than LSI-Sk risk level. Compared with previous LSI-Sk research reporting large AUC magnitudes (i.e., .70s; Baum, 2012; Luong & Wormith, 2011; Rector et al., 2007), the AUCs for the risk and need totals were slightly lower overall, and particularly for male Indigenous youth, although still broadly moderate in magnitude (low to mid .60s). This may partly be product of range restriction for LSI-Sk risk level, which will attenuate AUCs (Babchishin & Helmus, 2016), particularly if there are a large number of youth clustered in the top two risk bands.
The disaggregation of youth into gendered Indigenous and non-Indigenous subgroups was most informative. Given that Indigenous youth comprised more than three quarters of the sample, the findings in aggregate male and female subgroups were largely driven by the results for Indigenous youth. Among non-Indigenous male youth, the LSI-Sk risk level and need total showed noticeably better discrimination and large AUC magnitudes. For female youth in general, and Indigenous female youth specifically, the LSI-Sk need total had good discrimination for each recidivism outcome (AUCs high .60s to low .70s) while the LSI-Sk risk bands had low to moderate discrimination as found with male Indigenous youth. In all, LSI-Sk field ratings showed reasonable discrimination properties for a range of recidivism outcomes; however, the AUC and correlation magnitudes were essentially the upper range of small for male Indigenous youth, small to medium for female Indigenous youth, and large for male non-Indigenous youth.
Criminogenic Need, Gender, and Ethnocultural Diversity
A common thread among male youth was that the Companions need domain was particularly salient and predictive of the three recidivism outcomes. Although Indigenous youth were overrepresented for all need domains compared with non-Indigenous youth, several of these were consistently more predictive for non-Indigenous male youth including Substance Use, Education/Employment, Antisocial Pattern, and (for violence) Antisocial Attitudes. A caveat, however, is the smaller proportion of male non-Indigenous youth with these need areas classified as requiring attention. That said, Companions was the most predictive domain for Indigenous males, and 85% of youth within this subgroup had it identified as a problem area. The bivariate need prediction findings were reaffirmed in multivariate analyses—the need domain of Companions, controlling for all other needs, was associated with a more than fivefold increase in the hazard of future violence for male Indigenous youth, suggesting this domain to have particular salience. Conversely, multivariate analyses among male non-Indigenous youth underscored the unique predictive value of Companions and Education/Employment deficits for general recidivism, and Antisocial Pattern and Antisocial Attitudes for future violence.
For female Indigenous youth, Substance Use concerns were the most consistently predictive of the three recidivism outcomes, followed by Education/Employment, and Criminal History for violence. Indigenous female youth who had these three need areas identified as criminogenic had an approximate threefold increase in the odds of violent or general recidivism. The results underscore the potential gender salience of need areas such as Substance Use for justice involved women and girls (e.g., Olver et al., 2014; Rettinger & Andrews, 2010). Taken together, these results suggest different possible pathways to recidivism and areas of need to intervene to disrupt these pathways for male and female youth.
LSI-Sk Calibration and Diversity
The calibration properties of the LSI-Sk risk levels served as an important set of analyses, given that the risk levels derived, and the recidivism frequencies attached to them, are used to inform case management (e.g., frequency of supervision appointments, community conditions). The results of E/O index comparisons between the recidivism rates observed in the current aggregate sample (47%) to the Saskatchewan norms (49%) suggested good calibration overall. That the E/O index was not significant for Levels 2 through 4 broadly suggests that the Saskatchewan norms apply well to the present sample. One possible exception was Level 5 (75% vs. 59% recidivism), which amounted to a 27% overprediction of recidivism by the highest risk band. This likely would not impact case management, however, given that youth in the highest tier should nonetheless also receive the highest priority for services.
Although Indigenous youth were more likely to be classified as Levels 4 and 5, the recidivism rates observed within each LSI-Sk risk level were not significantly different from that observed for the respective non-Indigenous youth subgroup; the E/O index results would suggest that the LSI-Sk recidivism estimates apply across both youth subgroups. An important disparity was seen in gender-based calibration, however. The recidivism rates associated with a given LSI-Sk risk level were significantly higher for male compared with female youth. This was most evident at Levels 3 and 5—essentially the middle and highest risk tiers. For medium risk female youth, there was a sixfold overprediction of recidivism compared with males. Although formal E/O index calculations could not be conducted comparing female youth with the normative sample (given that LSI-Sk recidivism rates by gender were not reported), the expected rates seen in Levels 3 and 5 from the norms reveal substantial overprediction (i.e., 36% vs. 8.3% and 75% vs. 45.5%, respectively).
The Criminogenic Relevance of Gang Affiliation and Role of Specialized Assessments
Gang involved youth in the present study were at higher risk, greater need, and had higher rates of recidivism. Gang affiliation incremented LSI-Sk risk level in the prediction of general recidivism for both genders, suggesting that a large amount of general recidivism risk was accounted for by clinician assessed level of gang involvement. Among male youth, gang affiliation did not consistently, uniquely predict violence, however, while the LSI-Sk measures often did. These findings suggest that gang affiliated youth may have both general- and violence-specific criminogenic needs that necessitate specialized assessments (e.g., violence risk) that can inform intervention (Chu et al., 2011). For instance, violence-specific youth risk tools such as the Violence Risk Scale–Youth Version (VRS-YV; see Stockdale et al., 2014) have criminogenic need items that are common to offending in general (e.g., Antisocial Peers, Attitudes toward Education, Criminal Attitudes) and specific to violence, including items relevant to gang involved youth (e.g., Violent Lifestyle, Weapon Use), that can inform treatment planning for this high-risk-need group. The results underscore the importance of gang intervention and containment strategies as part of a broader risk management regime.
Overall, the results indicate that as a standalone tool, the LSI-Sk does not provide a complete portrait of risk and need for Indigenous and female youth. Any single tool (e.g., LSI-Sk, VRS-YV) is a critical part of, but on its own does not amount to, an assessment. The LSI-Sk is a central component of a broader presentence evaluation that includes other social and contextual considerations, to inform not only sentencing, but recommended services to inform case management and risk reduction (e.g., specialized secondary violence risk assessment). An assessment is comprehensive, multipronged process, integrating information from multiple information sources and across multiple areas of functioning. An assessment further takes into consideration unique needs and circumstances, such as gender and ethnocultural considerations, as well as microcultures such as gang activity which can also be diverse (e.g., prison gangs, urban street gangs). Little research, however, has examined the integrity and field utility of comprehensive assessments beyond individual tools.
Study Strengths and Limitations
There are several study strengths that provide support for the veracity and generalizability of the present findings. The study was a prospective field evaluation of the discrimination and calibration properties of a general risk-need tool used province wide with court adjudicated youth. The study examined the LSI-Sk as it is employed in the field by the very personnel that rate and use the ratings of this measure to case manage youth. The sample size, composition, and length of follow-up provided the necessary conditions statistically to be able to examine the predictive properties of the tool over short- and long-term follow-ups and among gender and Indigenous subgroups. The work thus extends the available research regarding the predictive properties of general risk-need tools, and the Central Eight risk-need domains among female and Indigenous youth (including male and female Indigenous subgroups). The study was also, to our knowledge, the first to employ an established calibration metric (E/O index) with a youth sample, the results of which identified important strengths and limitations of current instrument norms and emphasized the importance for continued localized validation of risk measures. Finally, few studies have formally examined how youth street gang involvement may intersect with risk and need; the present investigation reaffirmed the role and relevance of gang affiliation as a unique criminogenic consideration, knowledge of which can complement risk assessment practices to prevent recidivism and promote community reintegration.
There are important study limitations. One is that LSI-Sk numeric score information for the risk total and the individual need domains were not available for inclusion in this study given that this level of detail is not provided in the presentence reports. The lack of continuous risk and need scores and resulting loss of variance may have attenuated AUCs for discrimination analyses and the present findings are best viewed as a conservative estimate of the LSI-Sk’s discrimination properties. Importantly, this was partly offset through summing need domains identified as criminogenic to generate a need total, which has greater variance and served as a reasonable proxy for the total score.
A second related limitation is that the unavailability of the original LSI-Sk scoring protocols meant that we could not separately examine strengths. In the presentence reports, strengths are noted by low or very low risk ratings on a need domain, and thus this information was incorporated into prediction analyses but could not be disentangled for independent examination. As adolescence is a dynamic developmental period, capitalizing on strengths during this window of opportunity is quite critical to promote desistence and better functioning. Furthermore, research has demonstrated protective factors to be associated with decreased recidivism in adults (Coupland & Olver, 2020) and youth (Viljoen et al., 2020).
Third, given that these were LSI-Sk ratings completed in the field and extracted from report, we did not have interrater reliability information to ensure scoring fidelity; however, this is mitigated by the training that all youth workers receive in the administration and scoring of the tool, the final ratings of which are also approved by a supervisor, to help promote rater accuracy. A fourth limitation is that the study had insufficient sample size to examine all gender and Indigenous subgroups, specifically non-Indigenous female youth. Even still, for Indigenous female and non-Indigenous male youth, the analyses were slightly underpowered, given that some findings fell short of the conventional p < .05 threshold despite generating effects that were medium in magnitude and/or would otherwise attain significance with slightly larger cell sizes. Finally, the study used binary classifications for Indigenous and gender groupings for the sake of power, as this information was sometimes not available.
Conclusion and Future Directions
In conclusion, the present study speaks to the need for more sensitive and inclusive methods to capture the nuances of identity and diversity, which in turn may promote greater understanding of their relationship to risk and need and inform responsive interventions for diverse justice involved youth. One of the most direct implications of our findings is the potential need for gender stratified norms consistent with other youth and adult LS variants, although the findings from the current sample may not be representative of all Saskatchewan youth or LSI-Sk administrations, and thus merit replication and extension. As Tannenbaum et al. (2016) remind us, “when gender norms, identity, and relations are ignored, unintended consequences can occur” (p. 4). Additional efforts along these lines are also consistent with ethical and best practices to ensure assessment instruments and practices are locally validated and responsive to diversity (Canadian Psychological Association, 2018).
Culturally responsive assessments and “two-eyed seeing” (i.e., collaborative, individualized, community-based; Canadian Psychological Association, 2018, p. 18) are also required to capture the cultural, social, contextual, and historical variables uniquely impacting Indigenous youth (e.g., per R. v. Gladue, 1999) and missing from risk assessment tools. For instance, in a Canadian survey, Kitching et al. (2019) found that Indigenous people (including youth) reporting discrimination by a health care provider had 5 times increased odds of having unmet health needs. As noted by Wilson and Gutierrez (2014), systemic issues (e.g., justice system discrimination), along with culture specific variables, and mainstream risk factors (e.g., Central Eight) may account for higher observed rates of recidivism in Indigenous persons.
Research underscores the salience of peer ties, particularly in the world of the adolescent, and particularly for the Indigenous male youth in this sample it seems that an antisocial peer group could catalyze other risk factors. But further, there is a need for more risk-need research for gang involved female youth in Canada, which could help the development of gender responsive programs (e.g., sexual exploitation associated with female gang involvement). As Tannenbaum et al. (2016) note, “Gender can be structured by, and operating within ethnicity, indigenous status, social status, sexuality, geography, socioeconomic status, education, age disability/ability, migration status, and religion, requiring an intersectional approach to implementing practices, programs and policies” (p. 2). In other words, responsive interventions must also be extended to youth involved in street gangs and violent lifestyles, so as to reduce youth crime, prevent future involvement in the adult justice system, and improve safety and well-being for all youth.
Supplemental Material
sj-pdf-1-cjb-10.1177_00938548211004669 – Supplemental material for Predictive Properties of a General Risk-Need Measure in Diverse Justice Involved Youth: A Prospective Field Validity Study
Supplemental material, sj-pdf-1-cjb-10.1177_00938548211004669 for Predictive Properties of a General Risk-Need Measure in Diverse Justice Involved Youth: A Prospective Field Validity Study by Jessica Prince, Kristine Lovatt, Keira C. Stockdale and Mark E. Olver in Criminal Justice and Behavior
Footnotes
Authors’ Note:
This manuscript is based on the undergraduate thesis of Jessica Prince supervised by Mark Olver.
Supplemental Material
References
Supplementary Material
Please find the following supplemental material available below.
For Open Access articles published under a Creative Commons License, all supplemental material carries the same license as the article it is associated with.
For non-Open Access articles published, all supplemental material carries a non-exclusive license, and permission requests for re-use of supplemental material or any part of supplemental material shall be sent directly to the copyright owner as specified in the copyright notice associated with the article.