
Abstract
A common observation in the digital age is that new technologies are making people’s behaviors, decisions, and preferences more visible. For scholars who study organizations and their effects upon society, increased information visibility raises the hope that organizations might become more transparent. Typically, we assume that increased information visibility will translate into high levels of organizational transparency, but we lack empirical evidence to support this assumption. Our ability to gather data on this important topic is limited because there have been few reliable ways to assess organizational information visibility. To remedy this problem, we develop and validate the Information Visibility Scale to measure the core aspects of information visibility. We then employ the scale to test the relationship between information visibility and transparency. We discuss the theoretical and practical implications of the scale and consider the limitations and further research possibilities that the scale construction and validation suggest.
Keywords
A common observation in the digital age is that new technologies are making people’s behaviors, decisions, and preferences more visible (Couldry, 2012; Flyverbom, Leonardi, Stohl, & Stohl, 2016). Visibility has become a powerful ocular metaphor for politicians, who tend to equate visibility with transparency and democracy; practitioners, who are interested in visibility in relation to organizational efficiency, effectiveness, and corporate social responsibility; and scholars, who are interested in visibility as an affordance capturing “the amount of effort people must expend to locate information” (Treem & Leonardi, 2012, p. 150). Studies often conceptualize visibility as a scalar construct—information, communication, or behavior varies in their visibility from low to high. If new technologies are making it easier to see certain information, this information is made more visible (Gibbs, Rozaidi, & Eisenberg, 2013; Treem & Leonardi, 2012).
In this study, we specifically focus on information visibility, examining what mechanisms are necessary for people to be able to see organizational information whereas transparency is typically thought of as an organization being open and accountable. Demands for more open governments in an attempt to make them more accountable (see Christensen & Cheney, 2015; see also Albu & Flyverbom, 2019; Schnackenberg & Tomlinson, 2016), for example, reflect a desire for governing bodies to accommodate the public’s wish to be given information about both the rationale and actual decisions made. In short, information is visible if people can see it and organizations are transparent if that visible information is used to make them open and keep them accountable. This relationship between visibility and transparency is interdependent. Yet, is it clear that without information visibility organizations cannot be transparent, as different stakeholders need to be able to access information at different times and across different contexts and modalities (see four directions of transparency explained in Albu & Flyverbom, 2019). Despite this important relationship between information visibility and organizational transparency, we know very little about the dynamics of information visibility. If an organization makes information about its processes or decisions visible is that information transparent? What about decisions that are not documented and, consequently, cannot be released? What if people who want to view the information cannot find it, understand it, or more basically, did not even know that it is there for them to find and understand? Understanding how information visibility works—what its attributes are—is important for scholarly research on visibility and is key for theorizing the conditions under which organizations can be and are transparent.
To help move the study of information visibility forward, we build on the conceptualization of information visibility offered by Stohl, Stohl, and Leonardi (2016) to develop and validate a measurement instrument to identify and assess organizational information visibility. Recent studies within organizational communication demonstrate the impact of information visibility on knowledge sharing (Gibbs et al., 2013), innovation (Leonardi, 2014), and employee well-being (Long, Hall, Bermbach, Jordan, & Patterson, 2008). At the macro level, recent scholarship focused on information visibility has examined issues related to transparency and accountability (Christensen & Cheney, 2015), corporate social responsibility and stakeholder relationship management (Banghart & Stohl, 2018; Bratich, 2016), and organizational identity and member identification (Askay & Gossett, 2015; Scott, 2015) in digital communication environments. However, despite the growing interest in the empirical phenomenon of information visibility, the field lacks a measurement instrument that captures the different levels of information visibility. To close this gap, this study (1) develops and validates a measurement instrument on information visibility and (2) assesses the relationship between information visibility and organizational transparency. By doing so, this study aims to make three important contributions to further our understanding of organizational information visibility.
First, this study provides a validated measurement instrument to assess information visibility, conceptualizing it as a combination of three core attributes (Stohl et al., 2016): (1) the availability of information, (2) whether or not approval has been given to disseminate information, and (3) the accessibility of information to third parties. Second, Stohl et al. (2016) use this conceptualization to challenge the assumed equivalency between information visibility and organizational transparency. This is important, because if we mistakenly assume a concomitant relationship between information visibility and transparency, we might adopt policies and procedures to enhance organizational transparency that are not effective. Therefore, in this study, we used this measurement instrument to assess the relationship between the different attributes of visibility and organizational transparency. Results provide insights that both confirm prior theorizing (e.g., the relationship between accessibility and transparency is the strongest) and are relevant for practice (e.g., mandated visibility has the lowest relationship with transparency). Finally, by developing a long and short version of the Information Visibility Scale, we also have created a validated tool that (1) could benefit future research examining visibility practices within organizations among all its members and (2) could also be used by customers, competitors, media, and other stakeholders to make information visibility assessments.
Theoretical Background
Organizational Information Visibility
Many recent studies in organizational communication have begun to provide empirical research that focus on information visibility (Evans, Pearce, Vitak, & Treem, 2016; Gibbs et al., 2013; Leonardi, 2015; Leonardi, Huysman, & Steinfield, 2013; Stohl et al., 2016). For example, employees who use enterprise social networking technologies can see the messages that employees in other divisions send to each other and use those messages to make inferences about what and whom their coworkers know (Leonardi, 2014). Individuals who work in one geographic location of a large multinational organization can communicate via advanced communicate technologies to learn about the job characteristics and assignment profiles of their colleagues working in company offices in other countries (Kim, 2018). Managers who have access to the digital log data of communication technologies can begin to learn which of their employees might be most expert in certain areas using their past behavior as proxies for domain expertise (Treem, 2015). And recent experimental evidence suggests that employees who recognize that their communications are now becoming visible to senior leadership through their use of new communication technologies may self-censor for fear of reproach in ways that curtail useful discussion and informed deliberation within organizations (Mao & DeAndrea, 2019).
Yet, despite the interest in the enabling and constraining aspects of information visibility within organizations, scholars appear to be operating from different definitions of visibility. Moreover, most of the papers that have explored the concept of visibility have done so inductively—building a definition of visibility based on the emic understanding of their particular field site of interest. Today, despite the fact that scholars are increasingly interested in the empirical phenomenon of information visibility, the field lacks a coherent operationalization of visibility and the associated tools with which to identify and measure it (see for discussion, Flyverbom, 2019).
The absence of such tools is problematic not just for organizational communication scholars who wish to study the emergence and effects of information visibility within particular organizational settings. For scholars interested in organizations and their effects upon society, and the ways that communication can shape broader social political dynamics, the development of an Information Visibility Scale creates the possibility to better assess its relationship with transparency (Christensen & Cheney, 2015). As scholars who take organizational fields as a unit of analysis suggest, digital technology should enable easy and cheap access to information that was previously unavailable, enhancing the transmission and accuracy of information and facilitating deliberative and effective organizational oversight within organizational networks and by regulatory agencies that bound fields together (Heeks, Foster, & Nugroho, 2017). Democratization is seen as a natural by-product of transparency, intimately tied to openness, observability, and interactivity across social contexts (Etzioni, 2010). Therefore, it comes as no surprise that many scholars applaud the use of technologies that will help make organizational actions, which were once difficult to see, visible to employees, stakeholders, and the public (Bertot, Jaeger, & Grimes, 2010).
Here too, our inability to clearly articulate what is meant by information visibility and to operationalize it proves problematic. For example, information visibility and organizational transparency can be read to be equivalent constructs—both imply the capacity to see. To be sure, scholars who study visibility within organizations often conflate the terms (e.g., Ellison, Gibbs, & Weber, 2015; Leonardi & Treem, 2012), as do those who study the role of visibility into organizations from the vantage point of organizational fields (e.g., Heemsbergen, 2016; Jensen & Meisenbach, 2015). Other authors who have noted the confusion between these terms have simply attempted to sidestep a discussion of their distinction by suggesting that information visibility and organizational transparency are likely linked in such a way that increases in one will lead to increases in the other (e.g., Fountain, 2001; Wolfsfeld, Yarchi, & Samuel-Azran, 2016).
Recently, however, a number of scholars have begun to turn their attention to explicating and defining the concept of organizational information visibility so that it can be better theorized, studied, and put into conversation with important processes like organizational transparency. For example, Stohl et al. (2016) develop a theoretically derived definition of information visibility as availability, accessibility, and approval of information and use this definition to challenge the assumed equivalency between information visibility and transparency. They conceptualize transparency as a form of visibility management—a set of practices through which behaviors and decisions are made more or less transparent by manipulating the visibility of information. In this view, transparency is seen to be embedded within “a context of power relations and asymmetrical capacities” (Bratich, 2016, p. 178). Flyverbom (2016) argues that “transparency is conditioned by the techniques and mediations through which it is produced, and that the results of transparency efforts are rather managed visibilities than insight and clarity” (p. 112). Heemsbergen (2016) shows how ubiquitous networked data dissemination, spread without the consent or knowledge of whomever held the data, has unintended and coercive consequences that belie the positive benefits of transparency. Stohl et al. (2016) go even further, providing several illustrative organizational cases (both unintended and strategic) that counter the very notion that more information visibility results in higher levels of transparency and democratization. Disentangling information visibility from transparency will enable scholars to better understand information visibility mechanisms and how they drive perceptions of transparency.
From a theoretical vantage point, the conflation of information visibility and organizational transparency has led to conceptual fuzziness, inconsistent operationalizations, and confusing, paradoxical, and simplified conclusions. Christensen and Cheney (2015), for example, argue that “with its most common operationalization as information, transparency reinstalls a ‘purified’ notion of communication devoid of mystery, inaccuracy and (mis)representation” (p. 70). Shifting our attention away from concerns related solely to the quality, quantity, and timeliness of information disclosure as it relates to transparency, to the intricate organizational dynamics and choices that comprise information visibility, we may be better able to uncover the complex array of communicative activity that makes information visible. The focus on the attributes and mechanisms of visibility may well enable researchers to unpack the nuanced and distinct organizing processes that shape perceptions of transparency. Specifying such processes is important for the democratic process inside and outside of organizational contexts and, importantly, for helping researchers to understand whether or not actual transparency is achieved or whether high degrees of visibility simply result in perceptions of transparency that mask inadvertent or strategic management of information that has, in fact, made such information less visible (Stohl et al., 2016).
At a practical level, calls for organizational transparency often result in communicative interventions that may seem designed to improve transparency but have the opposite effect. For example, too much information may become uninterpretable and hence opaque, or information that is available but difficult to access can breed frustration and distrust (Hollyer, Rosendorff, & Vreeland, 2011). For this reason, a tool that can reliably assess the level of information visibility within an organization would likely be useful for consultants and managerial practitioners interested in assessing the effectiveness of visibility management practices for outcomes such as organizational transparency. Furthermore, a reliable mode of assessment could help outside agencies and regulators to determine whether or not organizations are actually taking the steps necessary to promote transparency, or whether they are simply giving lip service to the idea of transparency while failing to take meaningful steps to do so.
In pursuit of these theoretical and practical goals, we begin the work of developing and validating a survey instrument, the Information Visibility Scale, which will help scholars and practitioners to assess the level of information visibility in organizations and, we hope, to explore relationships between information visibility and organizational transparency. To develop this scale, we draw on the theoretical development work of Stohl et al. (2016) who identified and defined core attributes of organizational information visibility. Building on their theorization of three core attributes of visibility, we construct and validate the Information Visibility Scale and then use the scale to test the relationship between information visibility and organizational transparency. We then explore the theoretical and practical implications of the scale and consider the limitations and further research possibilities that the scale construction and validation suggest.
Information Visibility and Transparency
Information visibility is a core communication construct. Flyverbom et al. (2016) go so far as to argue that “visibility is a root affordance in the digital age” (p. 101). Their argument hinges on the observation that the digital technologies that are becoming indispensable in our personal and work lives have the potential to make an increasing number of our behaviors visible for others to see. Scholars generally assume that increased visibility of information will translate into high levels of organizational transparency, but we lack empirical evidence to support this assumption. Our ability to gather data on this important topic is limited because there have been few reliable ways to assess information visibility as an independent construct and to conceptualize its relationship to organizational transparency.
Of the two concepts, transparency has, to date, received much more detailed theorization in the literature (e.g., see Schnackenberg & Tomlinson, 2016, for a comprehensive review of organizational transparency; Hood & Heald, 2006, for detailed discussion of transparency and governance). This is not surprising given the highly value-laden notion of transparency and its status as a defining principle of contemporary society (Christensen & Cornelissen, 2015). For example, Hollyer et al. (2011) argue that the normative value of transparency is seen throughout the Western social science. The scholarly literature is filled with theoretical analyses and critical assessments of the valorization of the term transparency. Fenster (2006), for example, critiques two widely held core beliefs regarding transparency: (1) the more a government is transparent, the more it is democratic, and (2) transparent governments and organizations operate in a more effective and efficient manner and thus serve its stakeholders better and more fairly (Fenster, 2006). Strathern (2000) powerfully unpacks the “tyranny of transparency.”
Compared with organizational transparency, information visibility has received far less attention, although it too has important theoretical and practical implications distinct from the ideas surrounding transparency. Brighenti (2010), one of the few scholars (along with Flyverbom) who has clearly articulated the importance of visibility as a social category, conceives of visibility as an element of the social, in which territorial thresholds are drawn, inscribed, and projected. Recognition and control are understood and explained as two opposing outcomes of visibility. In a great deal of the intergroup and organizational research that focuses on issues of gender, race, and age, visibility functions as a generalized term that describes the relative state of exclusion or acknowledgment of a group or individual (Simpson & Lewis, 2005). In technology studies, visibility is seen as an affordance, capturing the extent to which a particular technology makes behaviors, knowledge, preferences, and/or network connections visible to others (Gibbs et al., 2013; Treem & Leonardi, 2012). New technologies can reduce the amount of effort to see organizational information and thus are making information more visible. As such, information visibility is an ocular metaphor, suggesting an ability to see something. Transparency, however, is more demanding because it suggests an ability to see into something, an ability that indicates insight, understanding, and clarity (Christensen & Cheney, 2015). It is often argued that the link between disclosing organizational information and creating insight is neither direct nor clear-cut (Flyverbom, 2019).
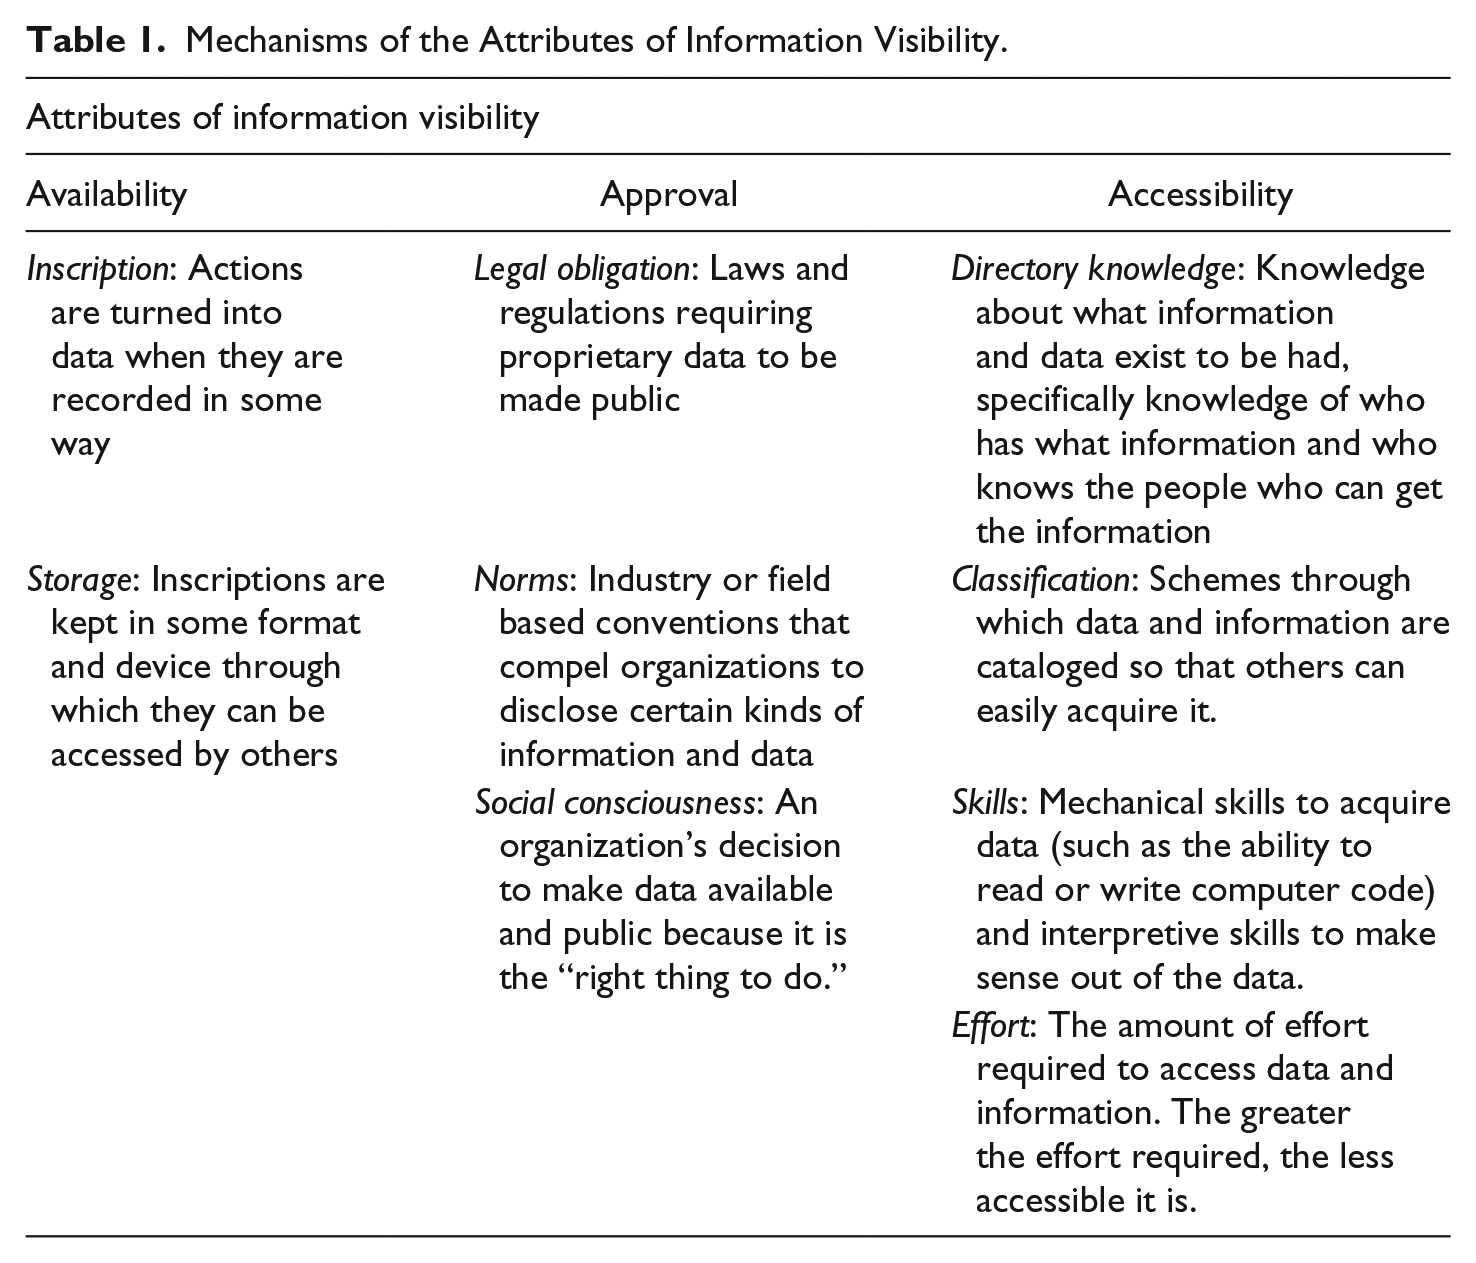
Typically, studies that discuss transparency conceptualize information visibility as a scalar construct, that is, information ranges in visibility from low to high levels. Arguing that such a simplistic notion of information visibility might inhibit our understanding of behavior in the digital age, Stohl et al. (2016) conceptualized visibility as a combination of three attributes: (1) the availability of information, (2) whether or not approval has been given to disseminate information, and (3) the accessibility of information to third parties. Each attribute, they argued, may independently and/or co-jointly contribute to the degree to which the inner workings of an organization are associated with organizational transparency. These attributes do not necessarily operate in a linear fashion. For example, authoritative approval for dissemination of a particular set of data may generate a demand for the inscription of information that was heretofore unavailable.
Availability is generated through two mechanisms: inscription and storage. Whether it involves documenting critical issues, the data used in discussions about those issues, or the decisions made about them must be inscribed into some form of data to become available. These data may be written, visual, oral, or contained in digital traces. Availability also depends on records of information that are produced when organizational issues and decisions are stored and preserved.
Once organizational information is made available, it must also be approved for others to see. Approval is rooted in various types of pressure in the broader institutional environment, including both actual and potential regulatory obligations and consequences (i.e., legal obligations), normative disclosure practices within particular industries or organizational fields (i.e., norms), and societal benefits (i.e., social consciousness).
Accessibility concerns the level of difficulty involved in retrieving available data and interpreting information. Making information accessible requires facilitating directory knowledge around who knows what and who knows whom as well as the breadth of information available; providing an understanding of how relevant information is coded and sorted (i.e., classification); enabling the operative capacities to find and retrieve information and interpretive skills to make sense of it; and minimizing the amount of effort in the process.
Together, these three attributes—availability, approval, and accessibility—are theorized to define the concept of information visibility. Specifically, when information is readily available, approved for release or dissemination, and easily accessible to those who want it, it can be considered visible. When each of these attributes are in short supply, information is considered to be less visible or, in extreme cases, invisible. Although Stohl et al. (2016), theorized the relationship between these attributes and the mechanisms that constitute them, they stopped short of articulating specific measures by which to assess each attribute and, importantly, they failed to provide evidence that these three attributes cohere as a conceptual set. In what follows, we build on this prior work to provide a means of empirically identifying visibility in action.
Research Approach
To validate the Information Visibility Scale, the following steps were taken. In Phase 1, items were formulated and evaluated on the basis of the existing descriptions of the three attributes of visibility—availability, approval, and accessibility—introduced by Stohl et al. (2016). Because each attribute and its underlying mechanisms were conceptualized in detail in this prior work, a deductive scale development approach is taken (Hinkin, 1995, 1998). The three attributes of visibility are assumed to form a three-dimensional scale, in which the mechanisms of each visibility attribute are expected to form its subdimensions (see Table 1). To test this factor structure, a sample of approximately 200 respondents is needed (Hinkin, 1995, 1998). Because a deductive approach was taken, in Phase 2, a confirmatory factor analysis (CFA) was used to evaluate the theorized factor structure of the scale, as depicted in Figure 1 (Slavec & Drnovšek, 2012). This phase was also used for item reduction. Because parsimony and simple structure are preferred in scale construction, the three highest loading items on the appropriate factor were retained (Hinkin, 1998). In Phase 3, the internal consistency or reliability of the different constructs is examined by analyzing the homogeneity of items within the scale. In Phase 4, construct validity is further assessed by evaluating convergent and discriminant validity (Campbell & Fiske, 1959). A measure has convergent validity if underlying measures of the same construct are highly correlated. To assess discriminant validity, the scale is correlated with two similar, but conceptually different established measures of organizational information (i.e., information flow and communication climate). In Phase 5, Phases 2 to 4 are replicated with an independent employee sample to enhance the generalizability of the Organizational Visibility Scale (Hinkin, 1998). In Phase 6, the second sample is used to test the criterion-related validity of the new scale by investigating the relationship between organizational visibility and organizational transparency. Finally, in Phase 7, after scale validity is established, a shorter scale will be developed, based on the factor loadings and the content of the items, aiming to capture the three dimensions. This shorter scale could be used as a general measure of organizational information visibility, rather than the long scale, which explores the theoretical subdimensions. The short Information Visibility Scale could be useful for researchers interested in general relationships between information visibility and other organizational phenomena, for example, knowledge sharing, whereas the longer scale can be used for research questions related to the why, how, and type of organizational information visibility.
Mechanisms of the Attributes of Information Visibility.
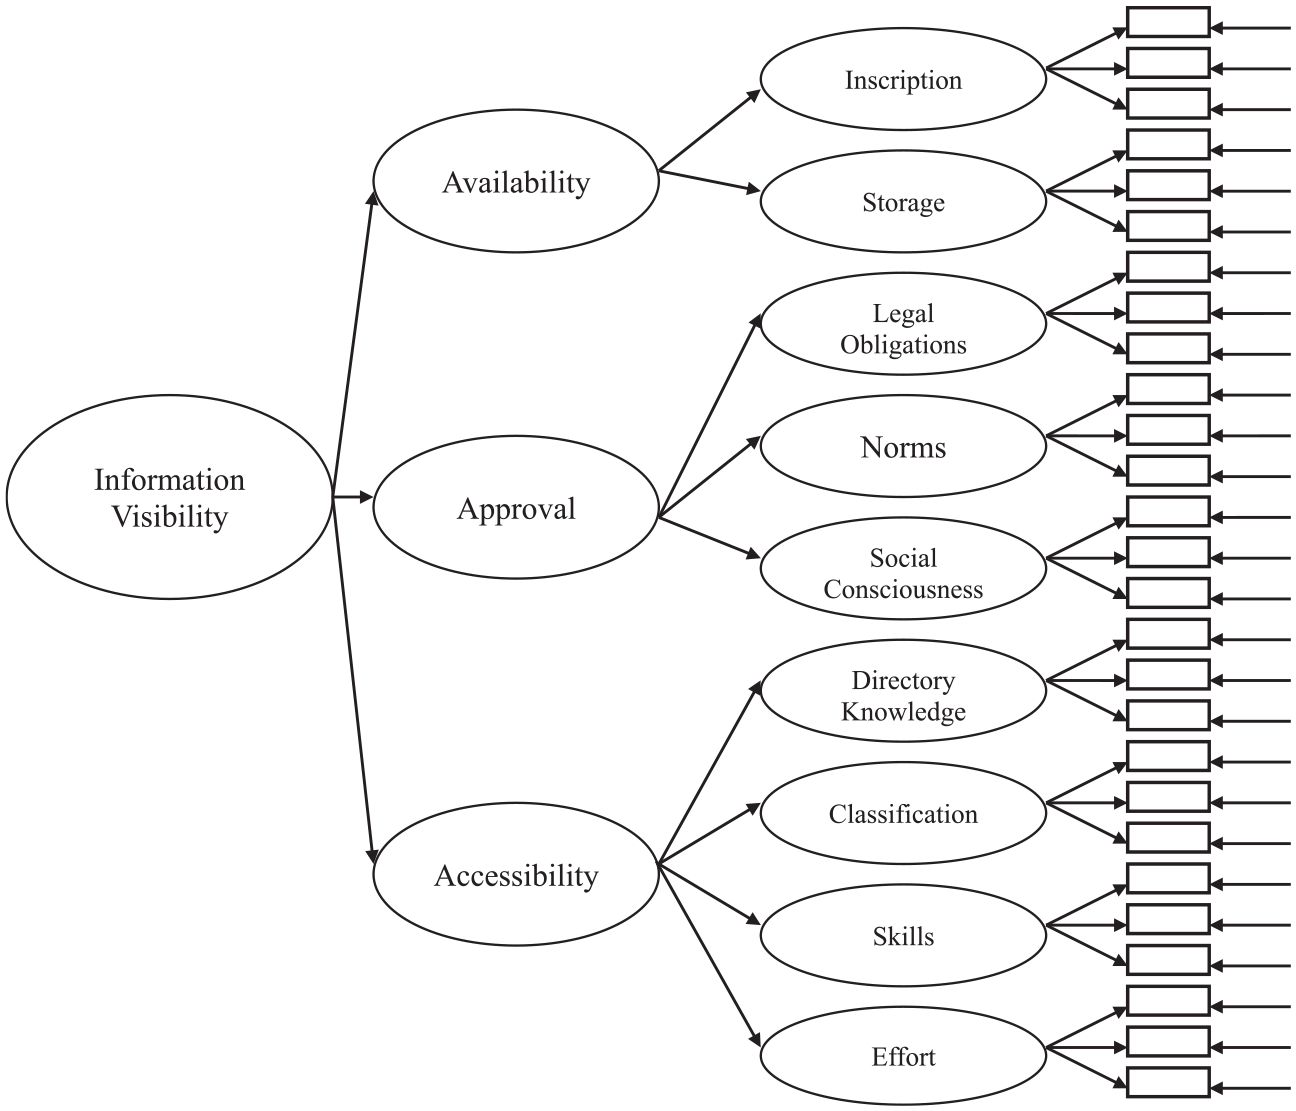
Higher-order factor structure of the Information Visibility Scale.
Method
Procedure and Participants
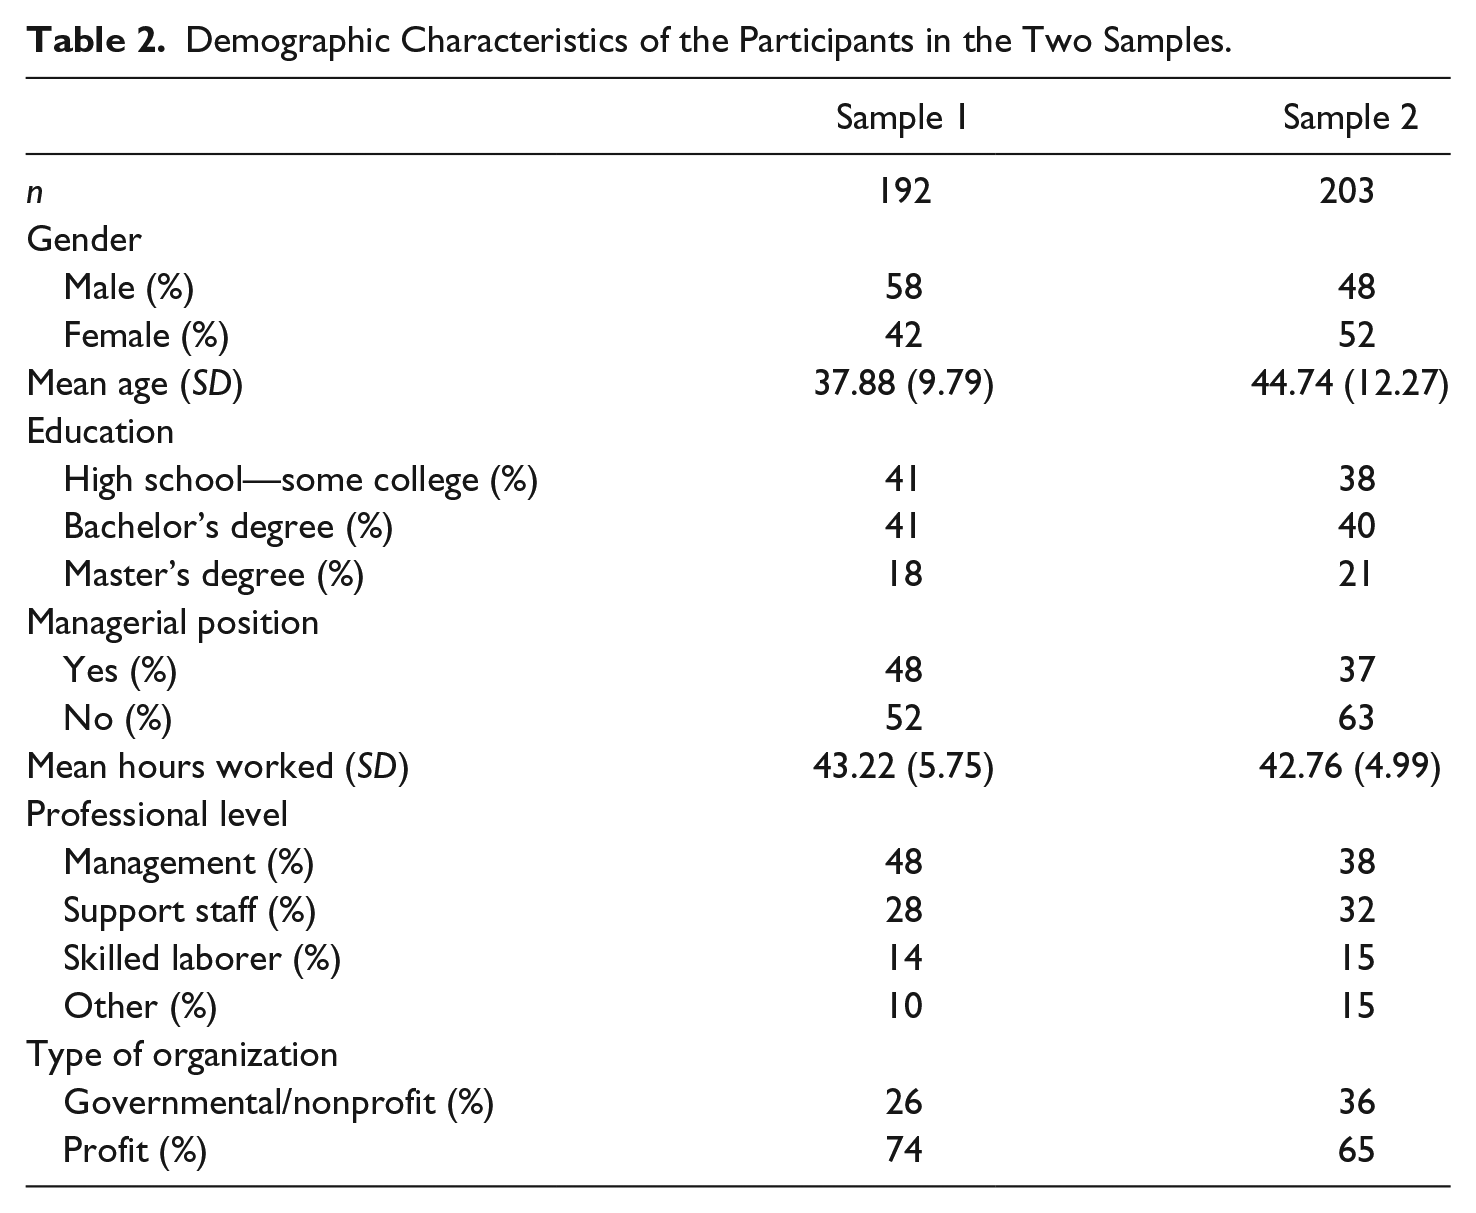
Two samples (total N = 395) of full-time U.S. employees from organizations with 50 employees or more were used throughout the seven phases of this research. Employees from companies with 50 employees or more were chosen because reporting and compliance requirements are mandated after this threshold (Przystanski, 2018) and thus are comparable in terms of visibility requirements. Regarding employment status, full-time employees were selected, because previous research showed inconsistent and inconclusive results when comparing work attitudes of full- and part-time employees (Conway & Briner, 2002). Sample 1 consisted of 192 registered users of Amazon’s Mechanical Turk, a crowdsourcing platform. Mechanical Turk has recently emerged as a reliable source of survey data for research in the social sciences (Buhrmester, Kwang, & Gosling, 2011; Goodman, Cryder, & Cheema, 2013; Keith, Tay, & Harms, 2017). To date, scale reliability derived from Mechanical Turk samples is identical to or better than that of other samples (Behrend, Sharek, Meade, & Wiebe, 2011; Buhrmester et al., 2011; Johnson & Borden, 2012). To enhance accuracy, data collection was restricted to U.S. workers with the premium qualification “full-time employees,” as recommended by, respectively, Chandler and Shapiro (2016) and Keith et al. (2017). Sample 2 (n = 203) was collected by the research company Survey Sampling International (SSI; e.g., Jiang & Men, 2017). Their panel is ISO 20252 certified. The data for the two samples were collected through a voluntary and confidential online survey of approximately 10 minutes, consisting of Likert-type questions and demographics. Four attention checks were included throughout both surveys to make sure inattentive participants could be detected and excluded from the final samples (Cheung, Burns, Sinclair, & Sliter, 2017; Rouse, 2015). Both studies were in compliance with the universities’ institutional review boards policies. In exchange for participation, participants of Sample 1 received a small monetary reimbursement (adhering to recommendations of Mechanical Turk respondents: http://wiki.wearedynamo.org/index.php?title=Fair_payment) and participants of Sample 2 were entered into a drawing through which they could win a financial award. Information about participants’ background variables is displayed in Table 2.
Demographic Characteristics of the Participants in the Two Samples.
Utilization of Established Measures
For the measurement of the previously validated latent constructs in this study (i.e., communication climate, information flow, trust, and transparency), three to seven items from established scales were used. All answer categories ranged from 1 (strongly disagree) to 5 (strongly agree).
Communication climate, or how information is communicated in the organization, was based on a scale developed by Smidts, Pruyn, and Van Riel (2001). The scale consisted of six items, such as “The objectives of my organization are probably only known by those who formulated them” and “The information we receive here is often about trivial matters” (both reverse-coded; αSample 1 = .82, αSample 2 = .81).
Information flow was defined as the extent to which an employee felt she or he got enough information to do her or his job properly and the extent to which changes at work were communicated clearly. The construct was measured using Glaser, Zamanou, and Hacker’s (1987) 4-item Information Flow Scale (αSample 1 = .85, αSample 2 = .88). The items read as follows: “I get enough information to do my job well,” “I get enough information to understand the big picture here,” “When changes are made, the reasons why are made clear,” and “I know what is happening in work sections outside of my own.”
Trust is defined as “one party’s level of confidence in and willingness to open oneself to the other party” (Hon & Grunig, 1999, p. 2) and captured by using two measurement instruments. The first instrument is developed by Rawlins (2009) and consists of three items, such as “I’m willing to let the organization make decisions for people like me” (αSample 1 = .63, αSample 2 = .62). The second organizational trust scale was measured using four items (Dapko, 2012)—for example,“My organization can be counted on to do what’s right” (αSample 1 = .95, αSample 2 = .96).
Transparency is a multifaceted construct that describes organizational effort to accurately reveal information and actions, both positive and negative in nature, for the purpose of enhancing the reasoning ability of stakeholders (Rawlins, 2009). The first measurement instrument that is used to capture transparency is the “Overall Transparency” scale by Rawlins (2008), which addresses the dimensions participation, substantial information, accountability, and secrecy using four items, such as “The organization wants to be accountable to people like me for its actions” (αSample 1 = .92, αSample 2 = .93). Second, the 7-item transparency scale developed by Dapko (2012) was used. An example item is “My organization is willing to explain its decisions to me” (αSample 1 = .95, αSample 2 = .96).
Control variables: To control for possible variability of the scale for different demographics, gender, age, education, working hours, managerial position, and sector were included in the analyses. Gender was measured as a dichotomous variable (0 = male, 1 = female), age as a continuous variable. To be added as a control variable, education was recoded into a dichotomous variable (0 = less than high school to some college, 1 = college and advanced degree). On the organizational level, working hours was included as a continuous variable. Managerial position (no = 0, yes = 1) and sector (0 = profit, 1 = nonprofit) were both operationalized as dichotomous variables.
Analysis
Structural equation modeling (SEM) in AMOS was used to examine the hypothesized factor structure of the Information Visibility Scale (see Figure 1) and eventually its relationship with transparency. SEM is a confirmatory approach to data analysis for analyzing fully latent structural models (Kline, 2011). To evaluate model fit, two incremental and two absolute fit indices are examined (e.g., Hu & Bentler, 1999; Kline, 2011). The incremental fit indices used are the Tucker–Lewis index (TLI) and the comparative fit index (CFI). Cut-off values of .95 indicate excellent fit, whereas values of .90 indicate good fit (Hu & Bentler, 1999). The examined absolute fit indices are a standardized version of the root mean square residual (SRMR) and the root mean square error of approximation (RMSEA). RMSEA below 0.05 in combination with SRMR values below 0.09 indicate excellent fit, whereas values below 0.08 and 0.10, respectively, indicate good fit (Byrne, 2001). Finally, the χ2 statistic primarily serves as a relative measure to evaluate incremental model fit between the retained and alternative models or the nested models using a Δχ2 test (Kline, 2011).
Results
Phase 1: Item Development
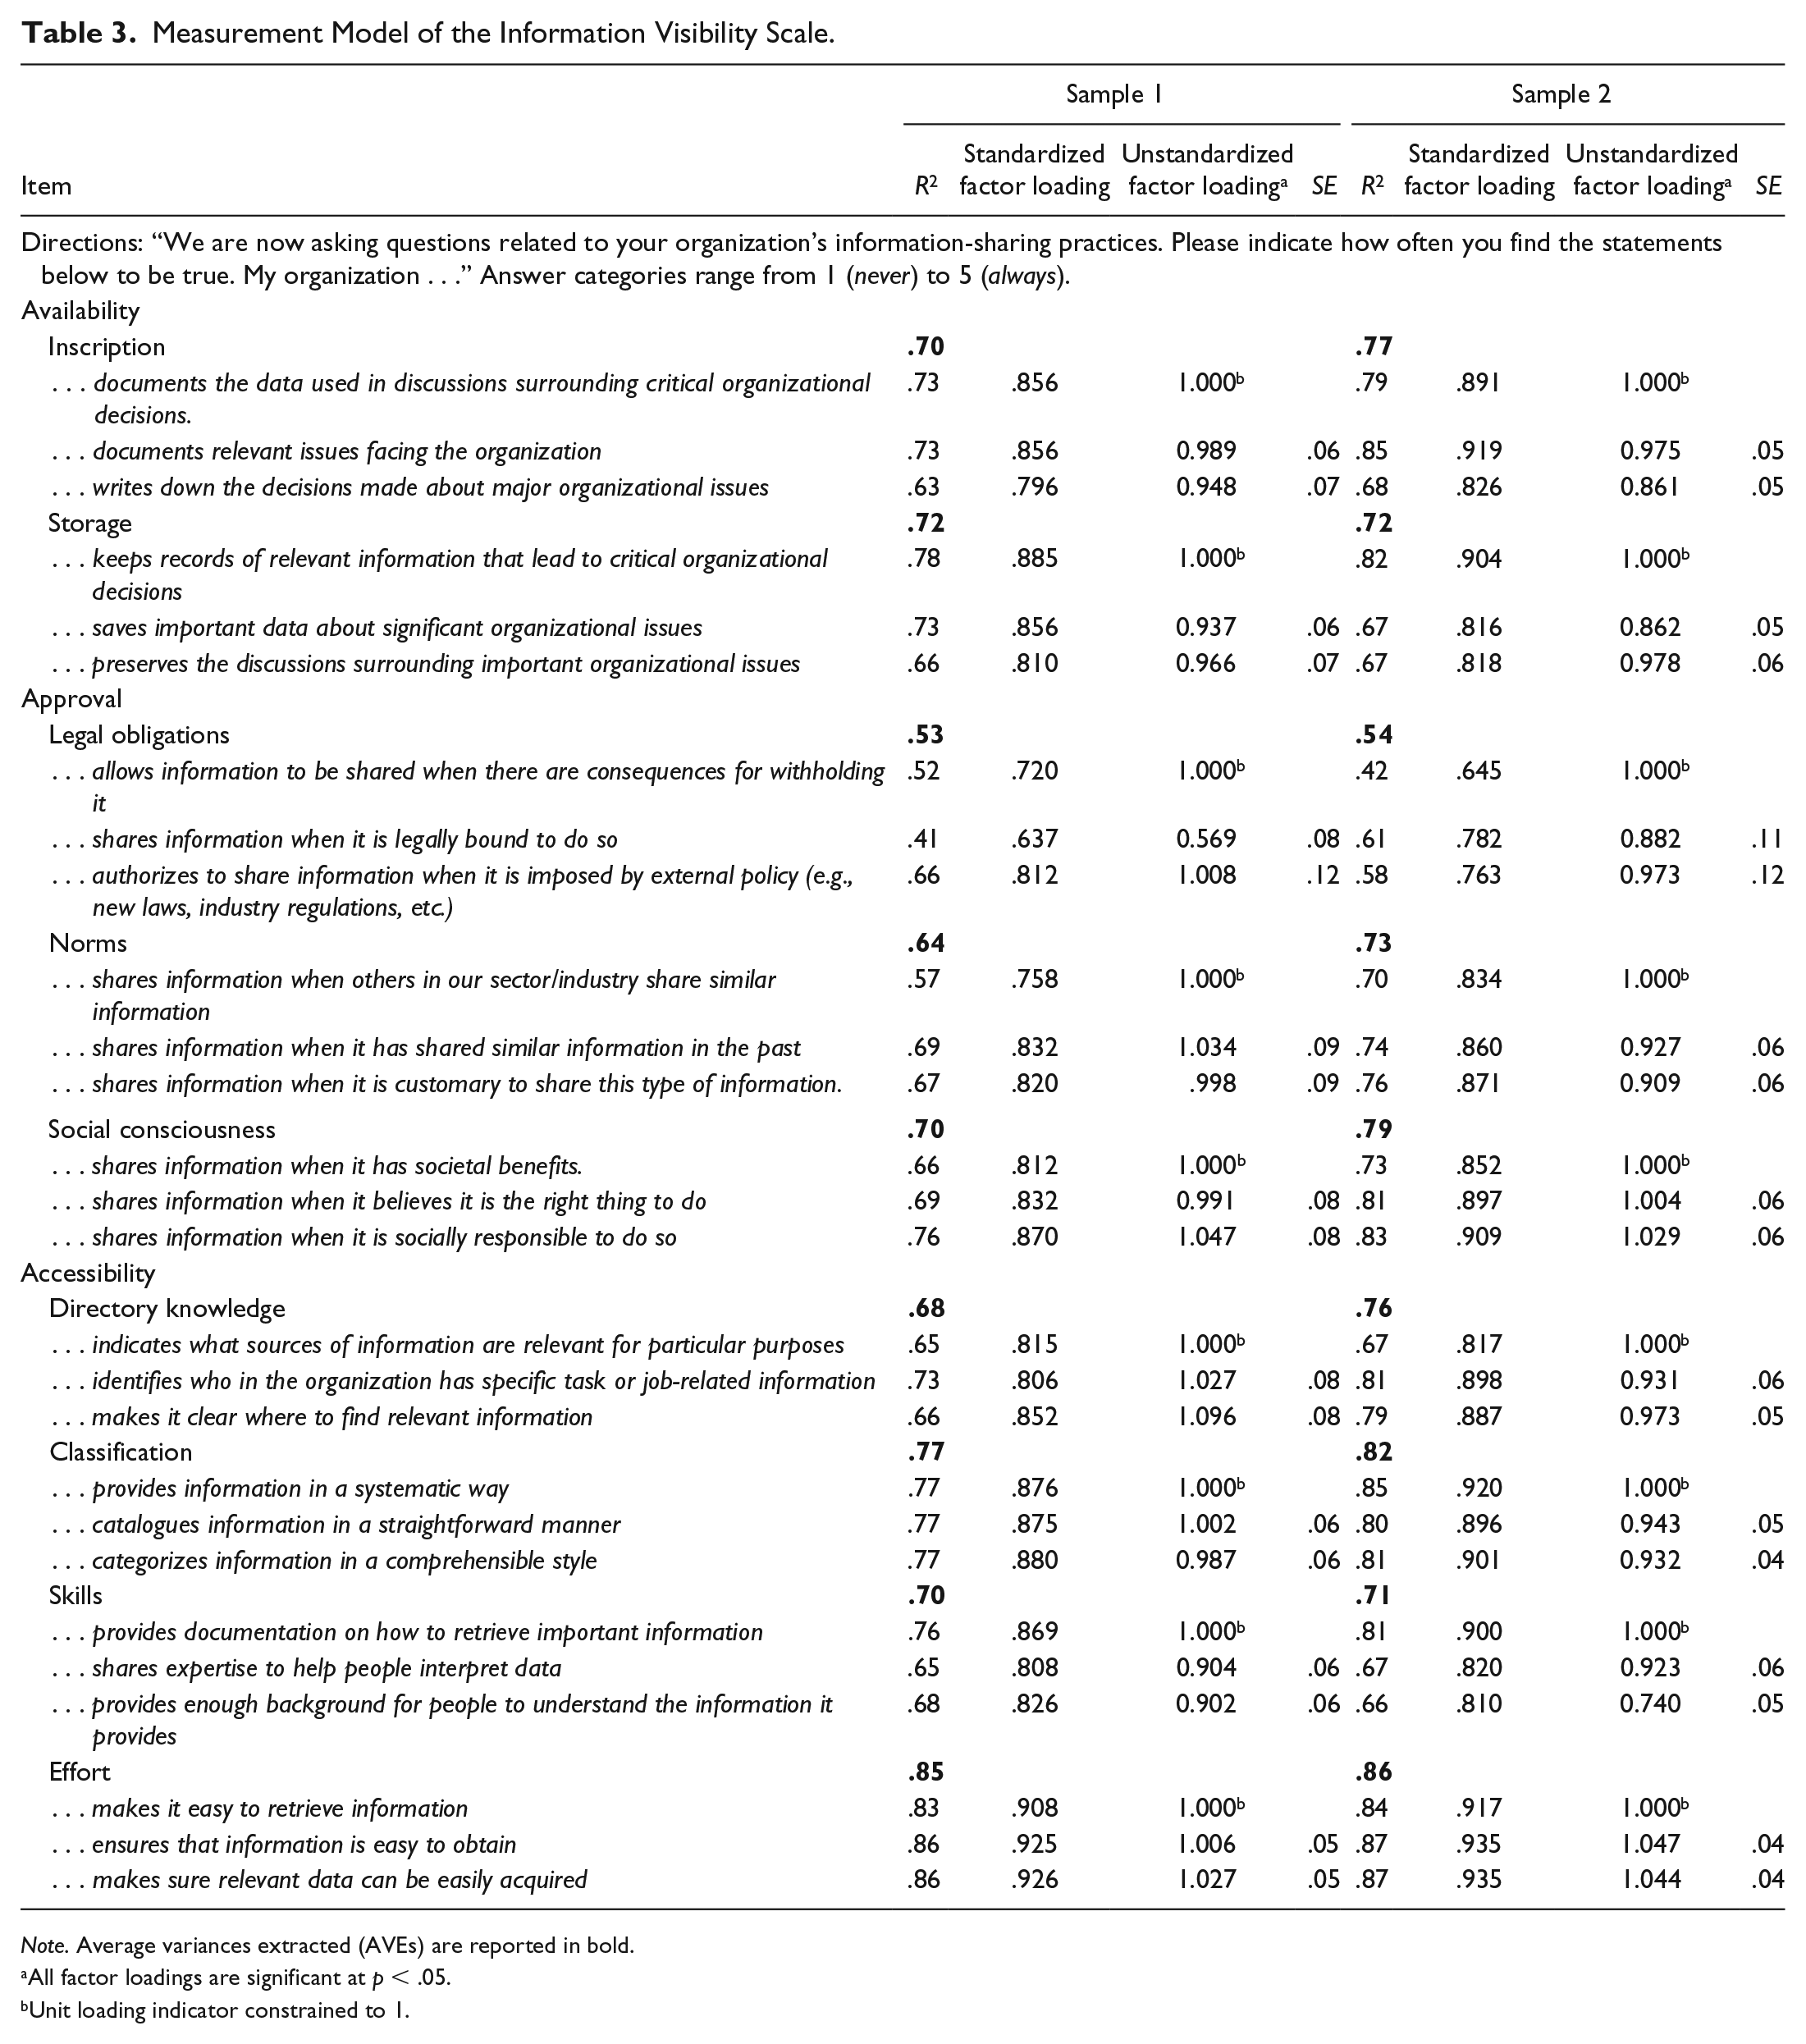
Based on the operationalization of information visibility by Stohl et al. (2016), further defined in Table 1, four items for each of the nine subdimensions were developed. Since availability has two subdimensions (inscription and storage), approval has three (legal obligations, norms, and, social consciousness), and accessibility has four subdimensions (directory knowledge, classification, skills, and effort); this amounts to a final item pool of 36 items. The authors went through multiple discussion rounds to establish the final wording of the items. After that, three external judges (an administrative staff member, a student, and a knowledge worker) provided feedback on the comprehensibility of the items. This resulted in a few final adjustments to the item wording. Table 3 presents all the retained measurement items, factor loadings, and average variance extracted of Sample 1 and Sample 2.
Measurement Model of the Information Visibility Scale.
Note. Average variances extracted (AVEs) are reported in bold.
All factor loadings are significant at p < .05.
Unit loading indicator constrained to 1.
All items were formulated as statements following the introduction “We are now asking questions related to your organization’s information-sharing practices. Please indicate how often you find the statements below to be true. My organization . . .” Responses were made on a 5-point Likert-type scale ranging from 1 (never) to 5 (always). Before administering the questionnaire, the items were randomly ordered.
Phase 2: Item Selection and Factor Structure
First, the mean and standard deviation of all 36 items in Sample 1 were examined. The means of the items ranged from 3.43 to 4.56. All standard deviations greatly exceeded 0.50, which was indicative of adequate variability (Stumpf, Colarelli, & Hartman, 1983). Next, the factor structure of the Information Visibility Scale was examined, using CFA, including the 36 initial items. The measurement model shows satisfactory model fit: χ2(558) = 1,014.95; CFI = 0.93; TLI = 0.92; SRMR = 0.05 and RMSEA = 0.065 (confidence interval (CI) = [0.059, 0.072]). All the loadings on the intended latent constructs were significant and sizable, ranging from 0.66 to 0.92. However, for reasons of parsimony, only the three highest loading items without high cross-loadings per construct were retained, leaving a total of 27 items in the scale, with factor loadings ranging from 0.64 to 0.93 on the intended latent constructs (see Table 3). This measurement model shows excellent fit: χ2(288) = 423.91; CFI = 0.96; TLI = 0.96; SRMR = 0.04, and RMSEA = 0.050 (CI = [0.039, 0.060]). 1
To examine possible different scores on the nine subdimensions (Table 3) between the demographic variables operationalized in the “Method” section (gender, age, education, working hours, managerial position, and sector), a series of one-way analysis of variance (ANOVA) was conducted. Results only showed statistically significant differences for managerial versus no managerial position. Employees who had a managerial position reported higher perceptions of information visibility compared with employees who did not have a managerial position, with the exception of the subdimension Norms (this difference was not statistically significant). To test whether this had influence on the psychometric properties of the scale, we included the demographic variables one by one in the measurement model mentioned above. The analyses showed similar findings with and without control variables, also when including managerial position in the model. For reasons of parsimony, analyses without controls are reported.
In the next step, the theorized third-order factor structure was tested to investigate if this model provided a better fit to the data when compared with alternative models (see Table 4). In each sample, the third-order factor model (Model A) was compared with three different models in which two dimensions of visibility were taken together and contrasted with the remaining dimension of visibility (Models B-D in Table 4) and with the one factor model combining all three dimensions in one latent higher order factor model (Model E). Furthermore, the third-order factor structure was compared with two second-order factor models: Model F examines a factor structure with the three dimensions of visibility (without their subdimensions) as second-order factors, and Model G tests a second-order factor structure with four latent higher order factors: availability, approval, accessibility, and legal obligations (separate from the other approval items). Results reveal that the initially assumed third-order factor structure fit the data well (Table 4). Moreover, significant differences in χ2 value indicated that Model A yielded superior fit compared with any of the alternative models (Models B-G).
Fit Indices for the Various Higher-Order Factor Models of Information Visibility in Samples 1 and 2.
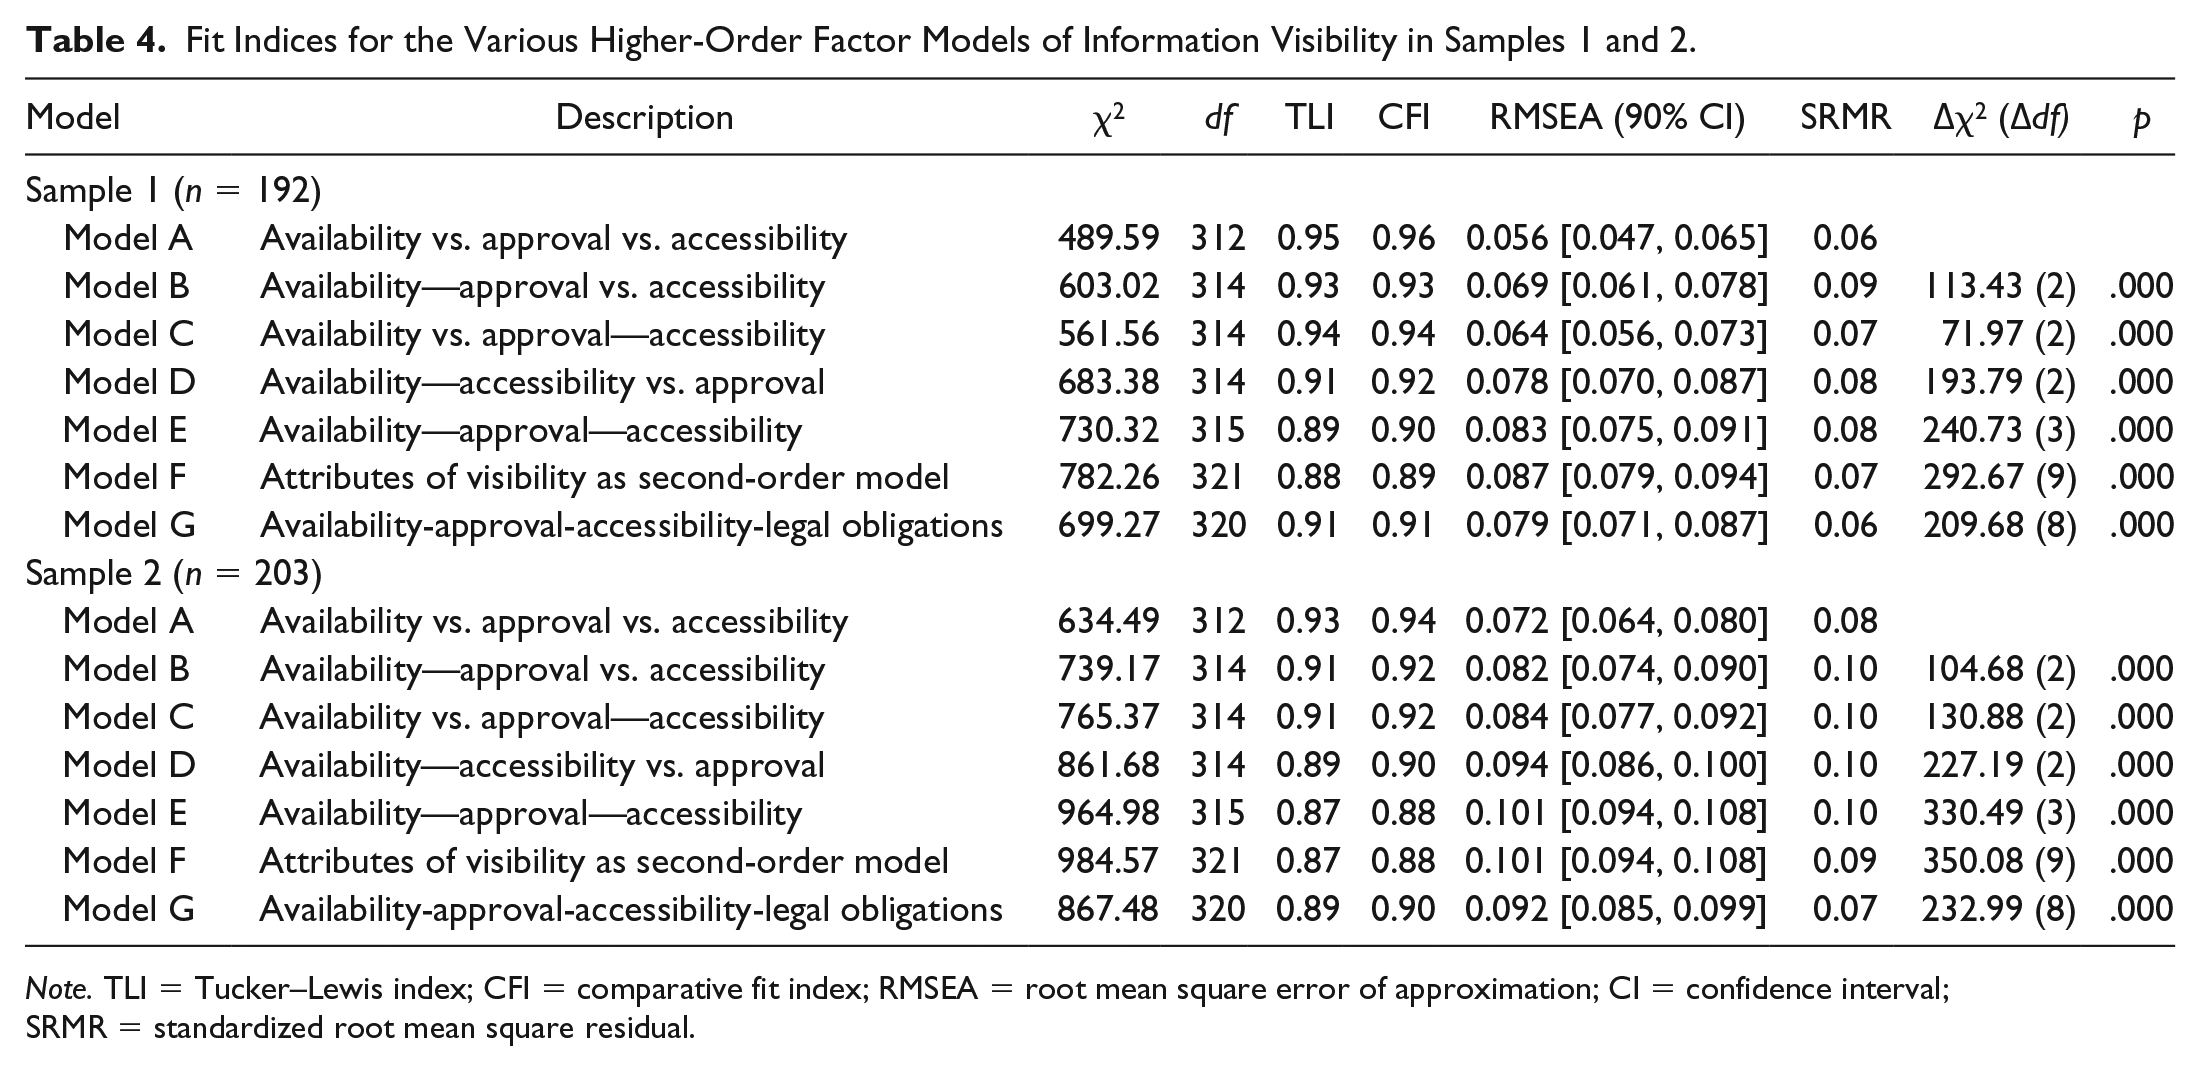
Note. TLI = Tucker–Lewis index; CFI = comparative fit index; RMSEA = root mean square error of approximation; CI = confidence interval; SRMR = standardized root mean square residual.
Phase 3: Internal Consistency
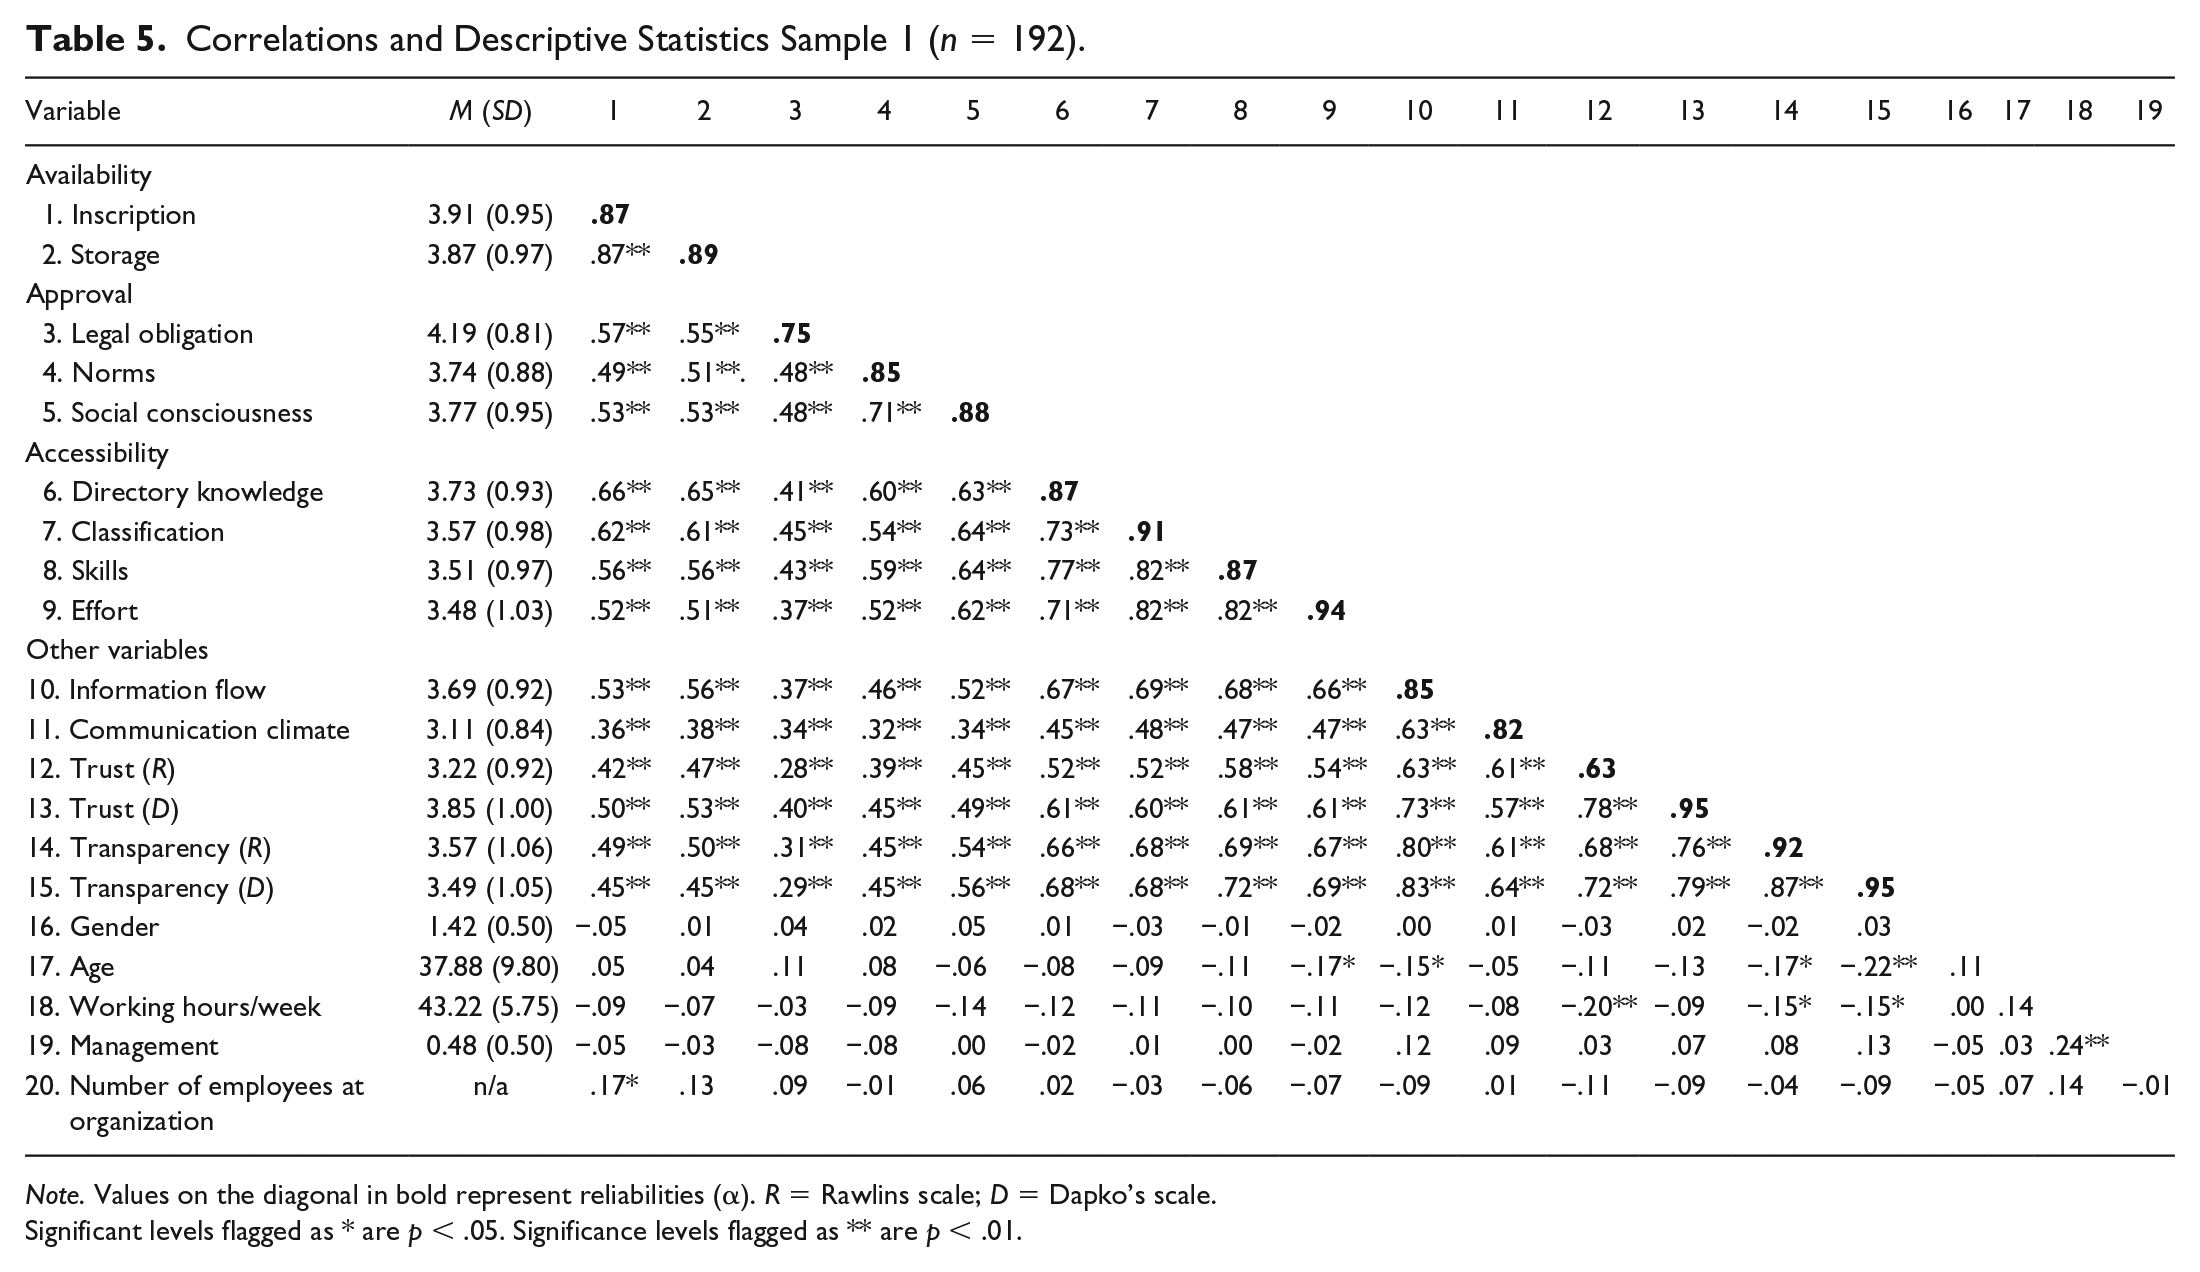
The most commonly used method for item selection in scale development is internal consistency analysis. It reflects the precision of a measurement instrument and is a necessary condition for validity (Hinkin, 1998). A scale is internally consistent if its items are highly intercorrelated and, as such, measure the same construct (Slavec & Drnovšek, 2012). Adequate internal consistency reliabilities can be obtained with as few as three items (Hinkin, 1995). Internal consistency should be assessed after unidimensionality has been established (see Phase 2; Hinkin, 1998). The most widely used measure to assess internal consistency is Cronbach’s (1951) alpha coefficient. Table 5 presents the internal scale reliabilities of the Information Visibility Scale’s subdimensions. The reliabilities of the nine subdimensions ranged from α = .75 to α = .94. As such, they are all above the threshold of the generally agreed upon minimum of α = .70 (Hinkin, 1998).
Correlations and Descriptive Statistics Sample 1 (n = 192).
Note. Values on the diagonal in bold represent reliabilities (α). R = Rawlins scale; D = Dapko’s scale.
Significant levels flagged as * are p < .05. Significance levels flagged as ** are p < .01.
Phase 4: Construct Validity
Construct validity is investigated through assessing convergent and discriminant validity. Following Slavec and Drnovšek (2012), convergent validity is the extent to which the subdimensions share variance. Thus, the Information Visibility Scale has convergent validity if the independent dimensions are highly correlated. The correlations of the dimensions can be found in Table 5. The correlations between the dimensions range from r = .41 (between legal obligations and directory knowledge) to r = .87 (between inscription and storage) and are all statistically significant, indicating satisfactory convergent validity.
To assess discriminant validity, the scale is correlated with two similar, but conceptually different established measures of organizational information (Slavec & Drnovšek, 2012). First, communication climate by Smidts et al. (2001) was employed. The correlations between this scale and the nine newly developed subdimensions were all statistically significant (ranging from r = .32 to r = .48), but lower than the correlations between the subdimensions themselves. Second, information flow by Glaser et al. (1987) was used as an established measure of organizational information. The correlations between information flow and the subdimensions of the Information Visibility Scale were also statistically significant (ranging from r = .37 to r = .69), but lower than the correlations among the nine subdimensions of the new scale. These correlations show that the Information Visibility Scale is related to existing and comparable constructs, yet is clearly distinguishable.
Phase 5: Replication
To enhance the generalizability of the new scale, an independent sample was collected. According to Hinkin (1998), the CFA, model comparison, internal consistency, and the construct validity assessments should be replicated. Therefore, the CFA model with three items per dimension was run on Sample 2. Again, this measurement model shows excellent fit: χ2(288) = 522.205; CFI = 0.96; TLI = 0.95; SRMR = 0.04 and RMSEA = 0.06 (CI = [0.055, 0.072]). Second, to retest if the hypothesized third-order factor structure assessed best fit to the data, it was compared with alternative models. Table 4 illustrates the fit indices for the various measurement models and shows a superior fit for the hypothesized third-order measurement model. Third, the internal consistency of the nine dimensions of the Information Visibility Scale was assessed. The newly developed scales were also reliable in Sample 2, ranging from α = .75 to α = .95 (see Table 6). Finally, to evaluate construct validity, correlations between the nine dimensions and between the dimensions and two existing measures of organizational information were evaluated. Again, the correlations between the nine dimensions were statistically significant, paralleling the correlations with the two external measures, although these correlations were lower than the correlations between the dimensions of the scale.
Correlations and Descriptive Statistics Sample 2 (n = 203).
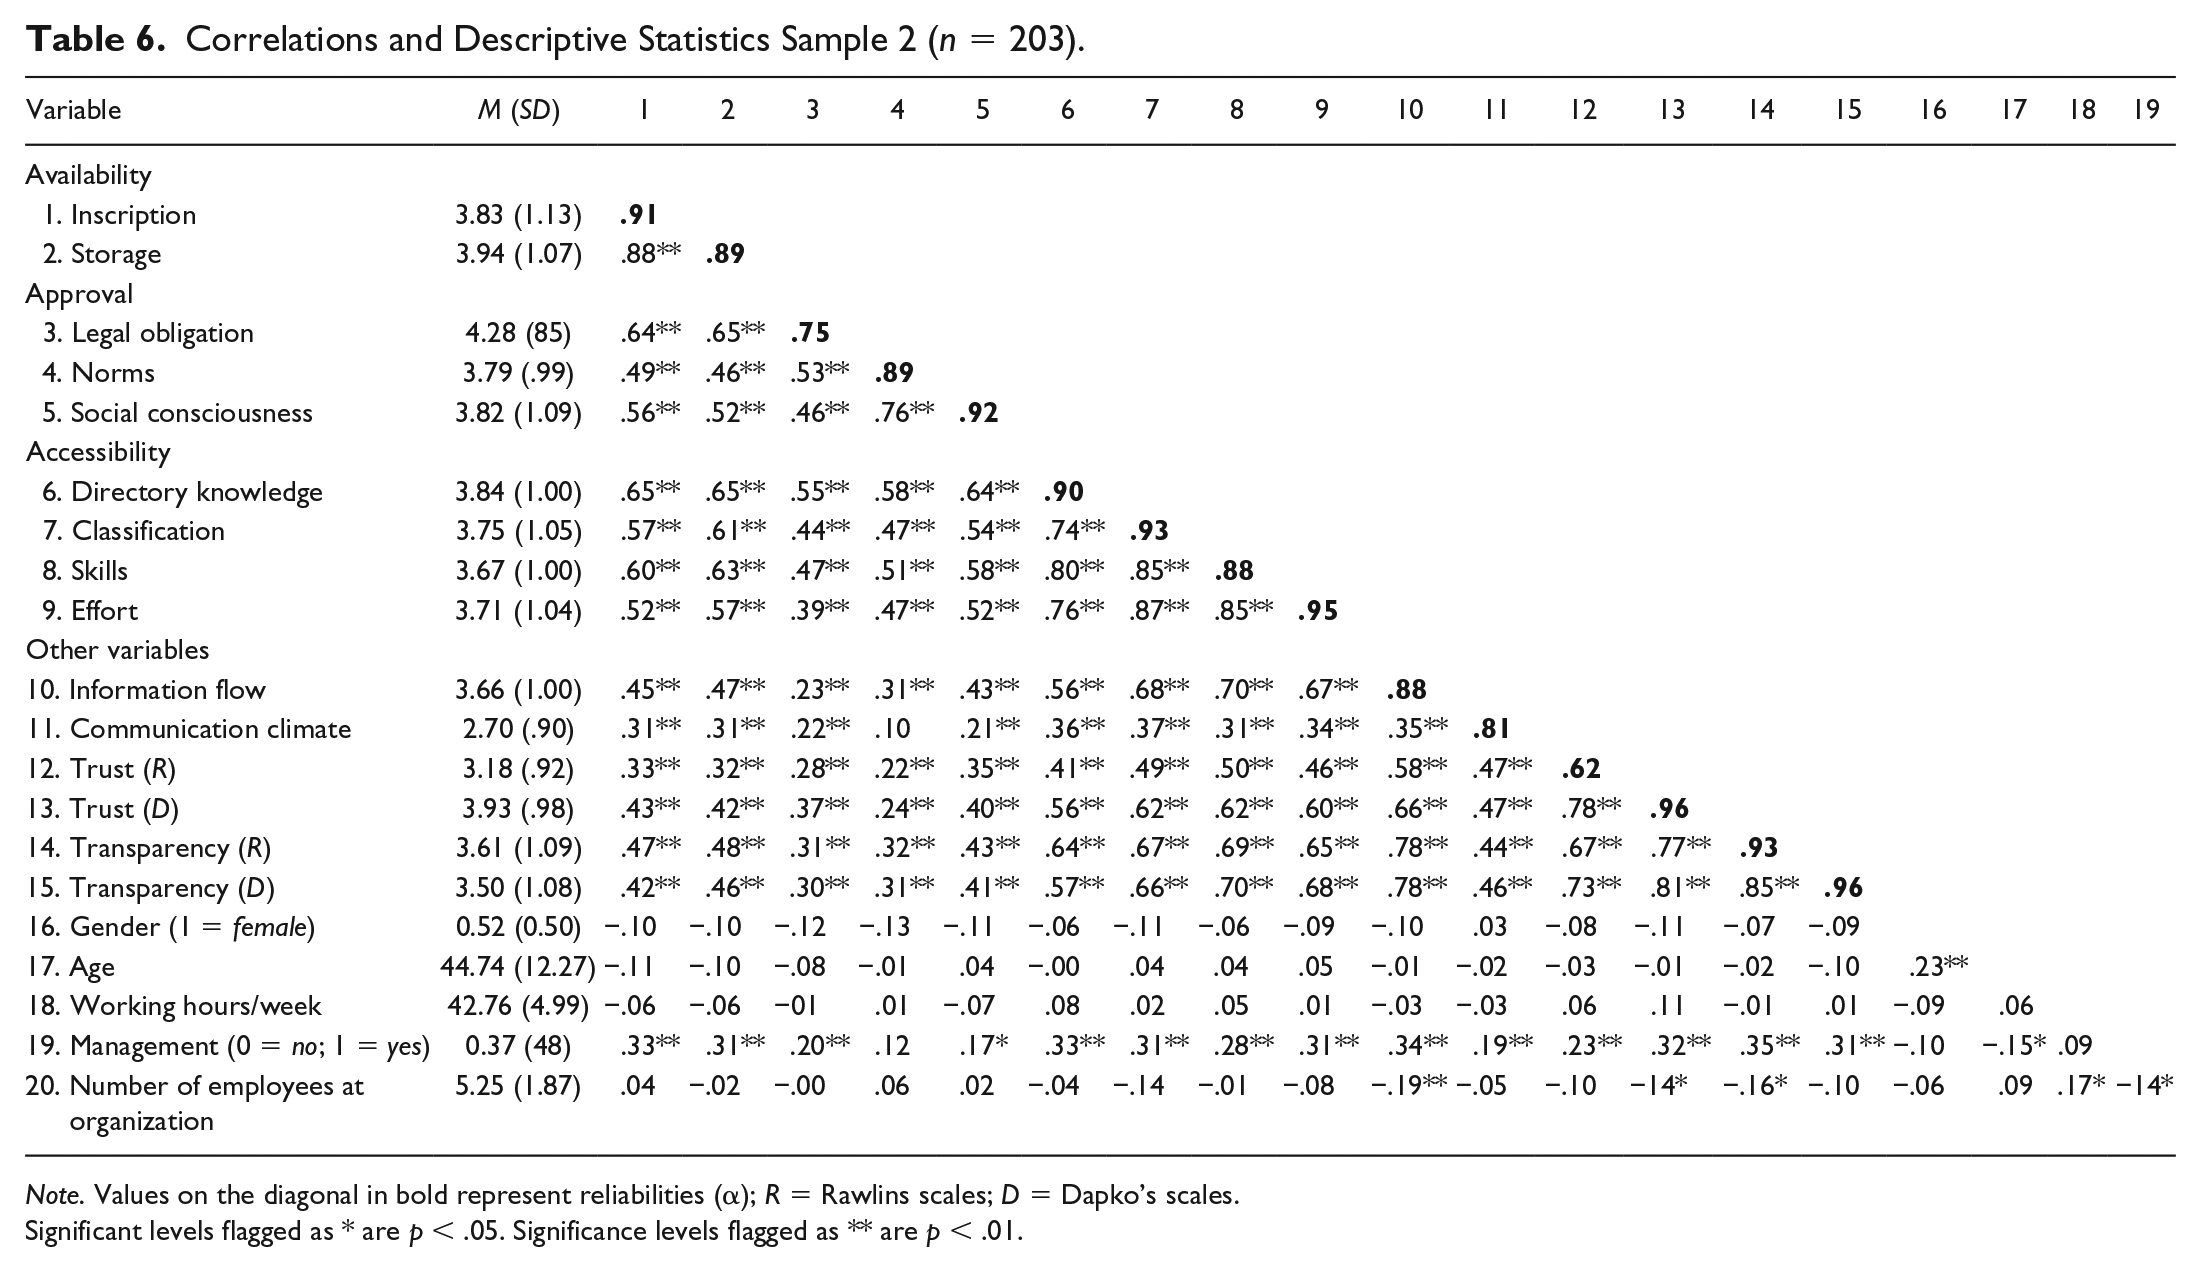
Note. Values on the diagonal in bold represent reliabilities (α); R = Rawlins scales; D = Dapko’s scales.
Significant levels flagged as * are p < .05. Significance levels flagged as ** are p < .01.
Phase 6: Criterion-Related Validity
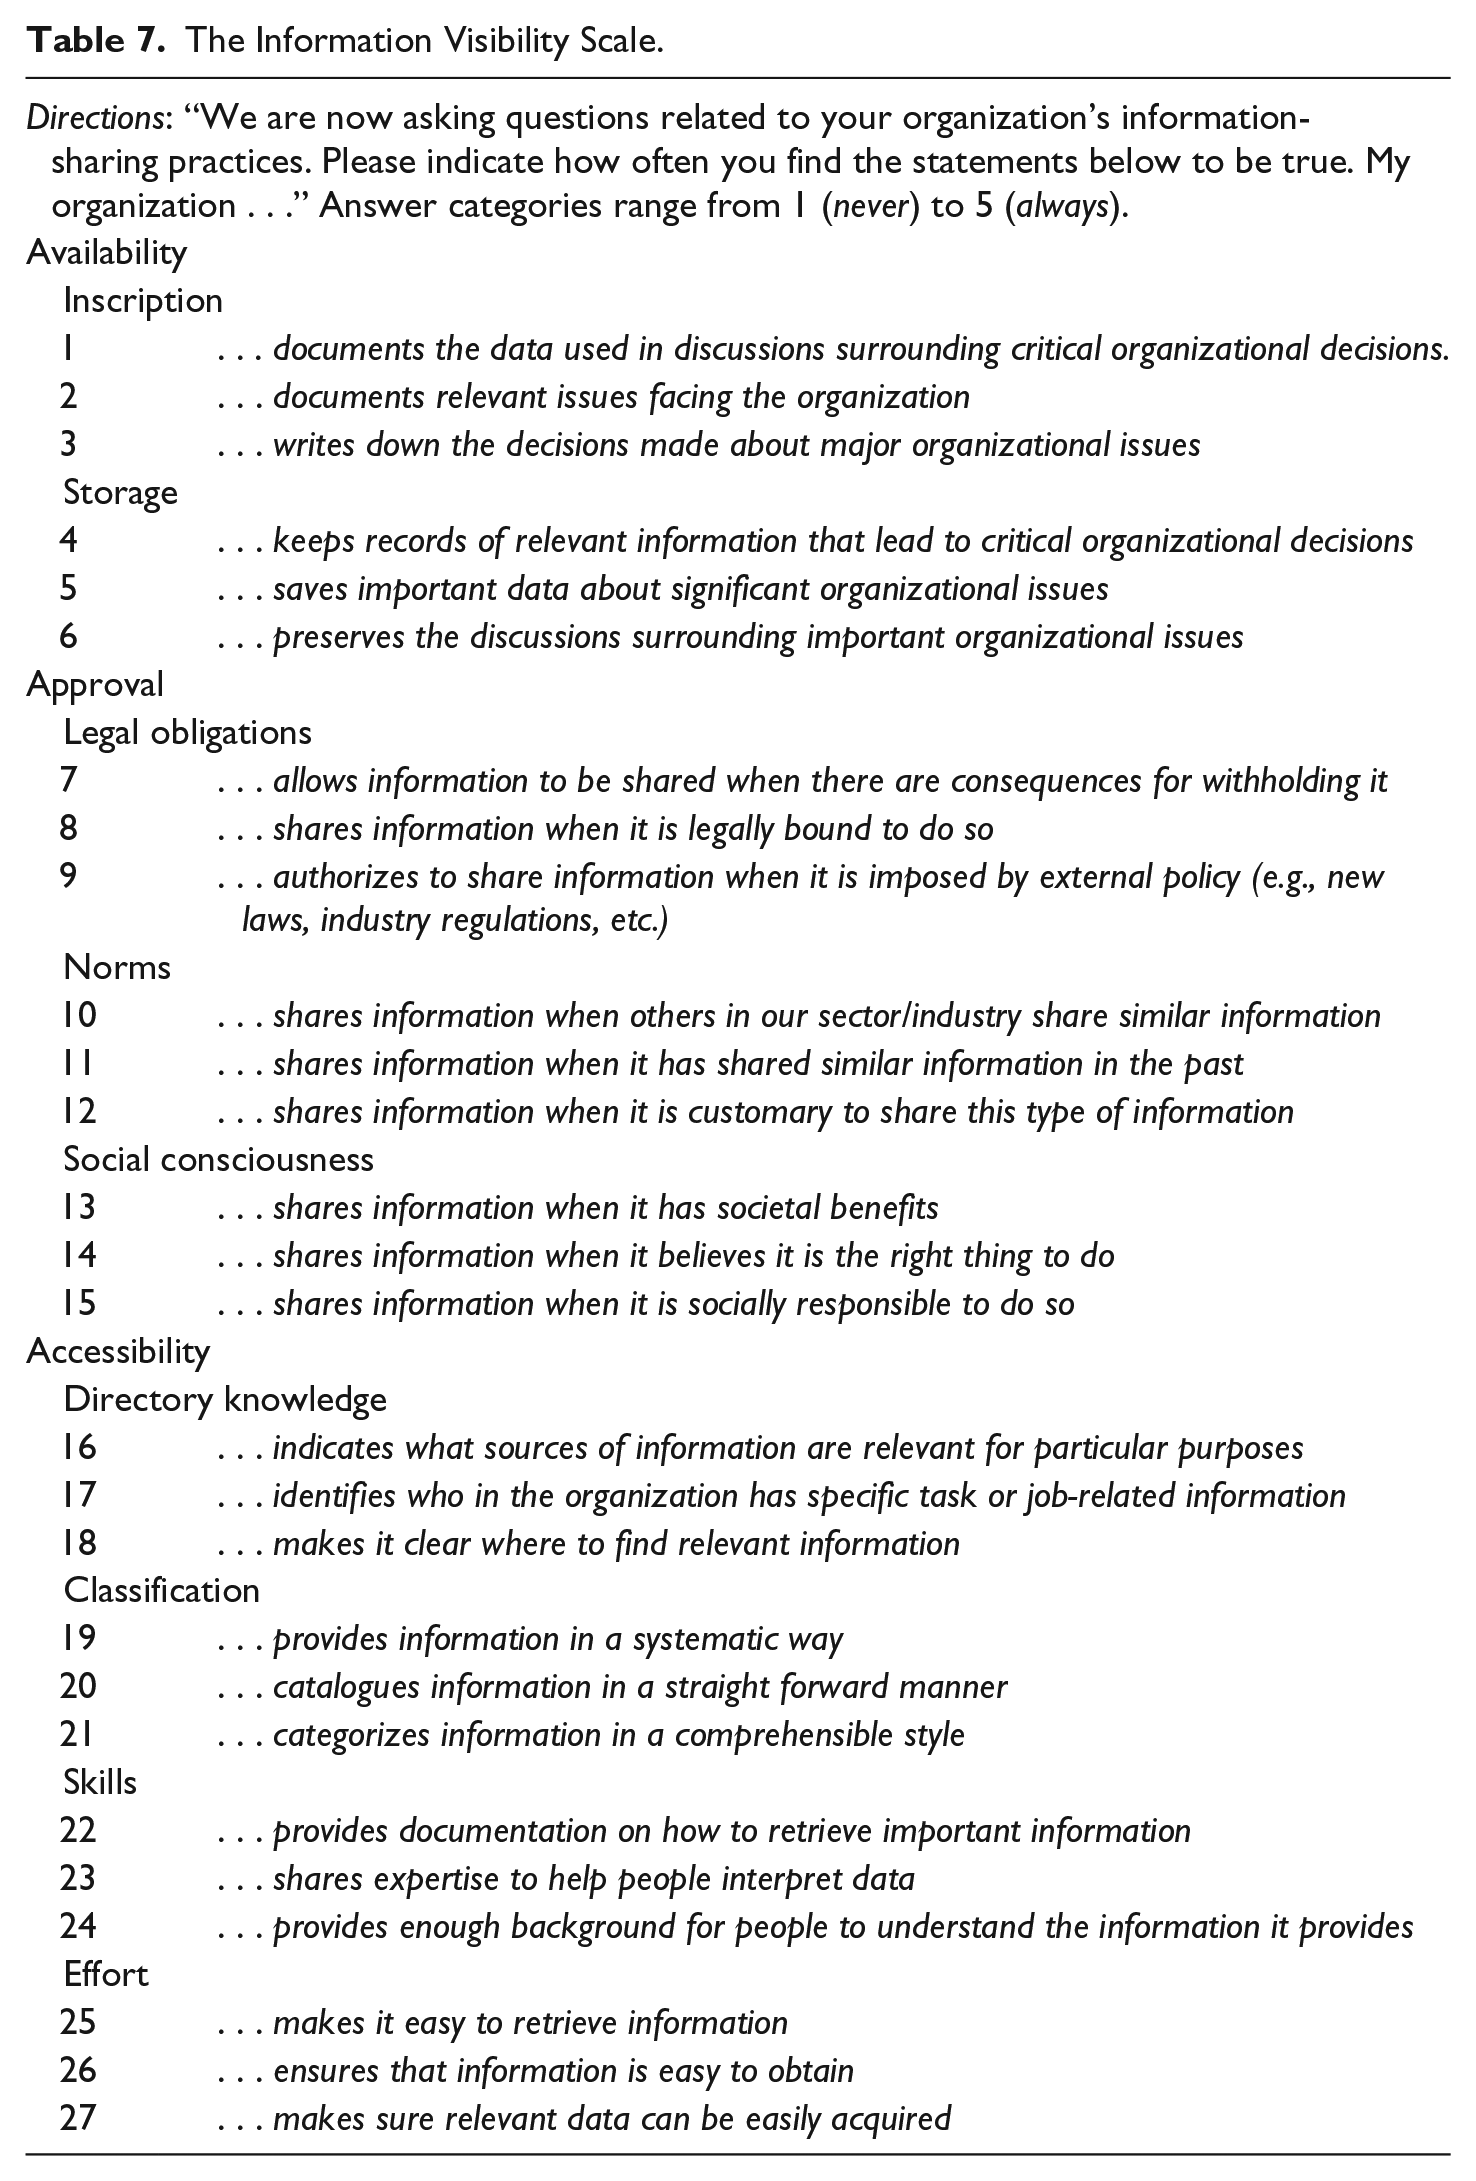
To establish criterion-validity, relationships should be examined among the Information Visibility Scale and variables with which a relationship could be assumed. These associations should be based on theory and may be examined using correlation and/or regression analyses. Statistically significant relationships between these variables would establish the criterion-related validity of the new scale. To this end, the relationships between the nine visibility dimensions and transparency in Sample 2 were examined. These correlations were all statistically significant, ranging from r = .30 (between legal obligations and transparency) to r = .70 (between skills and transparency). Second, the relationship between the higher-order construct information visibility and transparency was assessed in a structural model by adding the relationship with transparency to the third-order factor model. To do so, a CFA was conducted to make sure the nine dimensions of information visibility were distinct from organizational transparency. The measurement model showed good fit to the data: χ2(389) = 684.348; CFI = 0.95; TLI = 0.94; SRMR = 0.04; and RMSEA = 0.06 (CI = [0.054, 0.069]) and all the factor loadings were statistically significant and sizable, ranging from .71 to .94 on the intended latent constructs. Second, the structural model was examined. The structural model also showed good fit to the data: χ2(421) = 814.368; CFI = 0.93; TLI = 0.94; SRMR = 0.09; and RMSEA = 0.07 (CI = [0.061, 0.075]) and produced a significant pathway (standardized coefficient = .74) between the higher order constructs of information visibility and organizational transparency. The final information visibility measurement instrument is depicted in Table 7.
The Information Visibility Scale.
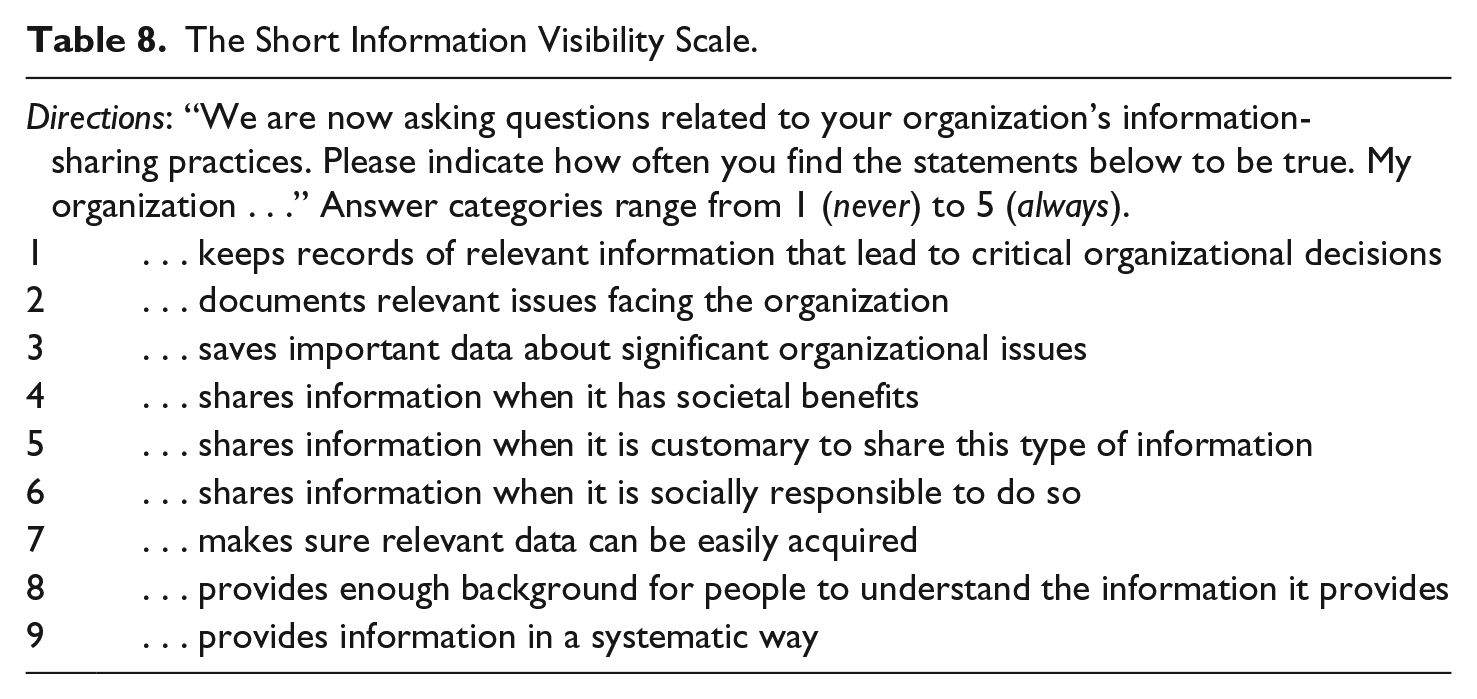
Phase 7: Development of the Short Scale of Information Visibility
Finally, a shorter version of the scale was developed. To do so, first, the items of the subdimension Legal Obligations were deleted, since this subdimension seemed to behave differently than the other subdimensions. With the remaining items, a principal component analysis (PCA) was performed. This resulted in three factors, representing the three dimensions of information visibility. All items with factor loadings below .75 were eliminated one by one to construct a shorter scale. After this, still 20 items remained. To create a significantly shorter scale, we decided to include three items per dimension based on their content and general usability. Because the factor loadings of the remaining 20 items were all high, we selected those items that most clearly and directly represented the theoretical construct in the three distinct dimensions. Table 8 reports the remaining nine items. With these items, we performed a second-order CFA. The model fit was excellent: χ2(24) = 31.995, CFI = 0.99, TLI = 0.99. SRMR = 0.03, and RMSEA = 0.041 (CI = [0.000, 0.074]), with factor loadings ranging from .78 to .92 (αSample 1 = .91, αSample 2 = .91). The reliabilities for the separate dimensions availability (αSample 1 = .90, αSample 2 = .91), approval (αSample 1 = .82, αSample 2 = .88), and accessibility (αSample 1 = .86, αSample 2 = .90) were also high.
The Short Information Visibility Scale.
Discussion
The first goal of this study was to develop the Information Visibility Scale and provide evidence for its validity. The second goal was to test the criterion validity of the scale, by relating it to organizational transparency. A deductive scale development approach was taken to validate the scale (Hinkin, 1998). Stohl et al. (2016) conceptualized information visibility in detail by providing three attributes: availability of information, approval to disseminate information, and accessibility of information to third parties. This conceptualization provided the theoretical foundation of the new scale and its initial set of items.
Results across two samples, totaling 395 full-time employees, provided strong support for the psychometric properties of the new scale. In both samples, the scale demonstrated the anticipated factor structure, corresponding to the three attributes of visibility and its underlying mechanisms as theorized by Stohl et al. (2016). These were modeled as a third-order factor structure with the three attributes of visibility each contributing to the overarching latent construct information visibility and the nine mechanisms contributing to their intended attribute of visibility. The nine dimensions for each of the attributes proved to have good internal consistency and test–retest reliability. Furthermore, a CFA and a subsequent structural model confirmed that the higher order construct information visibility and organizational transparency are related yet distinct constructs, providing evidence for the criterion-related validity of the scale.
This validation study contributes to the literature in at least three ways. First, several works, across different domains, have discussed the importance of organizational information visibility and visibility management for different organizational practices, particularly transparency (Brighenti, 2010; Flyverbom, 2016). However, these claims have been based on inconsistent operationalizations, providing little basis to build reliable and valid statements about information visibility and its influence on employee and organizational outcomes. To this end, we developed and validated the first measurement instrument for assessing organizational information visibility. This measurement instrument makes it possible to empirically demonstrate relationships between information visibility and outcome variables, such as knowledge sharing (Leonardi, 2014; Leonardi & Meyer, 2015), learning in organizations (Bunderson & Reagans, 2011), power (Flyverbom, Christensen, & Hansen, 2015), organizational citizenship behavior (Podsakoff, Whiting, Podsakoff, & Blume, 2009), performance (Tapscott & Ticoll, 2003), and, importantly, the different dimensions of transparency (Rawlins, 2008, 2009).
Recently, scholars within the field of organizational communication have become interested in how organizations and the people within them become hidden and can hide and the effects that these hidden organizations have on work, careers, and society (Askay & Gossett, 2015; Scott, 2013, 2015). The Information Visibility Scale developed herein may help to identify the extent to which people within organizations, or organizations themselves, are hiding information. Understanding the relationship between visibility and hiding speaks to a broader trend in organizational communication scholarship that seeks to understand the negative effects of visibility on organizational actions (Gibbs et al., 2013; Leonardi & Treem, 2012). The scale may help to isolate the kinds of organizations in which communicative behaviors such as hiding, gaming, and strategic self-presentation may be most acute and to explain how and why they have the kinds of effects on work and organizing that they do.
Second, this study is the first to empirically detangle the relationship between information visibility and organizational transparency. The results demonstrate that while information visibility and transparency are conceptually different constructs, they are positively and linearly related. Finally, by adopting and operationalizing the conceptualization of Stohl et al. (2016), this study demonstrates that the strength of the relationship between the nine subdimensions of information visibility and organizational transparency seems to be dependent on the dimension of visibility under study. The correlations between the four accessibility subdimensions (directory knowledge, classification, skills, and effort) and organizational transparency are much stronger than the correlations between the other dimensions of information visibility and organizational transparency. Compliance with “legal obligations” to share data with outside parties has the lowest correlation with organizational transparency. It appears that when openness is mandated it contributes less to perceptions of organizational transparency, compared with the other mechanisms of information visibility.
Theoretical Implications
In this study, the conceptualization of information visibility as the combination of three attributes of visibility was adopted and further operationalized. The measurement instrument, derived from this operationalization, helps to enhance our understanding of the organizational information visibility—transparency relationship. Besides the fact that these concepts are distinct, yet strongly related, the strength of the relationship appears to be dependent on the attribute of information visibility. The relationship between the accessibility mechanisms (directory knowledge, classification, skills, and effort) and transparency are more strongly related than the other mechanisms of visibility with transparency. This implies that making data available and allowing dissemination of information are necessary prerequisites to perceptions of transparency; however, putting effort into making information accessible will improve perceptions of transparency even more. This finding supports the notion of visibility as an ocular metaphor, suggesting an ability to see something, whereas transparency suggests an ability to see into something (Christensen & Cheney, 2015; Flyverbom, 2019). The attribute accessibility and its associated mechanisms directory knowledge, classification, skills, and effort are indeed more closely related to greater insight and a higher understanding of the information, and therefore, organizational transparency. For example, skills are conceptualized by Stohl et al. (2016) as interpretive skills to make sense out of the data, in other words, to understand it. In line with these theoretical notions, our findings show the strongest correlation between skills and organizational transparency.
The mechanisms of accessibility all involve some comprehension of the receiver of the information and their needs and are, therefore, more relational than the attributes availability and approval. This finding parallels the arguments raised by Flyverbom and Albu (2017) that transparency research can be separated into perspectives that offer a focus on information provision and accuracy (verifiability approaches) and perspectives that stress the importance of social communicative processes (performativity approaches). The verifiability approach seems to correspond with the attributes availability and approval, in the sense that providing and approving certain information is a prerequisite for transparency. The attribute of accessibility appears more an indicator of the social process orientation toward transparency, since it entails knowing the receiver of the information and providing tools for them to access and understand the information. The current study underscores the notion that disclosure of information should take into account the receiver of the disseminated information to enhance perceptions of transparency (see also Albu & Flyverbom, 2016).
Practical Implications
External stakeholders often demand and require more transparency from organizations. Even when organizations want to acknowledge and answer this call, they struggle with ways to actually be transparent or being perceived as such. The results of this study provide an entry point for organizations to manage their information visibility, and therefore, their transparency. An important starting point is the way the nine dimensions of information visibility are correlated with transparency. It appears that the three attributes of visibility are all related to transparency; however, accessibility had the strongest relationship with transparency. This implies that organizations should focus their transparency efforts on enhancing directory knowledge, providing classification schemes to help people find what they are looking for, developing employees’ mechanical and interpretive skillsets and minimizing the amount of effort required to access information.
Based on Stohl et al. (2016), we proposed that the approval dimension of information visibility included legal obligations, norms, and social consciousness. Our findings in the survey responses from organizational members suggest that they very clearly distinguish between legal obligations, on the one hand, and norms and social consciousness, on the other. The weakest correlation (between legal obligations and transparency) and the results from the exploratory factor analysis also provide practical insights about the influence of legal (governmental) interventions in the process of enhancing organizational transparency. In many cases, legal requirements might be necessary for information to be available, but a requirement does not translate into as strong an influence on perceptions of transparency as the other voluntary mechanisms of information visibility. The interesting question that this raises for further study is whether these legal requirements for visibility suggest such strong compliance norms that respondents do not value the organization’s behavior as indicative of transparent behavior or if this answer masks a cynicism that organizational disclosure obligations do not produce meaningful information (Bersch & Michener, 2011).
Limitations and Future Research Directions
One limitation of this study is that we cannot form conclusions about the causality of the reported relationship between information visibility and transparency. Theoretically speaking, transparency could also lead to more information visibility. Other types of research are necessary to substantiate the causal relationship between organizational information visibility and transparency. For example, using a three-wave panel study, stronger causal evidence could be provided (Cole & Maxwell, 2003). Another potential limitation is common method bias because we related data on information visibility to transparency that were collected from a single source using a survey design. Future studies can avoid this possible drawback by using data from different sources. This would also provide evidence for construct validity (Hinkin, 1998). Furthermore, an empirical study of the actual information organizations supply (e.g., on their website) combined with the scale results from employees, can help scholars and practitioners better understand what types of information employees want and perceive to be associated with each visibility attribute.
Finally, the role of legal obligations to make organizations visible to stakeholders and their association with perception with organizational transparency presents some interesting theoretical and practical challenges. Our data suggest there might be a possible paradox that needs to be explored further, that is, the more that government mandates disclosure, the less people perceive their organization to be transparent. Moreover, the relatively low factor loadings of legal mandates suggest a more complex and complicated relationship with overall information visibility. Future studies need to explore this further.
Because new technologies can alter the availability, approval, and accessibility of information, the Information Visibility Scale will be useful for assessing the implications of restructured information visibility at the organizational level. For example, the influence of increased information visibility and different kinds of knowledge sharing would be an important avenue for future research (Hansen & Flyverbom, 2015; Leonardi, 2014). Other interesting questions relate to how people negotiate for salary or job changes when all salaries and job descriptions in the organization are visible to its members. At a more macro level, questions arise, for example, about the nature of power, how might power and status shift when information that provides an (in)accurate map of who depends upon whom in the organization becomes visible? Or how does the structure of social networks change when employees no longer have to build a mental map of what the organization’s network looks like, but can instead see it articulated in easily accessible information (Leonardi & Vaast, 2017)? Finally, it will be important to study these processes longitudinally using cross-lagged reciprocal models, since “Effects of one’s visibility feed back from and to effects in one’s visibility” (Brighenti, 2007, p. 331), meaning that the effects of information visibility, such as knowledge sharing, can, subsequently, influence (the amount of) information visibility.
Finally, it must be recognized that, as Kavanagh (2004) noted, “ocular metaphors are privileged in organizational discourse, not just in terms of epistemology and methodology, but also in terms of constructs that filter straight through to management thinking” (p. 460). We hope that by unpacking the empirical dimensions of information visibility, our study can contribute to contemporary conversations regarding ocularcentrism, and the role of ocular metaphors in organizational studies.
Conclusion
Information visibility and organizational transparency are core concerns in today’s digital age. Many individuals in the public sphere have argued that organizations should increase the transparency of their practices and decision-making structures by making their behaviors more visible. Scholars have spent considerable effort theorizing and critiquing the first part of this claim; our notions of transparency—what it is, what it might do, and what its shortcomings are—have become quite well developed. But aside from several provocative pieces arguing for the importance of visibility, the second half of that claim has been much more poorly examined. Our development of the Information Visibility Scale aims to help fill in this important gap in our understanding. With the scale presented here, scholars can begin more detailed and rigorous empirical studies of the concept of information visibility and its relationship to transparency that will not only improve our understanding of communicative dynamics in the digital age, but also perhaps help to create organizations which are in the service of humankind.
Footnotes
Acknowledgements
The authors would like to thank Scott Banghart and Mikkel Flyverbom for their helpful thoughts and comments on earlier versions of this paper. Furthermore, we are grateful for the hospitality of the Center for Information Technology and Society (![]() ) that provided the opportunity for an extensive research visit, during which this study was conducted. We also like to thank the attendees of the “Visibility and Hiddenness in Organizing Context” session at the 68th Annual Conference of the International Communication Association (ICA) for their constructive feedback.
) that provided the opportunity for an extensive research visit, during which this study was conducted. We also like to thank the attendees of the “Visibility and Hiddenness in Organizing Context” session at the 68th Annual Conference of the International Communication Association (ICA) for their constructive feedback.
Declaration of Conflicting Interests
The authors declared no potential conflicts of interest with respect to the research, authorship, and/or publication of this article.
Funding
The authors disclosed receipt of the following financial support for the research, authorship, and/or publication of this article: This work was supported by The Netherlands Organization of Scientific Research under Grant 451-13-012.