
Abstract
This study aims to validate, for the Portuguese population, the bidimensional structure of the Hoge Intrinsic Motivation Religiosity Scale (HIMRS) and the four-dimensional structure of the Rohrbaugh and Jessor Religiosity Scale (RJRS); it also aims to establish an association between the two religious scales and religious identity. To this end, an exploratory factor analysis (EFA) with polychoric matrix (for ordinal data) and a confirmatory factor analysis (CFA) with maximum likelihood estimation (MLE) were carried out. Besides reliability, convergent and discriminant validity were assessed by Cronbach’s alpha coefficient, composite reliability (CR), average variance extracted (AVE), and AVE squared roots. The Portuguese versions of the HIMRS and RJRS presented good model fit. These instruments correlated with each other and with religious identity. Differences in religious motivation and in religious identity concerning sociodemographic variables were found: women, divorced, and older participants define themselves as being more spiritual or religious persons than men, single or married, and younger participants. Also, years of education were positively associated with religious intrinsic motivation and negatively associated with religious extrinsic motivation. This study provides two more instruments with adequate properties to assess intrinsic religious motivations, past-year frequency of religious service attendance, and personal religiosity for the Portuguese population.
Keywords
Introduction
Religiosity is a multidimensional construct connected to principles structured around beliefs, practices, and rituals within a community (organizational dimension). However, religiosity also has a non-organizational dimension that is the private one (e.g., praying) (Fernández & Rosell, 2022). The importance of religiosity as a cognitive dimension of personality is well recognized (Sholihin et al., 2022), and the positive role played by religiosity in the lives and behavior of people is also known (Pajević et al., 2005). The concept of religiosity is conceived as a multidimensional phenomenon (Glock & Stark, 1965; King & Hunt, 1975); for that reason, it is a very complex one. Another reason that contributes to this complexity is that there are several and different academic disciplines that approach religiosity from diverse perspectives and few consulting one another (Cardwell, 1980). Indeed, there are disparities concerning the reported dimensions in consequence of different approaches to defining and measuring relevant dimensions. Despite the fundamental role of religion and religiosity in personal and public life, there is little research, both in Portugal and in general. Furthermore, “it is [. . .] unknown if and what [religious] measures are applicable [. . .] to assess levels of religious and/or spiritual distress” (Austin et al., 2018, p. 2).
Fukuyama (1960) studied four dimensions of religiosity: cognitive (religious knowledge), cultic (individual’s religious practices or ritualistic behavior), creedal (personal religious belief), and devotional (person’s religious feelings and experiences, or experiential dimension). The acquisition of one dimension of religiosity does not guarantee the acquisition of any of the others (Holdcroft, 2006). People attend religious services and embrace spirituality for different reasons. The original conceptualization of the intrinsic/extrinsic distinction in religious motivation (Allport, 1966; Allport & Ross, 1967) was envisaged as a single bipolar continuum: An intrinsic orientation has been described as being religious as an “end” in contrast to an extrinsic religiousness, in which people use their faith as a “means” or way to obtain other goals, such as comfort and supportive social relationships. (Park, 2021, p. 213)
According to Allport and Ross (1967), extrinsically religious individual “uses his religion” and intrinsically religious individual “lives [it]” (p. 434). The Allport and Ross’s (1967) four-fold typology of religious motivations includes intrinsically motivated (self serves religion); extrinsically motivated (religion serves self); indiscriminately pro-religious (self has superficial conviction that all religion is good); and indiscriminately anti-religious (self disagrees with religion). Research on intrinsic and extrinsic religion has been troubled by conceptual diffuseness and questionable scale validity. In fact, Park (2021) addressed several problematic issues concerning this intrinsic/extrinsic motivations distinction, namely, dichotomizing psychological characteristics, the measures used to assess intrinsic/extrinsic motivations, the clarity of the constructs themselves, and the role of quest and cultural issues. Hunt and King (1971) have proposed greater specificity in conceptualization and measurement of Hoge Intrinsic Motivation Religiosity Scale (HIMRS). In fact, HIMRS measures a single crucial dimension: ultimate versus instrumental religious motivation.
Michaels et al. (2021) found that among religious people, intrinsic and extrinsic-personal religious motivations indirectly influence high-level action identification through strength of spiritual beliefs. Besides, extrinsic-social religious motivation and religious service attendance did not relate to action identification, demonstrating that “religious motivation differences are consequential for the action identities people rely upon to form a sense of meaning” (p. 64). Vishkin and colleagues (2022) identified four religious motivations mentioned in previous reviews: a search for significance or meaning, personal growth, seeking or connecting with the sacred or with the divine, and affiliating with other people. The first three motivations are intrinsic, whereas the fourth motivation is extrinsic (Vishkin et al., 2022). Donahue (1985) carried out a meta-analytic review concerning intrinsic and extrinsic religiousness. The author found that respondents with conservative theological orientations are more likely to display a negative correlation between intrinsic and extrinsic religiousness. Donahue (1985) also found that extrinsic religiousness is positively correlated with negative characteristics (e.g., fear of death, death anxiety) and uncorrelated with religious belief and commitment; at last, the author showed that intrinsic religiousness tends to be uncorrelated with negative characteristics and positively correlated with measures of religiousness. Rohrbaugh and Jessor (1975) conceptualized religiosity as “an attribute of personality referring to cognitive orientations about a transcendent reality and about one’s relationship to it, orientations which are directly implicated by the impact they have on daily, secular life, and by participation in ritual practices” (p. 137). This suggests a linkage between religiosity and control against deviance.
According to Vishkin and colleagues (2022), there are two separate lines of research in the psychology of religion: why people are religious and how they are religious. This study is part of the second line of investigation, as it seeks to validate for the Portuguese population the HIMRS and the Rohrbaugh and Jessor Religiosity Scale (RJRS), being that the HIMRS assesses intrinsic religious motivations and RJRS was conceived to assess past-year frequency of religious service attendance and personal religiosity. In Portugal, there are few validated instruments available for research on religiosity; one of the most important tasks for social scientists devoted to religious studies is to create or to enable existing instruments to validate and assess religious/spiritual concepts (Richards et al., 2021).
This Study
This study has the aim to validate, for the Portuguese population, the bidimensional structure of the HIMRS and four-dimensional structure of the RJRS; besides, it aims to establish correlations between the two religious scales and religious identity. It is expected that the scales to be validated present good models of adjustment to the Portuguese population and that higher values of religiosity (assessed by HIMRS and RJRS) are positively correlated with higher religious identity.
Methodology
Procedures
All procedures followed the Declaration of Helsinki and later amendments or comparable ethical standards. Also, the Ethics Committee for Health of the Portuguese Catholic University (standpoint number 118 [2019-2023]) approved this study that was conducted from July to September 2022. Participants were recruited through social media and assessed through Google Forms. Participants were informed about the study’s purpose, and confidentiality and anonymity of the data were assured. All participants signed the informed consent. The criteria used to select participants were: to be 18 years old or older and of Portuguese nationality and residence. Exclusion criteria include being less than 18 years, not understanding the content of the questions asked, and not using social media. The translation of the two instruments (HIMRS and RJRS) was performed according to the International Test Comission guidelines for translating and adapting tests (Gregoire, 2018) and the translation back-translation procedure (Brislin, 1980). The original versions of the instruments were translated from English to Portuguese by two bilingual translators, one psychologist and another from the religious field. A third bilingual translator (psychologist) carried out a reconciliation of the two translations. A native English speaker from other religious field performed the reconciled version’s back-translation. Finally, the first translator compared the back-translated version with the original English versions to achieve linguistic and cultural equivalence consistency. Almost no differences were found between the back-translated and the original versions. A convenience sample of 15 people over 18 years old with Portuguese nationality and residence were invited to evaluate the items’ relevance to the scales and cultural context. Original and Portuguese versions of the scales can be found in Appendix 1 and Appendix 2, respectively.
Measures
A self-report questionnaire was developed for data collection, including questions to assess the sociodemographic profile and the religiosity of the respondents.
Sociodemographic questionnaire
The sociodemographic questionnaire included questions about gender (male/female), age, marital status (single, married or living together, divorced or separated, and widowed), education (less than secondary education, secondary education, bachelor’s, master’s, and doctorate), and professional status (active or inactive). All people who worked, studied, took care of third parties, or were housewives were considered active; inactive people were those who were unemployed, retired, and on sick leave.
Religious identity questionnaire
This questionnaire was conceived based on the literature and presents four questions: Do you believe in God? Do you consider yourself a religious person? Is religion important in your life? and How do you define yourself from a spiritual or religious point of view? The first three questions are answered on an 8-point Likert-type scale (1 = nothing and 8 = completely), with a higher score representing greater religious commitment. The last question presents five response options: 1—I am a materialistic person (I only recognize material or natural realities); 2—I am an atheist (I deny the existence of God and spiritual/supernatural realities); 3—I am agnostic (I believe it is not possible to prove or disprove the existence of God and spiritual realities); 4—I am a spiritual person (I recognize the existence of spiritual realities but I do not belong to any religion); 5—I am a religious person (I believe in the existence of God and I belong to a religion), with a higher score meaning more religiosity.
Hoge Intrinsic Motivation Religiosity Scale
The 10-item HIMRS (Hoge, 1972) was originally derived from the Allport-Ross scales, taking items from the original scales that factored most closely together. In his original study, Hoge found a strong correlation between the HIMRS scores and ministers’ judgments. In a second study, the scale was administered to 85 ministers representing 18 Christian denominations and 2 Jewish groups. HIMRS contains 10 statements about religious belief or experience (Hoge, 1972). On one end of the dimension are seven intrinsic items, and on the other end are three extrinsic items. Hoge reported that the reliability of the scale was .90 using the Kuder-Richardson Formula 20. Reliability information reported by Hoge and Carroll (1978) was assessed by Cronbach’s alpha (α = .84). The HIMRS’s items are answered in a 4-point Likert-type scale: 5 = Strongly disagree, 4 = Moderately disagree, 2 = Moderately agree, and 1 = Strongly agree, where a lower score translates to greater religiosity.
Rohrbaugh and Jessor Religiosity Scale
This scale was conceived to assess past-year frequency of religious service attendance and personal religiosity (Rohrbaugh & Jessor, 1975). It is an eight-item instrument assessing ritual, consequential, ideological, and experiential religiosity. Internal consistency of the scale was excellent (Cronbach α = .90). The first item of the scale assesses past-year frequency of religious service attendance to examine the community aspect of religious involvement. Response options’ modalities were as follows: 0 = Not at all; 1 = Once; 2 = Two to five times; 3 = Six to ten times; 4 = Once or twice a month; 5 = Once a week; 6 = More than once a week. Responses were categorized as: “Not at all,” “Low” = “Once” and “Two to five times”; “Moderate” = “Six to ten times” and “Once or twice a month”; “High” = “Once a week” and “More than once a week.” The seven remaining items of the RJRS assessed the magnitude of religious belief in a person’s life, and each question had five response options indicating a range of agreement or importance. These eight items operationalized four dimensions (ritual religiosity, consequential religiosity, ideological religiosity, and experiential religiosity). The responses from these seven items were summed together, with a range of scores falling between 0 and 26; higher scores indicated greater belief.
Data Analysis
The normality of items was assessed by skewness (SI < 3) and kurtosis (KI < 10) indexes, suggesting non-severe violations of normality (Kline, 2015). Descriptive analysis was also presented: frequencies, percentages, mean, standard deviation, and variance. Also, the correlation of each item with the total scale and the value of Cronbach’s alpha, if the item was deleted, were presented. A confirmatory factor analysis (CFA) with maximum likelihood estimation (MLE) was carried out to confirm the models proposed by the authors of the original versions of the instruments. The model fit evaluation was based on Kline’s (2015) thresholds concerning statistics tests and approximate fit indexes. A statistically non-significant model chi-square statistic, χ2, shows that the model fits the data acceptably; the higher the probability related to χ2, the closer the fit to the perfect one. A value of the parsimony-corrected index Steiger–Lind root mean square error of approximation (RMSEA) close to 0 and non-significant at the 0.05 level represents a good fit. Values of incremental fit index (IFI), Tucker–Lewis index (TLI), and the Bentler incremental comparative fit index (CFI), close to 1 (0.95 or better), are indicators of best fit, as well as goodness-of-fit index (GFI). Re-specification of the models allows to analyzing path estimates, standardized residuals of items, and the modification indices (MIs). Regarding construct validity, items with low individual standardized factor loadings (regression weights below 0.50) may be removed. The MIs provide information about potential cross-loadings and error term correlations (modifications theoretically meaningful and MI > 11 were taken into account). Concerning the parsimony-adjusted index Akaike information criterion (AIC) and the standardized root mean square residual (SRMR) (over 0.10 suggests fit problems), the smallest the values the most parsimonious is the model. AIC and SRMR allow to compare the fit across models. To assess the model reliability, convergent and discriminant validity, Cronbach’s alpha coefficients, composite reliability (CR, 0.70 or higher suggests good model reliability), average variance extracted (AVE, 0.50 or higher suggests adequate convergence), and square root of AVE (higher than the highest correlation with any other latent variable) were used. If AVE is less than 0.50 and CR is higher than 0.60, the convergent validity of the model is adequate (Fornell & Larcker, 1981). However, concerning RJRS, it was not possible to obtain a good model and, therefore, it was decided to carry out an exploratory factor analysis (EFA). EFA was carried out with polychoric matrix (for ordinal data) using the FACTOR program (Ferrando & Lorenzo-Seva, 2017; Lorenzo-Seva & Ferrando, 2006, 2013). The number of extracted factors was supported by the procedure for determining the number of dimensions (optimal implementation of parallel analysis [PA]) (Timmerman & Lorenzo-Seva, 2011). The dispersion matrix was based on polychoric correlations and the robust analyses was bias-corrected and accelerated (BCa; Lambert et al., 1991). The method for factor extraction was robust unweighted least squares (RULS). The correction for robust chi-square was carried out with Losefer empirical correction (Lorenzo-Seva & Ferrando, 2022), having the rotation to achieve factor simplicity been robust Promin (Lorenzo-Seva & Ferrando, 2019) and the clever rotation start with weighted Varimax. The number of random started in 100 and the maximum number of iterations was 1,000. To ensure discriminant validity, items should load significantly only on one factor, the minimum loading accepted is 0.32, and communalities lower than 0.40 suggest that items may not be related to other items. Complex items, loading over 0.32 on more than one factor and differing less than 0.10, were excluded (Tabachnick & Fidell, 2007). Group differences were analyzed and the test to be used was chosen based on the evaluation of normality and homogeneity assumptions. To compare the means of two groups, the independent means t-test (assumes the normality and homoscedasticity of the distribution variable) or the Welch-Satterthwaite’s t-test (relaxes these assumptions, approximating the t distribution and the degrees of freedom) was applied. In case of unequal sample size, the decision between applying the t-test or the alternative Welch’s t-test is supported by the one-way analysis of variance (ANOVA) or F-test result (if F-statistic is not statistically significant at the 0.025 alpha level, then the t-test is chosen; otherwise, the alternative test is used). To compare the means of more than two groups, the F-test was applied (it assumes that the variable is normally and independently distributed, with equal variances among groups). According to Tabachnick and Fidell (2007), the F-test is robust if samples sizes are large enough and variances within levels are relatively equal. Chi-square test compares the distribution of categorical variables. Three measures of the effect size, Cohen’s d, phi, and eta squared, were used accordingly to the level of measurement of the variables; interpretation followed Cohen (1988) guidelines. Finally, Pearson’s and Spearman’s correlations were used according to the nature of the variable. The statistical significance level was set at 0.05. Statistical analysis was performed using SPSS version 28, AMOS version 28, and FACTOR.
Sample
The sample is composed of 502 respondents, of which 418 (83.3%) are female. The mean age of the sample is 30.61 years old (standard deviation of 13.94). Most of the sample (333 or 66.3%) are single (129 or 25.7% are married or in a common-law relationship; 34 or 6.8% are separated or divorced; and 6 or 1.2% are widowed). Almost half of the sample has secondary education (231 or 46%), followed by a bachelor’s degree (164 or 32.7%), a master’s degree (78 or 15.5%), and a doctorate (25 or 5%) and, at last, 4 (0.8%) respondents have less than the secondary education. Most of the sample is professionally active (451 or 89.8%). In the RJRS validation process, the sample was randomly divided. The sample destined to the EFA is composed of 251 respondents, of which 215 (85.7%) are female. The mean age of the sample is 30.21 years old (standard deviation of 14.17). Most of the sample (168 or 66.9%) are single (63 or 25.1% are married or in a common-law relationship; 14 or 5.6% are separated or divorced; and 6 or 2.4% are widowed). More than half of the sample has secondary education (132 or 52.6%), followed by a bachelor’s degree (72 or 28.7%), a master’s degree (38 or 15.1%), and a doctorate (7 or 2.8%) and, at last, 2 (0.8%) respondents have less than the secondary education. Most of the sample is professionally active (222 or 88.4%). The sample destined to the CFA is composed of 251 respondents, of which 203 (80.9%) are female. The mean age of the sample is 31.02 years old (standard deviation of 13.72). Most of the sample (165 or 65.79%) are single (66 or 26.3% are married or in a common-law relationship and 20 or 8.0% are separated or divorced). Almost half of the sample has secondary education (99 or 39.4%), followed by a bachelor’s degree (92 or 36.7%), a master’s degree (40 or 15.9%), and a doctorate (18 or 7.2%) and, at last, 2 (0.8%) respondents have less than the secondary education. Most of the sample is professionally active (229 or 91.2%). There are no statistically significant differences between the two samples concerning gender, age, marital status, and professional status. However, there are statistically significant differences in relation to education, χ2(5) = 16.045; p = .007; Ф = 0.18: in the EFA sample, more participants have secondary education and in the CFA sample, more participants have university education, especially bachelor’s degree and doctorate.
Results
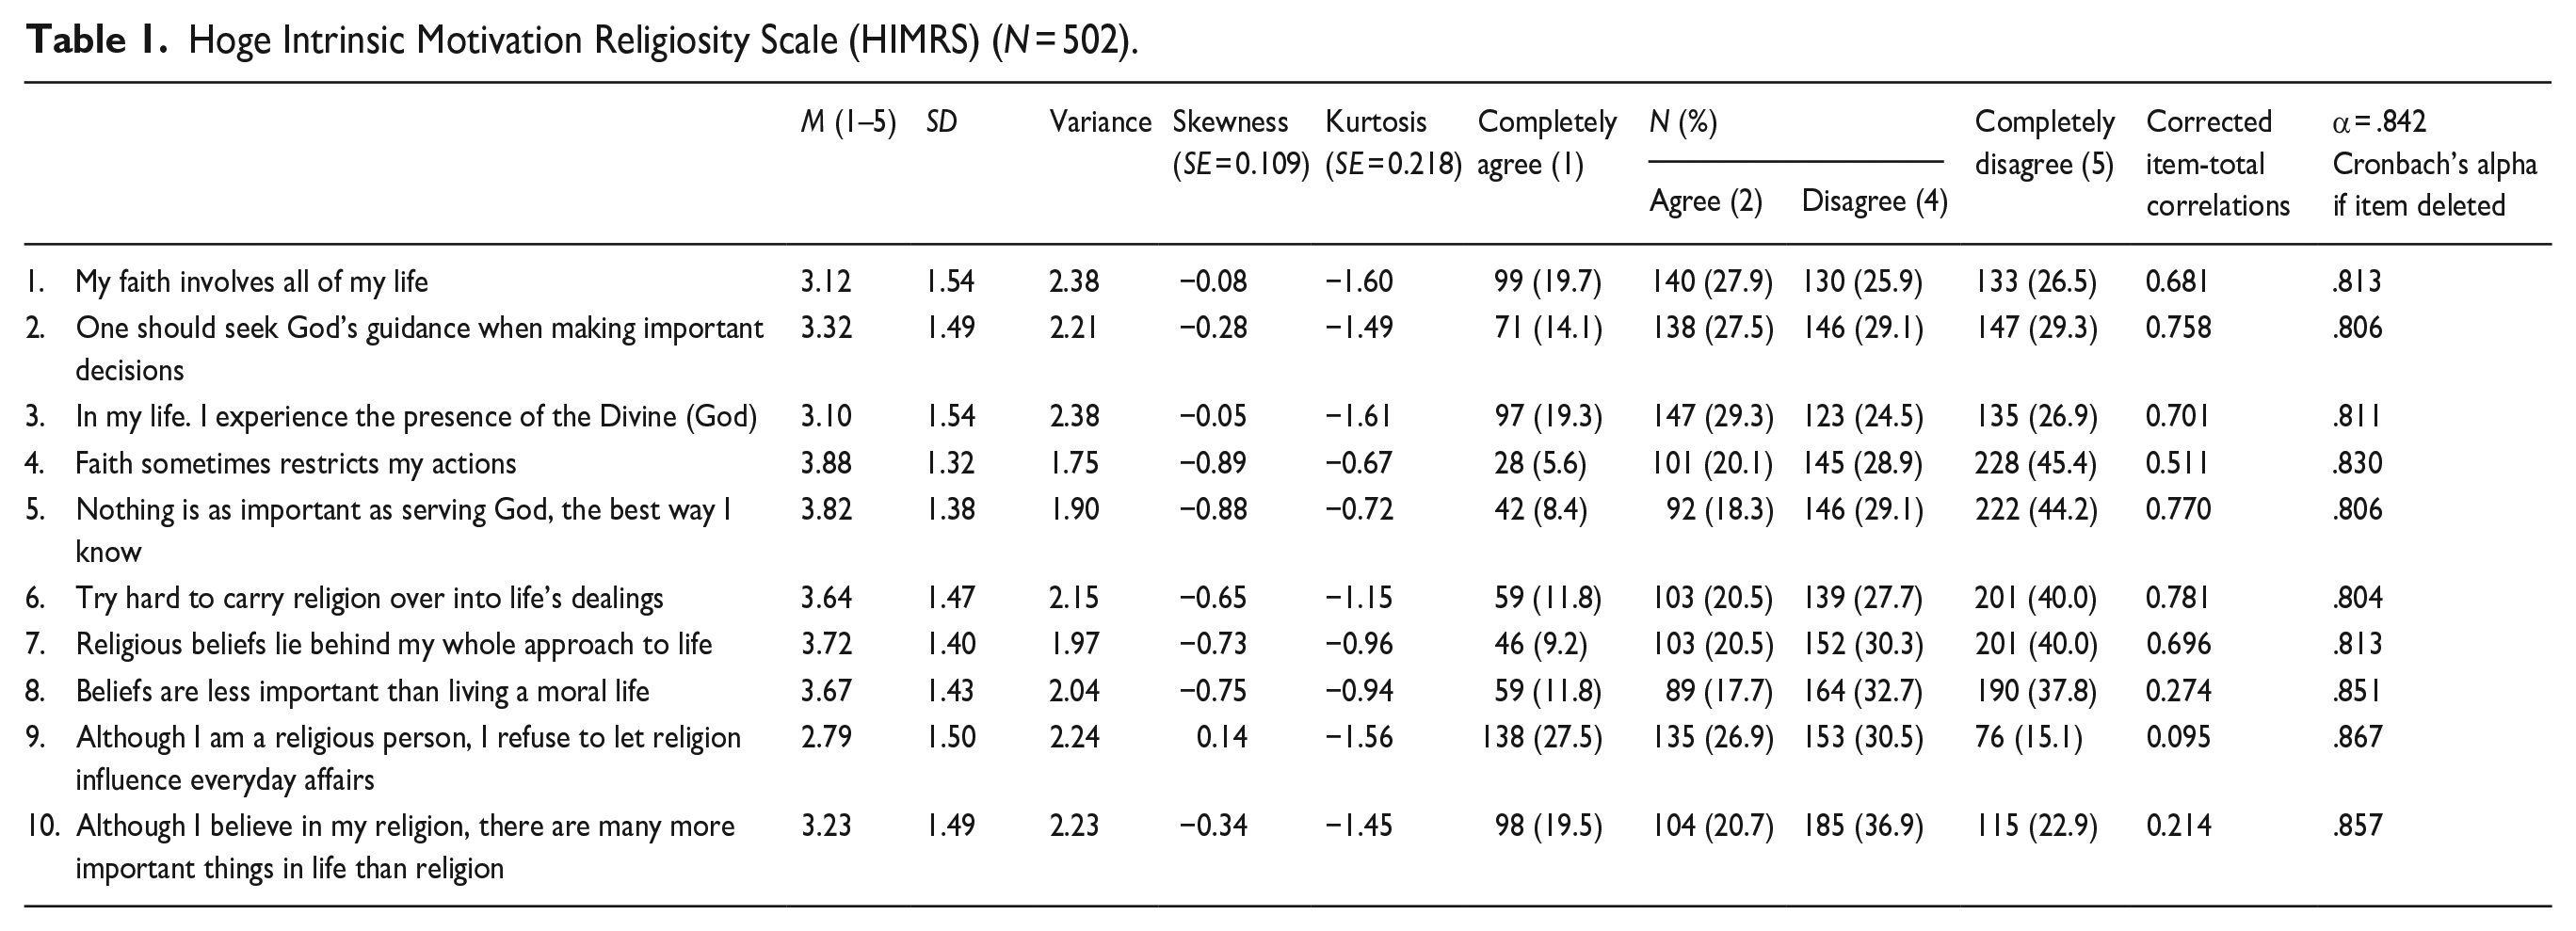
There were no missing data. Concerning HIMRS, the items of the scales do not present violations of normality (SI from −0.89 to −0.05 and KI from −1.61 to −0.67). The means of the items range from 2.79 (item 9) to 3.88 (item 4) and the variance ranges from 1.75 (item 4) to 2.38 (items 1 and 3). The item that presents the highest correlation with the total of the scale is item 6 and the lowest is item 9. Three items (items 8, 9, and 10), if deleted, increase the value of Cronbach’s alpha (Table 1).
Hoge Intrinsic Motivation Religiosity Scale (HIMRS) (N = 502).
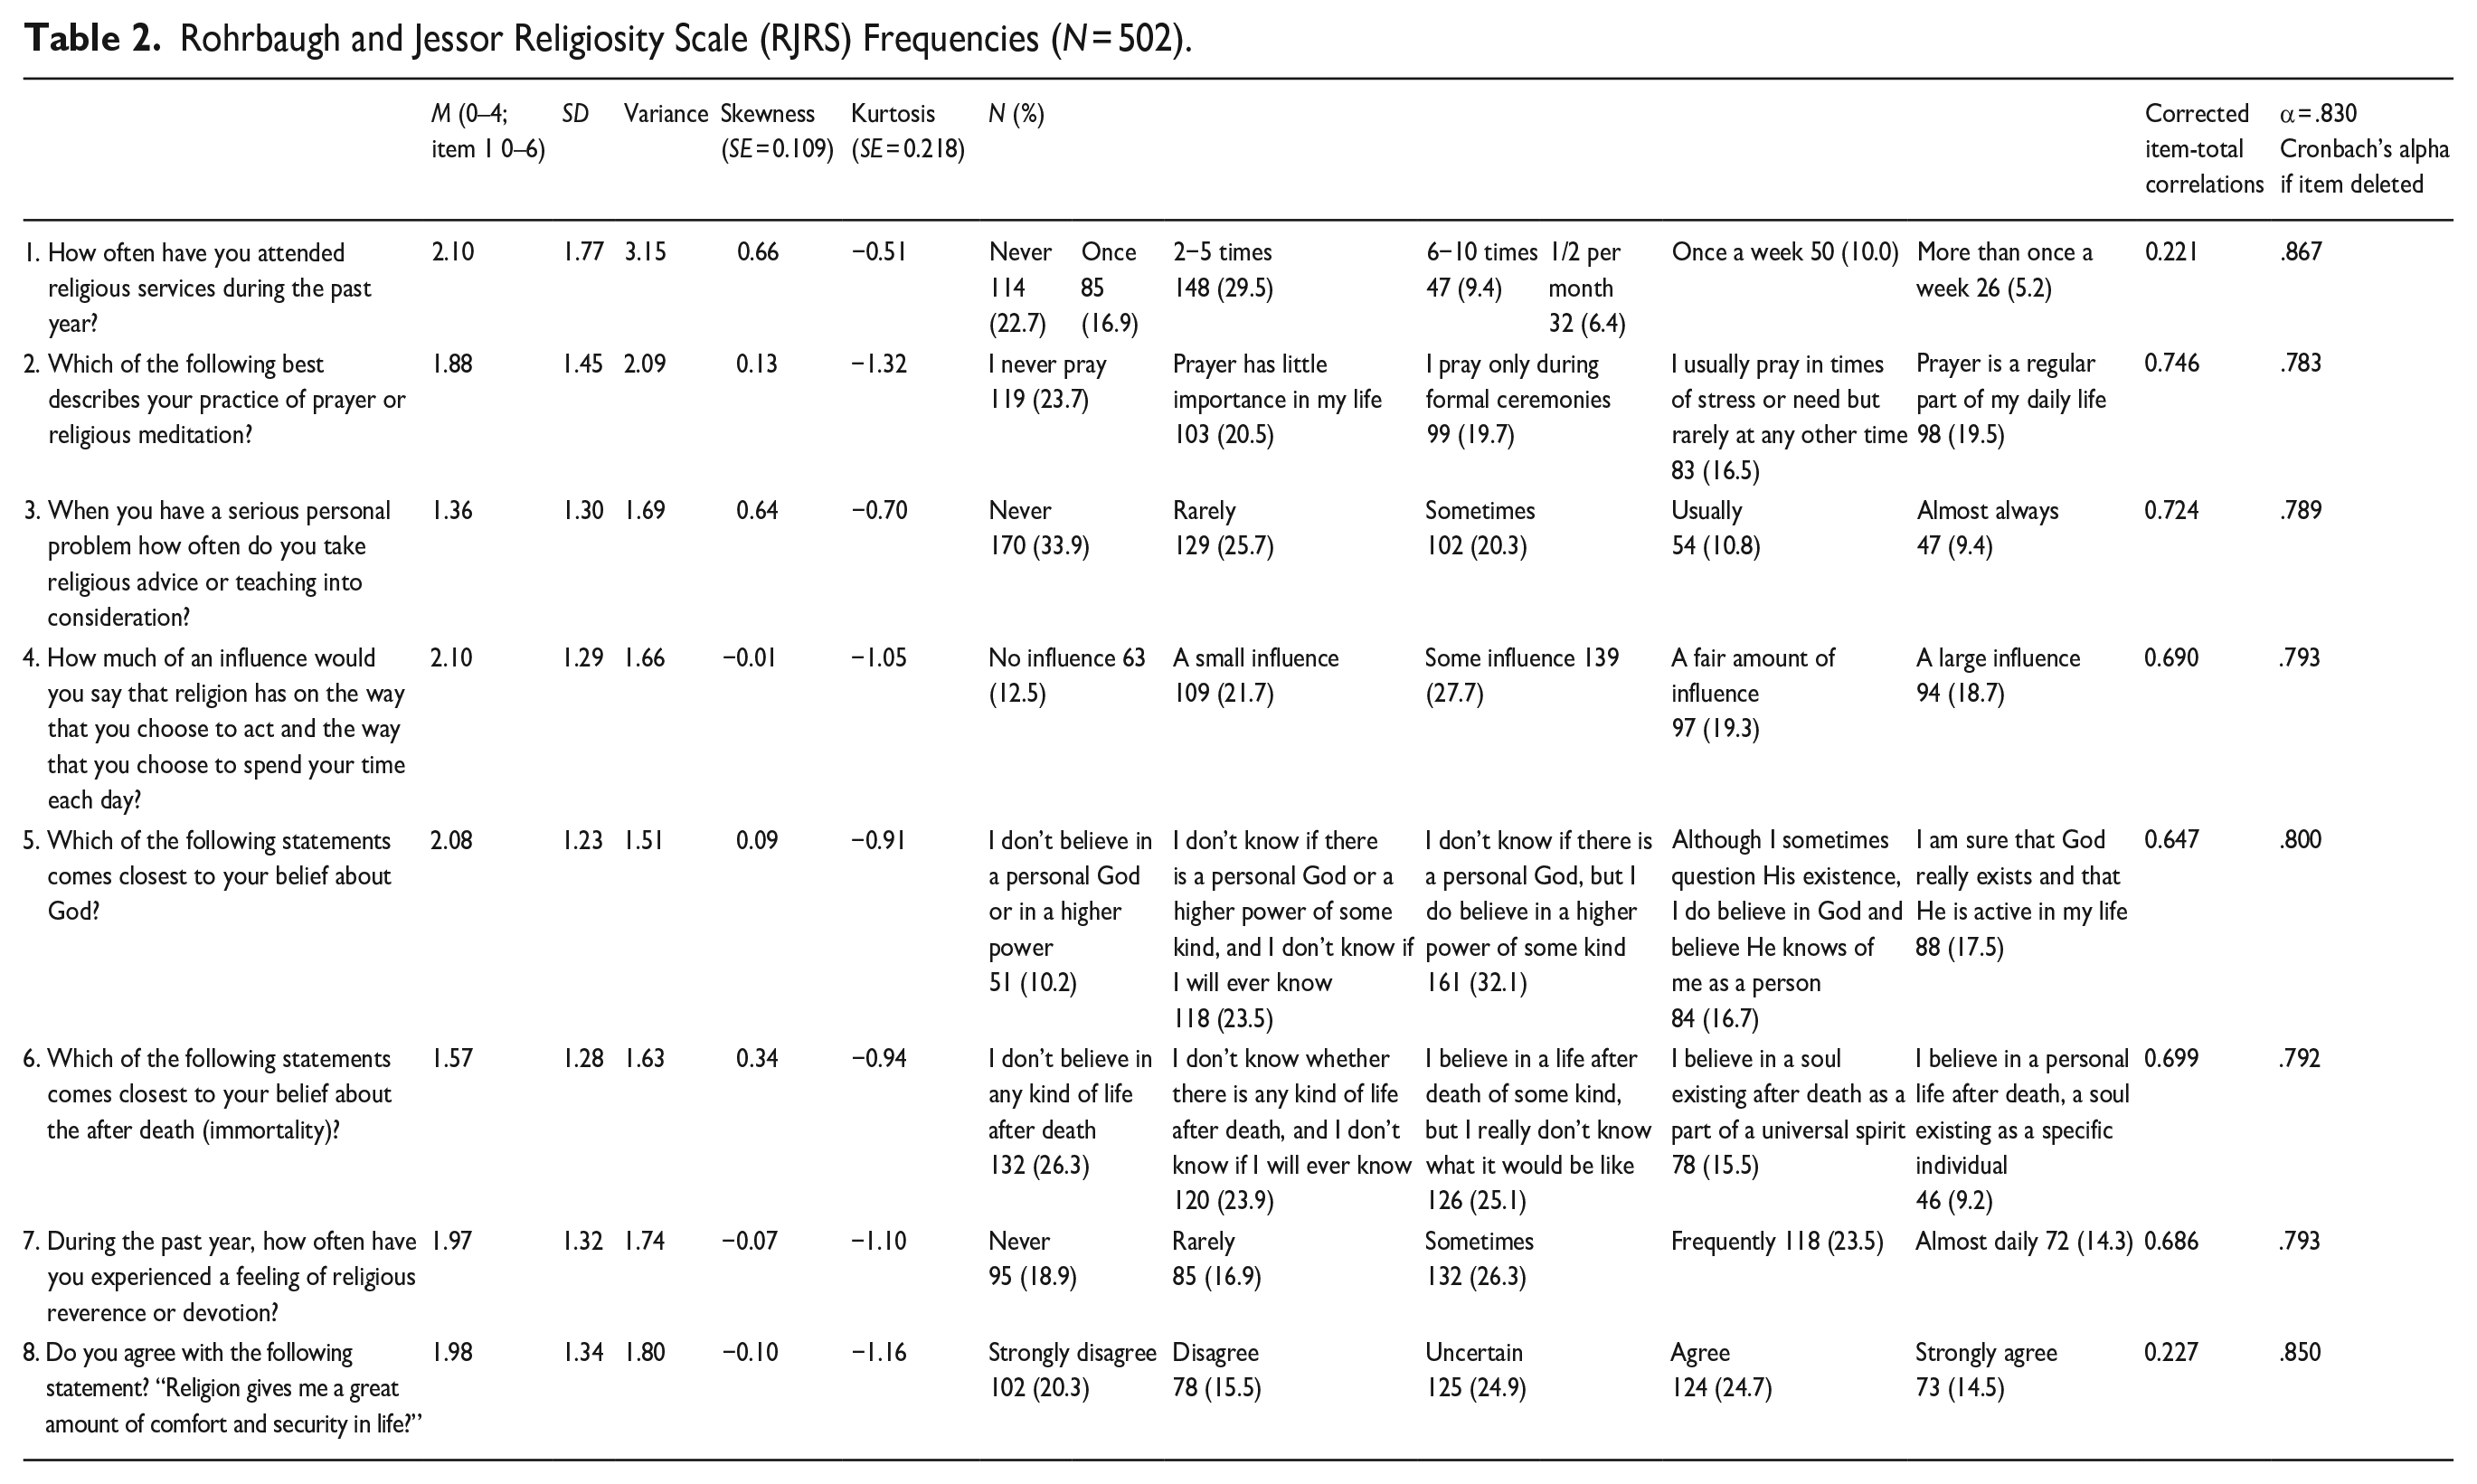
Regarding RJRS, the items of the scale do not present violations of normality (SI from −0.01 to 0.66 and KI from −1.32 to −0.51). The means of the items range from 1.36 (item 3) to 2.10 (item 1 and item 4) and the variance from 1.51 (item 5) to 3.15 (item 1). The item that presents the highest correlation with the total of the scale is item 2 and the lowest is item 1. Two items (items 1 and 8), if deleted, increase the value of Cronbach’s alpha (Table 2).
Rohrbaugh and Jessor Religiosity Scale (RJRS) Frequencies (N = 502).
CFA for HIMRS (N = 502)
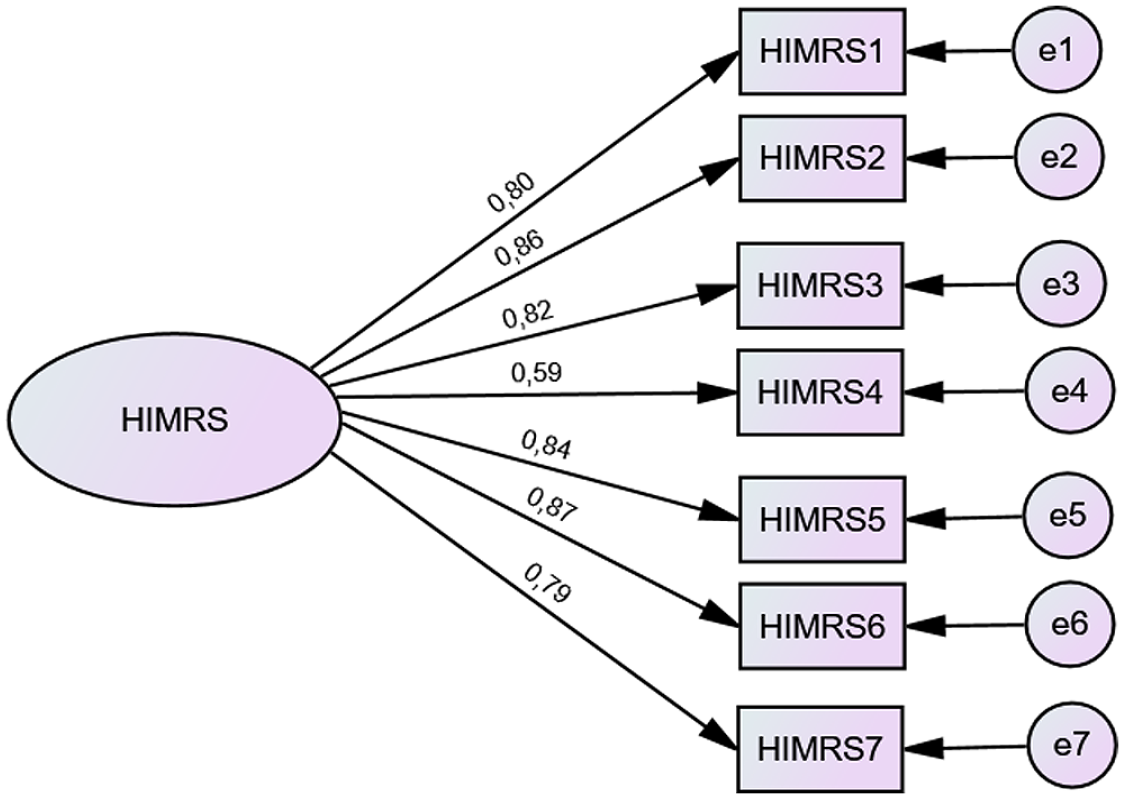
A CFA was carried out in order to confirm the unidimensional model. However, the model did not fit the data well (Table 3). Looking at the one-dimensional HIMRS model, in Figure 1, it was found that the estimated values of standardized regression weights in items 8, 9, and 10 were far below the reference values. Furthermore, these same items had already shown a rather low correlation with the total scale and, if removed, the Cronbach’s alpha value increased. For these reasons, the authors decided to exclude these three items and proceed with a new CFA. In Table 3 and Figure 2, it is possible to understand that the model improved significantly; however, some indices remain not very strong. Analyzing the MIs, correlations between errors 1 and 3 and errors 2 and 3 were established; these correlations were theoretically supported (all the items involved belong to the same theoretical construct). Finally, a good model fit was achieved (Table 3). However, the authors decided to carry out a CFA in order to confirm the bidimensional model proposed by the authors (7 intrinsic motives and 3 extrinsic motives) (Table 3); it was found that the estimated values of standardized regression weights of all the items, including items 8, 9, and 10, were in the scope of the reference values, except item 8 that was a little below (0.34). The authors decided to exclude the item and it achieved a good model fit (Table 3; Figure 3). Cronbach’s alpha, CR, AVE, and AVE square roots of the Portuguese version of CRS are above the recommended values (Table 7), except AVE square root for HIMRS total.
Goodness-of-Fit Indexes for the Unidimensional Model of HIMRS (N = 502).
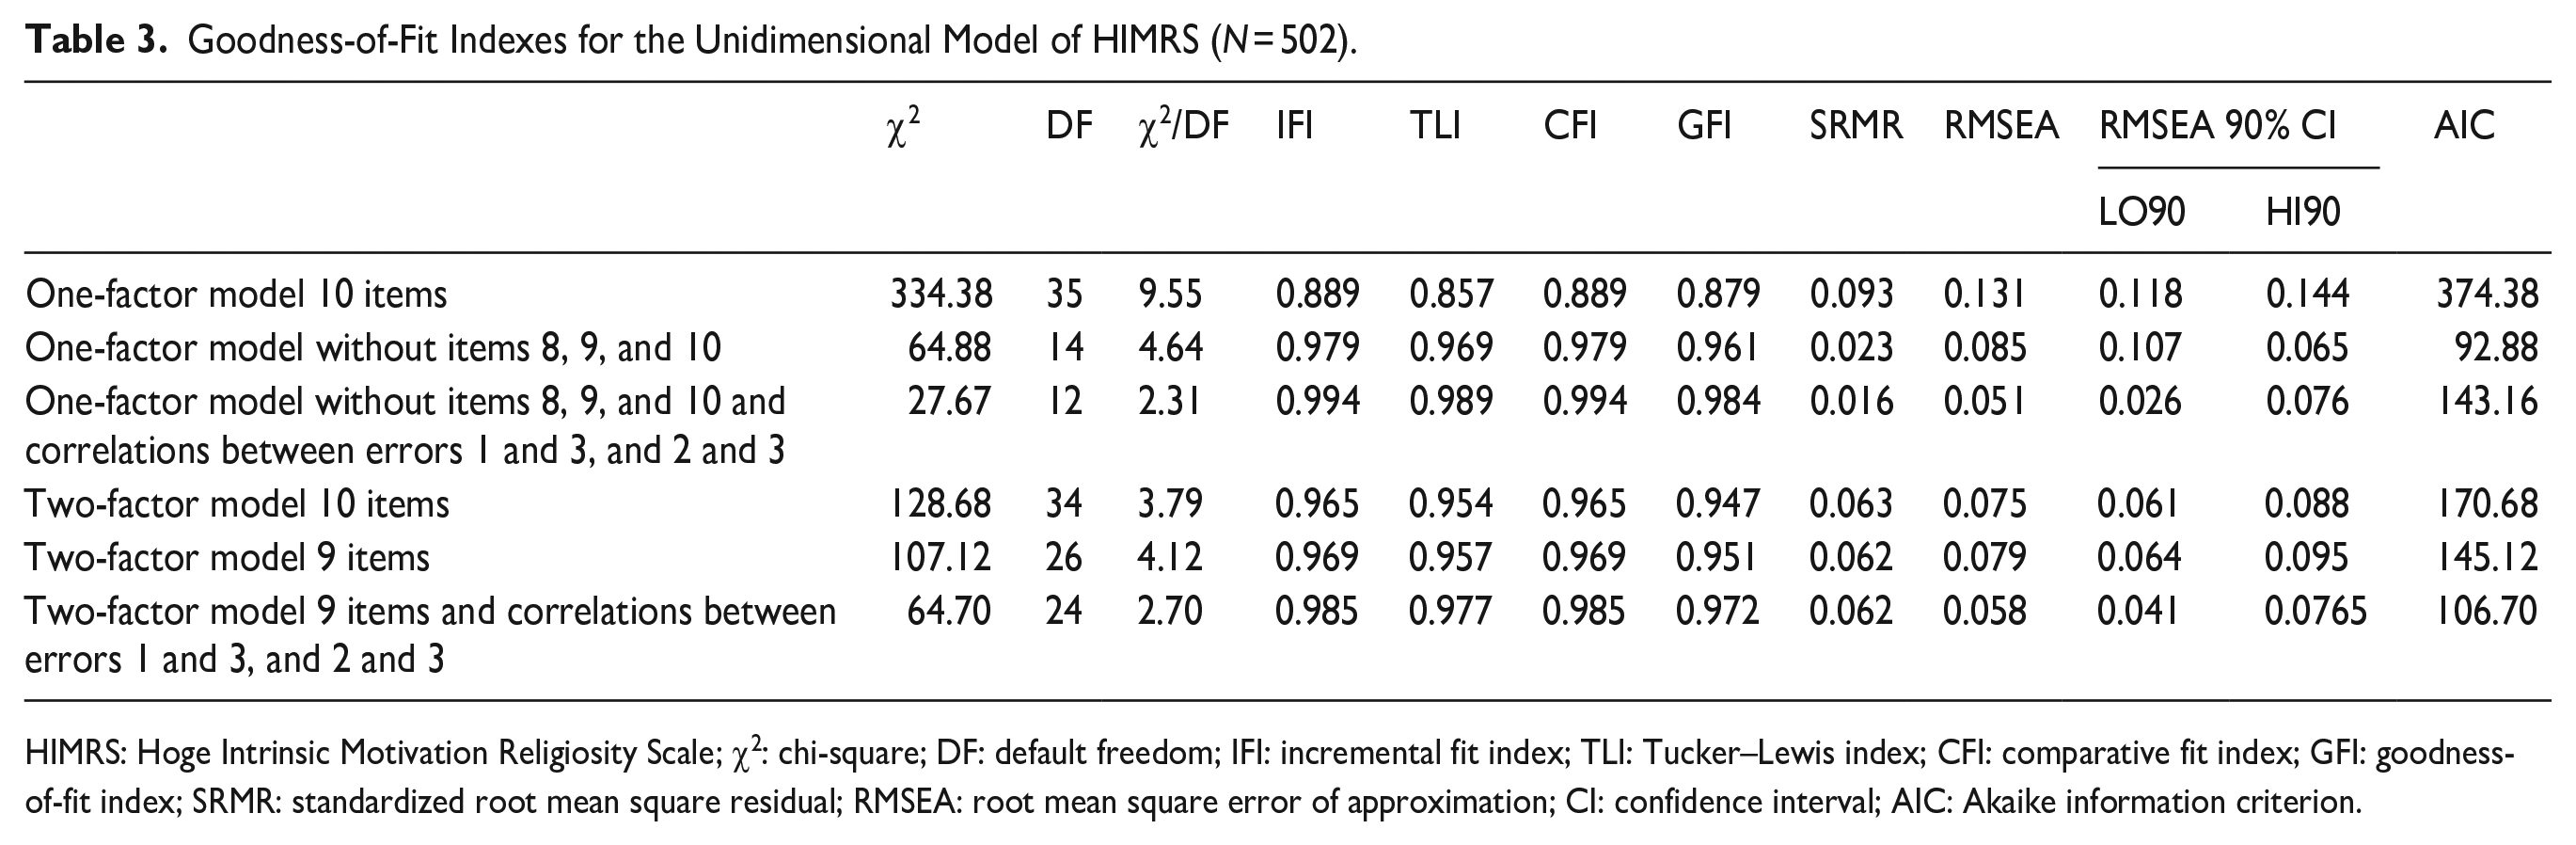
HIMRS: Hoge Intrinsic Motivation Religiosity Scale; χ2: chi-square; DF: default freedom; IFI: incremental fit index; TLI: Tucker–Lewis index; CFI: comparative fit index; GFI: goodness-of-fit index; SRMR: standardized root mean square residual; RMSEA: root mean square error of approximation; CI: confidence interval; AIC: Akaike information criterion.
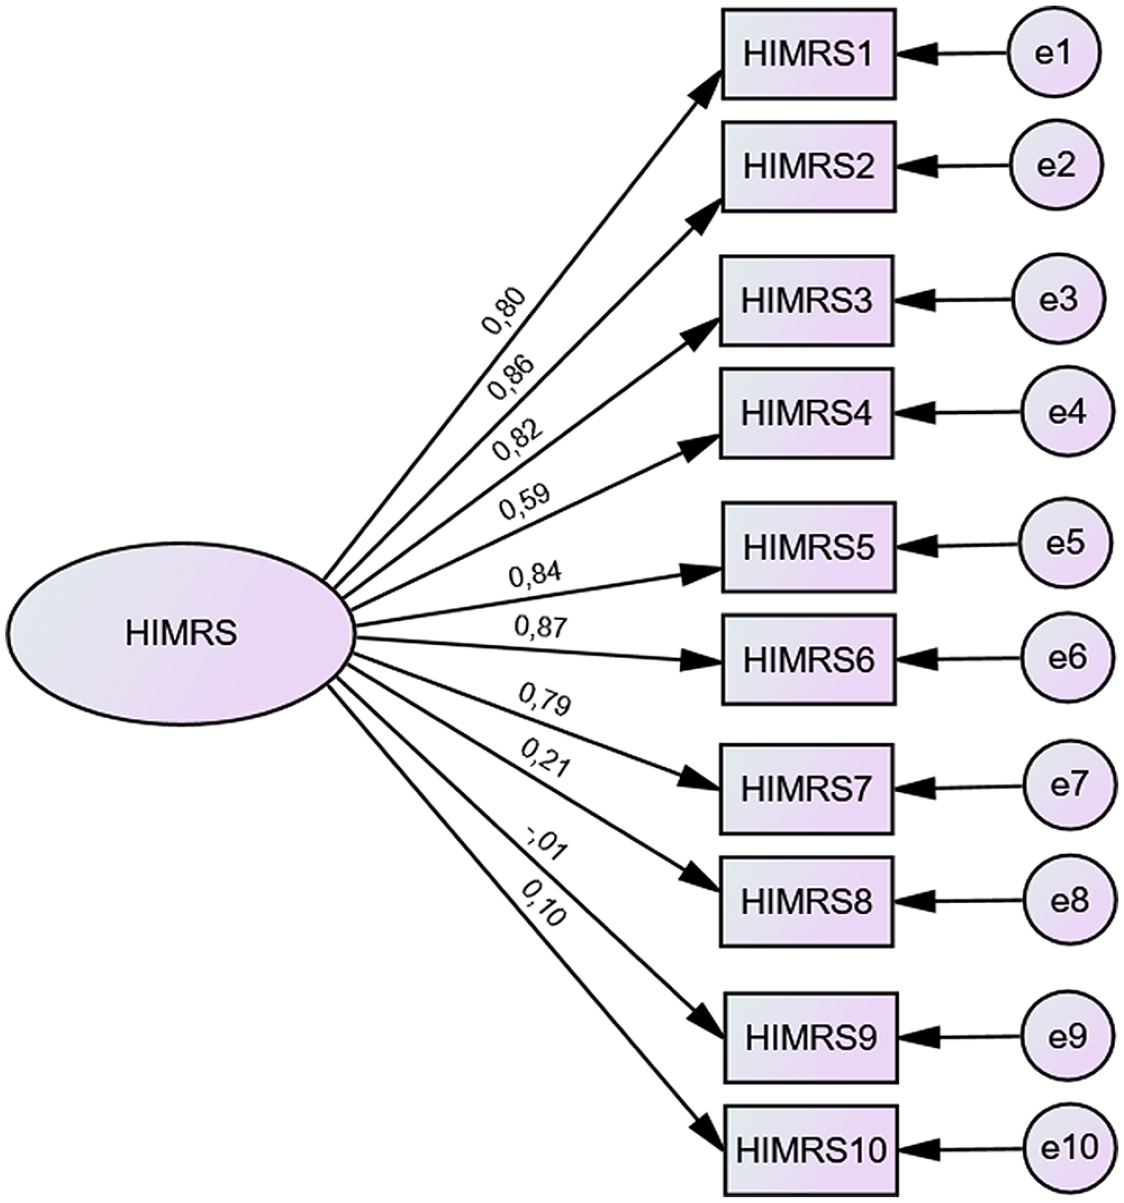
Standardized regression weights of HIMRS with 10 items (1).
Standardized regression weights of HIMRS with seven items (2).
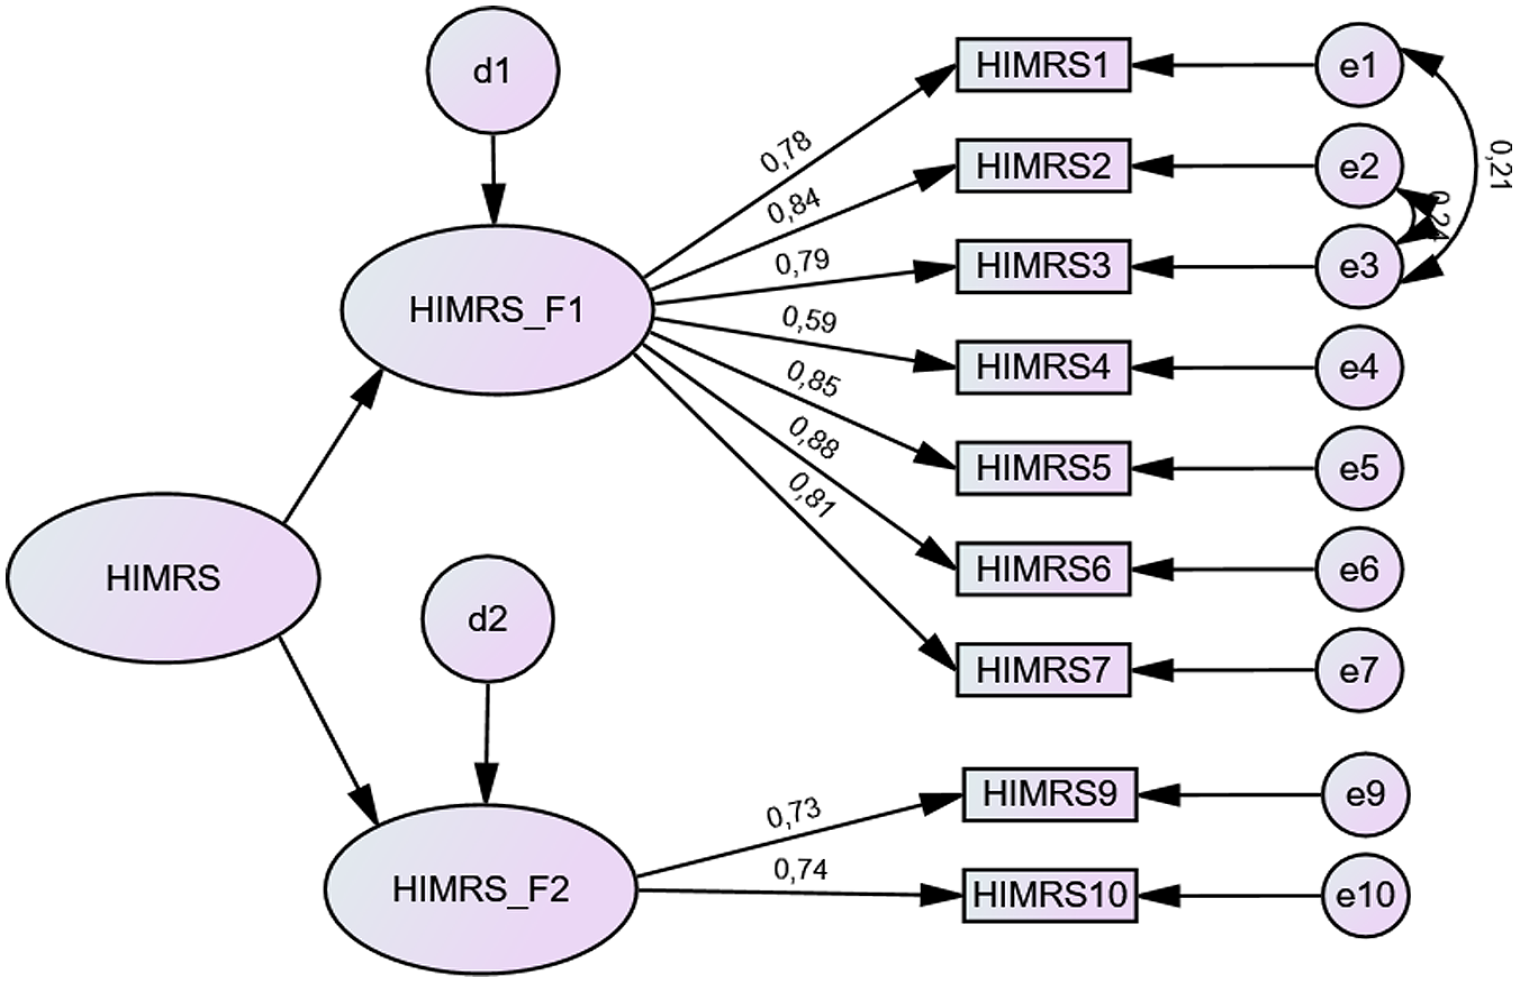
Standardized regression weights of HIMRS with two factors and nine items (3).
CFA for RJRS (N = 502)
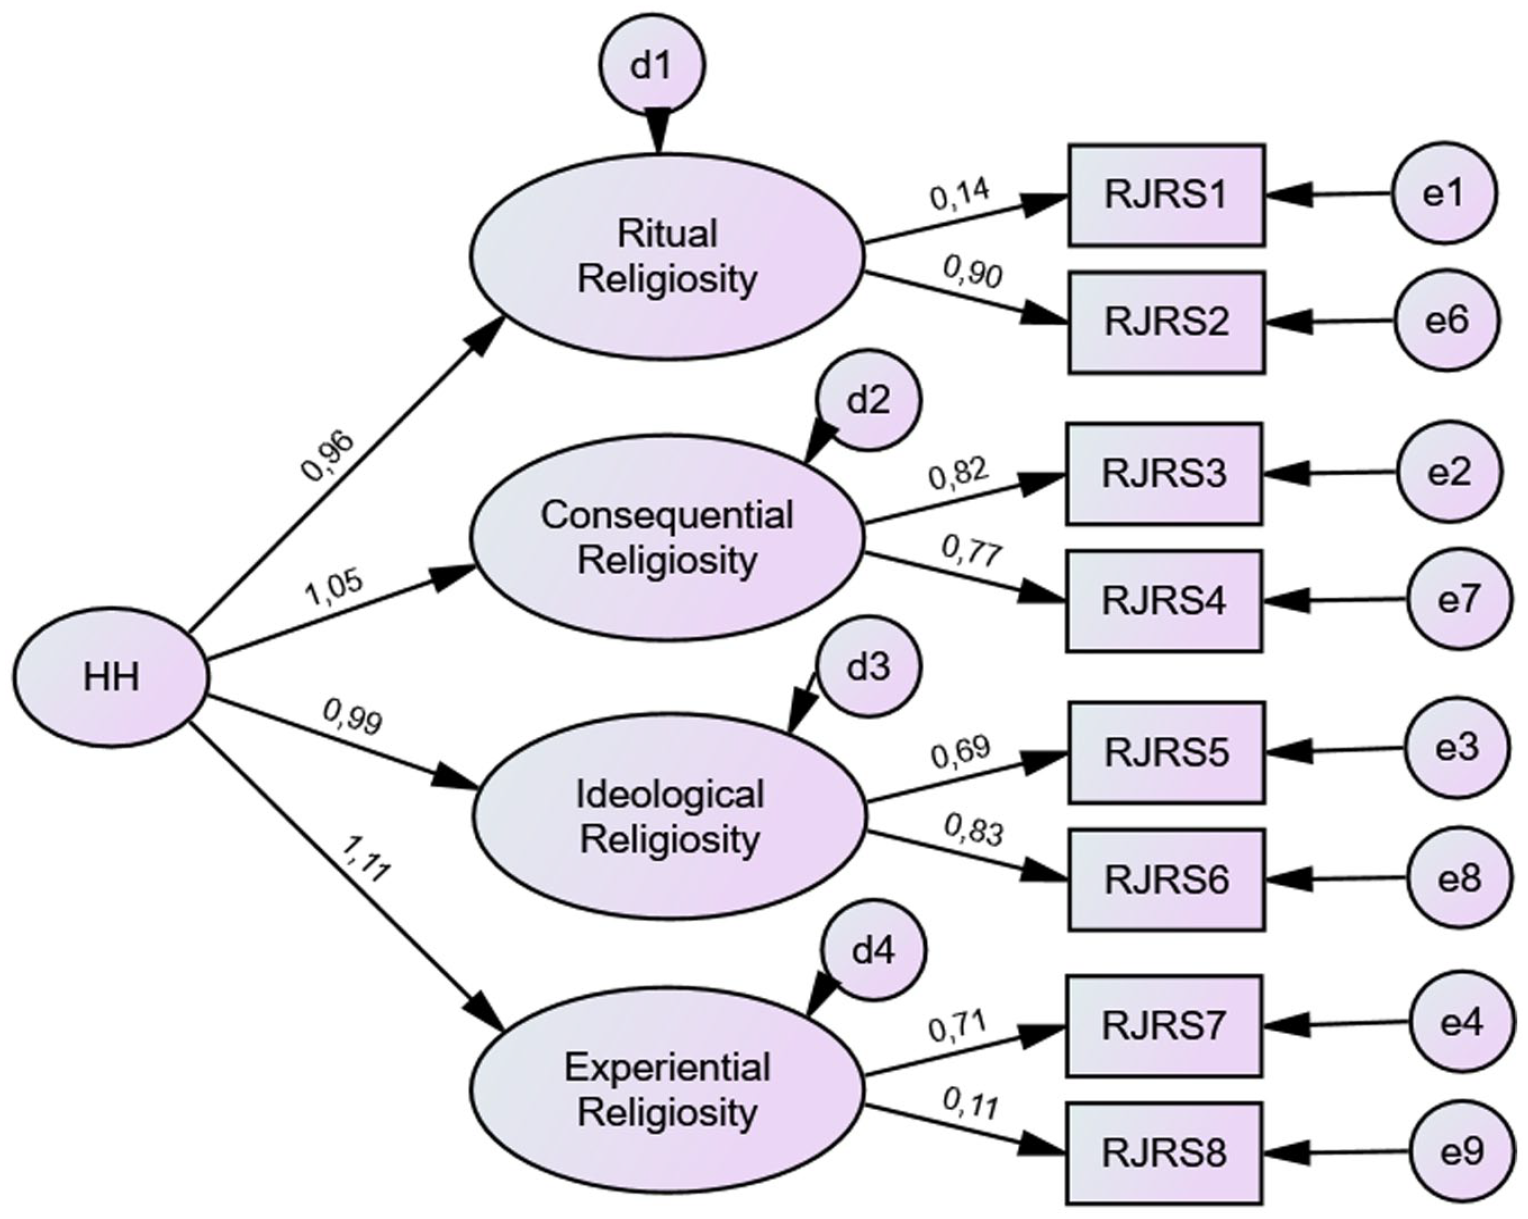
A CFA was carried out in order to confirm the model proposed by the authors (Table 4, Figure 4). However, the model was very poor (Table 4) and looking at the RJRS’ second-order model with four factors, in Figure 4, it was found that the estimated values of standardized regression weights in items 1 and 8 were far below the reference values. Besides, the item that presents the lowest correlation with the total of the scale is 1; and items 1 and 8, if deleted, increase the value of Cronbach’s alpha (Table 2). For these reasons, the authors decided to exclude these two items. Items 1 and 8 belong, respectively, to the ritual religiosity and experiential religiosity factors. However, each of these factors includes only two items, which means that by removing one item from each one, the factors are left with only one item, which makes the model proposed by the authors unfeasible. The authors decided to perform an EFA with polychoric matrix (for ordinal data) of the six remaining items of the RJRS. To this end, the sample was randomly divided into two groups with the same number of participants (N = 251): one group assigned to EFA and the other to subsequent CFA.
Goodness-of-Fit Indexes for the Unidimensional Model of RJRS (N = 502).
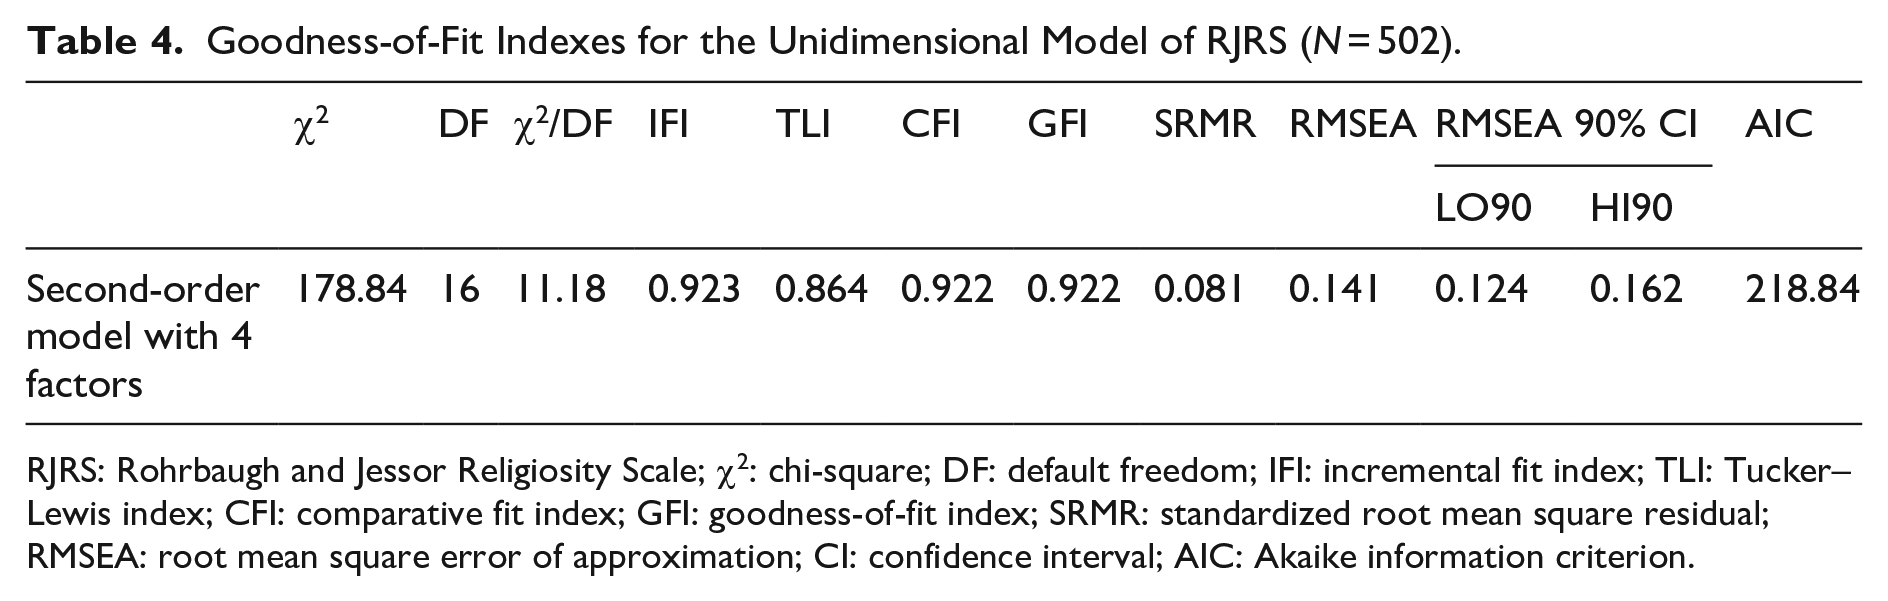
RJRS: Rohrbaugh and Jessor Religiosity Scale; χ2: chi-square; DF: default freedom; IFI: incremental fit index; TLI: Tucker–Lewis index; CFI: comparative fit index; GFI: goodness-of-fit index; SRMR: standardized root mean square residual; RMSEA: root mean square error of approximation; CI: confidence interval; AIC: Akaike information criterion.
Standardized regression weights of RJRS with eight items (1).
EFA with polychoric matrix (for ordinal data) of RJRS (N = 251)
The covariance matrix (polychoric correlation) ranges from 0.489 (between items 4 and 6) to 0.809 (between items 1 and 2). Concerning the adequacy of the polychoric correlation matrix, the determinant of the matrix was 0.007; the Bartlett’s statistic was 1,237.8 (df = 15; p < .001); the Kaiser–Meyer–Olkin (KMO) test was 0.90390 (very good). Also, item location and item adequacy indices were assessed by the quartile of ipsative means, the relative difficulty index, and the measure of sampling adequacy. Based on these criteria, no items were suggested to be removed.
The eigenvalue score analysis pointed to a maximum of one factor to extract. Also, the PA (Timmerman & Lorenzo-Seva, 2011) (whose implementation details included polychoric correlation matrices, 500 random correlation matrices, and the method to obtain random correlation matrices was the permutation of the raw data; Buja & Eyuboglu, 1992) advised one dimension (Table 5). The unidimensional structure (with eigenvalue equal to 4.47 that explained 74.4% of total variance) presented significant loadings (between 0.715 and 0.884) and communalities above 0.300 (from 0.760 to 1.000). Cronbach’s alpha of this unidimensional structure with six items is .906.
Results of RJRS’s Parallel Analysis (N = 251).
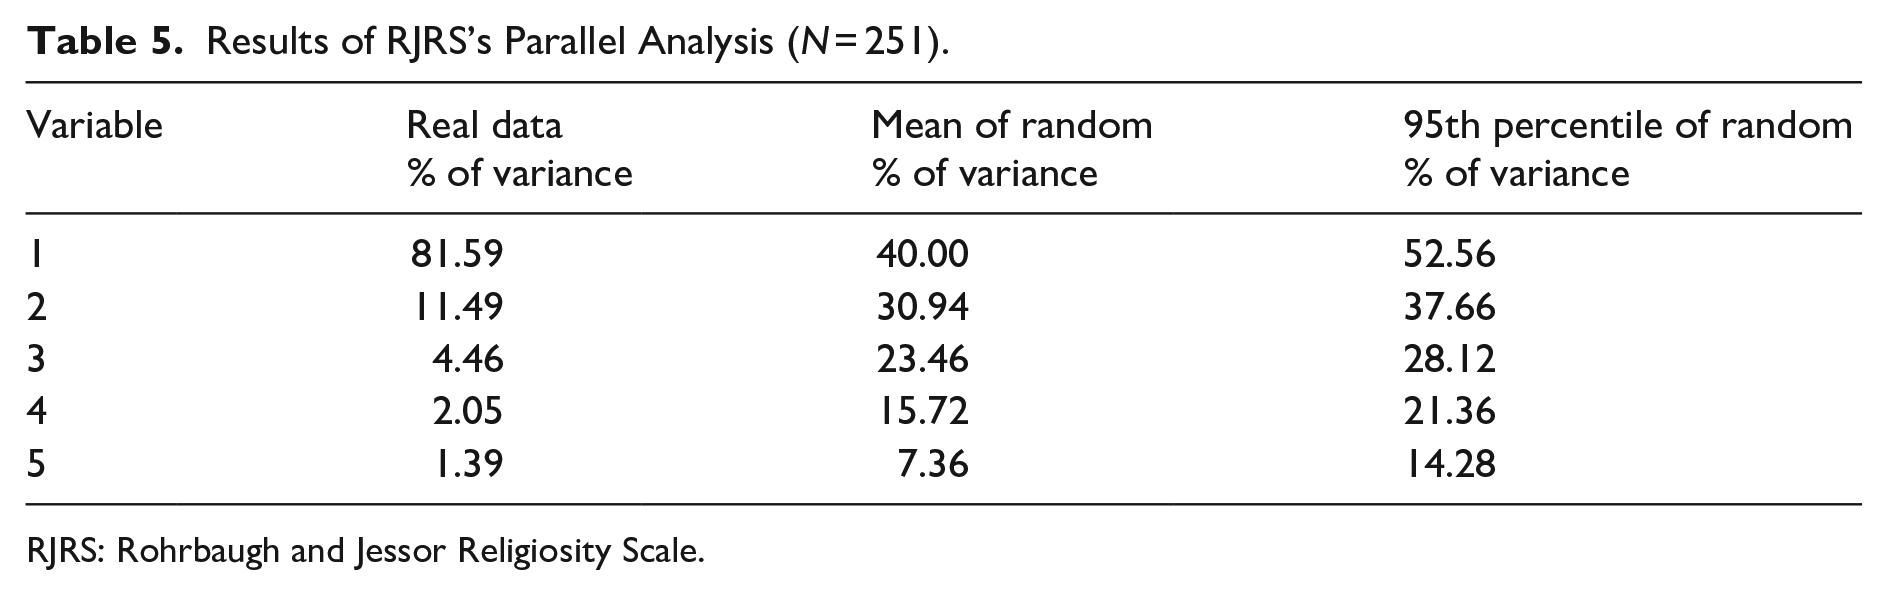
RJRS: Rohrbaugh and Jessor Religiosity Scale.
CFA for RJRS after EFA (N = 251)
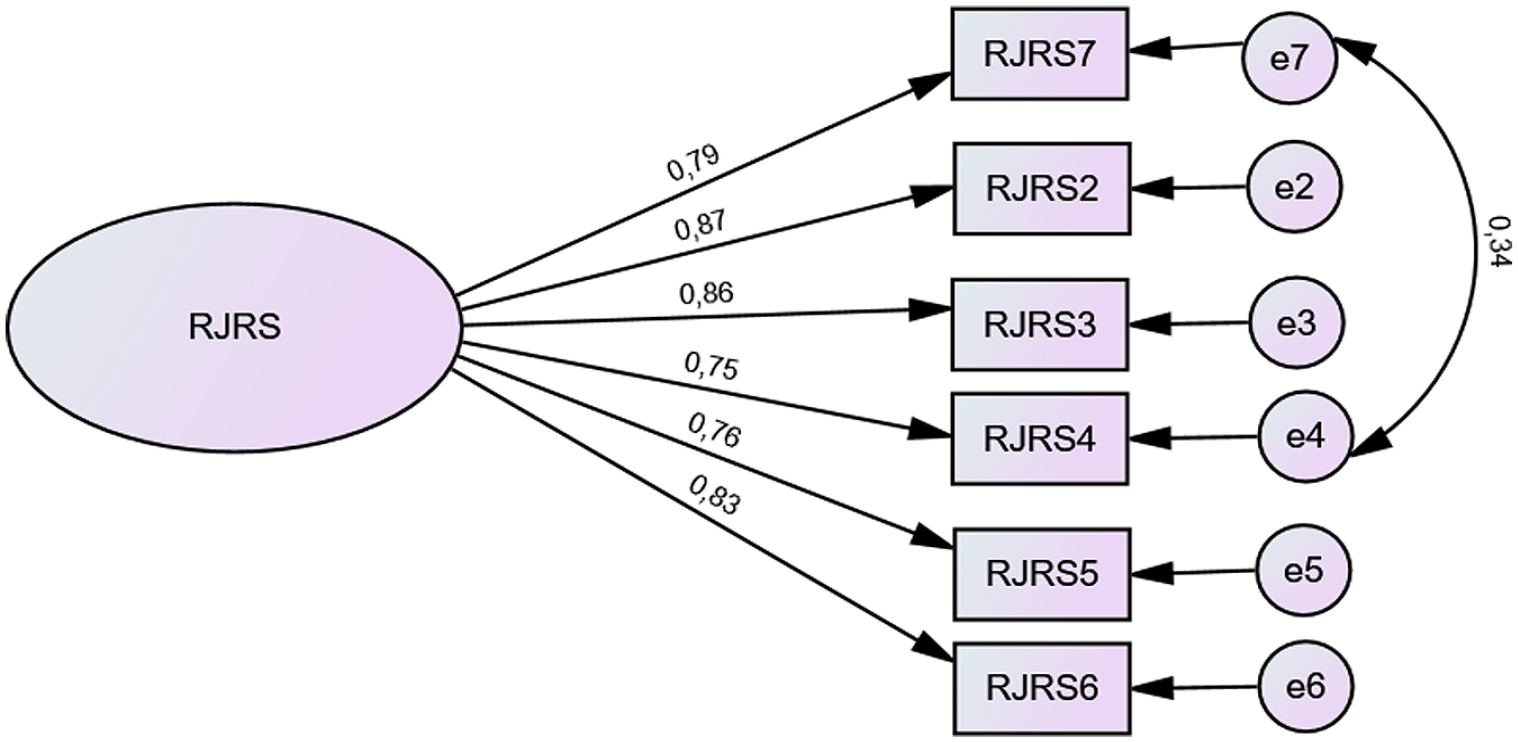
The structure obtained in EFA was confirmed by CFA, using the other half of the sample (Table 6, Figure 5). While most of the indicators are within the benchmarks, some, notably, the RMSEA, were not. We consulted the MIs and found that they suggested a correlation between errors 4 and 7 (MI = 20.249) (Table 6). Once this correlation between errors was established (theoretically supported as both items belong to the same construct), the model achieved a good fit (Table 6).
Goodness-of-Fit Indexes for the Three-Factor Models for the Portuguese Version of RJRS (N = 251).
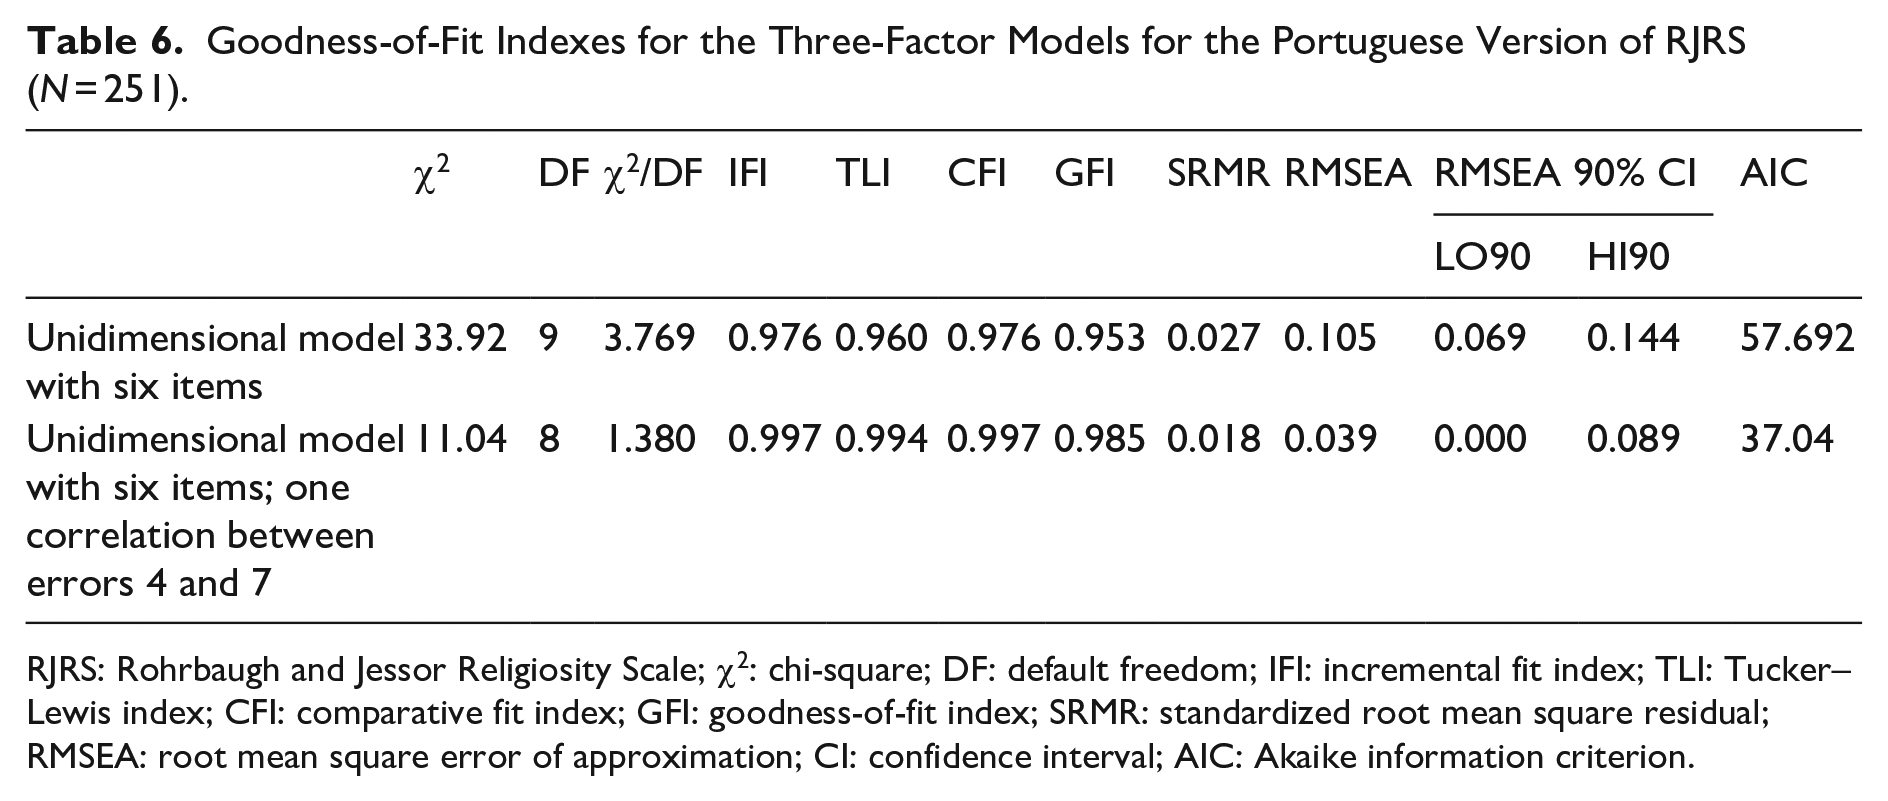
RJRS: Rohrbaugh and Jessor Religiosity Scale; χ2: chi-square; DF: default freedom; IFI: incremental fit index; TLI: Tucker–Lewis index; CFI: comparative fit index; GFI: goodness-of-fit index; SRMR: standardized root mean square residual; RMSEA: root mean square error of approximation; CI: confidence interval; AIC: Akaike information criterion.
Standardized regression weights of RJRS with eight items (2).
Cronbach’s alpha, CR, AVE, and AVE square roots of the Portuguese version of CRS are above the recommended values (Table 7). HIMRS total and RJRS correlate negatively and statistically in a significant way (albeit low); also, RJRS correlate negatively and significantly with Intrinsic dimension, but positively and non-significantly with Extrinsic dimension (Table 7). Intrinsic and Extrinsic dimension correlate negatively and significantly (Table 7).
Correlations, Cronbach’s Alpha, Composite Reliability, Average Variance Extracted (AVE), AVE Square Roots, Mean and Standard Deviation of the Portuguese Version of HIMRS and RJRS (N = 502).
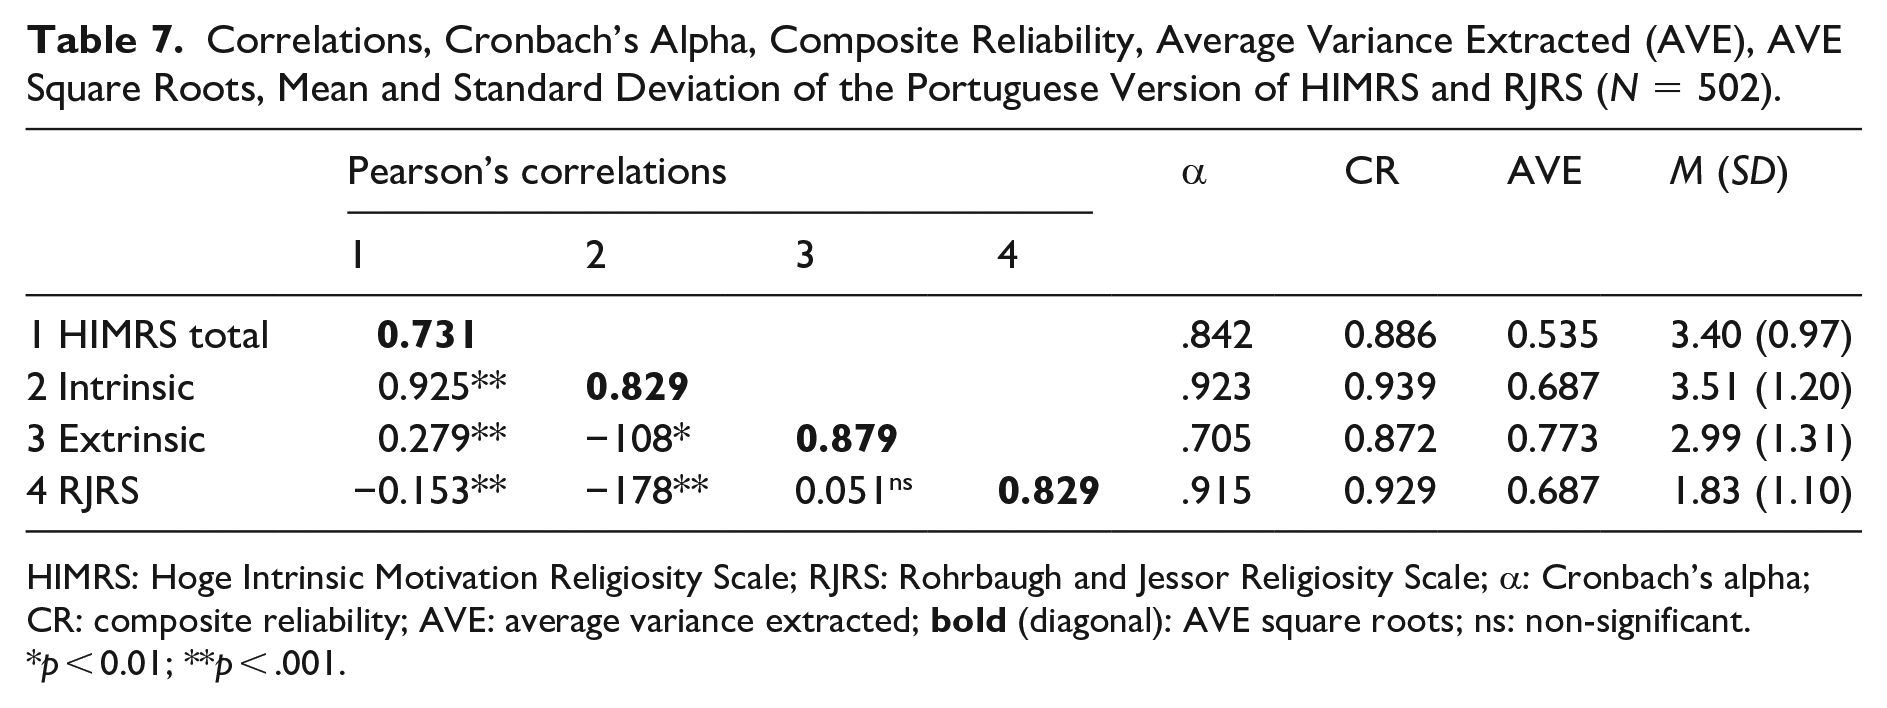
HIMRS: Hoge Intrinsic Motivation Religiosity Scale; RJRS: Rohrbaugh and Jessor Religiosity Scale; α: Cronbach’s alpha; CR: composite reliability; AVE: average variance extracted;
p < 0.01; **p < .001.
Relation between HIMRS and RJRS and religious identity (N = 502)
Regarding the question Do you believe in God? the mean was 5 and the median was also 5. Concerning the question Do you consider yourself a religious person? the mean was 4.09 and the median was 4. Regarding the question Is religion important in your life? the mean was 4.23 and the median was 4. With regard to the last question of religious identity How do you define yourself from a spiritual or religious point of view? the mean was 3.96 and the median was 4. Regarding this last question, the frequencies of the answers were as follows: 1—I am a materialistic person (21 or 4.2%); 2—I am an atheist (33 or 6.6%); 3—I am agnostic (95 or 18.9%); 4—I am a spiritual person (148 or 29.5%); and 5—I am a religious person (205 or 40.8%). Religious identity correlates positively and significantly with RJRS and negatively and significantly with HIMRS and Intrinsic dimension; only the last question concerning religious identity correlates negatively with Extrinsic dimension (Table 8).
Frequencies of Religious Identity and Rho Spearman Correlations with HIMRS and RJRS (N = 502).
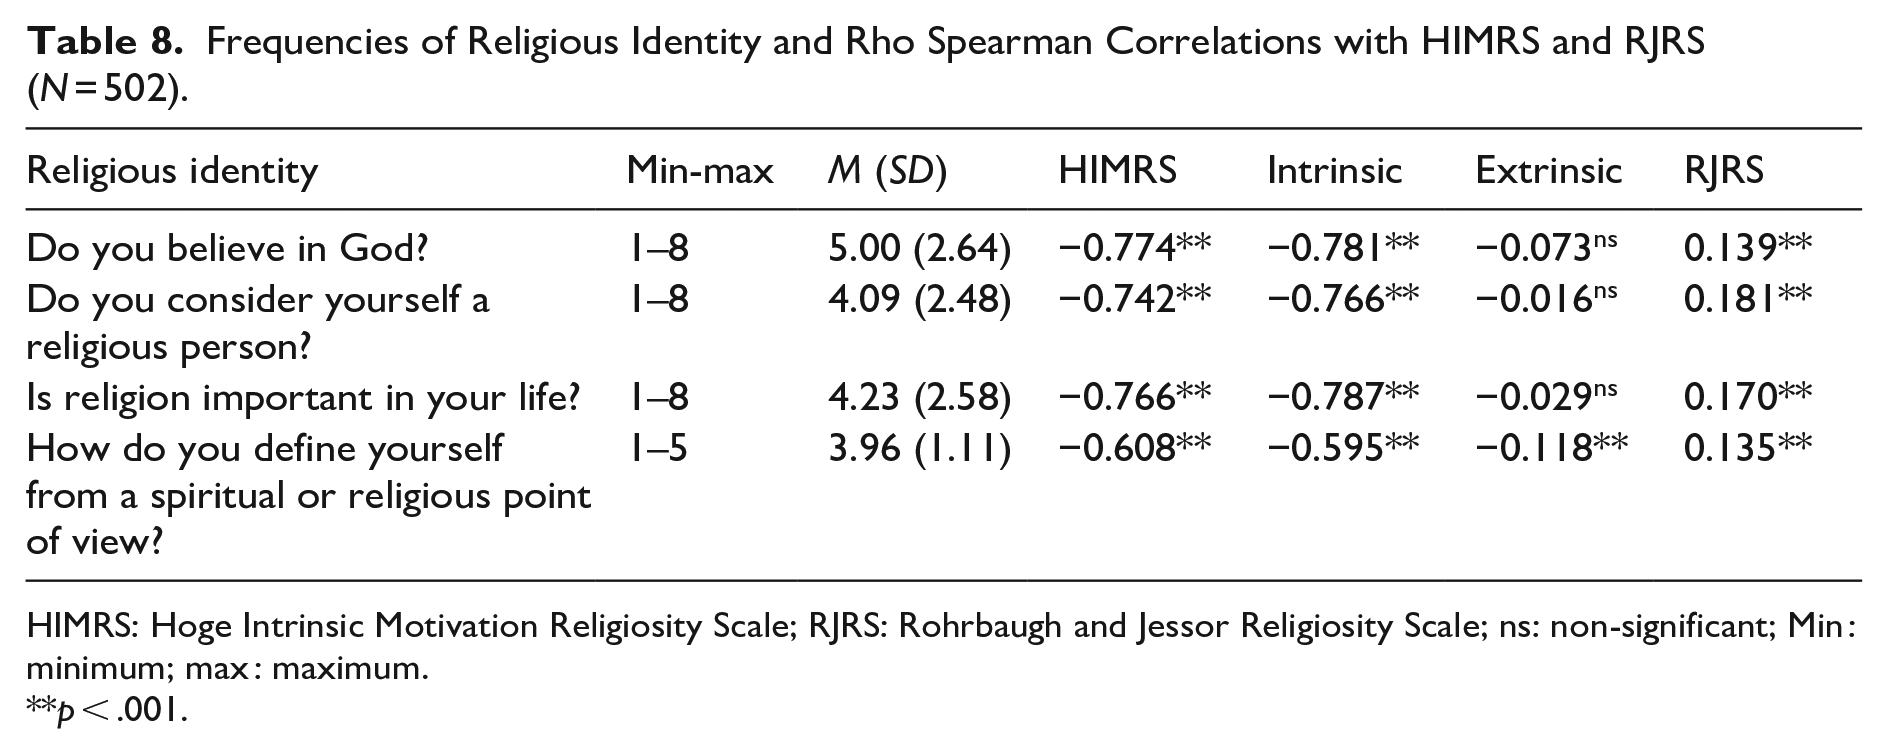
HIMRS: Hoge Intrinsic Motivation Religiosity Scale; RJRS: Rohrbaugh and Jessor Religiosity Scale; ns: non-significant; Min : minimum; max : maximum.
p < .001.
Gender (N = 502)
There are no statistically significant differences in the values of the HIMRS and RJRS dimensions in relation to gender. Also, there are no statistically significant differences in the values of religious identity in relation to gender, except for “How do you define yourself from a spiritual or religious point of view?,” being that women chose more than men the response modalities that mean more religiosity, χ2(108,267) = −2.014; p = .047; Ф = −0.269.
Age (N = 502)
Age correlates significantly and negatively with HIMRS total (r = −.158; p < .001) and with Intrinsic dimension (r = −.182; p < .001). Also, age correlates significantly and positively with religious identity: Do you believe in God? (ρ = 0.161; p < .001), Do you consider yourself a religious person? (ρ = 0.148; p < .001), Is religion important in your life? (ρ = 0.146; p < .001), and How do you define yourself from a spiritual or religious point of view? (ρ = 0.100; p < .010).
Marital status (N = 502)
There are statistically significant differences in the values of the HIMRS Intrinsic dimension in relation to marital status: divorced people have significantly lower values (translating greater religiosity) than singles, married, and widows, F(3, 498) = 2.961; p = .034; η2 = 0.018.
Education (N = 502)
The education variable was recoded and converted into a dichotomous variable, 0—without university (n = 235) studies and 1—with university studies (n = 267). There are statistically significant differences in the values of the Intrinsic dimension: respondents with university studies presented significantly lower values than respondents without university studies in relation to Intrinsic dimension, t(494, 705) = 2.581; p = .010; d = −0.197. There are also statistically significant differences in the values of the Extrinsic dimension: respondents with university studies presented significantly higher values than respondents without university studies in relation to Extrinsic dimension, t(499, 941) = −4.003; p < .001; d = −0.355. Also, there are statistically significant differences in the values of the question Is religion important in your life? in relation to education: respondents with university studies presented significantly higher values than respondents without university studies, t(499, 987) = −2.140; p = .033; d = 0.229.
Professional status (N = 502)
There are no statistically significant differences regarding HIMRS, RJRS, and religious identity according to professional status.
Discussion
This study aims to validate, for the Portuguese population, the bidimensional structure of the HIMRS and the four-dimensional structure of the RJRS; it also aims to establish an association between the two religious scales and religious identity. An attempt was made to confirm, through a CFA, the models of the original versions of the HIMRS and RJRS. While, in relation to HIMRS, it was found to be a good adjustment model (although without 1 item: item 8 whose standardized regression weight was unacceptable), this was not found in relation to RJRS. Regarding HIMRS, the item removed was related to extrinsic motivations of religiosity; so, the Portuguese version of the scale includes seven items related to intrinsic motivations of religiosity and two related to extrinsic motivations of religiosity. Our results are quite similar from those of Liu and Koenig (2013), who found a two-factor solution; however, the study by these authors was carried out in a non-Western and non-Christian society (China), unlike our study. Also, Araújo et al. (2021) found two factors in their preliminary study for the Portuguese population. Hafizi et al. (2015) assessed the psychometric properties of the Farsi version of the Hoge Intrinsic Religiosity Scale and found a two-factor solution.
Concerning RJRS, it was carried out as an EFA for ordinal data to understand how the items were organized. The structure found did not coincide with the structure of the original authors (in these, the scale included four factors and in our study the scale included one factor). Two items (1 and 8) were removed: in the first CFA, the estimated values of standardized regression weights in items 1 and 8 were far below the reference values. Besides, items 1 and 8, if deleted, increase the value of Cronbach’s alpha. Then, the EFA suggested the existence of a single factor with six items, and this was confirmed by the subsequent CFA. This unidimensional structure of the RJRS is in line with previous validations (Nicholas & Durrheim, 1996; Rohrbaugh & Jessor, 1975, 2017; Zhang et al., 2020). Although Glock (1962) suggested five core dimensions of religiosity (belief, knowledge, experience, practice, and consequences) and Lenski (1961) proposed four dimensions (doctrinal orthodoxy, devotionalism, associational religiosity, and communal religiosity outside the church setting), others stated that several measures of religiosity make up a single, unidimensional scale (Clayton, 1971; Voas, 2007).
Concerning the relation between HIMRS, Intrinsic and Extrinsic dimensions, and RJRS, HIMRS total and RJRS correlate negatively and statistically in a significant way (albeit low). Also, RJRS correlate negatively and significantly with Intrinsic dimension, but positively and non-significantly with Extrinsic dimension. These results can be explained by the fact that the scales are quoted oppositely; that is, low values on the HIMRS and high values on the RJRS mean greater religiosity. HIMRS includes 10 statements about religious belief or experience (Hoge, 1972), being that on one end of the dimension are seven intrinsic items, and on the other end are three extrinsic items. This explains the different correlations between RJRS and Intrinsic (negative) and Extrinsic (positive) dimensions.
Regarding the items that assess religious identity, they present average values of 4 and 5 (central values), although, in the last question, almost the majority of respondents chose the last answer option (5—I am a religious person [205 or 40.8%]). These results are not enough to contradict or corroborate Inglehart (2020) who stated the global decline of religion. In fact, “religion has been profoundly reconfigured in the age of development” (Feener & Fountain, 2018, p. 1).
Religious identity correlates positively and significantly with RJRS and negatively and significantly with HIMRS and Intrinsic dimension; only the last question concerning religious identity correlates negatively with Extrinsic dimension. In fact, participants who present high religious identity also present high intrinsic religiosity. According to Van Der Noll et al. (2018), religious identity is more accepted in societies with an elevated level of societal religiosity in Europe, where this study took place; indeed, societal religiosity positively predicts religious identity.
Women chose more than men the response modalities that means (mean?) more religiosity in relation to the item “How do you define yourself from a spiritual or religious point of view?.” No other differences were found concerning gender, in spite of girls scoring higher in extrinsic religiosity (personal) and search for meaning in life compared with boys; also, intrinsic religiosity promotes higher search for meaning in life, which in turn lowers self-esteem only for girls (Li & Liu, 2023). Gender gaps in religiosity are one of the most consistent findings in the social sciences; women are generally more religious (Schnabel, 2018). Age correlates significantly with HIMRS total and Intrinsic dimension as well as with religious identity, meaning that older people are more religious. Hackett and colleagues (2018) found that younger people are less religious than old people in 41 countries, but there are 2 countries in which younger people are more religious and there is no difference in 60 countries.
Divorced people have significantly lower values (translating greater religiosity) than singles, married, and widows in relation to Intrinsic dimension. Glass and Levchak (2014) found that some states (with more individuals with strong religious beliefs and practices) tend to have higher divorce rates. The authors explained this trend by socioeconomic factors and by the tendency of some highly religious individuals to have less formal education, to marry, and to have children earlier. Respondents with university studies presented significantly lower values (higher religiosity) than respondents without university studies in relation to Intrinsic dimension and respondents with university studies presented significantly higher values (lower religiosity) than respondents without university studies in relation to Extrinsic dimension. For respondents with university studies, religion is more important than for those without university studies. Contrary to our results, Meisenberg et al. (2012) found a weak negative relationship of religiosity with education at an individual level, but this relationship is culturally amplified into larger differences at the country level, and the effect of education is mediated by cognitive skills.
Conclusion
This study aimed to validate, for the Portuguese population, the bidimensional structure of HIMRS and the four-dimensional structure of the RJRS, as well as to establish an association between the two religious scales and religious identity. Although we found good fit models for both instruments, we did not maintain the structure of the original instruments. Despite the solution found in this study for the HIMRS presents two factors (as the original one), it contains nine items and not 10 (as the original). Concerning RJRS, it was a unidimensional model that was already found by other authors; however, our version contains six items and not eight as the original one. These differences may represent a limitation, especially when comparing studies. Another limitation of this study concerns the fact that the sample is not representative of the Portuguese population. However, our results concluded that this study provides two instruments that assess religiosity for the Portuguese population, thus filling a gap in the literature concerning the Psychology of Religion in the Portuguese population. In fact, validated and standardized instruments are needed in this field to carry out studies whose confiability is assured. In addition, clinicians are in possession of instruments that allow them to assess such an important dimension of existence (religiosity) that is often neglected and that can contribute to a better well-being of patients. Also, religious leaders can assess the way religiosity impacts people’s lives and guide them accordingly.
Footnotes
Appendix
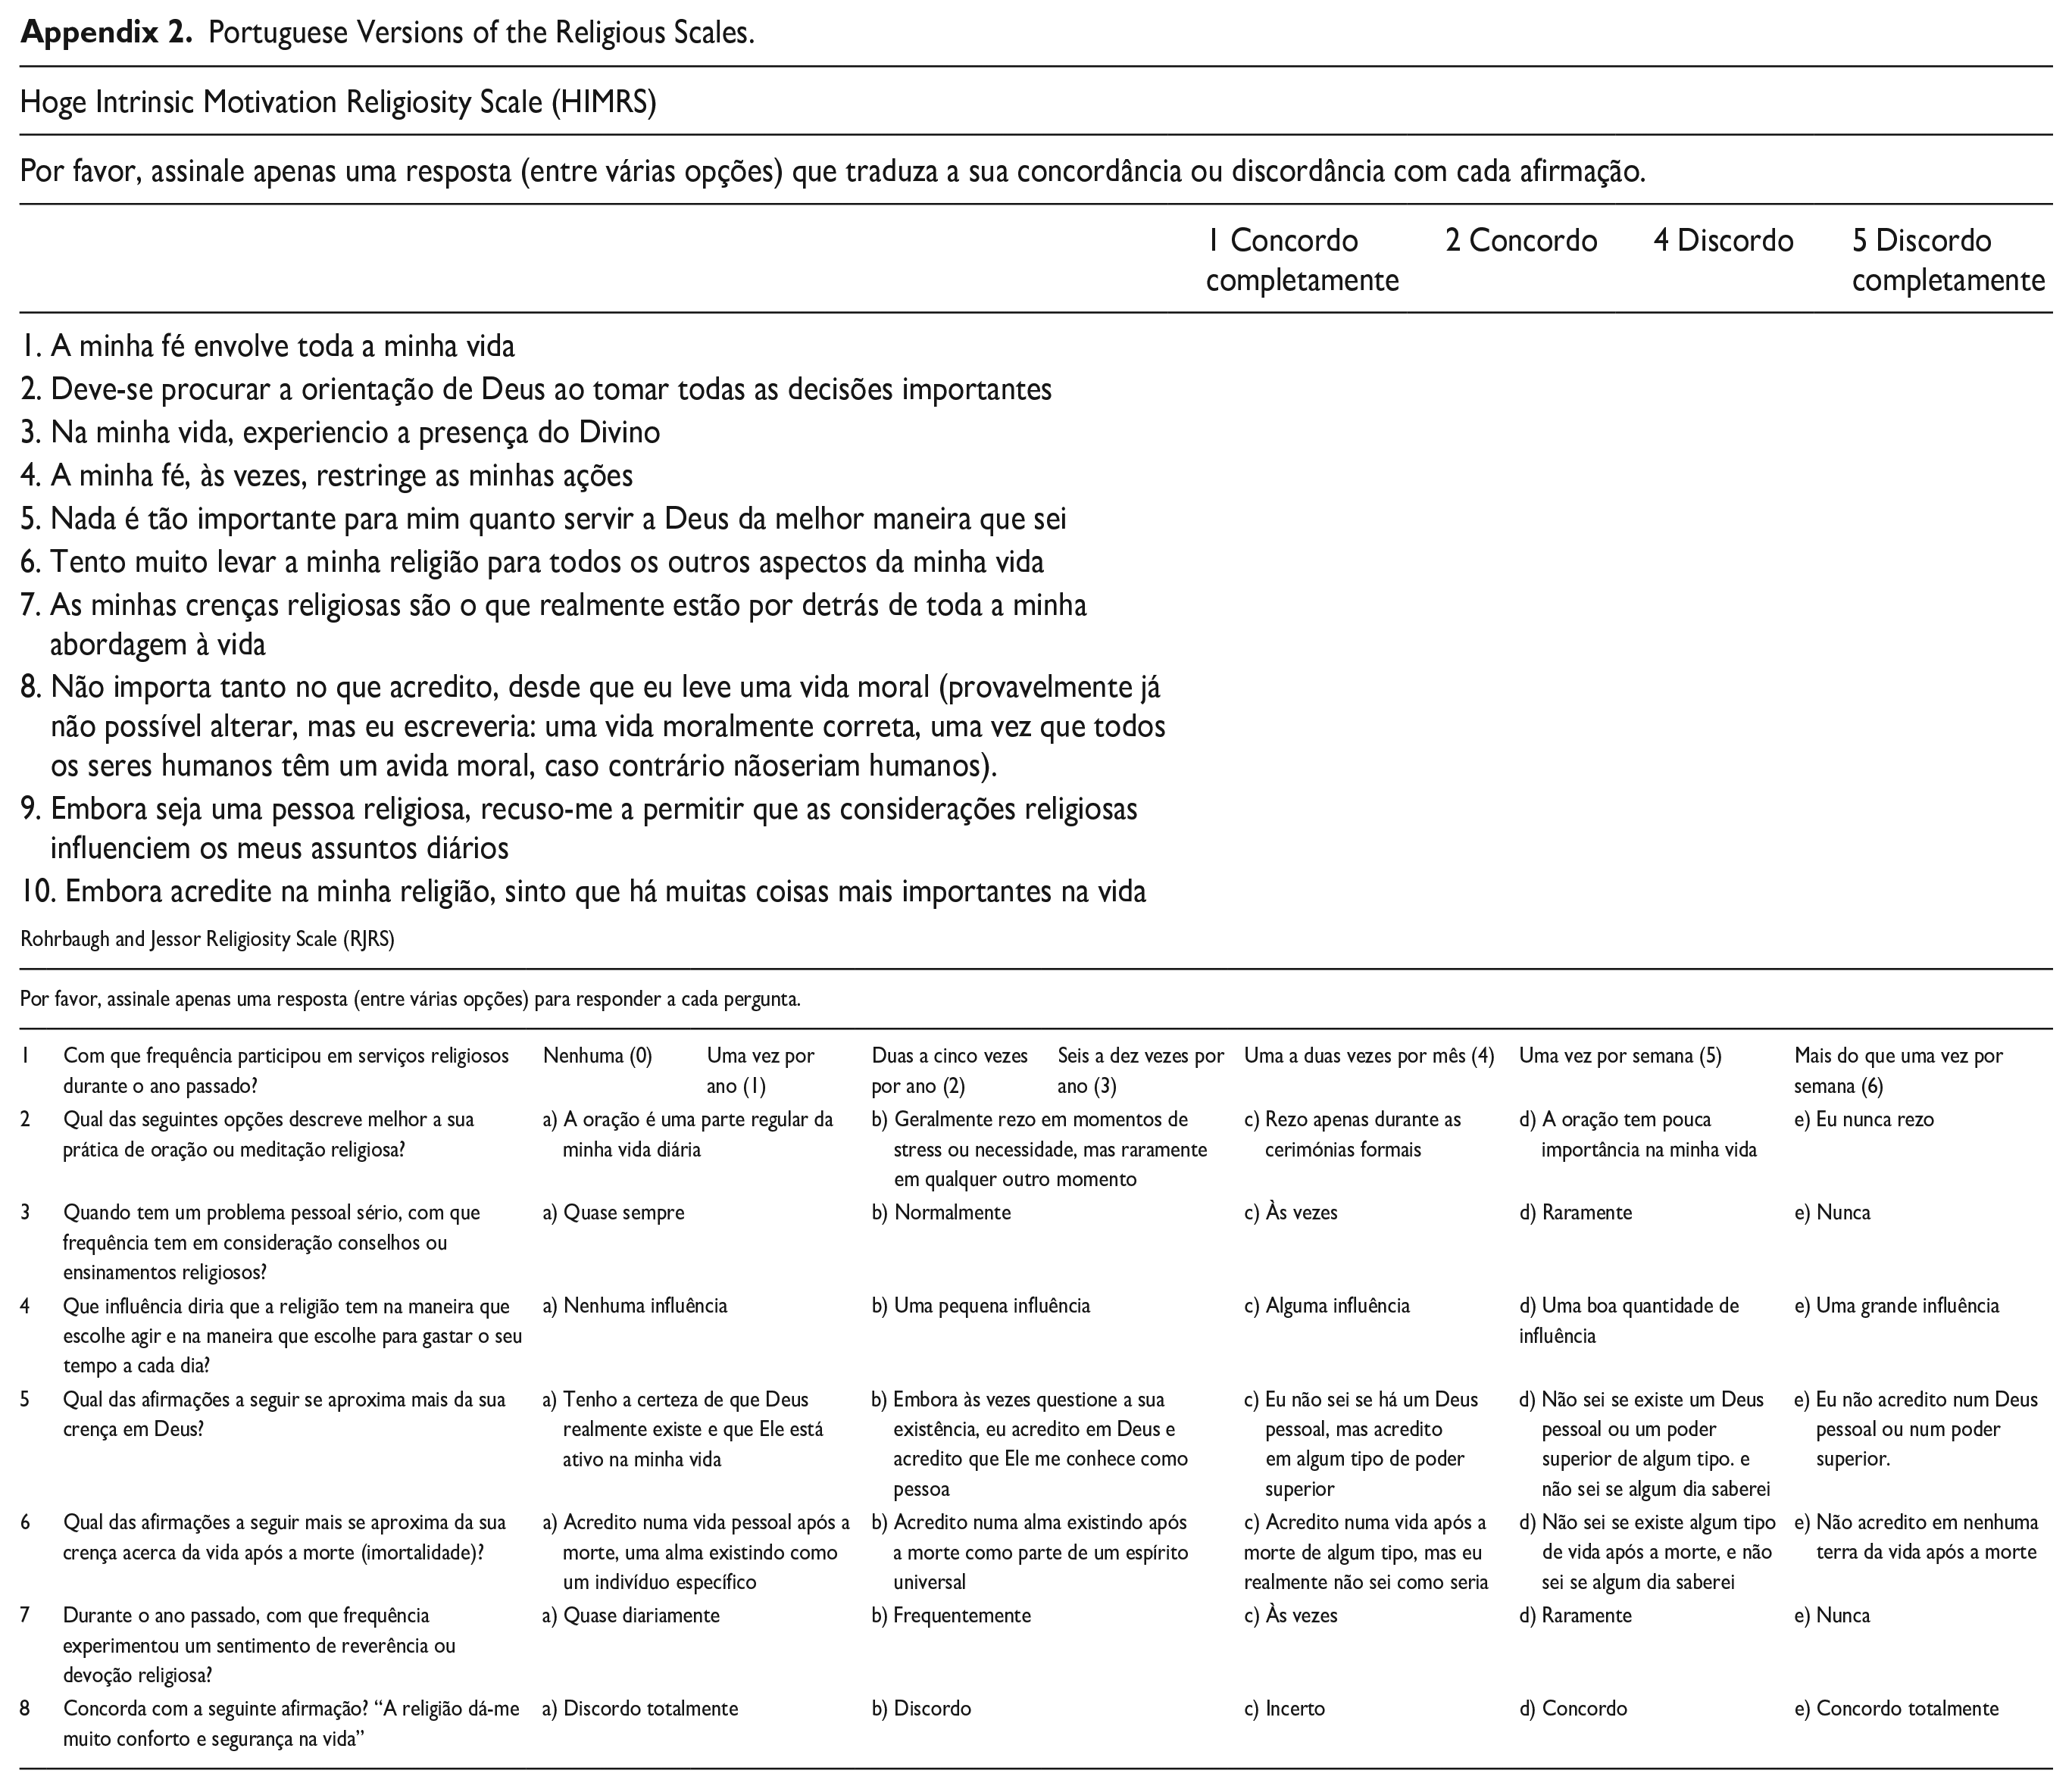
Portuguese Versions of the Religious Scales.
| Hoge Intrinsic Motivation Religiosity Scale (HIMRS) | ||||
|---|---|---|---|---|
| Por favor, assinale apenas uma resposta (entre várias opções) que traduza a sua concordância ou discordância com cada afirmação. | ||||
| 1 Concordo completamente | 2 Concordo | 4 Discordo | 5 Discordo completamente | |
| 1. A minha fé envolve toda a minha vida | ||||
| 2. Deve-se procurar a orientação de Deus ao tomar todas as decisões importantes | ||||
| 3. Na minha vida, experiencio a presença do Divino | ||||
| 4. A minha fé, às vezes, restringe as minhas ações | ||||
| 5. Nada é tão importante para mim quanto servir a Deus da melhor maneira que sei | ||||
| 6. Tento muito levar a minha religião para todos os outros aspectos da minha vida | ||||
| 7. As minhas crenças religiosas são o que realmente estão por detrás de toda a minha abordagem à vida | ||||
| 8. Não importa tanto no que acredito, desde que eu leve uma vida moral (provavelmente já não possível alterar, mas eu escreveria: uma vida moralmente correta, uma vez que todos os seres humanos têm um avida moral, caso contrário nãoseriam humanos). | ||||
| 9. Embora seja uma pessoa religiosa, recuso-me a permitir que as considerações religiosas influenciem os meus assuntos diários | ||||
| 10. Embora acredite na minha religião, sinto que há muitas coisas mais importantes na vida | ||||
| Rohrbaugh and Jessor Religiosity Scale (RJRS) | ||||||||
|---|---|---|---|---|---|---|---|---|
| Por favor, assinale apenas uma resposta (entre várias opções) para responder a cada pergunta. | ||||||||
| 1 | Com que frequência participou em serviços religiosos durante o ano passado? | Nenhuma (0) | Uma vez por ano (1) | Duas a cinco vezes por ano (2) | Seis a dez vezes por ano (3) | Uma a duas vezes por mês (4) | Uma vez por semana (5) | Mais do que uma vez por semana (6) |
| 2 | Qual das seguintes opções descreve melhor a sua prática de oração ou meditação religiosa? | a) A oração é uma parte regular da minha vida diária | b) Geralmente rezo em momentos de stress ou necessidade, mas raramente em qualquer outro momento | c) Rezo apenas durante as cerimónias formais | d) A oração tem pouca importância na minha vida | e) Eu nunca rezo | ||
| 3 | Quando tem um problema pessoal sério, com que frequência tem em consideração conselhos ou ensinamentos religiosos? | a) Quase sempre | b) Normalmente | c) Às vezes | d) Raramente | e) Nunca | ||
| 4 | Que influência diria que a religião tem na maneira que escolhe agir e na maneira que escolhe para gastar o seu tempo a cada dia? | a) Nenhuma influência | b) Uma pequena influência | c) Alguma influência | d) Uma boa quantidade de influência | e) Uma grande influência | ||
| 5 | Qual das afirmações a seguir se aproxima mais da sua crença em Deus? | a) Tenho a certeza de que Deus realmente existe e que Ele está ativo na minha vida | b) Embora às vezes questione a sua existência, eu acredito em Deus e acredito que Ele me conhece como pessoa | c) Eu não sei se há um Deus pessoal, mas acredito em algum tipo de poder superior | d) Não sei se existe um Deus pessoal ou um poder superior de algum tipo. e não sei se algum dia saberei | e) Eu não acredito num Deus pessoal ou num poder superior. | ||
| 6 | Qual das afirmações a seguir mais se aproxima da sua crença acerca da vida após a morte (imortalidade)? | a) Acredito numa vida pessoal após a morte, uma alma existindo como um indivíduo específico | b) Acredito numa alma existindo após a morte como parte de um espírito universal | c) Acredito numa vida após a morte de algum tipo, mas eu realmente não sei como seria | d) Não sei se existe algum tipo de vida após a morte, e não sei se algum dia saberei | e) Não acredito em nenhuma terra da vida após a morte | ||
| 7 | Durante o ano passado, com que frequência experimentou um sentimento de reverência ou devoção religiosa? | a) Quase diariamente | b) Frequentemente | c) Às vezes | d) Raramente | e) Nunca | ||
| 8 | Concorda com a seguinte afirmação? “A religião dá-me muito conforto e segurança na vida” | a) Discordo totalmente | b) Discordo | c) Incerto | d) Concordo | e) Concordo totalmente | ||
Author Contributions
All authors contributed to the study conception and design. Material preparation, data collection, and analysis were performed by Â.L. and P.C.D. The first draft of the manuscript was written by Â.L., B.N., and P.C.D.; all authors commented on previous versions of the manuscript. All authors read and approved the final manuscript.
Declaration of Conflicting Interests
The author(s) declared no potential conflicts of interest with respect to the research, authorship, and/or publication of this article.
Funding
The author(s) disclosed receipt of the following financial support for the research, authorship, and/or publication of this article: This study has been supported by Centro de Estudos Filosóficos e Humanísticos (UID/FIL/00683/2021) e da Bial Foundation (Grants for Scientific Research 2020/2021, No. 380/20).
Ethical Approval
All procedures followed the Declaration of Helsinki and later amendments or comparable ethical standards. This study was approved by the Ethics Committee for Health of the Portuguese Catholic University (standpoint number 118 [2019-2023]). Participants were informed about the study’s purpose, and confidentiality and anonymity of the data were ensured. All participants signed an informed consent.
Data Availability
The datasets generated during and/or analyzed during the current study are available from the corresponding author on reasonable request.