
Abstract
Measuring social categories and phenomena in survey questionnaires is complicated in a dynamic and diverse society. The use of “other, describe”–style open-ended text boxes can address this issue, but researchers rarely use these data because they lack guidance on how to code open-text information and manage small samples for analyses. The authors offer a roadmap to key decisions regarding the use of “other, describe” answer options and data during three stages of research: data collection and instrument development, data cleaning, and data analysis. The authors then use two cases, the Perceptions of Housework Pilot Survey and the Perceptions of Discrimination Study, to illustrate how decision making about open-text responses to demographic survey questions unfolded. These cases highlight the complexities and trade-offs in decision making and their implications for knowledge production. The authors recommend meta-practices for flexibility, transparency, and reflexivity, as there is not one “right choice” when it comes to using “other, describe” data.
In a dynamic and diverse society, measuring social categories and phenomena, including racial/ethnic (Jones et al. 2021), gender (Brown 2022), and sexuality (Jones 2022) identities is complex (Humes and Hogan 2009; Jones et al. 2021; National Academies of Sciences, Engineering, and Medicine 2022). “Other, describe” response options with open-text boxes allow researchers to capture emergent social categories and track terminology changes (see Jin and Wang 2023). Open-text responses also alert researchers to new and changing social categories that are not always included as closed-ended options, such as “Middle Eastern/North African” (MENA) as an ethnoracial group (Maghbouleh, Schachter, and Flores 2022), “gender fluid” as a gender identity (Saperstein and Westbrook 2021), and “asexual” as a sexuality (Scheffey, Ogden, and Dichter 2019). Open-text responses also allow people to self-identify (Broussard, Warner, and Pope 2018) or explain their situations further. For example, respondents from marginalized racial backgrounds, particularly those who identify as multiracial and those with expansive gender and sexuality identities, may not find standard demographic questions fitting (Scheffey et al. 2019). Using open-text boxes allows respondents to identify their race, gender, sexuality, and other circumstances without constraint, promoting inclusion in survey research.
However, researchers often overlook open-text responses, in building or analyzing survey data, sometimes with disastrous results (e.g., the U.S. Census Bureau’s recoding of many Hispanic respondents who wrote in open-ended responses to American Indian; see Liebler and Ortyl 2014). Researchers may fear issues of small samples or the possibility that people intentionally or unintentionally provide meaningless responses (Monette, Sullivan, and DeJong 2013). Or researchers may lack the time and resources to code and analyze qualitative data, especially as these data may be supplemental to focal research questions. Another concern is that details about how analysts process open text are not included in the main research manuscript (if at all), leading to potential issues of reproducibility, bias, and unethical exclusion of study participants. Furthermore, there is no unified, legitimated approach nor explicit guidance on what to do when respondents do not fit into predetermined closed-text responses, or if respondents check “other” without writing anything. This lack of attention poses a problem for gauging the validity and reliability of research findings where “other, describe” is used to measure any social category.
We contribute to this literature by examining how to use “other” responses across three stages of the research process. We begin by reviewing research on responses to “other, describe”–type questions assessing respondents’ race, gender, and sexuality, common and important demographic questions that researchers are likely to encounter. We then present a flowchart of decision-making processes that can act as a roadmap for analysts during data collection, cleaning, and analysis. Next, using two case studies, one a pilot survey of perceptions of housework and one a screening survey for an interview study on discrimination, we illustrate decision making regarding “other, describe” data and discuss these decisions’ implications for knowledge production. Finally, we conclude with practical recommendations regarding flexibility, transparency, and reflexivity for analysts’ decision making. Methodologically, there are many principled ways to work with “other, describe,” rather than a single best practice, and we call for their recognition and use.
“Other” Race, Gender, and Sexuality Identities
Most people reproduce normative, categorical descriptors when identifying their race and ethnicity with open-ended text (Croll and Gerteis 2019). However, a small but important subset of respondents refuse or deny racial identification altogether. These respondents usually leave the text box blank, deny categorization with answers such as “decline” or “alien,” or offer general answers such as “American” or “human” (Croll and Gerteis 2019). Individuals who identify as white or nonwhite when given closed-ended racial identity options seem to be equally likely to refuse or deny racial categorization when given an open-ended response option (Croll and Gerteis 2019), but some evidence indicates that such responses are more common in contexts with fewer racial and ethnic minorities (Harris, Ravert, and Sullivan 2017). Social psychological identity theories suggest identities are being activated when someone responds sarcastically or defensively (Marshburn and Knowles 2018); these responses also indicate cultural sentiments such as identity salience, racial threat, and political ideology (Compton and Kaufman 2024; DeGroot and Carmack 2020).
One study on gender responses found that about half of write-in answers are recognizable transgender identities such as “gender fluid,” but the rest communicate confusion or rejection of the question (e.g., “cat” or “alien”; Saperstein and Westbrook 2021). Work also shows that “mischievous” (Robinson-Cimpian 2014) or “triggered” (Compton and Kaufman 2024) responders to these gender questions often provide untruthful responses to other survey questions. In a study on how to measure gender in surveys, Fraser (2018) recommended using “mischievous” and other bad-faith responses to identify and remove data that could lead to inaccurate conclusions. Fraser recommended recoding gender responses as missing if analysts do not want to omit entire cases. Although this approach addresses write-in responses, it also diminishes statistical power and introduces nonrandom missingness, which biases estimates.
There is less literature on open text in sexual orientation measures. One study on university students showed that the most common answers to an open-ended sexual orientation question are “heterosexual” and “queer,” with the remaining being recognizable identities such as “bisexual” and “asexual” (Scheffey et al. 2019). Another study of older lesbian and bisexual women showed that those who select “something else” for sexual identity still identify as “not straight” (Eliason et al. 2016). The authors concluded that respondents who provide open-text responses for sexuality may view this identity as fluid, dynamic, and difficult to capture using a single label.
The Present Study
Overall, there is no unified, legitimated best practice protocol for, or transparency into, “other, describe” race, gender, and sexuality answers during data collection, cleaning, and analysis. To address these methodological issues, we provide a roadmap for decision making regarding open-ended text responses to survey questions during three general stages of the research process. We then draw on two cases that illustrate decision making in action. Both examples highlight the implications of these decisions for knowledge production. We conclude with meta-practices scholars should keep in mind, given particular trade-offs in a given study. These guidelines can be used by instructors, researchers, reviewers and editors, and others seeking to produce, evaluate, and reproduce the multitude of scholarship in which open-ended responses to survey questions are a potential concern.
Decision Points during the Research Process
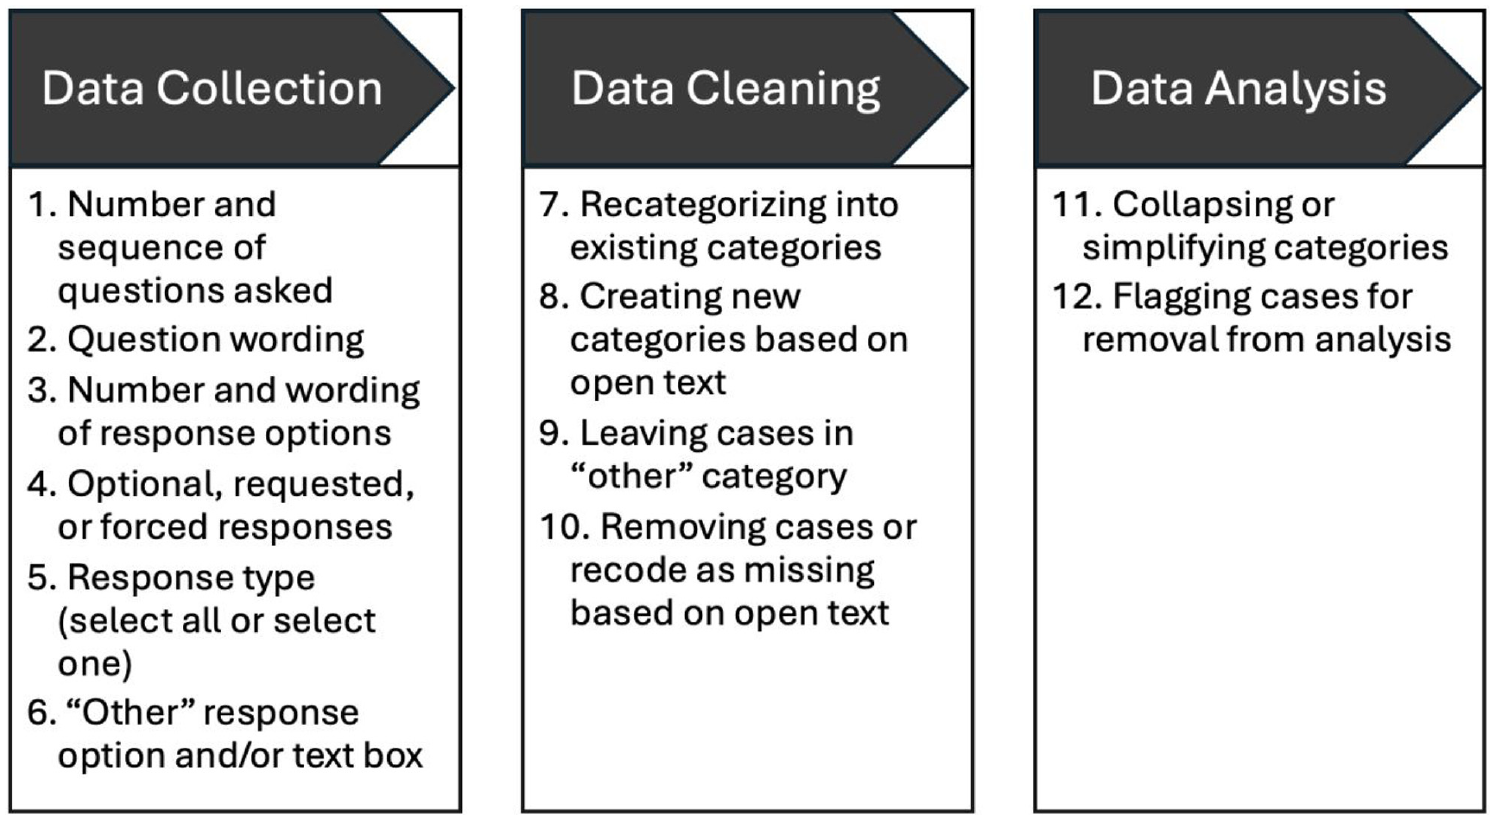
Our roadmap in Figure 1 proposes that decisions about “other, describe” must be considered during three general stages of the research process: (1) data collection and instrument development, (2) data cleaning, and (3) data analysis. Given the iterative nature of research, the order of and boundaries between these decision stages is blurry. Most analysts likely implicitly make these decisions as they step through the research process, or make them explicit in a methodological appendix, but researchers often go into a project without knowing a priori what types of decisions they could grapple with. By rendering these decisions visible, we (1) clarify what decisions to anticipate during data collection, cleaning, and analysis and (2) highlight the trade-offs involved in making these decisions. As we show, there is no one-size-fits-all answer to decisions about open-ended text responses.
Decision Roadmap for “Other, Describe” Decision Making.
Decisions that occur during the data collection and instrument development stage include (1) the number and sequence of questions asked to operationalize a construct (e.g., one-shot vs. two-step for race and ethnicity, gender and gender identity, sexuality and relationships); (2) question wording; (3) the number and wording of response options; (4) whether to require, request, or make it optional for respondents to answer; (5) the structure of response categories (e.g., mutually exclusive vs. select all that apply); and (6) whether to include a catch-all “other” answer category and whether to include a text box to self-describe.
Survey question construction (decisions 1 and 2), selection of closed-ended answer categories (decisions 3 and 5), and writing or programming the survey to allow respondents to skip questions versus requesting or requiring them to answer (decision 4) will likely shape how respondents use “other, describe” if researchers choose to include this option (decision 6). Researchers analyzing secondary data should still develop an awareness of decisions 1 to 6 by reading the codebook or other data source materials, as these decisions affect others downstream. For example, a single question assessing gender identity may lead to more “other” responses if respondents want to specify being transgender or cisgender. Using two questions, one for sex assigned at birth and another for current gender identity, could eliminate the need for the “other” option. Similarly, using unfamiliar language or incomplete response options can increase “other” responses, as can mandating a response when respondents prefer to withhold information. Likewise, preventing multiple-select options may lead to more “other” responses when individuals fit into multiple categories but can select only one (e.g., multiracial individuals limited to one race/ethnicity response).
Choosing to include “other, describe” (decision 6) increases inclusivity and can alert researchers to important social categories they did not initially consider. Yet it can also generate hard-to-interpret and even offensive answers, both of which may require the researcher’s time and resources. Still, excluding the “other, describe” option may force participants to select responses that do not accurately reflect their identities and experiences, which raises questions of measurement validity as well as ethical treatment of study participants.
If researchers include an “other, describe” answer category, a set of decisions must be made about categorization and recategorization during the data-cleaning stage: (7) whether to recategorize cases into predetermined, mutually exclusive categories even after allowing self-identification in a text box; (8) whether to create new categories on the basis of answers to “other, describe”; (9) whether to leave cases in an ambiguous catch-all “other” category; and (10) whether to remove cases or code answers as missing on the basis of “other, describe” responses.
Keeping a catch-all “other” category when constructing variables for analysis (decision 9) results in a conceptually heterogeneous category. Conclusions about the resulting group may be limited, as it is unclear whether respondents experience the social world similarly. Yet dropping these answers by coding them as “missing” or deleting cases (which happens when there are missing responses for any variable in a regression; decision 10) effectively throws data away and excludes individuals from further analysis or inclusion in the study. Another option may be recategorizing cases into predetermined categories (decision 7), although this is not always possible or straightforward and imposes the researchers’ criteria for regrouping people. Finally, deciding to include new categories on the basis of open-ended answers (decision 8) is a delicate balance: does each unique answer result in a new, separate category, or can cases be grouped together on reasonable grounds? Again, this highlights a tension between validity, research ethics, and cell size/power.
Once (re)categorization decisions have been made during data cleaning, a set of decisions about producing the analytic sample during the data analysis stage remains: (11) collapsing or simplifying categories for statistical analysis (i.e., for estimating interactions and predicted values, or increasing cell sizes or power) or for case selection or quotas (e.g., selecting interviewees or oversampling in survey data collection) and (12) flagging cases for removal from analysis (e.g., dropping offensive, “mischievous,” inattentive, or duplicate respondents).
Combining “other, describe” answers with other closed-ended answer categories (decision 11) flattens potentially important variation into a conceptually heterogeneous category but may boost cell sizes and power. Removing cases from analyses on the basis of “other, describe” responses (decision 12) discards data but may be justified if responses indicate inattention, a nonserious answer, or a duplicate response.
Researchers must consistently review their use of “other, describe” across all stages and measures, and recognize that logics of various measures and demographics will likely differ. Therefore, researchers may need to consider including “other, describe” as an answer option (decision 6), creating new categories (decision 9), and flagging cases for exclusion (decision 12) for each variable. Decisions made about “other, describe” for the race question will likely differ from decisions made about the sexuality question. Although different, these decision paths may be methodologically appropriate in application to each population. We now demonstrate our roadmap in action via two cases.
Decision Making in the Perceptions of Housework Pilot Survey and the Perceptions of Discrimination Study
Example 1: The Perceptions of Housework Pilot Survey
The first example comes from the first author’s Perceptions of Housework Pilot Survey (PHPS). PHPS was posted on the online platform Volunteer Science (Radford et al. 2016) and asked respondents to rate the perceived effortfulness, enjoyability, value to the household, and gender typing of cognitive and physical tasks across household chore domains (e.g., making a meal plan vs. cooking a meal, monitoring the laundry hamper vs. folding clothes). These data would permit a statistical test of whether cognitive tasks are rated differently than physical tasks, and whether tasks are rated differently across housework domains. By also assessing respondents’ background characteristics, PHPS researchers could statistically test if race, gender, sexuality, age, household composition, and experience of doing housework are associated with these ratings. This pilot aimed to test the instrument with a convenience sample of U.S. adults before fielding the final survey with a larger, nationally representative sample.
Example 2: The Perceptions of Discrimination Study
The second example draws on the second author’s Perceptions of Discrimination (POD) study. The aim of this mixed-methods project was to understand how people define different types of discrimination encountered in their lives. Given resource and time constraints, the target sample size was 40 interviewees. Because political views, age, gender, race/ethnicity, and education level affect how definitions are made, a simple demographic questionnaire was designed to select interviewees who represented diversity across those five dimensions. Dichotomizing the five dimensions of gender (man, woman), ethnoracial group (white, people of color), education (no college degree, college degree or higher), age (younger than 57 years, 57 years or older), and politics (liberal, conservative) led to 25 = 32 unique combinations, each filled by one interviewee. The eight remaining “wildcard” slots were filled with interviewees whose identities did not fit the simplified dichotomized categories: at least one interviewee who identified as nonbinary or gender diverse, one who identified as moderate politically, and one who identified as multiracial white (white and another race). Figure 2 depicts this sampling strategy. Study information was posted in 35 online groups specific to one major midwestern metropolitan area across two social media platforms. Interested individuals were directed to the demographic screening survey. Survey responses were used to select participants for an in-depth Zoom interview.
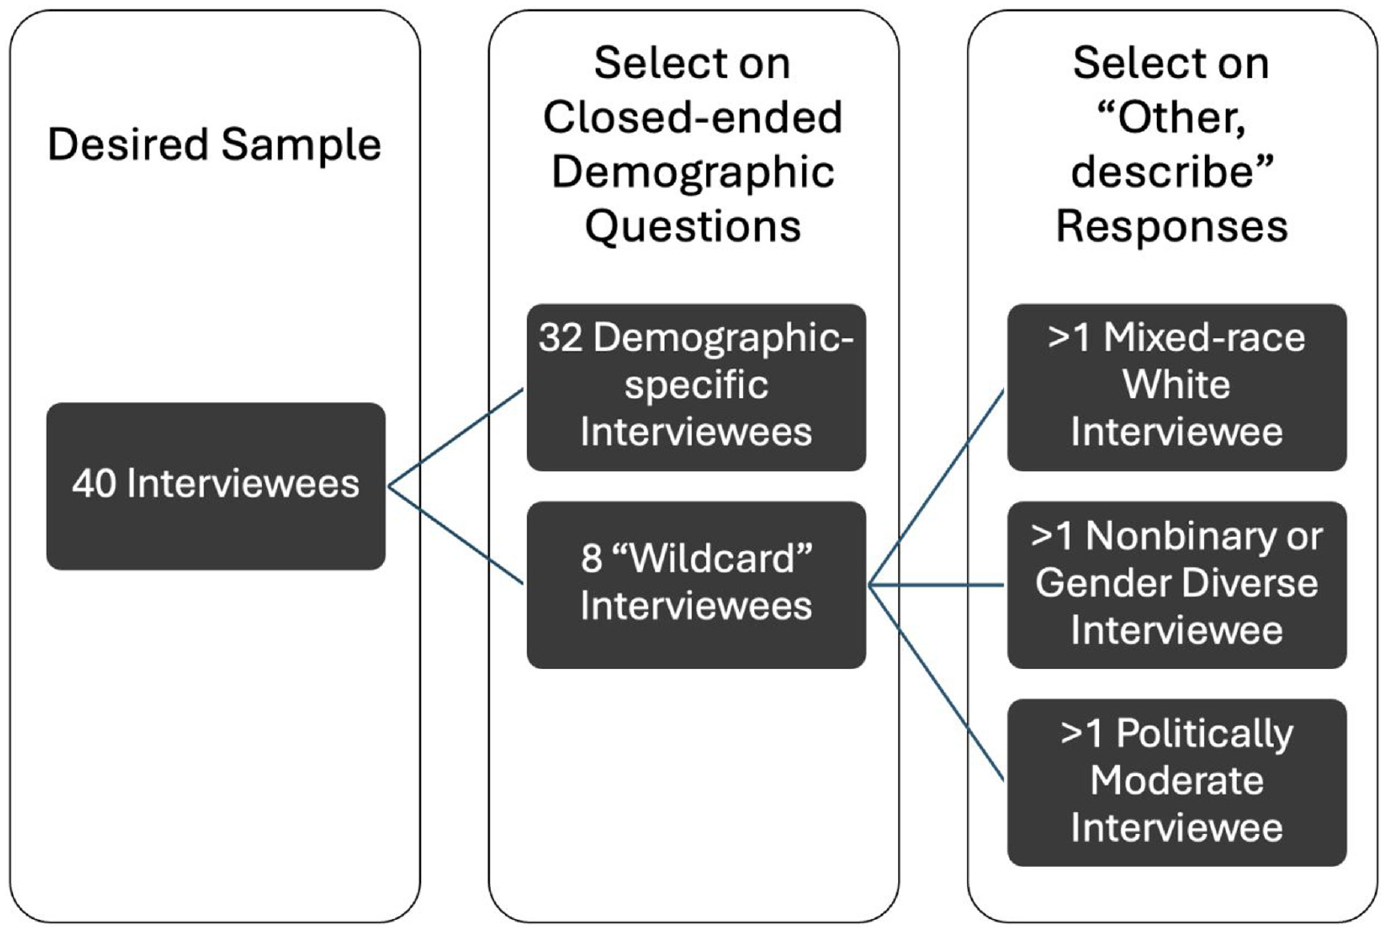
Perceptions of Discrimination Sampling Strategy and Selection on the Basis of “Other, Describe” Open Text.
Stage 1: Data Collection and Instrument Development
For decisions 1, 2, and 3 (the number and sequence of questions, their wording, and the number and wording of response options), the PHPS and POD studies drew on preexisting nationally representative surveys, namely, the General Social Survey (GSS) and the U.S. Census, to write demographic questions and closed-ended responses. Table 1 contains the survey questions and answer categories for both studies.
Race, Gender, and Sexuality Demographic Questions in the PHPS and the POD Study.
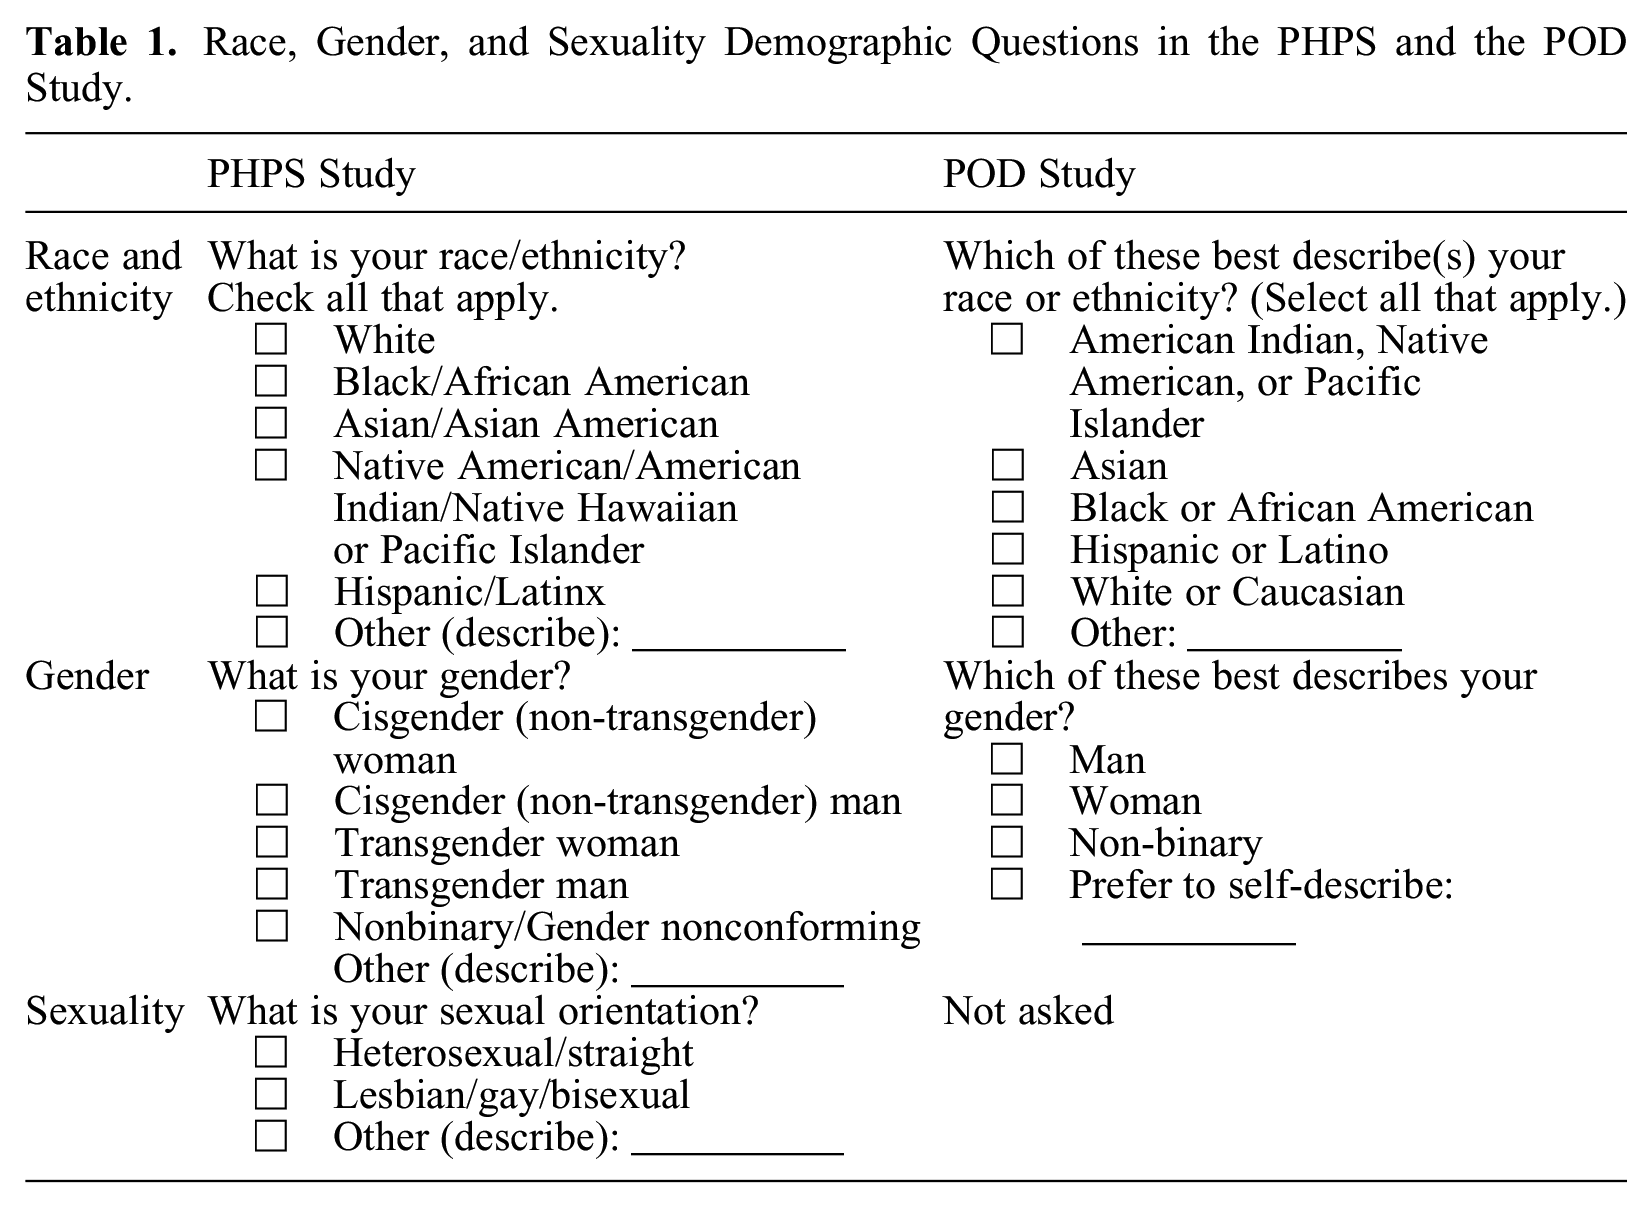
Race and ethnicity were combined into one question in PHPS following evidence that merging the two questions leads to a more reflective count of Hispanics (Strmic-Pawl, Jackson, and Garner 2018). Answer categories mirrored those in the U.S. Census as of 2022 (U.S. Census Bureau 2022), although “Native Hawaiian or Pacific Islander” was combined with other Native populations, as the PHPS team expected small cell sizes in these groups. Respondents could check all categories that applied. Likewise, the number, sequence, wording, and response options for the race/ethnicity question in the POD study were adapted from the U.S. Census. At the time of the studies, the U.S. Census Bureau (2022) recommended using a minimum of five race categories plus “some other race,” so both study teams thought this was a good starting point. Yet using preexisting U.S. Census questions meant that although respondents were likely familiar with these response options, not all groups were included (e.g., MENA individuals, a point we discuss in the subsequent section).
The PHPS team wrote the gender question to include categories beyond “man” and “woman.” To disrupt hierarchies of marked and unmarked categories (Compton, Meadow, and Schilt 2018), the “cisgender (non-transgender)” descriptor was added to parallel the “transgender” descriptor for the man and woman categories. Respondents could select one category to identify their gender. When writing this question, the PHPS team wanted to implement theoretical insights from queer and feminist scholars (Compton et al. 2018), yet they did not consult survey design literature to consider how question wording could influence participant responses. The National Academies of Sciences, Engineering, and Medicine (2022), for example, recommends a two-step measure assessing sex assigned at birth and current gender identity to capture transgender and cisgender identities. The use of “cisgender” in the PHPS answer options likely increased the use of “other, describe” (we discuss this further in Stage 2 below).
For the POD study, gender was adapted from the updated GSS question “Which of these best describes your gender?” with single-select options of “man,” “non-binary,” “woman,” and “prefer to self-describe” with a text box. The phrase “prefer to self-describe” was used to avoid the word other, which may make binary gender identities seem normal or the default. The POD study’s decision to use a single gender identity question meant the researchers were unable to capture cisgender and transgender identities unless a respondent chose to indicate this in the “prefer to self-describe” option, which none did. The decision to use categories of “man” and “woman” was deliberate to capture gender rather than sex assigned at birth; because a “non-binary” option was included, the study was able to include several individuals with this gender identity in the interview phase.
The PHPS team modeled the sexuality question on the GSS question but combined “bisexual” with “lesbian” and “gay” because they ultimately wanted to analyze a single LGBQ+ category. Respondents could select one category to identify their sexuality. The PHPS team’s decision to use a single LGBQ+ category may have been reasonable and efficient, but we will discuss how this decision created further issues to consider in Stage 3. The POD screening survey did not contain sexuality questions, because the researchers did not expect this dimension to shape their findings and consequently did not use sexuality in their quota sampling strategy.
These Stage 1 decisions highlight a tension between using federal minimums or replicating other surveys versus writing new questions from scratch. By modeling these questions on existing ones from well-regarded surveys, both teams streamlined thinking through decision points in the data collection and instrument development stage. The researchers also implicitly anticipated pressure from reviewers to use established or broadly used measures, thereby avoiding the need to defend the validity and reliability of novel ones. Yet taking this path potentially produced lower quality data, as it replicated assumptions embedded in existing survey questions. For example, using 2022 U.S. Census minimum categories excluded “Middle Eastern/North African (MENA)” as an answer to the race question, despite evidence that this option should be included (Maghbouleh et al. 2022)—and it now will be (Marks, Jones, and Battle 2024). As we show, this decision had implications for later decisions and revealed to the researchers that going beyond the minimum could be empirically appropriate as well as ethical.
The selection, wording, and structure of response options across these questions were also inconsistent in how they balanced research concerns against the ethical treatment of study participants. For instance, in PHPS, the race question included six predetermined options and allowed participants to check all that apply to increase inclusivity. The sexuality question, however, preemptively grouped “bisexual,” “lesbian,” and “gay” into a single answer category because the PHPS team anticipated small cell sizes and assumed (likely reasonably) that they would have to analyze these groups together. This choice highlights a trade-off in which researchers often seek to prevent small cell sizes but consequently box different people into a single category. In retrospect, it would not have made the analysts’ work more difficult to separate these categories to increase inclusivity. There were no other barriers to expanding the answer options: the Qualtrics survey platform did not prevent the researchers from offering separate categories; respondents would probably not be overwhelmed by additional options; and including these categories separately would be unlikely to trigger heterosexual respondents, as acceptance of LGB people has increased. Finally, given gendered meanings of housework across heterosexual, lesbian, and gay couples (Goldberg 2013), this project on perceptions of housework may have benefited from separating these groups out or by also asking the gender of the respondent’s partner.
For decision 4 (whether to require, request, or make a response optional), the PHPS team used the Qualtrics default: responding to race, gender, and sexuality questions was optional. This decision was an artifact of programming the survey and not deliberate, so the team lost responses (likely nonrandomly) when some participants skipped the questions. In the future, the team could request or require answers to boost sample sizes during the analysis stage. The POD team required a response to the race/ethnicity and gender questions, as they were expected to shape the outcome of interest, and nonresponse would preclude selection into the subsequent interview study. Requiring a response led at least one participant (“Nick,” discussed below) to select “other.”
For decision 5 (whether to allow multiple selections or force a single selection of a mutually exclusive response), the teams took different routes depending on the question. For race, both teams chose to allow multiple response selection to prevent multiracial respondents from answering inaccurately or attriting. For the POD team, this was driven by a focus on race in capturing two analytic categories of individuals (white people and people of color) as part of their case selection strategy. Both teams opted to force-require a single answer option for gender, as did the PHPS study for sexuality. This choice was rooted in an assumption that these categories were mutually exclusive, which in some cases may be problematic.
Finally, for decision 6 (whether to include an “other” response option, and whether to include a text box to allow respondents to self-describe), both teams chose to include such options for all questions. The PHPS researchers believed “other, describe” would capture residual answers if respondents took issue with the categories provided. This decision reveals the team’s expectation of participant pushback or noncompliance and suggests that rephrasing “other, describe” to something like “prefer to self-describe” would be more accommodating to respondents. In the POD study, three interviewees selected the “other” box for race, and their inclusion in the study was important for various reasons: if the “other” box had not been included, MENA participants may not have completed the survey or may have selected “white” even though it is not how they identify.
Stage 2: Data Cleaning
For decisions 7 to 10 (whether to recategorize cases into a predetermined, mutually exclusive category; create a new category; leave them in the “other” category; and remove cases or code items as missing), the PHPS and POD teams took different approaches matching their respective study goals. The PHPS team expected that few people would use the open-ended text boxes for race, gender, and sexuality because prior studies indicate they are sparsely used during demographic data collection (Harris et al. 2017; Lagos and Compton 2021). However, a number of cases required deliberate decision making during data cleaning: 24 respondents used “other, describe” for race (3.6 percent of 658 responses), 25 used this option for gender (3.8 percent of 654 responses), and 20 used the open-ended text box for sexuality (3.1 percent of 654 responses).
The POD study used the screening survey to select interviewees, rather than as a stand-alone source of data. This team mostly used “other, describe” answers to choose interviewees to fill the eight wildcard slots for those who identify outside the dichotomous categories for gender, ethnoracial group, education, and politics (e.g., politically moderate, mixed-race white). For POD, three individuals who selected “other” for their race presented information during their interviews that led the researchers to recategorize their race/ethnicity, as discussed below.
Straightforward Recategorization Decisions
In some cases, the teams felt that they had sufficient information to recategorize respondents into preexisting race, gender, or sexuality categories (decision 7). In PHPS, recategorizing race was relatively straightforward when people gave answers such as “African” or “Thai people” (3 of 24 cases). These were considered geographic ethnicities (Harris et al. 2017) that arguably map onto preexisting categories such as “Black/African American” and “Asian/Asian American,” respectively. This decision imposed the researcher’s understanding of race onto the respondents (e.g., that the “African” person is “Black/African American” despite the possibility they may be “White South African”), but perhaps avoided leaving them in the ambiguous “other” race category or not using them at all.
Regarding gender, 20 of the 25 PHPS respondents who used “other, describe” were easily recategorized into preexisting categories. Answers such as “female” and “A woman. Nothing else” (n = 8) were straightforwardly recategorized into “cisgender (non-transgender) woman.” Answers such as “male” and “XY” (n = 12) were recategorized into “cisgender (non-transgender) man.” It is possible these respondents were unfamiliar with the “cisgender” terminology, thus prompting them to clarify their gender identity in the “other, describe” box. Again, these seemingly straightforward decisions imposed the researcher’s assumptions about gender onto the respondents, for example, by presuming that “A woman. Nothing else” meant the respondent was a cisgender woman rather than a transgender person who does not claim the term transgender. Of 20 respondents who used “other, describe” for sexuality, 11 listed identities that could be considered “LGBQ+” (e.g., “asexual,” “demisexual,” “queer”) and were recategorized as such.
In the POD study, participants offered information during the interviews that allowed the researchers to confidently recategorize their race/ethnicity from “other” to something more specific. One interviewee, Nick, selected “white” and “other” in the screening survey but made no reference to his race throughout the interview. At the end of the interview, the interviewer asked Nick directly about how he identifies:
I did want to just double check with you before I let you go. I noticed on your survey response that when you’re filling out the race question you checked the white and other race [box], but you didn’t fill in the box [to explain]. And sometimes people like to write in another race, like Middle Eastern or whatever, so I just want to know what the best way is for us to describe you, or to you know, think about you, in terms of your race?
I just don’t like answering this question so. There wasn’t an “opt out” option.
I see okay, so as a protest vote, basically, for the question.
Normally I don’t share that information, but white would be appropriate in this case.
The POD team recategorized Nick as “white” for the purposes of quota sampling and reporting descriptive statistics. Nick’s use of “other, describe” led to him occupy a wild-card slot, as the white quota for his specific age, gender, education, and political category had already been filled. Nevertheless, his aversion to responding to the race question by checking “other, describe” alerted the researchers to a similar pattern in at least three other (self-identified white) interviewees. The POD researchers concluded that this pattern indicates an “antilabel” sentiment in which some individuals view the naming of demographic categories, as well as using terms such as “racism” and “sexism,” as discriminatory in and of itself.
Creating New Categories
In two scenarios, it was clear both teams needed new categories based on the “other, describe” responses (decision 8). Both teams noted several individuals whose supplemental data revealed that a MENA category would more accurately describe their ethnoracial identity. In PHPS, five respondents wrote “Middle Eastern” or “MENA” (three of whom indicated “white” also). In the POD study, two interviewees (both of whom selected only “other” as their race) offered more information about their ethnoracial identities when discussing their experiences with racism. One interviewee, Rachel, responded to an interviewer’s question:
Do you have any of your own personal experience that you’d like to share, totally up to you, but about racist situations that have occurred or things that have happened to you that you or other people thought were racist?
I don’t know if it counts as racism or not. So, I’m Jewish. There’ve been times when I thought. . . . Yeah, I had an instructor who made a comment about Jews. I was livid. Something along the lines, “oh, you know how they are.” I’m like, “no I don’t know how they are.” Excuse me. That was flat out really obvious. That’s not common.
During the interview, Rachel also indicated she was born in Israel. Another interviewee, Arya, responded to a question about racism happening to people as follows:
What about a time that something racist happened to someone you know?
Well, a lot of my co-workers know that I’m Arab and I use that a lot of times when I introduce myself . . . within one day three people separately came up to me and said “happy Ramadan” because they assumed that I was Muslim. And I—is that racist? It felt racist to me because they were stereotyping me as Muslim because they knew that I was Arab. But in fact my family is of a minority, and we are Christian Arabs, and so I was raised in an Orthodox Church. I was baptized. . . . The Church has been around longer than the Catholic Church, it’s been around for a really long time. The fact that still to this day, people are like, “oh happy Ramadan, you’re Arab so you must be Muslim,” and granted the majority of Arabs are Muslim, so it’s an understandable stereotype, but nobody took the time to even ask. They just assumed like, “oh, it’s Ramadan, so happy Ramadan [name]” and it’s like, “not quite, Merry Christmas I guess.”
The POD team agreed that Rachel and Arya were best categorized as MENA, given the emergence of this identity in scholarly and public awareness (Maghbouleh et al. 2022), and had thus been correctly categorized into the “people of color” dichotomy for quota sampling. Rachel’s and Arya’s use of “other, describe” and their subsequent recategorization led the team to include MENA individuals in the nonwhite quota, which was important given this group’s unique experience with racism (i.e., how it intersects with discrimination based on religion).
The PHPS team recognized they needed a “multiracial” category for analyzing racial differences in housework perceptions. Open-ended answers such as “mixed” and “mixed White/Latina” (n = 2), combined with 22 respondents who selected multiple preexisting categories, motivated this decision. These “other, describe” responses pointed to relevant terminology and a salient identity among respondents. Creating a “multiracial” category made sense given this population’s growth (Jones et al. 2021) and status as a conceptually unique racial group. Yet grouping multiracial people may not always make sense. For example, the resulting category in PHPS contained people who selected multiple predetermined identities and those who explicitly identified with the term mixed. Furthermore, experiences and opinions of multiracial Black people may differ from those who identify as white and Asian, for instance, given the unique contours of anti-Black versus anti-Asian racism in the United States. Ultimately, PHPS researchers prioritized having a sufficiently large “multiracial” group for statistical analysis over several smaller, but more conceptually coherent, categories.
Complex Recategorization and Category Creation Decisions
Recategorizing and generating new categories on the basis of “other, describe” answers (decisions 7 and 8) is not always straightforward. The following examples underscore the need to engage in reflexivity during Stage 2 of the research process, as complex categorization decisions can reveal researchers’ biases and show them how to improve survey questions to better reflect respondents’ lived experiences.
In PHPS, three respondents checked “white” and wrote “Jewish” as their “other” racial identity. Although these respondents could be considered “multiracial” because they checked multiple boxes, the researchers opted to recategorize them as “white.” The PHPS team drew on prior research suggesting cultural overlap between Jewish and white identities (Davenport 2016) to make this categorization decision. This differed from the POD team’s decision about the Israeli Jewish participant Rachel, highlighting that there is no single right choice for using “other, describe” data. Because of the POD study’s focus on discrimination, it was important for Rachel to be categorized as nonwhite, but this logic may not apply to a study of housework perceptions.
For sexuality in PHPS, one respondent wrote “unknown” and another wrote “celibate.” The researchers interpreted “unknown” to be like “questioning” one’s sexuality and “celibate” as similar to “asexual.” They grouped both cases in the LGBQ+ category. Other interpretations were certainly possible. For instance, “celibate” may reflect sexual behavior due to religious beliefs and be distinct from a queer sexual identity (Laumann et al. 1994). Or this answer could be “mischievous” (Robinson-Cimpian 2014) given this respondent’s answer of “human race” for race. Two respondents wrote “normal” and “true north” and were recategorized as “heterosexual/straight,” because heteronormativity constructs heterosexuality as the “default” sexuality (Robinson 2016). Recategorizing these respondents potentially improved measurement of the LGBQ+ category and therefore the validity of conclusions resulting from analyses of this smaller group. Yet all four cases could have been kept in the “other” category instead of recategorized, because respondents may earnestly identify their sexuality as “unknown,” “celibate,” “normal,” or “true north” and not belong in any of the researchers’ predetermined categories.
Deciding to leave respondents in the “other” category also comes with challenges (decision 9). The POD team (re)categorized all three “other” race–selecting interviewees and thus did not leave any in the “other” category. The PHPS team left several cases in this category after recategorization into preexisting or new race, gender, and sexuality categories proved difficult. For instance, there were multiple possible categorization options for one person who used “other” to describe themselves as “AfroMexican.” The team did not want to create a new “AfroMexican” category with n = 1, so they could either recategorize the respondent as “multiracial” or leave them in “other.” “Multiracial” would override the respondent’s self-identification as “other,” but leaving them in the “other” category would result in a heterogeneous group that may not have similar experiences. The team opted to leave the respondent in “other” because of indecision.
Recategorization was also more complicated when PHPS respondents did not offer enough information for researchers to justify regrouping them. Some gave answers to the race question that Croll and Gerteis (2019) might consider “denials” (“It’s a secret” [n = 1] or “American” [n = 3]) or “generalizations” (“human race” [n = 1]), and others wrote nothing (n = 2). Racial refusers, generalizers, and answer avoiders may differ systematically from people who offer a more widely recognizable racial identity, but these cases were ultimately left in “other.”
Respondents who said their gender was “normal” (n = 2), left the text box blank (n = 1), or wrote “I live alone” (n = 1) were also left as “other” because the PHPS researchers could not confidently map these respondents’ answers to the predetermined gender categories. The two “normal” responses and one blank could have been the best way for these respondents to describe their gender given the limited categories offered in the survey question. But it is also possible the three gender question “rejecters” (Saperstein and Westbrook 2021) and the respondent who was perhaps not paying attention differed from the one person who used “other, describe” to identify as “queer.” Still, the team did not want to override the queer respondent’s choice of “other” and recategorize them into another gender category such as “nonbinary/gender nonconforming,” nor could a new “queer” category with n = 1 be used in statistical testing.
Two PHPS respondents left the sexuality text box blank and another two were denials (e.g., “none of your business pervert”). Consistent with decisions made for race and gender, these four cases were left as “other” because the team could not theoretically motivate regrouping these respondents as “heterosexual/straight” or “LGBQ+.” These examples show that researchers cannot always confidently recategorize cases into predetermined groups chosen for their specific research purposes. Yet researchers should acknowledge they are not final authorities on respondents’ identities and have to trust, by the logic of the survey, that these cases are an “other” race, gender, or sexuality.
Finally, some “other” responses led the PHPS team to consider case deletion at the data-cleaning stage (decision 10). Responses indicating denial, avoidance, or generalizations in race, gender, and sexuality questions were flagged for potential removal. Some researchers assume such answers indicate pushback or a cultural sentiment alert (Marshburn and Knowles 2018), so it was possible these respondents did not provide earnest answers, and therefore did not contribute high-quality data, in other parts of the survey. Likewise, text indicating irritation (Hadler et al. 2022) prompted flagging for potential removal, such as this participant’s response for gender:
Look . . . I am a man. A gay man. That’s been good enough for me for half a century. I don’t need to be a cis, a gender, or a sissy, of [sic] binary. I’m male of the species. Functioning penis. Beautifual [sic] Korean boyfriend who is also a man with a penis. We do fun things with out [sic] penises. Yet, somehow, I’m the one who ends up changing the lightbulbs. Haha.
Men gave such answers more frequently than women did and seemed triggered by the terms cisgender and non-transgender. When women used “other, describe” to identify their gender, it seemed to stem from being unfamiliar with cisgender and transgender terminology (e.g., “Just a plain old woman. Female type”), although answers such as “real female” could also represent antitransgender sentiment. The researchers flagged men’s disgruntled responses for potential removal, but not women’s, because women’s responses did not unequivocally indicate a cultural sentiment alert (Marshburn and Knowles 2018).
Similarly, respondents who left the text box blank were not flagged for potential removal simply because there was no information about respondents’ intent. Only two other cases were flagged for removal from the data set: the person who wrote “I live alone” in response to the gender question, who was interpreted as an inattentive survey taker, and one case that was determined to be a duplicate on the basis of their pattern of closed-ended and open-ended demographic responses.
Ultimately, the PHPS researchers opted against dropping cases or coding answers as missing at this stage. Deleting cases could alter the makeup of the sample, as men more frequently wrote disgruntled text than women, which would affect later statistical tests of gender differences in perceptions of housework. More broadly, deleting irritated cases removes respondents’ voices, raising ethical questions of inclusivity, and precludes analyses of how pushback may relate to a study’s substantive interests (e.g., do individuals triggered by transgender and cisgender terminology have stronger views of housework gender typing?). By flagging cases during the data-cleaning stage, deletion could be done later during the analysis stage as a robustness check.
Stage 3: Data Analysis
After cleaning the data, these categories were used in statistical modeling in PHPS and quota sampling in the POD study. The researchers thus had very different analysis decisions to consider. For the PHPS team, statistical analyses created several choices related to decision 11 (collapsing or simplifying categories). The team decided to collapse all non–“white only” racial identities, including “other,” for two reasons. Empirically, creating a “white only”/non–“white only” dichotomy could increase cell sizes and statistical power; and theoretically, white Americans experience privileges that others, including mixed-race white people, do not (Bonilla-Silva 2004). In some ways, this decision made Stage 2 (data cleaning) recategorization decisions irrelevant. Deciding to group respondents who may have very different views of housework muddied the conclusions that could be drawn about all non–“white only” people and those who use “other, describe.”
The PHPS researchers made a similar decision about gender and created a three-category variable with “cisgender (non-transgender) woman,” “cisgender (non-transgender) man,” and a combined “transgender/nonbinary/gender nonconforming/other” category. Alternatively, the team could have created this analytic variable by dropping respondents in the “other” category, rather than grouping them with gender-expansive respondents. This choice may have made more conceptual sense, as respondents in the “other” category may differ from those with more widely-used gender-expansive identity labels. Yet another way to create this analytic variable would be to create a cisgender man/noncisgender man dichotomy, because gender expectations of cisgender men, specifically, exclude the performance of feminized housework tasks (Davis and Greenstein 2009). The team also decided to make a binary gender variable that dropped all noncisgender respondents and those in the “other” category. Excluding data from analysis was not ideal, but this choice was motivated by a concern that grouping binary-identified transgender and nonbinary or nonconforming people was conceptually inappropriate (Garrison 2018) given the deeply gendered nature of housework.
As described above, queer sexualities were grouped together at the instrument development stage, precluding separate analyses of lesbian, gay, and bisexual respondents. The very small sample of respondents in the “other” sexuality category could have been dropped, but the researchers decided to group them with other nonheterosexual participants. If heterosexuality and gender are co-constructed (e.g., heterosexuality presumes “two” “opposite” genders “naturally” suited to separate spheres; Ward and Schneider 2009), heterosexual respondents may have distinct opinions about gendered housework tasks. This decision potentially limited the conclusions that could be made about respondents in the nonheterosexual group. Figure 3 illustrates how the “cleaned” demographic variables were collapsed for analysis in PHPS.
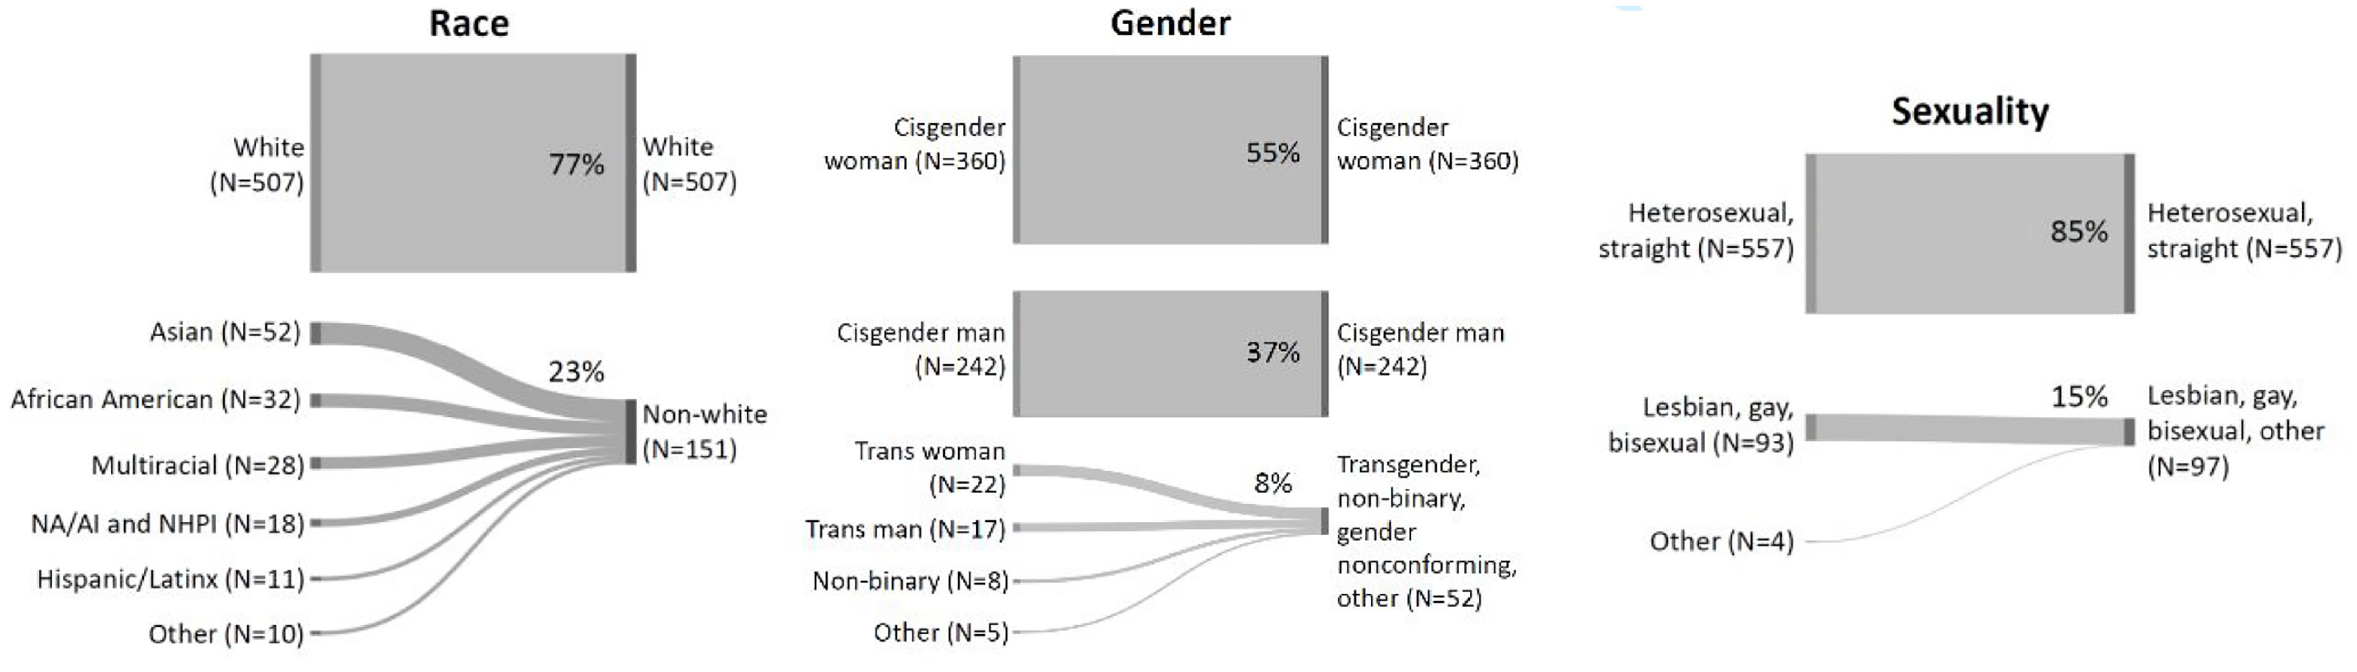
Creating Analytic Variables for Race, Gender, and Sexuality in the Perceptions of Housework Pilot Survey.
The POD team used demographic survey responses to select interviewees to fill interview sample quotas. Quotas were produced by the combination of the dichotomy of each of the five dimensions of gender, race, age, education, and political views. Thus, the team did not include any gender nonbinary individuals or political moderates in the first 32 quota slots. Eight wildcard slots allowed the researchers to select such individuals, as well as anyone who used “other, describe” for race/ethnicity or gender, for an interview.
Both studies made decisions to collapse and simplify categories containing “other” respondents at the data analysis stage. In PHPS, this was driven by statistical power concerns, particularly the ability to detect interaction effects and avoid making type 2 errors. Across race, gender, and sexuality, the prioritization of statistical power to avoid critiques from potential reviewers guided analytic decisions, but statistically testing for differences is not the only way to produce knowledge. Although not normative in quantitative sociology, describing survey responses without statistical tests across each race, gender, and sexuality group, regardless of sample size, could still be instructive. Nevertheless, researchers must recognize that patterns they see descriptively in the data may be due to chance. In POD, collapsing categories was driven by resource and time limitations: the team could not conduct in-depth interviews with all 1,378 respondents. Researchers must weigh trade-offs such as whether it is a greater threat to a study’s validity to lump potentially heterogeneous groups together under the umbrella of “nonwhite” (PHPS) or “people of color” (POD), for example, or whether the greater threat is in omitting some of those groups from the data, analysis, and findings altogether (e.g., excluding “other” race respondents from the POD interviews would have excluded MENA individuals from a study about racial discrimination).
This point relates to decisions in PHPS to remove problematic cases from analysis on the basis of their “other, describe” responses as a robustness check (decision 12; none were removed from POD). Disgruntled respondents (n = 11), inattentive participants (n = 1), and duplicates (n = 1) were excluded from descriptive statistical analyses to see whether the findings would change without respondents who were perhaps not taking the rest of the survey seriously and not providing earnest survey answers (see Table 2).
Cases Removed from Analysis as a Robustness Check in the Perceptions of Housework Pilot Survey.
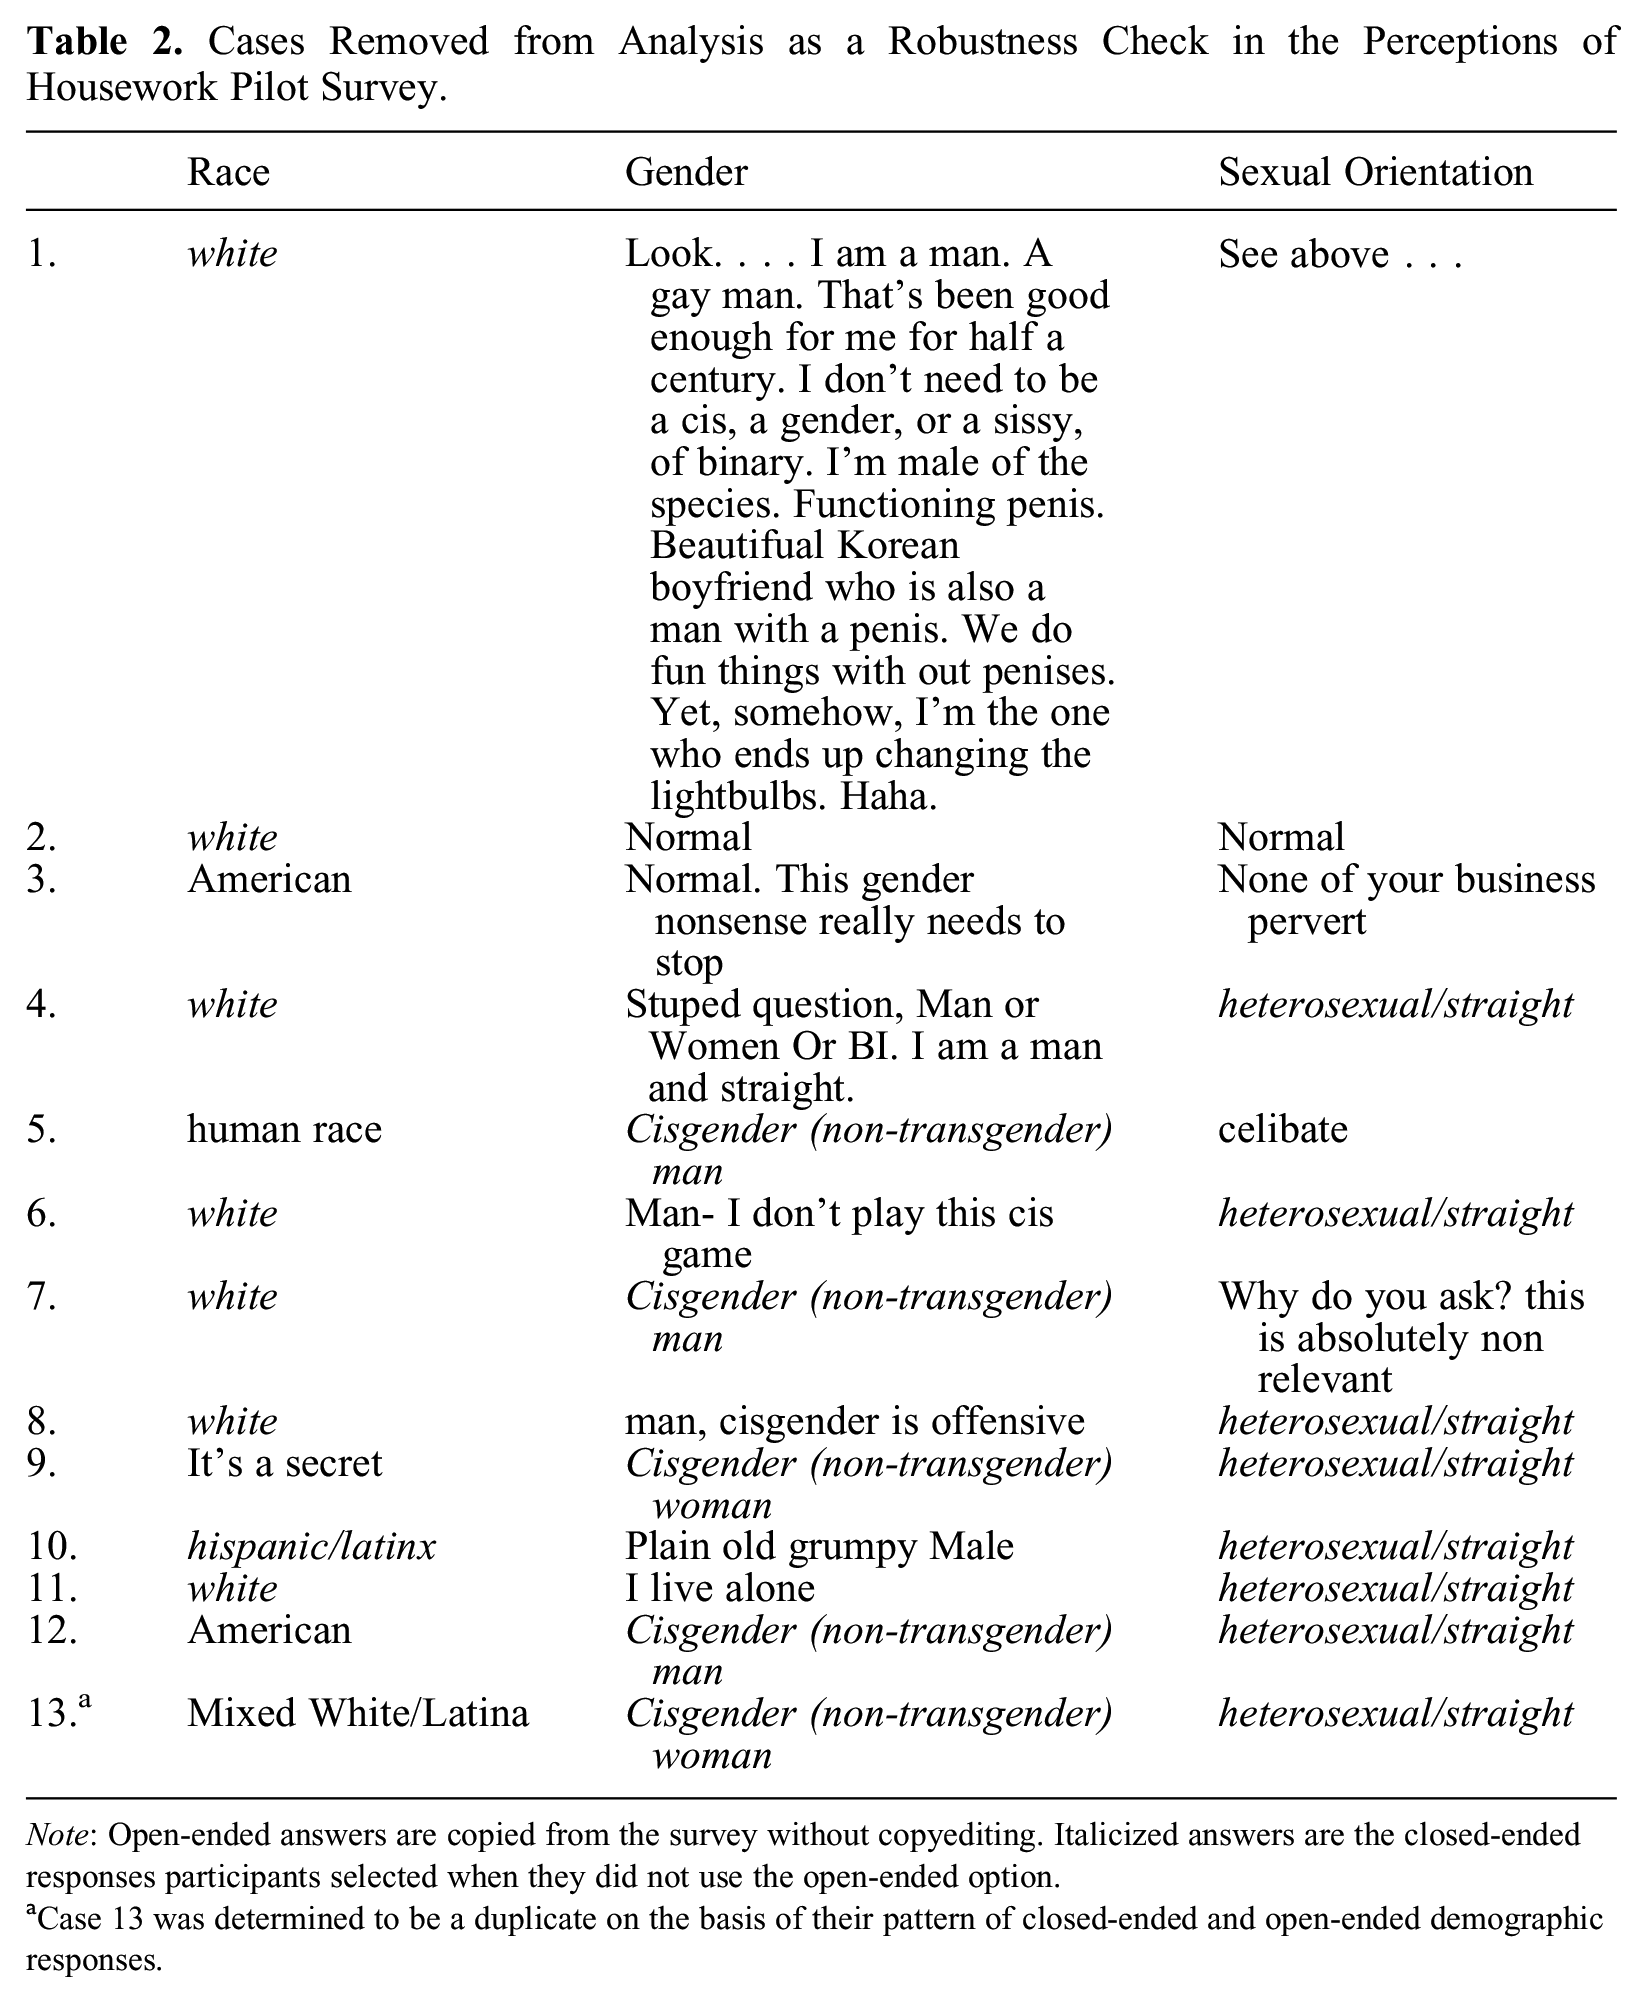
Note: Open-ended answers are copied from the survey without copyediting. Italicized answers are the closed-ended responses participants selected when they did not use the open-ended option.
Case 13 was determined to be a duplicate on the basis of their pattern of closed-ended and open-ended demographic responses.
Tabulating respondents’ perceptions of housework with and then without flagged cases produced seven changes in the overall answer distributions out of 150 housework questions (4.7 percent). Many cases removed during robustness checks were white, heterosexual, and/or cisgender men. Upon reflection, removing white, heterosexual, and/or cisgender men’s data during robustness checks amplified nonwhite, queer, and/or cisgender women’s opinions, perhaps reinforcing perceptions that the latter groups are most knowledgeable about housework and the former more privileged groups’ opinions are irrelevant. Their exclusion limits our ability to learn how people who are not typically expected to do housework perceive this unpaid domestic labor.
Discussion and Conclusions
Overall, both studies were able to draw sensical conclusions from “other, describe” data after stepping through multiple decisions during data collection and instrument development, data cleaning, and case selection and data analysis. PHPS researchers recategorized most participants who used “other, describe” to identify their race, gender, and sexuality, and are beginning to detect variability in people’s perceptions of housework (e.g., cisgender women consistently rate household chores as more effortful and less enjoyable than do others). The POD team interviewed all three people who used the “other, describe” option for race, allowing them to learn about unique experiences of racism among MENA participants and to discover a pattern among white participants in which naming demographic categories and using terms such as “racism” and “sexism” are considered discriminatory in and of itself.
For decisions 1, 2, and 3 (number, wording, and order of questions and response options) in the data collection and instrument development stage, both the PHPS and POD teams relied on the U.S. Census and GSS for demographic questions. These surveys are used as models because of their consistency in measuring attitudes and behaviors (Cowan, Hout, and Perrett 2024), but researchers should understand their assumptions and measurement selection processes, including how slow and conservative the Census and GSS may be regarding instrumentation change (Humes and Hogan 2009).
Stepping through decisions 7 and 8 (recategorizing and including new categories) during the data-cleaning stage generated substantive knowledge about “other, describe” identities. That PHPS researchers recategorized Jewish individuals as white whereas POD researchers did not underscores the idea that the construction of whiteness is unstable (Omi and Winant 2014; Sasson-Levy 2013). Methodologically, the different recategorization decisions across the two studies suggest data-cleaning choices may ultimately depend on the goals of the individual study. For PHPS, it was unclear whether “white only” and “white and Jewish” respondents would differ in their perceptions of housework, so putting the three Jewish individuals in the “white” category may have been defensible. However, by treating Jewish individuals as nonwhite, POD researchers were better able to identify experiences of racialized discrimination on the basis of religion. Grouping people on the basis of theoretical grounds that apply to a particular study makes sense.
Other important substantive knowledge that came from cleaning “other, describe” data included the pattern in which advantaged social groups use open text to express protest. In PHPS, men gave irritated answers more frequently than did women in response to the gender question, which is consistent with a recent German study showing men’s greater irritation regarding sex and gender questions (Hadler et al. 2022). In the POD study, white respondents used “other, describe” as an antilabel to resist demographic categories, which they perceived as discriminatory. As a result, a disproportionate number of cases removed during robustness checks in PHPS were white, cisgender men, and/or heterosexual. Researchers should be prepared for some respondents to give disgruntled responses to questions that researchers may deem harmless. This pattern also raises questions about how to write surveys that recognize marginalized identities without angering others and losing an opportunity to collect data from them.
Finally, decision 11 (whether to collapse categories for statistical analysis or quota sampling) reveals that using “other, describe” as its own analytic category can be challenging because of cell size concerns in statistical research and resource constraints in qualitative research. Grouping “other, describe” with other analytic groups may be desirable if the priorities are inclusivity and using as much of the available data as possible, although the trade-off is a conceptually heterogeneous analytic category and fundamentally mislabeling people (Guyan 2022). Excluding “other, describe” cases can be the right thing to do if analysts need to make claims about clearly defined groups, but this trade-off means discarding data and hindering inductive knowledge generation.
The logics and processes outlined here provide a few more general lessons to researchers working with open-ended “other, describe”–type responses. Open-ended “other” responses provide important context for the data—revealing, for instance, cultural jargon, that a case is a duplicate, or that inattention indicates poor data quality or survey design issues. By closely examining each “other, describe” case, analysts can make internally consistent decisions about how to proceed with these data. We show that collecting and analyzing “other, describe” data involves many deceptively simple steps that require deliberation and have critical implications for the sample, analysis, and conclusions of any study.
The PHPS and POD studies also demonstrate the utility of conducting a pilot study (Smith 2019) and using cognitive interviews (Beatty and Willis 2007) during Stage 1 (data collection and instrument development), respectively. These tools not only enable reliability and validity checks, but they give researchers the flexibility to tailor instruments to better address the research question. Pilot studies provide a starting point for molding standard questions on the basis of initial responses. Cognitive interviews, particularly with respondents who used “other, describe” in the pilot, can illuminate problems with survey questions and response options. We strongly recommend these survey design strategies so researchers can observe how respondents may interact with their instrument and anticipate how and how much they will need to process the data. These strategies are also useful for catching internalized bias and rendering implicit decisions more visible.
In all stages of research and especially in Stages 2 (data cleaning) and 3 (data analysis), we suggest three meta-practices analysts should engage when working with “other, describe.” Analysts should be flexible regarding these decision points. Social categories constantly change, both in how individuals use terms and identify and in how researchers and institutions gather these data. The case studies discussed here focused on open-ended responses to race, gender, and sexuality questions, but these suggestions would work with other open-ended response questions.
Analysts should also be transparent about their decision points. Studies rarely explain how they structured their survey questions and response options, how they (re)categorized individuals who selected “other” for any of these questions, and whether such individuals are missing, included, or combined with other categories for the analysis. Researchers, editors, and reviewers should expect clarity about these decisions and their implications for the findings. Including this information in online appendices for journal articles could be appropriate. No single set of decisions fits all studies perfectly, and every decision involves trade-offs. Therefore, analysts should explain why their choices are appropriate for their study and openly discuss how these decisions affect their conclusions.
Finally, analysts should be reflexive about these decision points, meaning they should reflect on their choices and recognize how their assumptions may influence decision making. Often it is not clear how a particular decision affects a study until after that particular research stage, or the entire study, is complete. By considering how choices about “other” categories affect results, scholars can improve and better determine if alternative decisions might have yielded more valid, reliable, and ethical conclusions (for additional detailed guidance on reflexivity in quantitative research, see Jamieson, Govaart, and Pownall 2023).
We suggest that instructors, research supervisors, institutional review board members, and peer referees assessing projects for funding and publication use our roadmap to support researchers’ engagement with inclusivity, flexibility, transparency, and reflexivity. All actors in the research process can assess whether surveys include “other, describe” boxes; whether justifications for their inclusion/exclusion are empirically sound and ethical; whether researchers describe how they processed “other, describe” data; and whether scholars discuss alternative decisions and the implications of their choices for their findings.
Footnotes
Acknowledgements
We would like to thank Ariane Ophir and Meredith Slopen for their input when this article was just an idea. We thank Philip Cohen and Brian Powell for providing feedback on the first complete draft of our manuscript. Finally, we thank the participants at our 2023 American Sociological Association session for their engagement with this work.