
Abstract
When people move to a new location, the way they speak often changes to become more similar to the variety spoken in the area. Rates of second dialect acquisition (SDA) have been shown to be affected by a number of factors, including exposure and the relative prestige of the varieties involved. The current study investigates SDA in speakers of American and Australian English who have moved to Australia and the USA respectively. The participants completed picture-naming, lexical decision, and wordlist reading tasks. We found similar rates of SDA in picture-naming, no SDA in wordlist reading, and some differences in terms of when the SDA features are acquired in lexical decision between the two groups. The results suggest that SDA can manifest in non-mobile participants and be triggered through exposure.
Keywords
1. Introduction
With continued exposure to language, an individual’s speech production and perception alter over time through changes in aspects like vocabulary (e.g., Verhaeghen 2003), linguistic processing (e.g., Cristia et al. 2012), and pronunciation (e.g., Harrington, Palethorpe & Watson 2000). Some of the most dramatic changes can be observed in people who adapt their speech when they move to an area where a different linguistic variety is spoken. Second dialect acquisition (SDA) refers to the process of learning of a second dialect (D2) by speakers of another, first dialect (D1), of what would be considered the same language (e.g., Australian English [AusE] speakers acquiring features of American English [AmE] and vice versa). There is substantial amount of research on SDA (for an overview of a large number of studies see Siegel 2010), covering different languages and dialect pairs (e.g., AmE D1, British English D2, Shockey 1984; Canadian English D1, British English D2, Chambers 1992; Tagliamonte & Molfenter 2007; North American English D1, AusE D2, Foreman 2003; British English D1, AusE D2, Trudgill 1981, 1986; Irish English D1, AusE D2, Diskin, Loakes, Clothier & Volchok 2019; North/South Sandong Sui D1, South/North Sandong Sui D2, Stanford 2007).
The observed rates of SDA vary greatly in the existing studies ranging from 0 percent use of intrusive /ɹ/ by the majority of speakers in Chambers (1992) to 100 percent of absence of T-voicing by one of the Canadian English D1, British English D2 speakers in the same study. Some of the important linguistic factors in predicting the rate of SDA include the linguistic level of the variable involved (with lexical features being more acquirable than phonological ones, Siegel 2010) and linguistic rule complexity (with easier rules being more acquirable, Payne 1976, 1980). A number of speaker-related variables are also suggested to predict the acquisition of D2 features: age of acquisition (with younger speakers showing higher D2 rates, Chambers 1992), length of residence (LoR, with a longer LoR associated with higher D2 rates, Foreman 2003), social networks (with more exposure to D2 resulting in higher D2 rate of use, Bortoni-Ricardo 1985), and attitudes toward the dialects (with more positive attitudes to D2 leading to higher D2 rates and vice versa, Kerswill 1994).
While there has been a substantial amount of work on various variables affecting SDA, our understanding of the effect of the specific D1/D2 varieties and modalities (speech production and speech perception) is less defined, which forms the focus of this study.
In relation to the effect of specific varieties involved, it has been hypothesized that respective dialect prestige plays a role with speakers of a less prestigious D1 being more likely to acquire features of a more prestigious D2, all other things being equal (Kerswill 1994). Generally, studies conducted in different locations with different D1-D2 pairs show different SDA averages: for example, 29 percent for Canadian English D1-British English D2 in Chambers (1992) versus 16 percent for North American English D1-AusE D2 in Foreman (2003). Since these studies are usually not comparable methodologically in terms of variables and speaker characteristics, it is difficult to speculate as to whether any of the observed differences in rates of SDA are driven by specific D1-D2 combinations. Work that compares SDA in participants with reciprocal mobility between varieties allows to test the effect of dialect combination more explicitly.
Several existing studies collected data in two locations to investigate participant behavior as both D1 and D2 speakers of respective varieties. Kang (2022) recruited participants from Seoul (a more prestigious, urban dialect) and the North Kyunsang province (a more stigmatized, rural dialect) in South Korea to test the acquisition of several phonetic and phonological variables by speakers who have relocated in both directions. Results revealed that mobile North Kyunsang D1 speakers acquired several of the Seoul Korean D2 features while mobile Seoul D1 speakers largely maintained their D1 features. This is explained through a number of factors including North Kyunsang D1 speakers’ linguistic insecurity and changing identity, and is not fully explained by linguistic rule complexity. As for the difference between the studied variables, North Kyunsang D1 speakers are argued to have acquired more salient features more, and Seoul D1 speakers, less salient ones, with the mismatch also possibly due to the prestige differential. Focusing on participants within the same country, this study involves speakers of a standard and non-standard variety clearly differing in prestige.
Nycz conducted a large-scale study involving national varieties more comparable in terms of status: speakers with respective mobility between Toronto, Canada, and New York City, USA. Nycz (2023) in particular investigated the
Walker argued for the consideration of speech perception in SDA and included both production and perception tasks in her extensive study of non-migrants and expatriates with American and British English D1 and D2, who completed reading (2019) and transcription tasks (2018). SDA rates varied for different groups across variables in the reading task: for /t/-flapping, British English D1 speakers did not use the variant while AmE D1 speakers did, with the US expatriates in the UK using it less than US non-migrants; as for rhoticity, the numerical difference in r-fullness was not confirmed for the AmE D1 groups and was not tested statistically for the British English D1 groups; none of the groups differed significantly on the
To sum up, the work by Walker and Nycz in particular shows that, in the case of SDA of varieties associated with different nations and relatively similar prestige, participants seem to exhibit similar rates of SDA, at least for speech production. Importantly, in both cases one would expect speakers of respective varieties to have relatively high familiarity with each other’s speech even before relocation, as predicted by geographical proximity and ‘cultural prominence’ (Montgomery 2012). This high familiarity prior to migration can result in ‘the effect of long-term exposure [not being] limited to migrants’ (Walker 2018:170). We know that exposure after migration has a positive effect on SDA (as shown in studies of the effect of social networks and LoR; Bortoni-Ricardo 1985; Foreman 2003), so it is conceivable that exposure prior to migration can also influence SDA (e.g., through media, Nycz 2019; Stuart-Smith, Pryce, Timmins & Gunter 2013).
One way to test this is to study reciprocal migration between two varieties, speakers of which have varying levels of familiarity with each other’s dialects prior to migration. An example of that would be American and Australian English, where Australia, for example, consumes comparatively more AmE media than vice versa. On the one hand, if familiarity plays an important role, then we would expect to see different SDA rates for the speakers of AmE and AusE. On the other hand, if the national status of the varieties is more critical, we may not find an effect of dialect at all. Thus, comparing rates of SDA in mobile AmE and AusE D1 speakers, we could find two possible outcomes grounded in the available literature: (1) AusE D1 speakers showing more SDA than AmE D1 speakers due to AusE D1 speakers’ higher familiarity with their respective D2 (as in Kang 2022), and (2) similar SDA rates across the two dialects due to their being national varieties (as in Nycz 2023 and Walker 2019).
Additionally, it is not well understood how SDA rates in the two varieties would compare at different linguistic levels and in speech production versus speech perception. In relation to linguistic level, it is possible that no difference between groups was found in Walker and Nycz because of the focus on the level of phonology, and lexicon would reveal other results. Relatedly, while most SDA work focuses on speech production, one would assume that, if SDA occurs, it would affect both production and perception, so it is important to look at ‘both productive and receptive competence’ (Nycz 2015:471). Puzzlingly, Walker found different SDA patterns in her speech production and speech perception tasks, highlighting the need for more research including both modes. Finally, including a production and perception task in the same study with the same participants allows to compare SDA across the modalities within the same individual speakers.
To address these gaps, this study recruited mobile and non-mobile D1 speakers of American and Australian English, who completed several tasks focusing on SDA in production and perception, and at different linguistic levels. The following research question is guiding this research: What is the effect of mobility and D1 on American and Australian English speakers’ lexical production, phonetic production, and speech perception, and what is the relationship between SDA in these areas within individual speakers?
In terms of the effect of linguistic level, previous literature suggests we might expect to see higher rates of SDA at the lexical level rather than the phonetic one (Siegel 2010). In relation to modality, we predict to find SDA in both production and perception, but given the difference in exposure to the two varieties by non-mobile speakers, American and Australian participants may show differing rates of SDA in perception. Here existing literature diverges, and we might find that mobile Australians show a higher rate of SDA due to American English’s prestige (in line with Walker 2018) or mobile Americans showing a higher rate of SDA due to Australian participants’ exposure to American English prior to migration (in line with Evans & Iverson 2007).
2. Method
2.1. Participants
Fifty-six participants form four groups in this study, which cross two participant-related factors (mobility and D1): thirteen AmE D1 speakers in the USA (hereafter, non-mobile AmE D1 speakers), fourteen AmE D1 speakers in Australia (mobile AmE D1 speakers), fifteen AusE D1 speakers in Australia (non-mobile AusE D1 speakers), and fourteen AusE D1 speakers in the USA (mobile AusE D1 speakers). The exact number of participants analyzed for each task varies due to data loss because of various technical issues and is specified again for each task. The non-mobile participants were recruited through the authors’ social circles and the friend-of-friend method; the mobile participants were recruited via posts in social media groups, such as Australians in the USA.
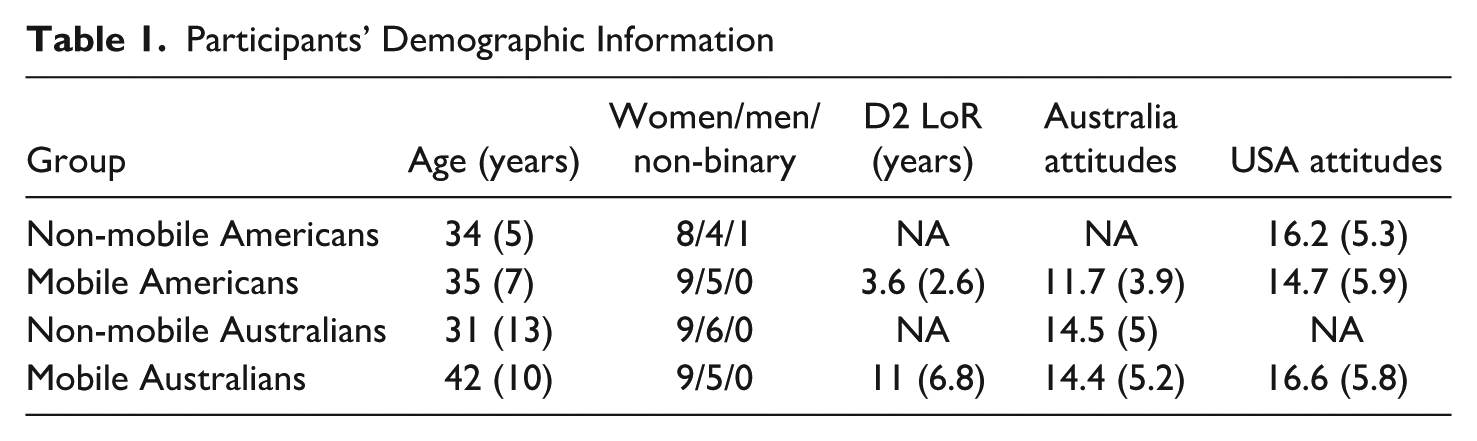
The four groups are similar to each other in terms of composition and characteristics: age, gender distribution, and attitudes to Australia and the USA (Table 1). Their average age was in the early 30s to early 40s. There were about twice as many women participants as men in all the groups; due to this imbalance and no clear predictions for gender differences, we did not consider gender as a variable in our study. They had positive attitudes toward Australia and slightly less so toward the USA (e.g., 11.7 versus 14.7 respectively for mobile Americans, on a 6-36 scale with smaller values meaning more positive). Due to a limitation in study design, data on attitudes was only collected from participants with residence experience in a given country and does not allow a comparison of mobile and non-mobile participants’ attitudes toward speakers of the other variety. The mobile participants had moved to the D2 country as adults; Americans had lived in Australia for an average of 3.6 years, and Australians in US for 11. A Welch Two Sample t-test confirmed that any numerical differences observed between the two D2 groups in terms of their attitudes are not significant. The mobile Australians, however, have a significantly longer D2 LoR in comparison to the mobile Americans (p = .003). Given that LoR can affect SDA rates (Foreman 2003), it is important to keep this difference in mind when interpreting the results.
Participants’ Demographic Information
2.2. Procedure and Analysis
The groups residing in Australia participated in person by completing the tasks in a university linguistics laboratory on a computer with E-Prime 3.0 (Psychology Software Tools 2016) in 2019. The groups residing in the USA did it online using Gorilla Experiment Builder (Anwyl-Irvine, Massonnié, Flitton, Kirkham & Evershed 2020) as this data collection was happening during the COVID-19 pandemic and associated lockdowns. For both in person and online participants, data collection was computer-based, and despite the differences in setting, the procedure varied minimally. The participants completed a picture-naming, lexical decision, and word-list reading tasks, as well as a questionnaire, among others. These three tasks allow us to compare participants’ SDA at different linguistic levels (i.e., lexical and phonetic production in picture-naming and word-list reading respectively) and in perception in addition to production (lexical decision versus picture-naming). This procedure was reviewed and approved by the relevant Human Ethics Committee, and informed consent was obtained from the participants.
The analysis of the picture-naming data is based on fifty-six participants (thirteen non-mobile Americans, fourteen mobile Americans, fifteen non-mobile Australians, fourteen mobile Australians). The visual stimuli for the task comprised eighty images: fifty test items, which represented lexical items which differ in American and Australian English (e.g., cooler/esky), and twenty-five fillers and five practice items, denoted by the same word in American and Australian English (e.g., pencil; Figure 1). The items were chosen with the help of native speakers of the two varieties and dictionaries of Australian and American English (Macquarie Dictionary n.d.; Merriam-Webster n.d.). The designation of each word as American or Australian was further confirmed by comparing the relative frequencies of words in each pair in American and Australian English data in the corpus of Global Web-based English (Davies & Fuchs 2015): while variation exists in every variety and both American and Australian words were found in both American and Australian data in the corpus, the relative frequency of American words to Australian words was higher in the American data than in Australian data and vice versa. In the task, the participants could practice the procedure with the five practice items first; this was followed by the test items and fillers presented individually in random order. A + sign was displayed on the screen for 1000 ms, followed by an image which appeared on a white background for 2000 ms. The participants were instructed to name the image as fast as they could, and their production was automatically audio-recorded. If a participant gave more than one option for a given item, the first word was included in the analysis as the immediate, least conscious response. Zero response and unexpected responses such as box for cooler/esky were coded as NA and excluded from analysis, resulting in 1801 datapoints for statistical analysis (see also Gnevsheva, Szakay & Jansen 2022). Here, differences between varieties would manifest as differences in preference of American and Australian items between AusE and AmE D1 groups, and a difference in degree of preference in the mobile groups in the direction of the D2 will be taken as evidence of SDA.
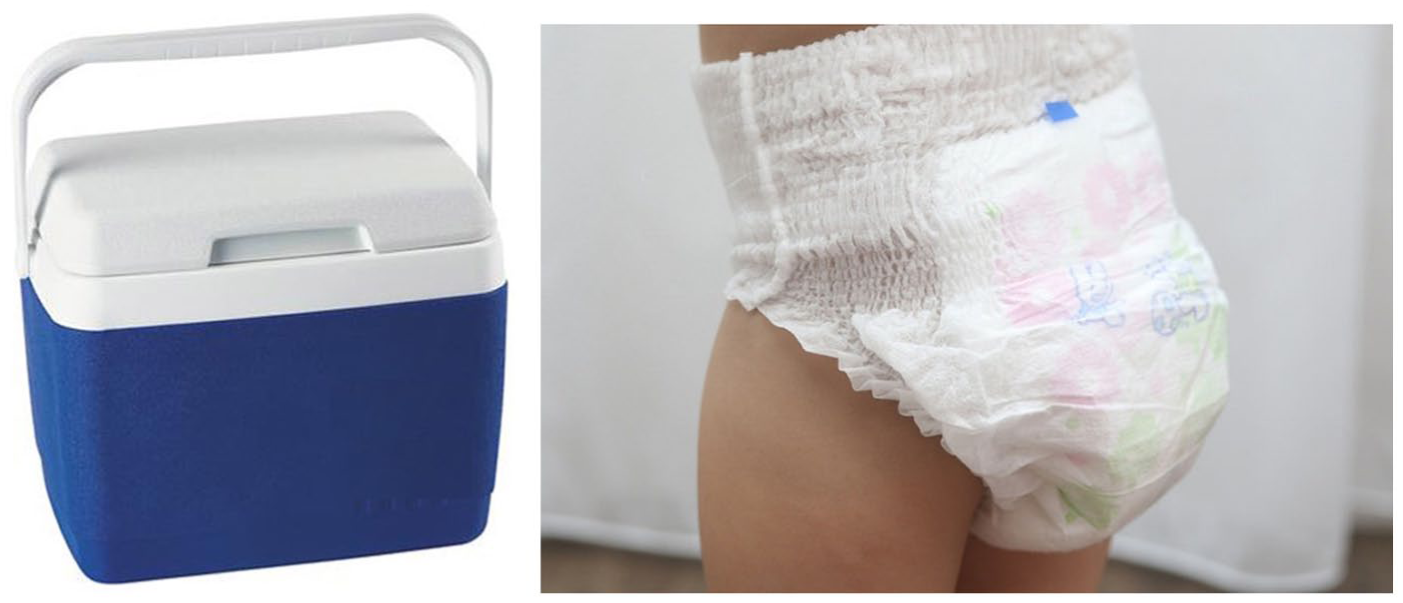
Examples of Visual Stimuli Used in the Picture-Naming Task (cooler/esky in the Left Panel and diaper/nappy in the Right Panel)
We also employ a lexical decision task (LDT) to investigate SDA because it offers a controlled and sensitive measure of participants’ lexical access and familiarity with dialect-specific vocabulary. SDA may not always manifest in overt production but can be reflected in subtle differences in recognition accuracy. A LDT allows us to detect these differences by requiring participants to make rapid, binary judgments on whether they recognize a given item as a real English word. Crucially, this task taps into implicit lexical knowledge and is less susceptible to social or stylistic self-monitoring than production tasks, making it especially suitable for detecting low-level or developing SDA. By using dialect-marked real words (e.g., nappy, diaper) we can directly assess the extent to which participants have acquired or retained dialect-specific lexical items from their current or previous language environments. The LDT then provides an ecologically valid yet experimentally controllable method to quantify SDA through accuracy, while controlling for speaker accent and lexical status. This approach complements existing research on dialect contact and bidialectalism, and provides a psycholinguistic lens through which receptive SDA can be tracked.
Lexical decision data from fifty-six participants (thirteen non-mobile Americans, fourteen mobile Americans, fifteen non-mobile Australians, fourteen mobile Australians) was analyzed. The task was conducted using a total of 152 words as stimuli (half real words, half pseudo-words). The real words were further divided into thirty-eight pairs, with one item in each pair representing an Australian lexical item (e.g., nappy) and the other a corresponding American item (e.g., diaper). One Australian and one American male native speakers read out all items resulting in a total of 304 audio-recorded stimuli. Each lexical item thus was pronounced in both an Australian and American accent, with half having matched and half having mismatched speaker accent and word dialect. Participants heard the stimuli in a random order and were asked to indicate whether the item was a real English word or not on a keyboard or button-box as fast as they could. In this paper we report accuracy data on real words with matched word dialect and speaker accent only, that is, nappy in an Australian accent and diaper in an American accent, to focus squarely on SDA. This choice reflects the specific focus of the current study, which is to investigate actual SDA, that is, the acquisition of naturally occurring word dialect and accent pairings that participants would plausibly encounter in real life. In real-world communicative settings, dialectal lexical items are typically embedded in the phonetic framework of their native accent. The mismatched stimuli were included in the larger design to serve a different research aim, namely, to investigate how L1 and L2 speakers process sociophonetic incongruities (Szakay, Gnevsheva & Jansen 2019). By analyzing only matched items here, we isolate the role of dialect exposure and immersion on lexical accuracy, without introducing artificial conditions that participants are less likely to experience in their daily lives. This design included a total of seventy-six words per participant, which resulted in a data set of 4214 actual responses registered of the total possible 4256. In this task we expect to see differences in the accuracy of the two D1 groups on American and Australian items, and an increase in accuracy on D2 items in the mobile groups will be taken as evidence of SDA.
Finally, wordlist reading data come from forty-seven participants (twelve non-mobile Americans, eleven mobile Americans, ten non-mobile Australians, fourteen mobile Australians). One hundred words of the (C)CVC(C) structure from each of the ten lexical sets
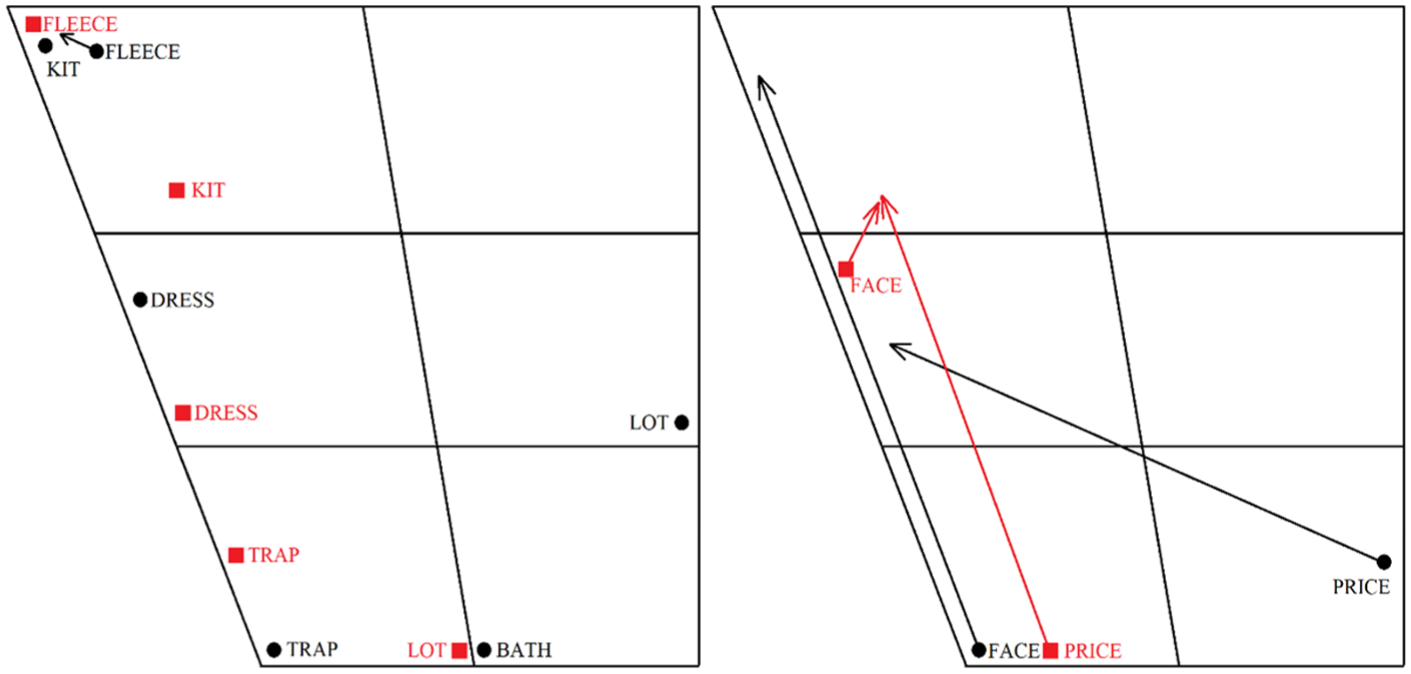
A Schematic Representation of the Vowel Spaces Containing Selected American (Red Squares) and Australian (Black Circles) Monophthongs (Left) and Diphthongs (Right)
The questionnaire at the end of the study collected demographic information from the participants, in particular age, gender, and LoR for mobile groups. Questions about their attitudes (toward both countries for mobile participants and D1 countries only for the non-mobile ones) were based on Drummond (2012) and took the form of 6 Likert scales (America/Australia is a good place to live; Americans/Australians are not trustworthy and honest; Americans/Australians are friendly and kind; It was not important for me to be a part of the American/Australian community when I lived there; The more I get to know Americans/Australians, the more I like them; I did not enjoy living in America/Australia). An average of polarity-aligned points for each country was taken as an individual attitudes score.
3. Results
We fit mixed effects models (Baayen, Davidson & Bates 2008) to the data using the lmerTest package (Kuznetsova, Brockhoff & Christensen 2017) in R (R Development Core Team 2022). The package emmeans was used for pair-wise comparisons (Lenth 2020). Model output was visualized in sjPlot (Lüdecke & Schwemmer 2020).
3.1. Picture-Naming
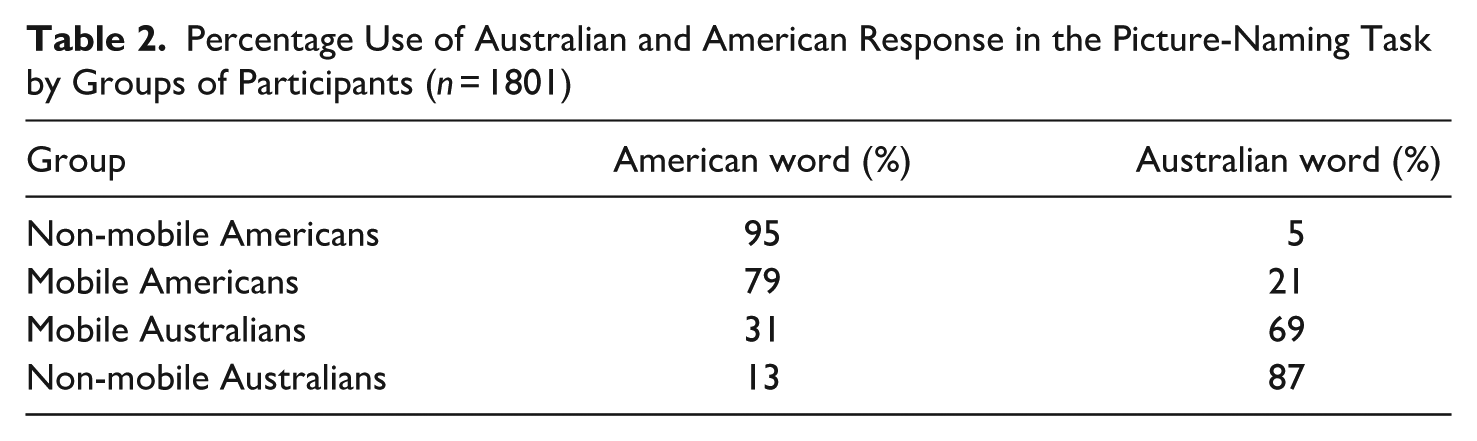
The raw percentage data in Table 2 shows that non-mobile Americans used American words the most (95 percent) and non-mobile Australians the least (13 percent), illustrating the dialectal differences in the lexicon between American and Australian English. The two mobile groups fell in-between the non-mobile groups, with Americans using American words 79 percent of the time and Australians 31 percent. While the differences between mobile and non-mobile dialect pairs suggest SDA, it was quite limited in that both mobile groups used respective D1 words more frequently than D2 words. The difference for the AmE D1 groups constituted 16 percent, and for the AusE D1 groups 18 percent, a small 2 percentage point difference between AmE and AusE D1 pairs. Statistical analysis was used to test whether any of the observed differences are statistically significant.
Percentage Use of Australian and American Response in the Picture-Naming Task by Groups of Participants (n = 1801)
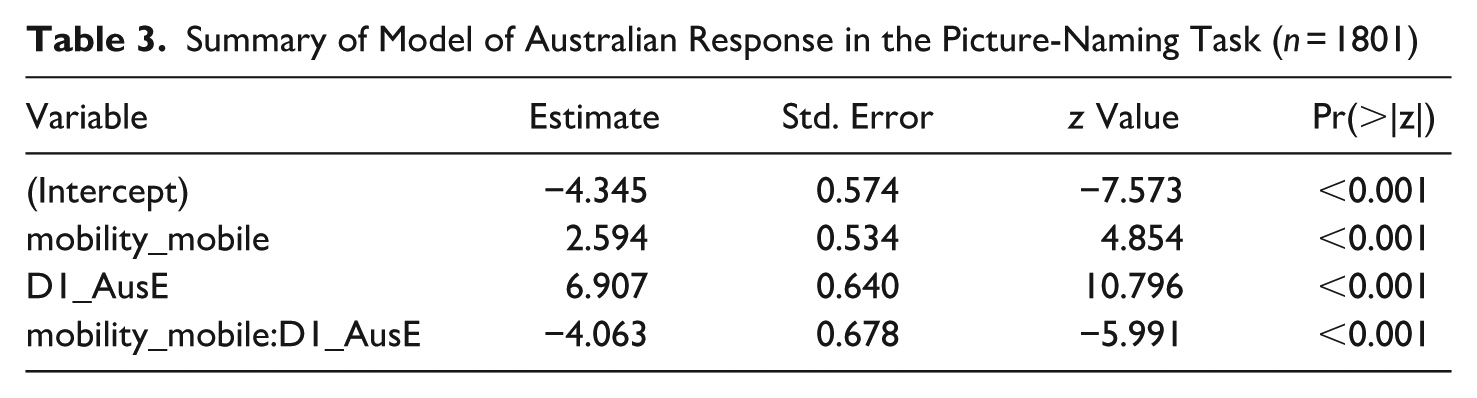
A binomial logistic mixed effects model was fit to the picture-naming data with word choice (American versus Australian) as the dependent variable, an interaction between participant mobility (mobile versus non-mobile) and D1 (AmE versus AusE) as a fixed effect, participant and word as random intercepts, and the mobility × D1 interaction as a random slope for word, which was simplified to mobility + D1 as random slopes for word to assist with model convergence (Barr, Levy, Scheepers & Tily 2013). In comparison with the non-mobile AmE D1 speakers as the baseline, mobile AmE D1 speakers were significantly more likely to produce an Australian word, non-mobile AusE D1 speakers were significantly more likely to produce an Australian word, and their mobile counterparts, less so in comparison (Table 3). In fact, significant differences were found for all pair-wise comparisons (Table 4).
Summary of Model of Australian Response in the Picture-Naming Task (n = 1801)
Summary of Pair-Wise Comparisons for Model of Australian Response
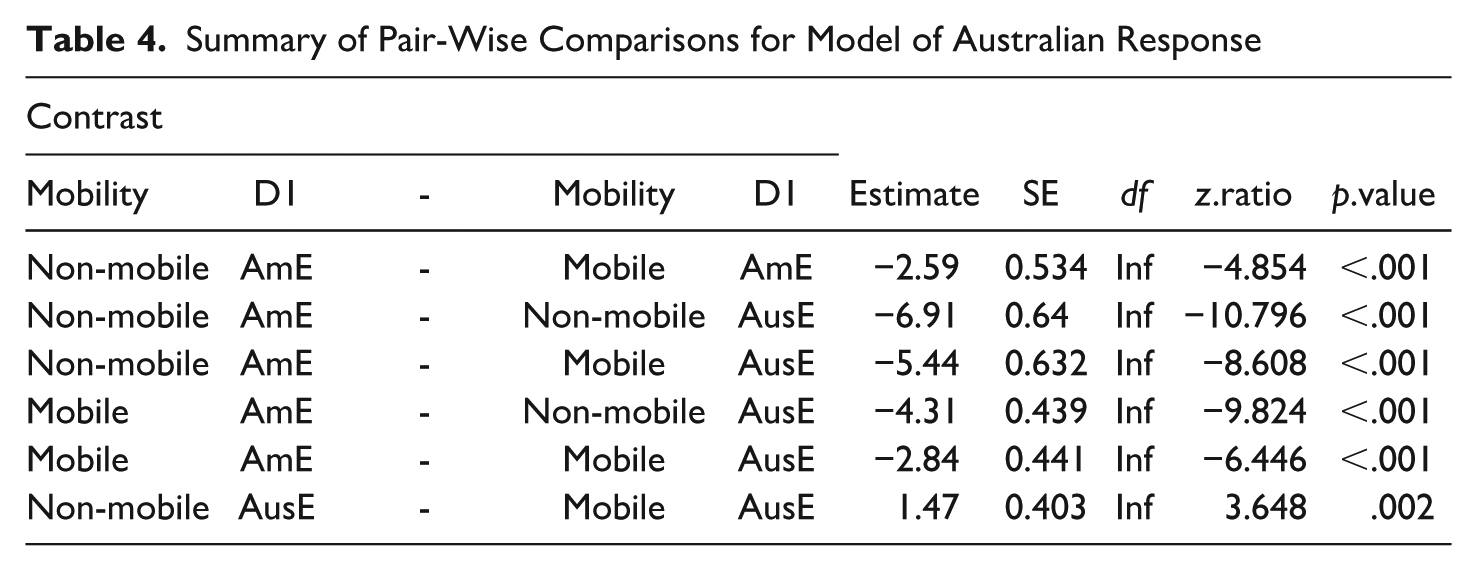
The difference between the D1 pairs is in line with lexical variation between the two varieties, with AusE D1 speakers being more likely to produce what we had identified as Australian words, supporting our original categorization of the lexical items in word pairs. The significant difference between mobile and non-mobile groups for AmE and AusE D1 speakers, with an increased probability of a D2 lexical item for mobile speakers, indicates SDA for both pairs. The significant difference between mobile groups and the D1 groups of their respective D2 (i.e., mobile AusE D1 group versus AmE D1 groups) shows that, despite some SDA, the mobile groups did not reach the rates of D1 speakers of that variety, and a visual inspection of Figure 3 highlights the substantial gap between the mobile groups, pointing to limited SDA. In a comparison of the effect of mobility, the absolute effect size for the AmE D1 pair (2.59) is slightly larger than the effect size for the AusE D1 pair (1.47), suggesting numerically greater SDA for the AmE D1 pair. To estimate whether these absolute effect sizes are statistically different, we constructed 95 percent confidence intervals for the effect sizes using normal approximation and found more than moderate overlap between them, suggesting non-significance (Cumming 2013). This suggests that the different D1 pairs exhibited a similar degree of SDA.
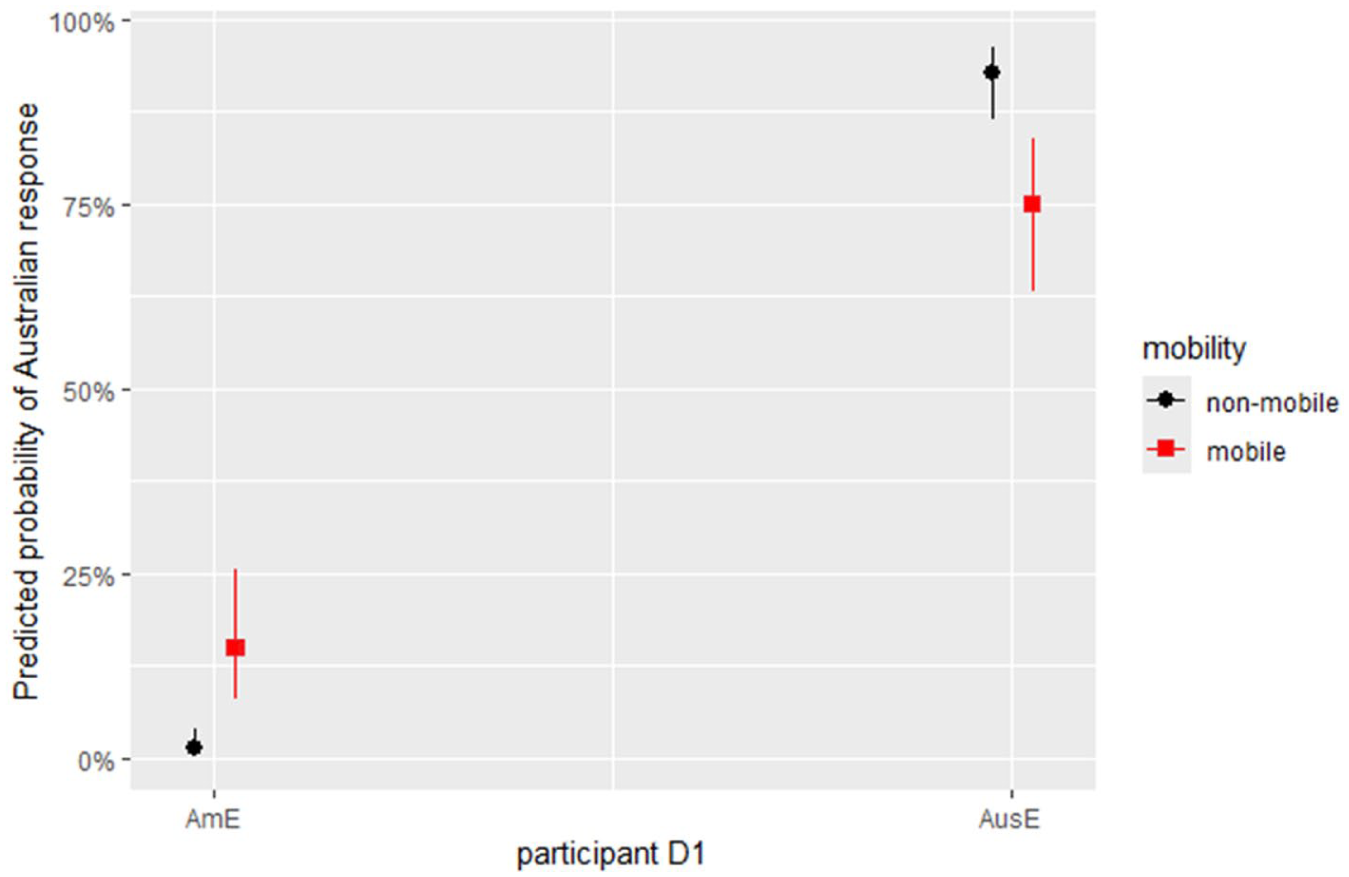
Predicted Probability of Australian Response Across Participant D1 and Mobility in the Picture Naming Task.
3.2. Lexical Decision
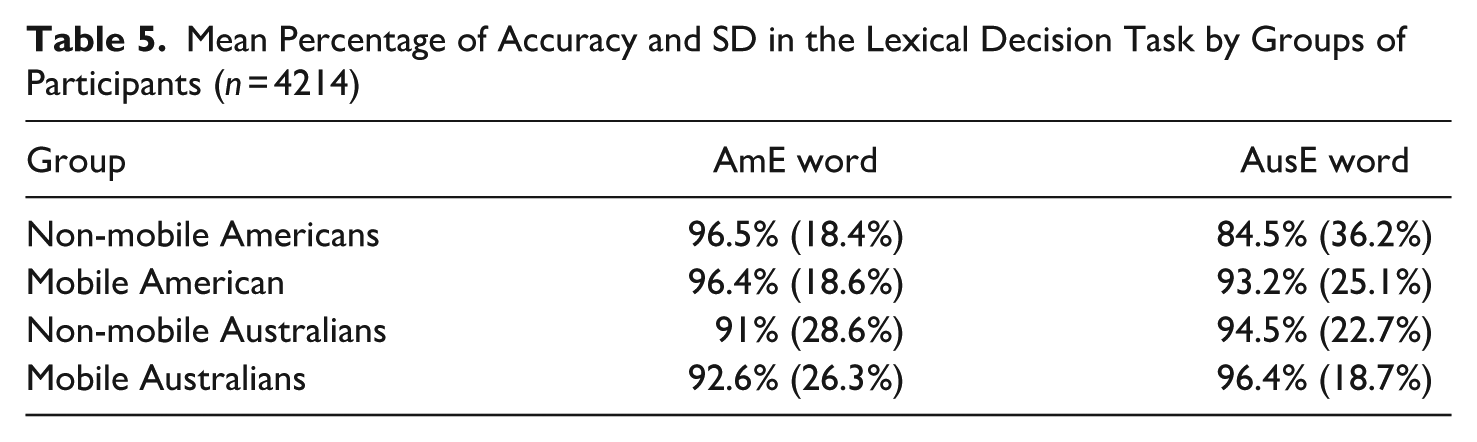
In the lexical decision task, the lowest accuracy was observed in the non-mobile American group on Australian words (84.5 percent), accompanied by the largest variability (SD = 36.2%), suggesting both limited exposure and high individual differences in familiarity with Australian lexical items. In contrast, all other group-word combinations showed higher accuracy and lower variability, with particularly strong performance by mobile Australians on Australian words (96.4 percent, SD = 18.7%) and mobile Americans on both dialect word types, consistent with patterns of SDA. These raw numbers are summarized in Table 5.
Mean Percentage of Accuracy and SD in the Lexical Decision Task by Groups of Participants (n = 4214)
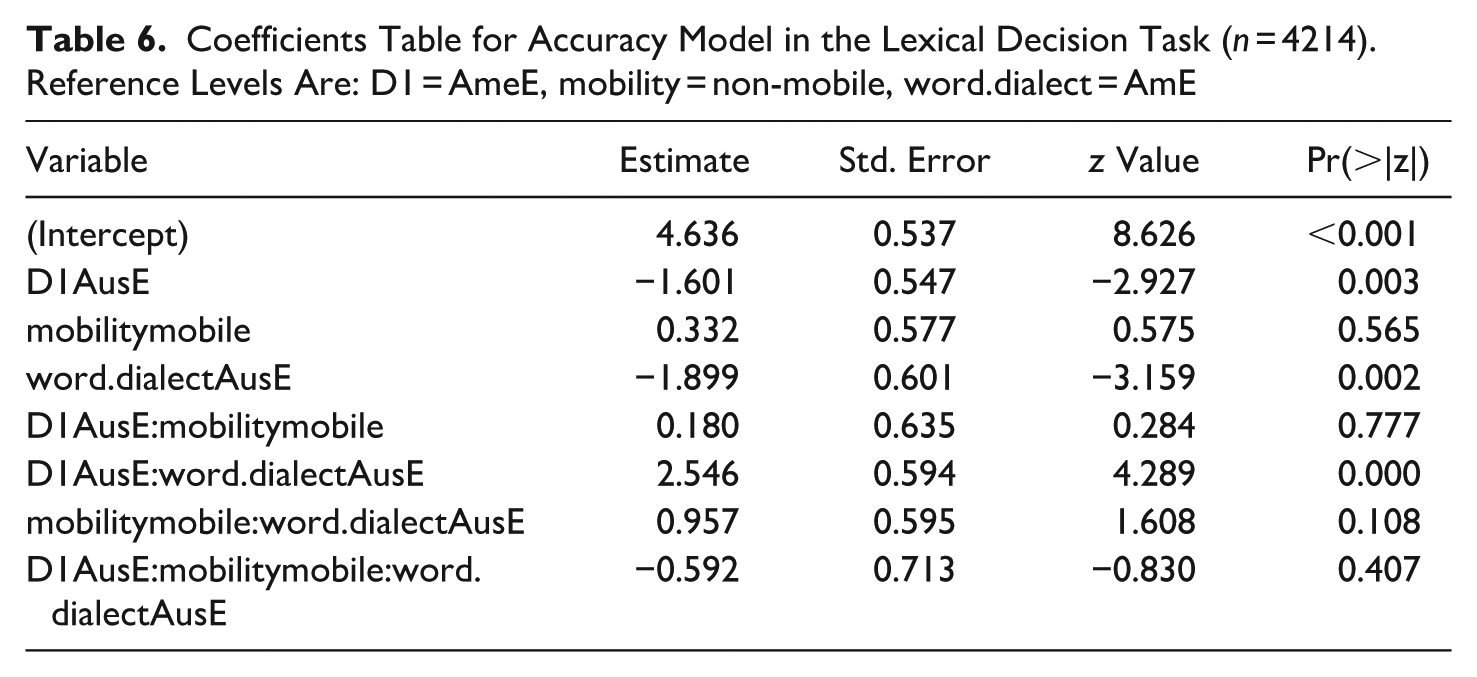
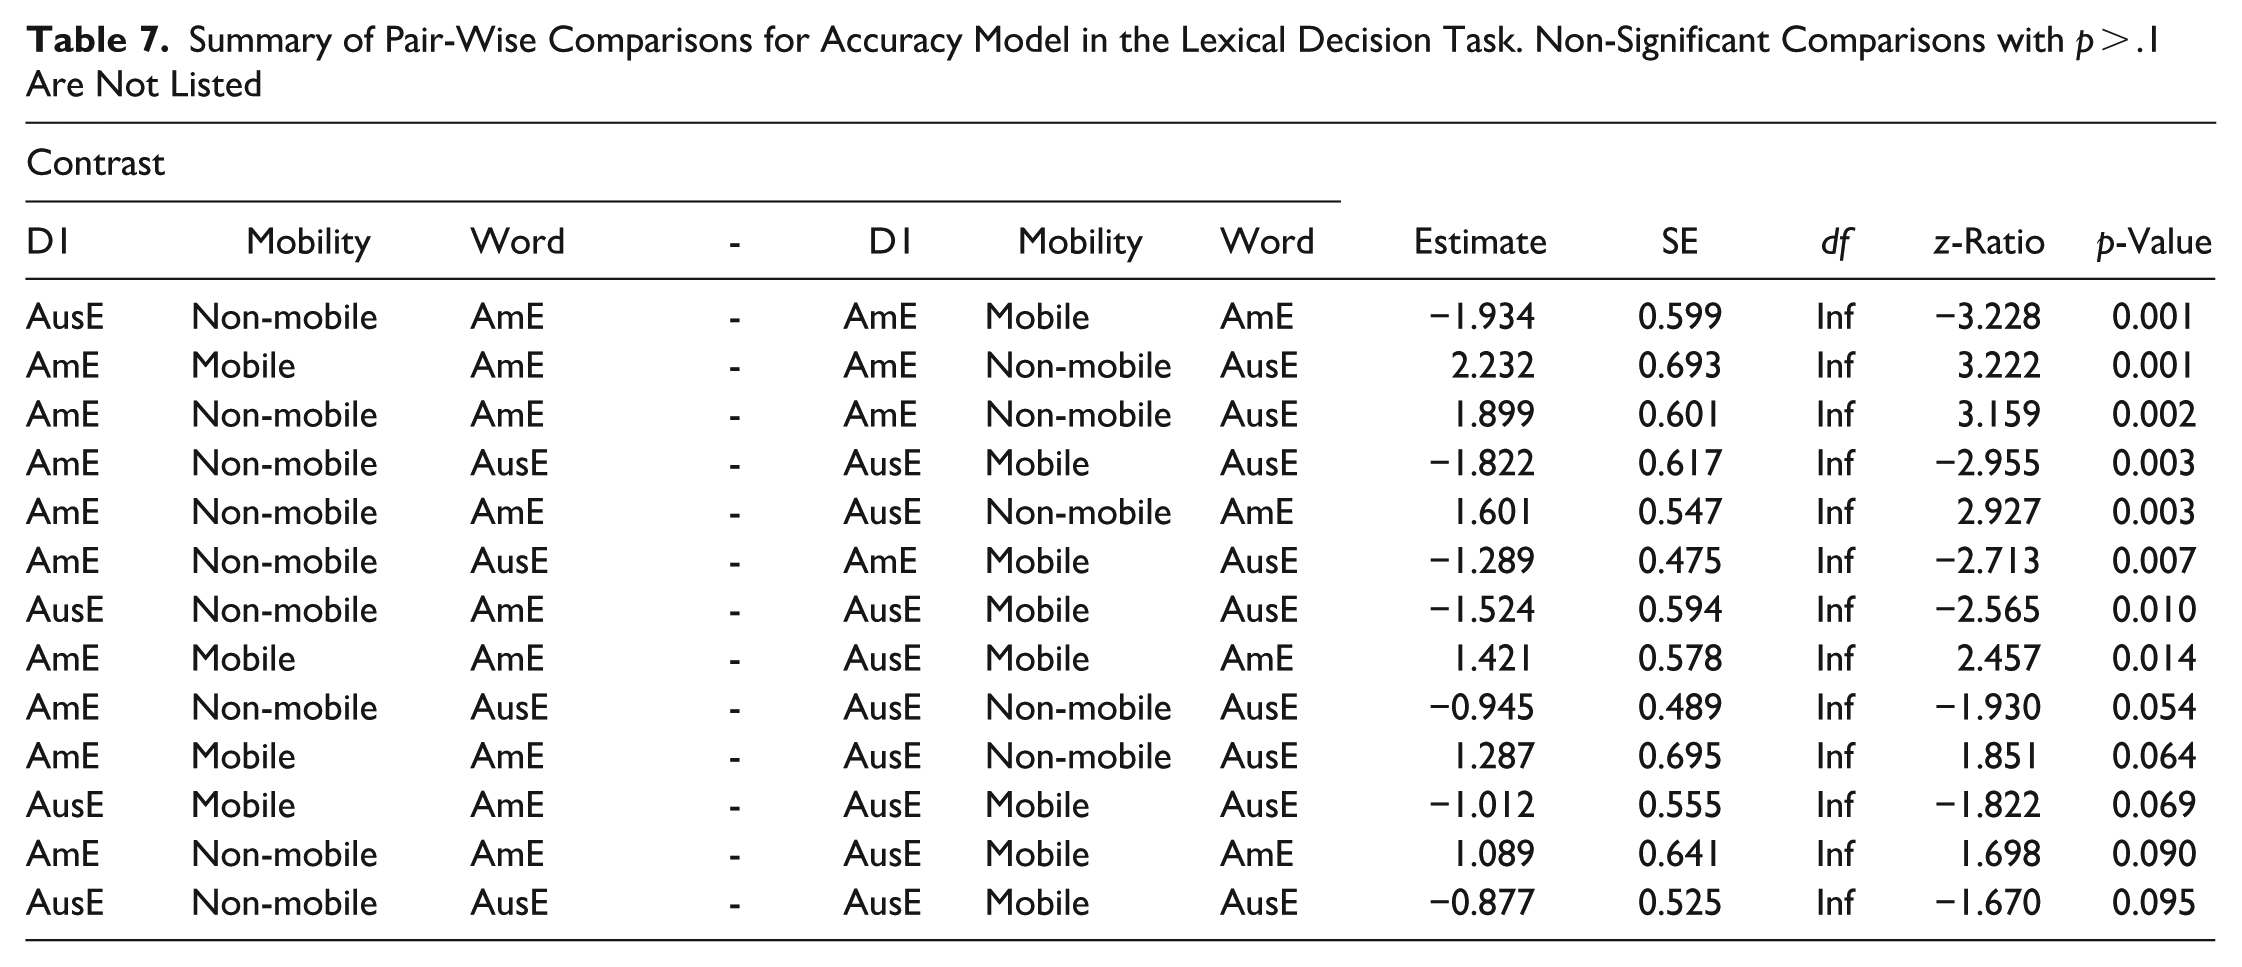
The lexical decision task data was then statistically analyzed through a binomial logistic mixed effects regression model. Response accuracy was entered into the model as the dependent variable, and a three-way interaction of participant D1 (AmE or AusE), stimulus word dialect (AmE or AusE), and participant mobility (mobile versus non-mobile) as fixed effects. The random effects structure included random intercepts for word and participant, as well as stimulus word dialect as a random slope for participant, and the interaction of mobility × participant D1 as a random slope for word. This interaction term was simplified to mobility + participant D1 as random slopes for word to facilitate model convergence (Barr, Levy, Scheepers & Tily 2013). Additionally, the bobyqa optimizer was employed to ensure model convergence (Powell 2009). The coefficients table for the accuracy model is given in Table 6, and the model plot is presented in Figure 4. While the three-way interaction between D1, mobility, and word dialect is not statistically significant in the overall model, follow-up pairwise comparisons nonetheless reveal meaningful patterns of interest that warrant closer examination. The significant pairwise comparisons between the various levels are reported in Table 7.
Coefficients Table for Accuracy Model in the Lexical Decision Task (n = 4214). Reference Levels Are: D1 = AmeE, mobility = non-mobile, word.dialect = AmE
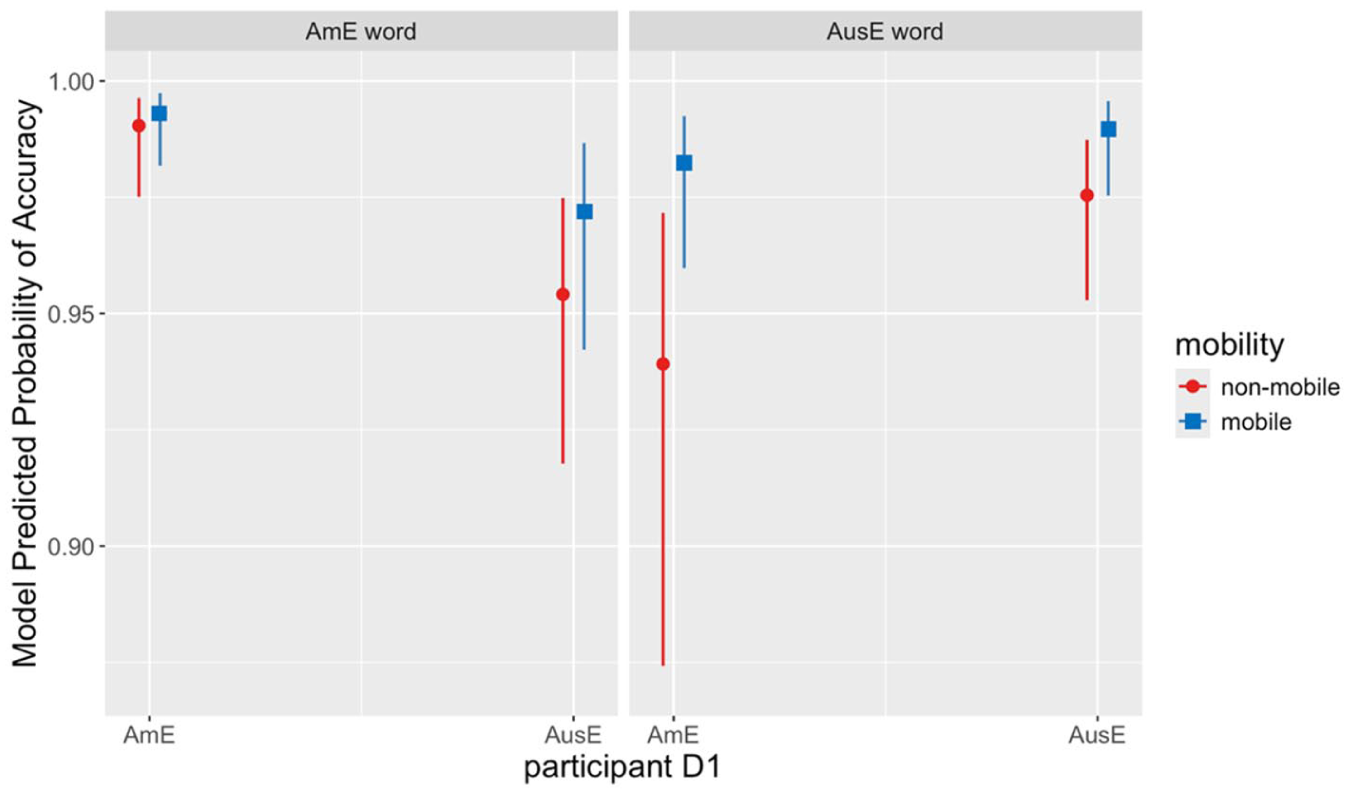
Model Predicted Probability of an Accurate Response by Participant D1, Mobility, and Word Dialect in the Lexical Decision Task
Summary of Pair-Wise Comparisons for Accuracy Model in the Lexical Decision Task. Non-Significant Comparisons with p > .1 Are Not Listed
3.2.1. AmE Speakers: Strong Evidence for SDA Post-Migration in LDT
The results provide strong evidence for SDA among American English speakers who have relocated to Australia. These mobile AmE D1 participants perform significantly more accurately on Australian dialect words than non-mobile AmE D1 participants living in America (z = −2.713, p = .007). This accuracy difference is likely due to the mobile group’s extended exposure to Australian English in daily life, which allows them to acquire dialect-specific lexical items.
The data also reveal a clear initial D1 advantage among non-mobile participants. Non-mobile AmE D1 participants perform significantly better on American dialect words than non-mobile AusE D1 participants (z = 2.927, p = .003). Moreover, these same non-mobile Americans show significantly higher accuracy on American words compared to Australian words (z = 3.159, p = .002), further highlighting the performance benefit associated with one’s D1.
Crucially, we find strong evidence that mobile American participants approximate D1-speaker performance on Australian dialect words. Mobile AmE D1 participants perform just as well as non-mobile AusE D1 participants on Australian dialect items (z = −0.944, p = .345), suggesting that with immersion, they reach D1-like accuracy. This convergence supports the interpretation that sustained real-world exposure can lead to high levels of receptive competence in a second dialect. In sum, the American data display a consistent pattern: a clear SDA effect (mobility is associated with higher accuracy), an initial D1 advantage, and strong evidence for eventual parity with D1 speakers of AusE.
3.2.2. AusE Speakers: Mixed Evidence for SDA Post-Migration in LDT
The pattern for Australian English speakers relocating to the U.S. is less clear. While mobile AusE D1 participants do outperform non-mobile AusE D1 participants on American dialect words numerically, the difference is not statistically significant (z = −1.129, p = .259). One possible reason is that non-mobile AusE D1 participants in Australia may already be substantially exposed to American English via media, allowing them to acquire many American lexical items receptively. This could dampen observable differences between groups and obscure potential SDA effects. Indeed, non-mobile AusE D1 participants living in Australia show no significant accuracy difference between AusE and AmE dialect words (z = −1.499, p = .134), consistent with a high baseline of exposure to American English.
Similarly, the expected D1 advantage for Australian words is only marginally observed: although non-mobile AusE D1 participants do numerically outperform non-mobile AmE D1 participants on Australian words (z = −1.93, p = .054), this strong trend does not reach statistical significance. One possible explanation is that even non-mobile AmE D1 speakers may have some indirect familiarity with Australian lexical items, potentially via shared vocabulary with British English or international media exposure. For example, words like nappy and biscuit (versus diaper and cookie) are found in both AusE and British English, which may lead to partial recognition among American participants. Individual variation could also play a role. Some AmE D1 participants may have had prior exposure through travel, education, or personal connections, increasing heterogeneity within the non-mobile group, which may help explain the large error bars observed for this group in the model plot. However, when we consider participants currently residing in the same country, a clearer D1 advantage re-emerges: Australians living in America outperform Americans living in America on AusE dialect words (z = −2.713, p = .007). The reverse also holds: Americans living in Australia outperform Australians living in Australia on American dialect words (z = −3.228, p = .0012). These findings suggest that while the D1 advantage may not always be evident in non-mobile group comparisons, it does emerge robustly in same-location comparisons.
Finally, mobile Australian participants demonstrate partial alignment with D1-speaker performance. While mobile AusE D1 participants perform less accurately than mobile AmE D1 participants on American words (z = 2.457, p = .014), they are not significantly different from non-mobile AmE D1 participants (z = 1.698, p = .089), indicating some degree of convergence. That is, mobile Australians begin to approximate native-like accuracy on American words, but may not reach full parity as robustly as their American counterparts do on Australian words.
Taken together, these findings from the lexical decision task suggest that SDA is more clearly and consistently observed among American participants, while Australian participants show more variable evidence, potentially due to pre-existing exposure to American English, differences in input quality or quantity, or asymmetries in sociolinguistic salience.
3.3. Word-List Reading
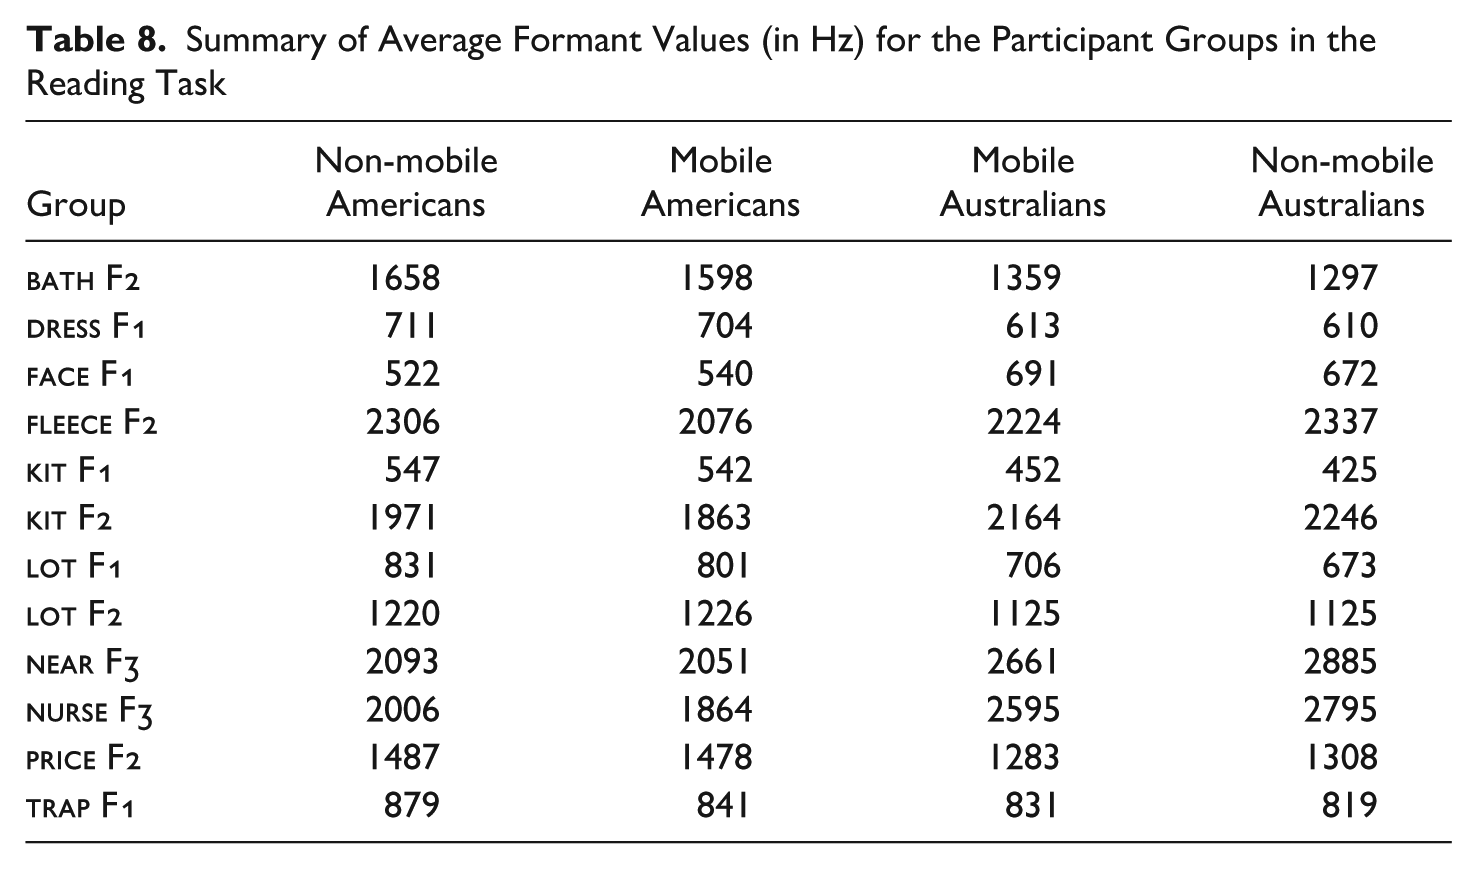
Table 8 and corresponding Figure 5 summarize the average Hz values of the formant estimates for the vowels in the word-list reading task by group. It is readily observable that for many variables the non-mobile groups represent extreme realizations and the mobile groups fall in-between (
Summary of Average Formant Values (in Hz) for the Participant Groups in the Reading Task
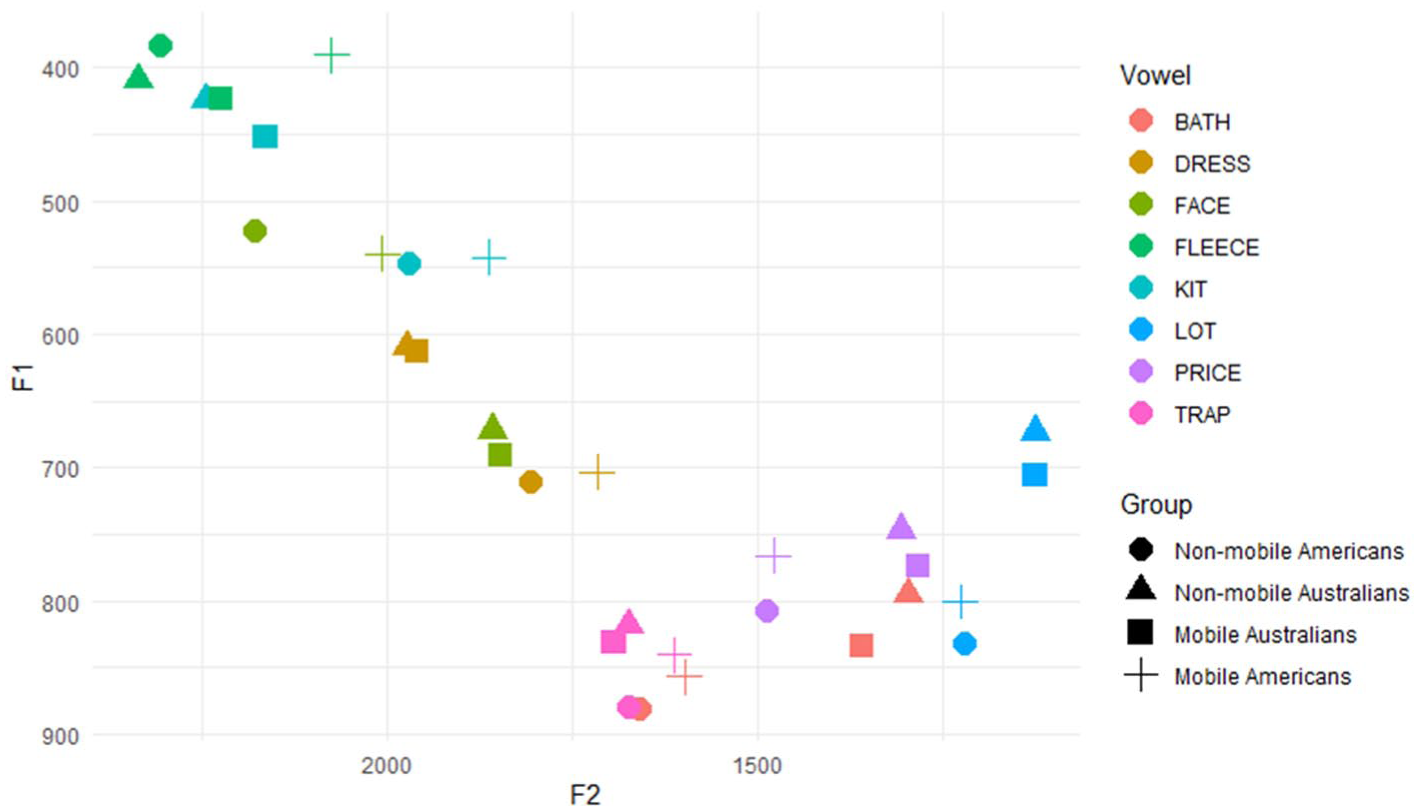
The Monophthongs and Diphthongs Produced by the Four Groups in the Wordlist Reading Task
A linear mixed effects model was fit to the word-list reading data for each lexical set with the relevant formant measurement as the dependent variable, a 2-way interaction between participant mobility and D1 as predictor, participant and word as random intercepts, and the mobility × D1 interaction as a random slope for word, with random slope structure simplified as needed to assist with model convergence (Barr, Levy, Scheepers & Tily 2013). The models were pruned where necessary to exclude non-significant terms (Tables A1-A10 in Appendix A).
For ten of the twelve variables we found a simple significant effect of D1 such that the AusE D1 groups produced a more Australian-like realization in comparison to the AmE D1 groups (a lower value for
3.4. Participant Comparisons Across Tasks
As this study includes data on several variables from the same participants, we briefly explored whether participants who showed higher degree of SDA on one variable also showed higher degree of SDA on another variable. In this analysis we included data from mobile participants and from the picture-naming and lexical decision tasks only as we found evidence of SDA in these tasks but not in word-list reading. To estimate what degree of SDA individual participants showed relative to the group average, we focused on the random effects for participants from the models fit in the main analyses. Just like we take group differences as evidence of group SDA, we take participant differences from the mean (random intercepts) as evidence of comparative participant SDA (for more on the use of random intercept values as a reflection of participants’ deviations from model predictions see Drager & Hay 2012).
The Pearson’s product moment correlation between mobile AusE D1 participant random intercept values in the picture-naming task and their random effect values on AmE stimuli in the lexical decision task is −0.160 (t = −0.537, df = 11, p = .602). This means that mobile AusE D1 participants who used more AusE words in the picture-naming task were less accurate on AmE words in the lexical decision task; however, this is only a weak non-significant correlation. The Pearson’s product moment correlation between mobile AmE D1 participant random intercept values in the picture-naming task and their random intercept values on AusE stimuli in the lexical decision task is −0.084 (t = −0.253, df = 9, p = .806). This means that there was a minuscule negative relationship between mobile AmE D1 participants’ preference of AusE words in the picture-naming task and their accuracy on AusE words in the lexical decision task. Overall, we have little evidence for speakers acquiring new dialect features in different modes in parallel. Perhaps, having receptive knowledge of a word (LDT), which may be more reflective of exposure, does not necessarily result in using that word in production, which may be additionally reflective of identification with the D2. However, work with a larger number of participants in the same and across modalities is needed to confirm this.
4. Discussion
To sum up the findings in the three tasks, the picture-naming task revealed some SDA in each D1 pair such that mobile groups produced D2 lexical items with a higher likelihood in comparison to their non-mobile counterparts; at the same time there was no significant difference between the degree of difference in preference of lexical items in the respective mobile-non-mobile pairs suggesting no effect of participant D1. In the lexical decision task, mobile Americans had significantly higher accuracy on Australian words in comparison with non-mobile Americans while there was no difference for the Australian D1 groups. Finally, in the wordlist reading task, we did not find an effect of mobility either by itself or in an interaction, suggesting no SDA in phonetic production for either D1 group.
Taken together, these results paint a complex picture of SDA. First, we find evidence for SDA in two out of three tasks. The effect of linguistic level and mode is in line with some of the previous literature. Specifically, a finding of SDA in lexical production as opposed to no evidence of SDA in phonetic production across the board is parallel with prior research that shows that phonological variables are less acquirable than lexical ones (Siegel 2010). A finding of SDA in both lexical production and lexical perception suggests that speech production and speech perception are both affected by SDA (Walker 2018). The fact that both mobile groups showed incomplete SDA in the picture-naming task and at least the mobile AmE D1 group performed at AusE D1 speaker level on D2 items in the lexical decision task suggests that SDA in perception may be ahead of SDA in production (which is similar to some of the related claims in the child language acquisition and second language acquisition literatures; e.g., Smith 1973; Postovsky 1974, respectively). As we only found a very weak non-significant relationship between individual participants’ SDA in the picture-naming and lexical decision tasks, more work is needed to test whether SDA in individual speakers proceeds in parallel for production and perception.
Of the two tasks where SDA was attested, we find a difference between AusE and AmE D1 speakers in degree of SDA in one task only, namely the lexical decision task. Specifically, while there was no difference in degree of SDA in lexical (picture-naming) or phonetic (wordlist reading) production, in perception (lexical decision) we find a significant difference between AmE D1 groups but not between AusE D1 groups. We are reluctant to accept the AusE D1 groups’ non-significant difference in perception as evidence for the AmE D1 groups’ greater SDA as it masks the fact that non-mobile Australians were already performing at a very high level in perception of American words, so there was not much room to grow. If anything, this speaks to this group’s SDA without residence experience in the USA and solely through exposure within Australia (e.g., through media, Nycz 2019; Stuart-Smith, Pryce, Timmins & Gunter 2013). We take the non-significant difference in accuracy between American and Australian words within the mobile groups as evidence of SDA in both (though likely at different time-points and in different settings). Thus, we conclude that while we find no evidence of SDA in phonetic production, we find evidence of SDA in lexical production and perception, and there is little difference between the groups in ultimate SDA.
Little effect of language background on degree of SDA is similar to Nycz (2023) and Walker (2019), who also found no effect of direction of participants’ relocation on SDA in speech production. This contrasts with Kang (2022), though, of course, with a difference in prestige of rural and urban Korean dialects involved. The two national varieties in the current study exhibit a similar degree of SDA perhaps because of relatively similar prestige of the national varieties, despite some earlier perception research suggesting that American English is viewed as more prestigious in comparison with Australian English (Bayard, Weatherall, Gallois & Pittam 2001).
Instead, what we find is SDA in perception at different points for the two groups. To return to the point of non-mobile Australians being equally accurate on American words in the lexical decision task to mobile Australians, this result suggests a difference between the American and Australian English D1 participant groups. The Australians’ high accuracy on American words irrespective of their residence experience in the USA can be taken as evidence of a difference in SDA, though a potential prestige differential need not be the only explanation. Another potential interpretation of the finding lies in the diverging rates of exposure to different varieties in the respective home countries, with American English appearing in Australia more often than Australian English in the USA through media, expatriates, or tourism. For example, US-born residents represent 0.4 percent of the Australian population (Australian Bureau of Statistics 2025a), and Australians represent 0.03 percent of the US population (Migration Policy Institute 2025); in 2019 the top ten highest-grossing films in Australia (Screen Australia 2025) and the USA (Box Office Mojo 2025) were all American productions; in 2019 1,056,000 Australians or 4.1 percent of the country’s entire population visited the USA (Australian Bureau of Statistics 2025b), and 812,000 Americans or 0.2 percent of the American population visited Australia (Australian Bureau of Statistics 2025c). This demonstrates that SDA can happen through minimal, non-naturalistic exposure as part of acquisition of sociolinguistic competence (Clopper & Pisoni 2006), which does not affect speech production (still a significant difference in preference of lexical items in production between mobile and non-mobile speakers; see Walker 2018 for a similar argument).
We acknowledge the study’s limitations: a relatively small number of participants, some demographic differences between the groups (e.g., D2 LoR), and differences in data collection method between the two sites. In relation to the number of participants, while larger samples are usually preferable for increased reliability of results, sometimes they are not achievable logistically when the population under investigation is quite small. Furthermore, we made a methodological decision to have a smaller number of participants but minimize within-group variation by strictly controlling recruitment criteria. This left us with about fifteen participants per group, which, in fact, compares favorably to many previous studies of second dialect acquisition (e.g., six participants in Chambers 1992). We also acknowledge that the groups are not perfectly matched with mobile AusE D1 speakers having a higher D2 LoR in comparison to the mobile AmE D1 speaker group. This creates a confound; however, our results are not easily explained by potential LoR effects. If D2 LoR had a positive effect on SDA in this case (as suggested by previous literature, e.g., Foreman 2003), we would have expected the mobile AusE D1 group to show more SDA, but we find no such advantage, suggesting no effect of D2 LoR and attributing the observed differences to variety effects. Finally, while there are also methodological differences in data collection, with Australia-based participants taking part in person, and US-based participants online, these are minor as, while there were differences in interface, the tasks stayed exactly the same, and we find no results suggesting an effect of location beyond what is better explained by SDA.
To conclude, this study compared rates of SDA in people relocating between two respective countries. Evidence of SDA was found in lexical production and perception but not in phonetic production, supporting previous literature on the effect of linguistic level and production/perception mode. One potential indication of a difference in SDA between the D1 groups comes from mobile AusE D1 speakers’ non-significant difference on American words and non-mobile AusE D1 speakers’ high rates of recognition of American words, which we explain through their comparatively broad sociolinguistic repertoires due to exposure to American English in Australia. This highlights that SDA (at least in relation to perception) can happen without relocation through for example, media exposure.
Footnotes
Appendix A
Acknowledgements
We would like to thank our participants for their time; James Grama and Billy McConvell for providing voices for the stimuli; research assistants Kira Rodionov for help in stimulus preparation and data collection, Chloe Xue for help with data transcription, and Monique Koke for help with manual alignment correction; Sandra Jansen for earlier collaborative work on this project, and two anonymous reviewers and the editors for their feedback.
Declaration of Conflicting Interests
The authors declared potential conflicts of interest with respect to the research, authorship, and/or publication of this article.
Funding
The authors received financial support from the Australian Linguistics Society, ANU College of Arts and Social Sciences, Macquarie University, and Paderborn University.