
Abstract
Against the backdrop of the fading Southern Vowel Shift, this paper explores the degree to which different young adults maintain or forego the SVS as a function of demographic traits and self-reported political ideology. Using data from 126 White young adults who grew up in Georgia and were recorded as university students, we find that the more canonically “Southern” pronunciations of the vowels in FACE, DRESS, TRAP, and PRIZE are positively correlated with a continuous measurement of political conservatism, even controlling for gender and hometown. These findings are consistent with speakers’ qualitative impression that the SVS is indexically linked to the conservative political beliefs attributed to a stereotyped White Southerner, constituting one factor that may motivate young adults in this changing landscape to maintain or forego the SVS.
1. Introduction
Diachronically, the Southern Vowel Shift (SVS, introduced in section 2) is fading among White speakers in the American South (Thomas 1997; Prichard 2010; Dodsworth & Kohn 2012; Dodsworth & Benton 2019:39-60; Renwick, Stanley, Forrest & Glass 2023). Synchronically, however, speakers retain or forego the SVS to varying degrees, correlating with familiar groupings such as gender, socioeconomic status, or urban versus rural location (Thomas 1997; Fridland 2001; Dodsworth & Benton 2019:39-60). Beyond these broad social divisions, individual-level differences such as attachment to place (Hazen 2002; Reed 2018) or stylistic presentation (Cramer 2013; Lide 2014) also condition speakers’ overall use of SVS features. Here, we add a previously unexamined axis for synchronic variation in the South: individual political beliefs.
As discussed further in section 2, linguistic features have been associated in both production and perception with political ideologies. Among other varied social meanings, the SVS evokes cultural stereotypes of White rural Southerners, assumed to be politically conservative. But it remains an open question whether this stereotype is manifested in speakers’ actual production.
To address that question, this study tests the correlation between speakers’ use of SVS features and self-reported political ideology. First (section 2), we review the literature concerning the Southern Vowel Shift, political dimensions of language variation, and social meanings indexed by Southern accents. We introduce our speakers (section 3)—126 White college students who grew up in Georgia—and our data collection methods. For acoustic analysis, vowel diagonals are calculated for the vowels (denoted using Wells’ lexical sets; Wells 1982) FACE, DRESS, TRAP, and PRIZE, all implicated in the Southern Vowel Shift (Prichard 2010; Fridland 2012; José 2023). Speakers’ vowel realizations are correlated with political ideology, gathered from a post-interview survey administered through Qualtrics. Results (section 4) show an effect of political ideology, such that more conservative speakers are more likely to retain elements of the SVS: a lower/backer FACE, a higher/fronter DRESS and TRAP, and a more monophthongal PRIZE. These effects are interpreted in light of participants’ metalinguistic commentary (section 5) on the meaning of Southern accents, which connects back to overarching narratives about the South, its residents, and its language. More broadly (section 6), this paper marshals large-scale evidence to explore how the fate of the Southern Vowel Shift is shaped by speakers’ attitudes toward the social meanings that it evokes.
2. Background: Politics and Language Variation
The Southern Vowel Shift (Labov, Ash & Boberg 2006), associated with White speakers in the Southeastern region of the United States, involves the raising/fronting of the DRESS vowel and the lowering/backing of the FACE vowel. This “swapping” of tense and lax nuclei can extend to the high front vowels FLEECE and KIT, although FLEECE/KIT swapping is found to be far more limited (Fridland 2001; Labov, Ash & Boberg 2006; Dodsworth & Kohn 2012). The SVS also involves raising/fronting of TRAP, fronting of GOOSE/GOAT, and monophthongization of PRIZE/PRY in pre-voiced and word-final contexts.
Over time, the SVS is fading (Prichard 2010; Dodsworth & Kohn 2012; Renwick, Stanley, Forrest & Glass 2023). It is not clear whether the SVS is being replaced by a vowel system that is simply less reflective of the SVS, or by an alternative one such as the pan-regional Low Back Merger Shift (LBMS) (Boberg 2005; Nesbitt 2018, 2021; Becker 2019; D’Onofrio, Pratt & Van Hofwegen 2019), characterized by lowering/backing of DRESS and TRAP and the raising/fronting of FACE, along with the merger of the low back vowels LOT and THOUGHT, which gives this shift its name. Since the LBMS involves a reversal of several elements of the SVS, it is difficult to delineate between a “less Southern” vowel system versus one that manifests the LBMS. In any case, with the vowel system in flux, different White Southerners manifest the SVS to varying degrees. Here, we explore how such variation may be shaped by their attitudes toward social meanings evoked by the SVS.
Our study focuses on the mid and low front vowels (FACE, DRESS, and TRAP) as well as the diphthong PRIZE. We set aside the high front vowels (FLEECE, KIT) because, as mentioned above, FLEECE/KIT overlap is found to be more limited than FACE/DRESS overlap. We set aside the back vowels (GOOSE, GOAT) because, although these vowels show a distinctive fronting pattern in Southern varieties (Fridland 2001; Dodsworth & Kohn 2012), Southern fronting of GOOSE/GOAT can be difficult to disambiguate from alternate pan-regional fronting without full trajectory information (Koops 2010).
Turning to the effect of political orientation, some work has explored how politicians’ language use is shaped by their ideological platforms. Hall-Lew, Coppock, and Starr (2010) argue that during the United States’ invasion of Iraq, Democratic congresspeople realized the final vowel in that country’s name with the “foreign-sounding” PALM vowel to sound sophisticated and respectful of its native pronunciation, while Republican congresspeople used the Anglicized TRAP version to symbolize an America-first attitude. Across the Atlantic, Hall-Lew, Friskney, and Scobbie (2017) propose that Scottish Members of Parliament follow or reject the British Received Pronunciation of the TRAP/BATH vowels in part to index affiliation to the United Kingdom versus an independent Scotland.
Among citizens who are not politicians, most work addresses political beliefs as one of a host of social meanings. For example, speakers’ commentary on “country talk” connects to “country values” and associated practices and beliefs, which may implicitly include political attitudes (Hall-Lew & Stephens 2012). A similar suggestion has been made for “country” orientation and backing of /s/ in Redding, California, which may convey opposition to liberal city-based gender norms (Podesva & Van Hofwegen 2014).
As for how an individual’s political beliefs may shape their vowel system, Labov (2012, Chapter 7) observes that the states characterized by the Northern Cities Vowel Shift (such as Illinois, Michigan, and Wisconsin) cast electoral votes for Democratic presidential candidates in 2004 and 2008. He also finds stronger NCVS features among speakers from counties that voted more Democratically. This study adds a political dimension to Labov’s classic finding (Labov 1963) that people may use or eschew a regional vowel pattern depending on how they feel about the ideological meanings that they associate with it.
Exploring the decline of the Northern Cities Vowel Shift in Chicago, D’Onofrio and Benheim (2020) suggest that the NCVS evokes the persona of a working-class Irish Catholic who attends a predominantly White Catholic school rather than a racially diverse public school—an association with political dimensions linked to race and class. D’Onofrio and Benheim (2020) propose that the NCVS is declining among young people who disaffiliate from this White working-class stereotype even when they still feel connected to the region overall. Our study similarly explores how a person’s use of a regional vowel system may be shaped by their attitude toward its political associations, beyond the region itself.
These studies find evidence consistent with the suggestion that a person’s political ideology shapes their phonetic production, but the independent variable of politics is often approximated through an intermediary: Podesva and Van Hofwegen (2014) estimate a person’s orientation toward the “country”; Labov (2012) uses the voting history of a person’s county, and D’Onofrio and Benheim (2020) classify speakers by whether they attend Catholic school. In our study, we target each speaker’s political orientation directly through a survey.
As for the social meanings of the SVS, research in folk dialectology finds that Southern Englishes are negatively evaluated by listeners (Niedzielski & Preston 2010). For English variable (ING), use of the Southern-associated -in variant correlates with ratings of speakers as uneducated or lazy, by Southerners as well as non-Southerners (Fridland & Bartlett 2006).
Over time, linguistic features such as the SVS or (ING) have become “enregistered” (Agha 2003) as essential to a stereotyped social category of White Southerners. Interviews and map tasks with both Southern and non-Southern participants elicit such tropes, even for younger individuals (Preston 2018). Louisville speakers use high rates of enregistered features to give voice to non-Southern expectations of Southern speech and behavior (Cramer 2013). White Southerners may set themselves apart from character types like “redneck” or renegotiate these terms for their own self-identification (Shirley 2010). Since terms like “redneck” evoke conservative political beliefs, users in left-leaning Appalachian social media groups juxtapose linguistic features with unexpectedly leftist messaging to de-essentialize the connection between language and Southern stereotypes (Lovejoy 2020).
In a socio-pragmatic perception study, Mahler (2022) explores sentences such as Ben didn’t hear that Obama damaged the economy. Does the speaker believe that Obama damaged the economy? Mahler (2022) finds that experimental participants are more likely to infer that the speaker endorses a conservative-coded embedded claim (that Obama damaged the economy) when the speaker is described as Republican; when they are said to be from a rural Southern area; and when audio stimuli use a “Southern accent.” This study offers evidence for the claim, also put forward by Allbritten (2011) and Hayes (2013), that rural Southerners and Southern accents evoke conservative political beliefs in perception.
In political science (Amira, Cooper, Knotts & Wofford 2018; Ash et al. 2020), it is found that political candidates with a “Southern accent” are assumed to be more conservative—and evaluated more negatively, especially by Democrats—than those without such an accent, even holding the content of their speech constant. Southern speech is linked to political conservatism in part because Southern states have largely cast their electoral votes for Republican presidential candidates around the turn of the twenty-first century. Moreover, as discussed above, the “Southern accent” is perceived as uneducated, rural, and folksy (Niedzielski & Preston 2010), which people may associate with political conservatism given that White Americans have recently polarized along such lines (Scala & Johnson 2017; Gimpel, Lovin, Moy & Reeves 2020; Carnes & Lupu 2021), with urban and educated populations trending Democratic while rural and less-educated groups favor Republicans.
Since a speaker’s vowel system can be perceived to convey their political orientation through engagement with enregistered Southern character types, we hypothesize that a speaker’s use or non-use of the SVS might be driven in part by their attitude toward that association.
3. Community, Data, and Methods
Our study is situated in the state of Georgia in the Southeastern United States, which falls within the region characterized by the Southern Vowel Shift introduced above (Labov, Ash & Boberg 2006). While the South is stereotypically associated with rurality, over sixty percent of Georgia’s 10.8 million residents live in the Atlanta metropolitan area (Census Bureau, United States 2020), which is a hub for finance, medicine, film-making, and transportation, attracting in-migration from around the country and the world. Moreover, while Southerners and Southern accents are linked to conservatism in the popular imagination, Georgia is now a “swing state,” having cast electoral votes for the Republican Donald Trump in 2016 and for the Democrat Joe Biden in 2020.
Our data are drawn from an ongoing effort to catalog the speech of native-Georgian young adults at two flagship universities. One school is located in Atlanta and is particularly known for its STEM curriculum (science, technology, engineering, and mathematics); the other is located in a college town and serves diverse academic interests. At both schools, at least fifty percent of undergraduates hail from in-state, and only in-state students were recruited for our study.
We study students not just because we work at universities, but because young speakers constitute the forefront of change in apparent time (Labov 1965), illuminating the future as well as the present of speech in Georgia. Our participants are all roughly at the same age and life-stage; they hold the same occupation (student) at the time of recording; their attendance at selective universities indicates that they have all pursued a high-achieving educational trajectory; and the ones studied here are all White. But they differ with respect to their gender, hometowns, and ideological attitudes. With other factors held constant, we explore the effect of such demographic and ideological factors on each speaker’s vowel system.
3.1. Data Collection
Participants were recruited through the Psychology pool (which offers credit for participating in research studies); as one of several optional extra credit choices in our courses; and through the personal connections of a student research team. After consenting to the study, each participant was recorded in a sociolinguistic interview (typically thirty minutes long), discussing their college experience, hometown, future plans, the political issues they find most important, and whether they think they have a “Southern accent”; then they were recorded reading a two-minute passage designed to elicit vowels in rare phonetic contexts. Recordings were mostly carried out in a faculty office, using a Zoom recorder and an Audio-Technica lavalier microphone. Digital files were encoded using 16-bit PCM with 44.1 kHz sampling. A plurality (56/126 = 44%) of interviews were conducted by the first author, a White woman born in 1989 who grew up in Maryland; the rest were conducted by members of a student research team, who share similar demographic traits to the interviewees.
Data were recorded from January 2020 to the present, with a nine-month pause during the onset of the coronavirus pandemic. During the pre-vaccination phase of the pandemic in early 2021, the participant sat in the faculty office with the microphone (without a face mask) while the researcher interviewed them via video conference from an adjacent classroom, thus keeping distance while still using the Audio-Technica microphone to avoid any confounds from computerized video-conference recordings (Calder et al. 2022). As for whether people may speak differently on video than in-person (Bleaman, Cugno & Helms 2022), we labeled recordings by date for their medium (video versus in-person) to use as a random effect in our statistical analysis. Overall, 20 of 126 participants (16 percent) were recorded using pandemic protocols. Our Institutional Review Board approval was updated with the arrival of coronavirus vaccines to resume recording with the researcher and participant in the same room.
After being recorded, each participant filled out a survey on the Qualtrics web platform, linked to their recordings by an anonymous identification number. The survey begins with demographic information (year of birth, gender, sexual orientation, ethnicity, where they and their parents have lived, parents’ education level). To approximate political affiliation, the survey elicits voting history and a series of twelve feeling thermometers, adapted from Everett (2013), about politicized cultural and economic issues such as taxes on the rich, regulations on businesses, access to guns, access to abortion, and so on (given in the Appendix). Following Everett (2013), the twelve feeling thermometers are compiled into a single continuous measurement from 0 (maximally liberal) to 100 (maximally conservative; mean = 38/100, standard deviation = 21, median = 33).
As validation of this metric, a linear regression finds that someone who voted for the Democrat Joe Biden in 2020 would have an OverallConservatism of 26 out of 100, while someone who voted for the Republican Donald Trump would have an OverallConservatism of 65 of 100 (β = 39, t = 10.61, p < .001, adjusted R2 = .49). This measurement of OverallConservatism captures fine-grained distinctions between speakers who voted for the same candidate, and allows us to include data from younger participants who were not eligible to vote in 2020.
In total, our corpus comprises over 220 speakers of diverse backgrounds, with further recordings ongoing. Here, we present data from 126 transcribed White speakers, because the SVS and its “retreat” have been primarily described among White speakers, and because we want to hold constant the important effects of ethnicity in order to focus on other demographic and ideological factors.
We used Praat (Boersma & Weenink 2006) to transcribe sociolinguistic interviews and reading passages. Originally, the data were transcribed by hand; as the project expanded, we used CLOx (Wassink, Squizzero, Fellin & Nichols 2018), and later the Deepgram integration (Ma, Glass & Stanford 2024) with DARLA (Reddy & Stanford 2015), leveraging commercial speech-to-text tools to generate a draft transcription. The computer-generated draft TextGrids were then post-edited by hand—by the first author, a paid research assistant, or a member of a student research team—to correct errors, add filler words omitted by the speech-to-text system, and separate interviewer/interviewee speech.
Each transcribed audio file was then submitted to the semi-automated version of DARLA (Reddy & Stanford 2015), which takes in audio that is already correctly transcribed, and uses the Montreal Forced Aligner (McAuliffe, Socolof, Mihuc, Wagner & Sonderegger 2017) to align each transcribed word with its corresponding audio and automatically measures formant values at regular intervals within the duration of the vowel. We used the default settings to automatically filter out stop-words, unstressed vowels, and vowels that have a bandwidth over 300 Hz for either F1 or F2. For each participant, we collated DARLA’s output into a master file with formants from every vowel token as well as demographic and political Qualtrics data from each participant.
We focus on the vowels FACE, DRESS, TRAP, and PRIZE. Measurements were taken at 35 percent duration for FACE, DRESS, and TRAP, thus capturing the nucleus of the vowel before any diphthongization, often found in the southeastern region (Thomas 2003; Labov, Ash & Boberg 2006). For PRIZE, we look at the glide (80 percent duration), where a diphthong should raise and front while a monopthong should stay low and back. We removed vowel tokens with a duration less than 0.06 seconds, as well as those in pre-nasal, pre-lateral, and pre-rhotic contexts, because these are strongly coarticulated and often phonologically distinct (Cohn 1990; West 1999).
All measurements of vowel tokens were z-score-normalized by speaker (Lobanov 1971). We removed severe outliers more than three standard deviations away from the speaker’s mean. To jointly measure frontness and height along the front periphery of the vowel space, we use the vowel diagonal method (Labov, Rosenfelder & Fruehwald 2013). The original formulation of vowel diagonal uses a transformation of unscaled formant values (2 × F2−F1), but we use a modified version of the formula using Lobanov-normalized values (Z2−Z1) (Dodsworth & Kohn 2012). Diagonal measurements serve as the dependent variable in all of our statistical analyses.
3.2. Descriptive Statistics
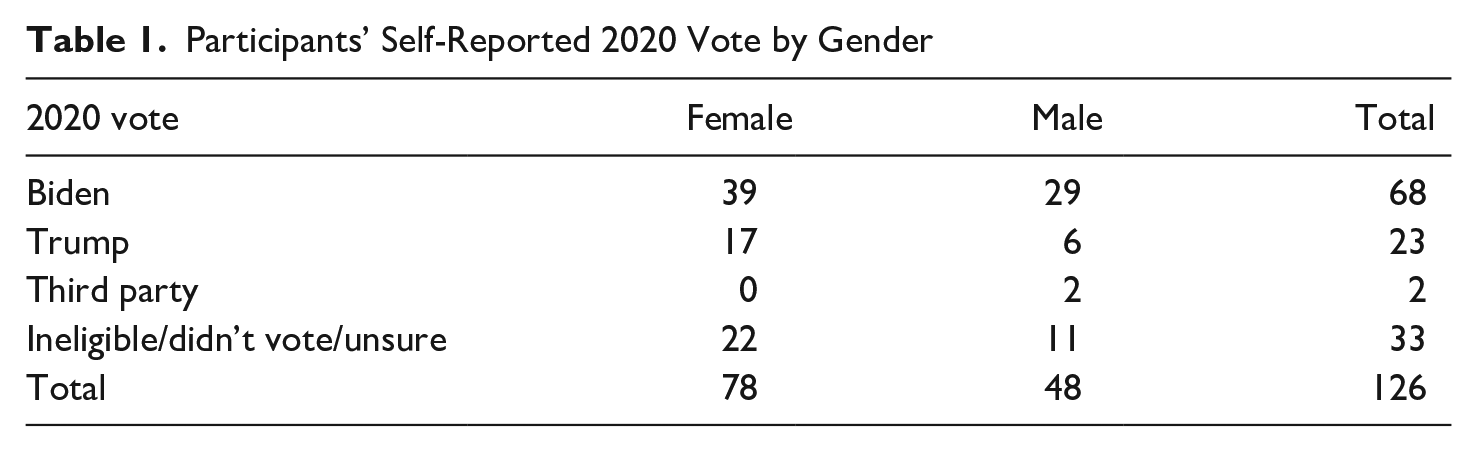
Before turning to acoustic data, we provide descriptive statistics about our participants from the Qualtrics survey. Our participants were born between 1996 and 2004, with a median of 2001. Table 1 presents the participants by gender and 2020 presidential vote. Gender was elicited using a multiple-choice question (Male, Female, and Other with an optional free-text box). These self-reported categories include both cisgender and transgender participants. We set aside data from one participant who is nonbinary, keeping only the relatively balanced and well-represented categories of men and women.
Participants’ Self-Reported 2020 Vote by Gender
To measure urban/rural background, each person’s self-reported hometown (Figure 1) was mapped to the Rural-Urban Continuum Code (RUCC) of its county using the 2013 scale established by the Department of Agriculture.
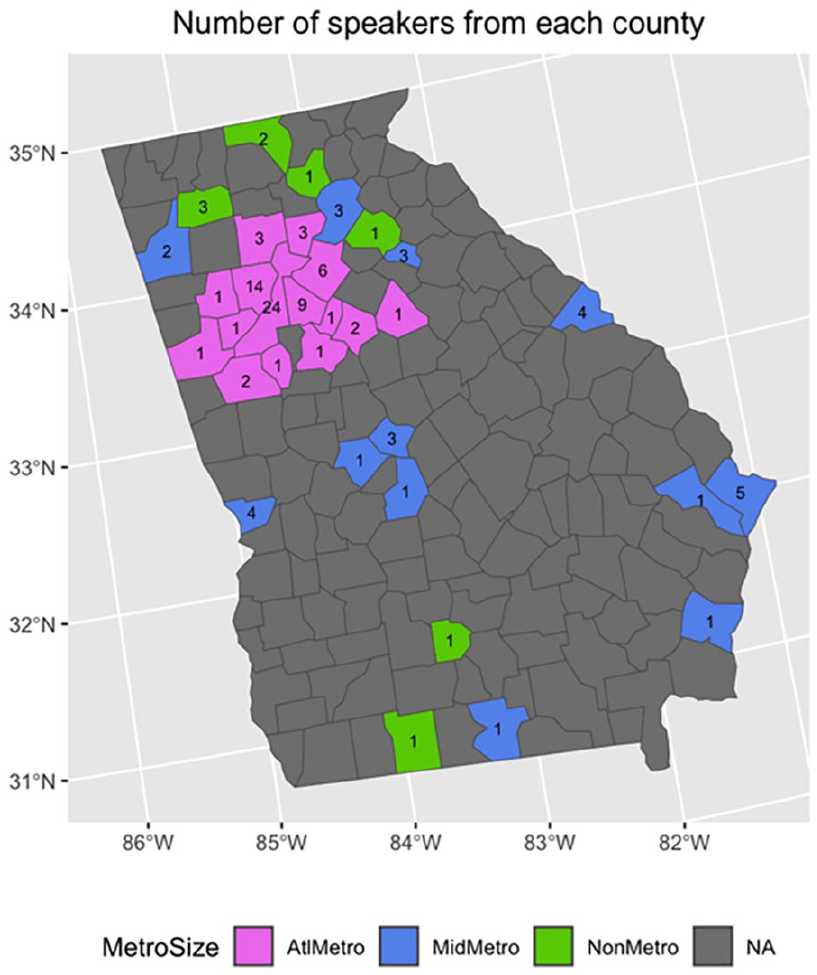
Speakers’ Hometown Counties
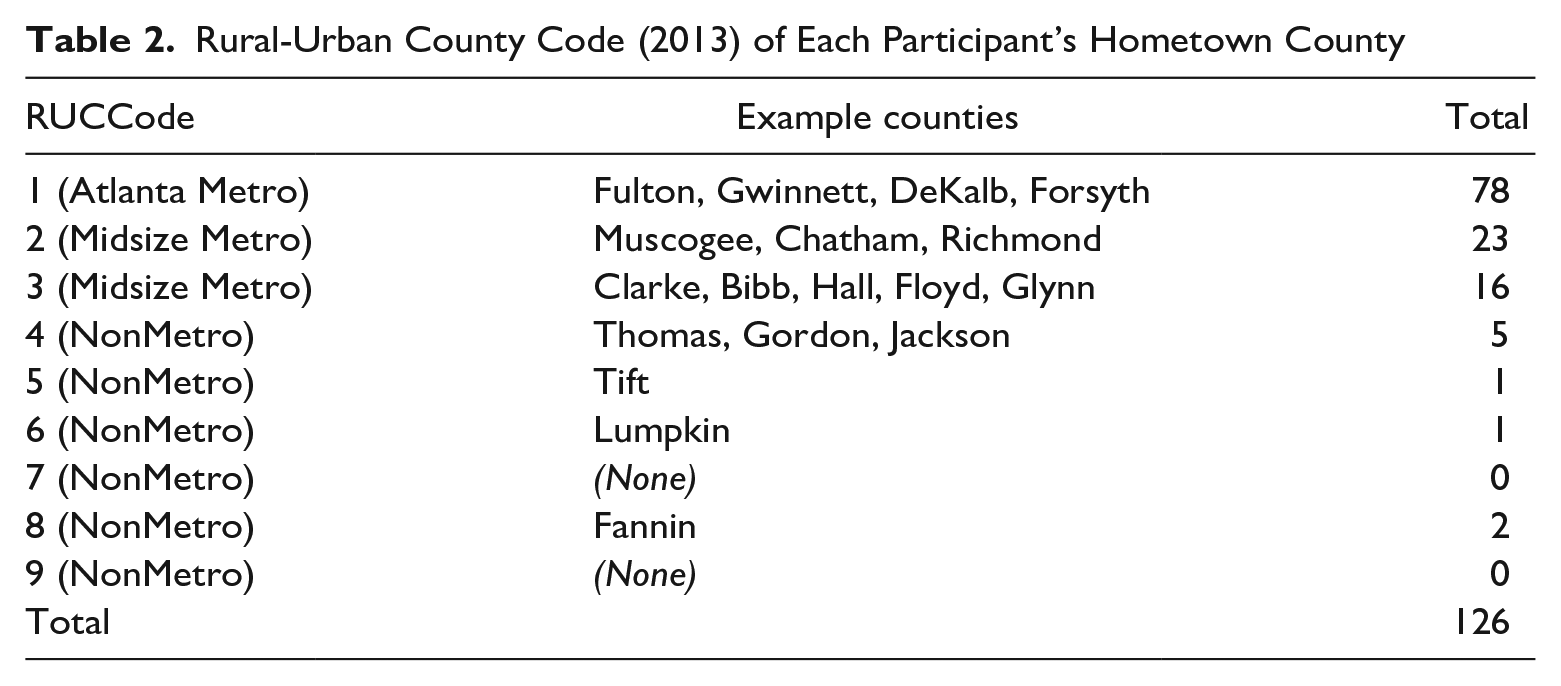
If someone reported living in multiple counties before college (excluded from Figure 1), we chose the median of those counties. Most (78/126 = 62%) of our participants hail from the wider Atlanta metropolitan area (Table 2), which is assigned the maximally urban RUCCode of 1 for all its all counties (urban counties such as Fulton, suburbs such as Gwinnett, and exurbs such as Forsyth). One third of our participants (39/126 = 31%) come from mid-sized metropolitan counties with an RUCCode of 2 or 3, from areas such as Savannah’s Chatham County or Athens’ Clarke County. The rural RUCCode levels are sparsely represented, with only nine speakers (7 percent) coming from “non-metropolitan” counties with an RUCCode of 4 or above. To handle such sparsity, we define an ordered categorical variable of MetroSize with three levels: AtlantaMetro (RUCCode of 1); MidsizeMetro (2-3); and NonMetro (4-9).
Rural-Urban County Code (2013) of Each Participant’s Hometown County
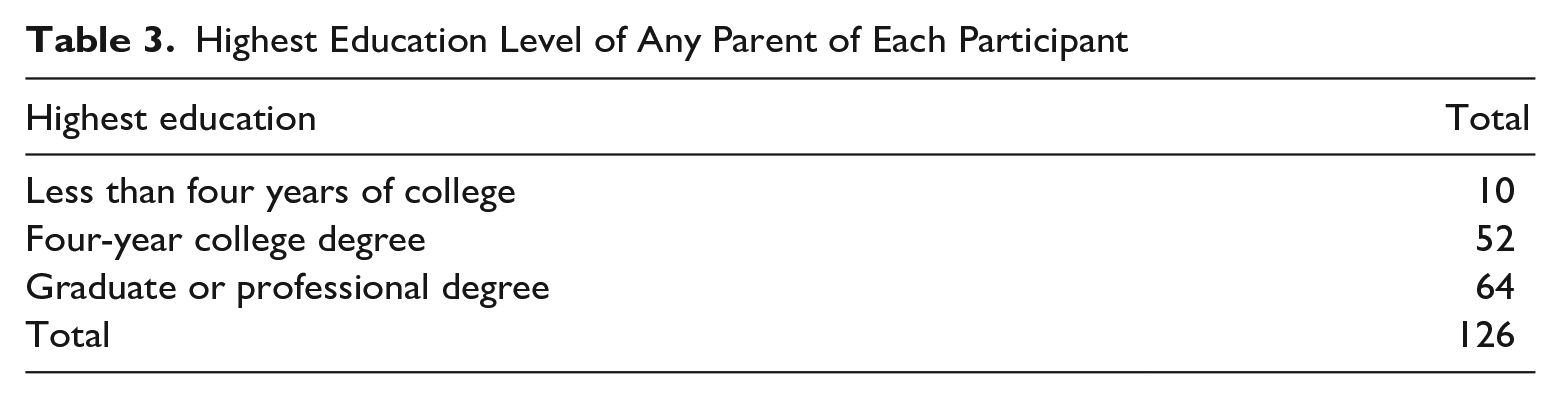
Each participant reported the education of their parent(s), roughly indicating socioeconomic background. For each participant, we calculated the highest education reported for any parent (Table 3). We do not use parental education in our final statistical analysis because our population is relatively homogeneous, reflecting a trend for students at selective universities to come from highly educated families (Astin & Oseguera 2004). Exploratory analyses found no effect of parental education on any vowel under study.
Highest Education Level of Any Parent of Each Participant
Checking for collinearity, linear regressions in R (R Core Team 2012) find no relationship between OverallConservatism (continuous) and gender (binary categorical), MetroSize (ordered factor), or highest education of any parent (ordered factor). Nor is any relationship found between parents’ highest education and MetroSize. Rural people tend to be more conservative than urbanites at a national level (Scala & Johnson 2017; Gimpel, Lovin, Moy & Reeves 2020), and we find (Figure 2) that our speakers from Atlanta have a lower mean conservatism than those from non-metro areas. But this trend is not significant in a linear regression, perhaps because we have too few rural speakers to detect it or because people who attend selective universities are not representative of rural people overall.
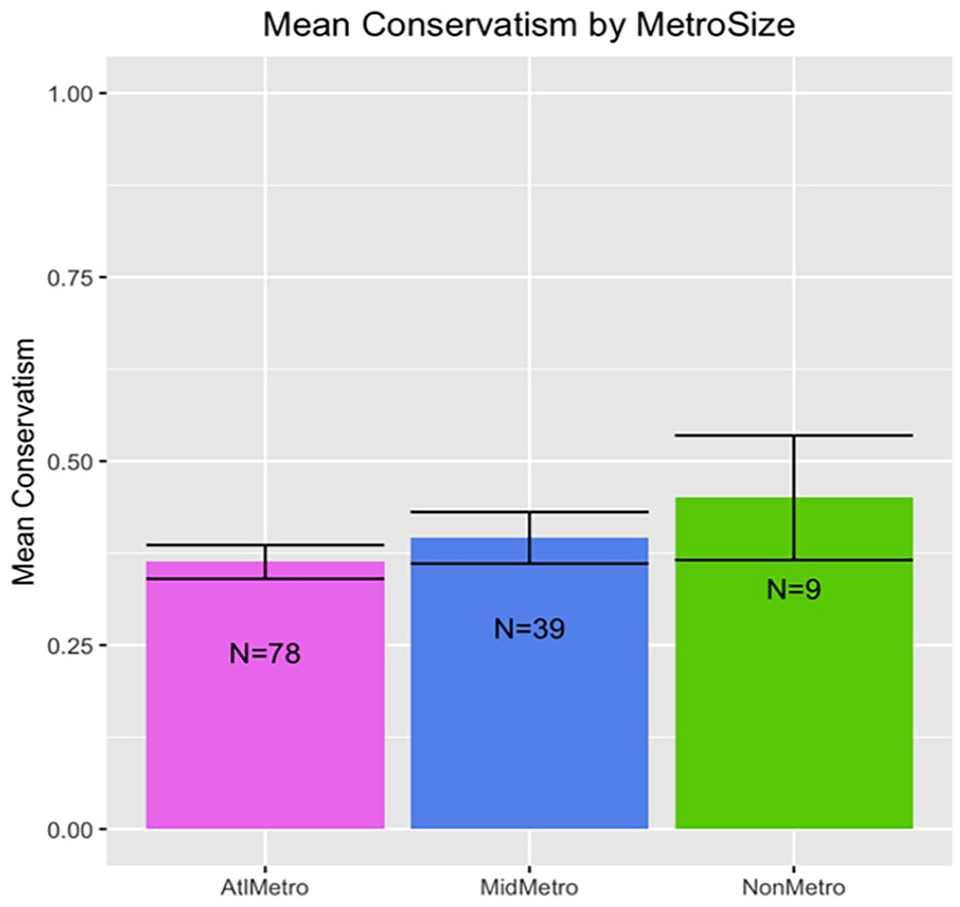
Speakers’ Mean Conservatism by MetroSize of Their Hometown County
Having introduced our participants, we turn to the analysis of their vowel measurements.
4. Phonetic Analysis
4.1. Hypotheses
We begin by setting out the hypotheses that guide our statistical modeling. All of these hypotheses were constructed prior to data collection, so we present them as hypotheses rather than findings. In all cases, the dependent variable is a vowel diagonal (normalized F2-F1; Labov, Rosenfelder & Fruehwald 2013), jointly measuring frontness and height. The more-“Southern” variant is reflected by a lower diagonal for FACE, and a higher diagonal for DRESS and TRAP at 35 percent duration. For PRIZE, a monophthongal (Southern) realization should stay low and back at 80 percent duration, while a diphthongal variant should raise and front. The independent variables consist of demographic and ideological traits from survey data.
The fading of the SVS constitutes a change in progress (Dodsworth & Kohn 2012) and has been found to be led by women (Fridland 2001; Dodswoth & Benton 2019:39-60), who typically lead language changes (Labov 1990), so we predict men to lag behind women in retaining the SVS (1).
(1)
The fading of the SVS (and of other regional White varieties, such as the Northern Cities Vowel Shift) has also been associated with urban speakers (Dodsworth & Kohn 2012; Nesbitt 2018, 2021), reflecting a tendency for language changes to diffuse from cities (Labov 2007). Thus, we might expect that rural speakers should show greater use of the SVS (2).
(2)
Beyond these demographic factors, we predict a speaker’s use or non-use of the SVS to be influenced by their political ideology. This hypothesis is motivated by the social meanings associated with the SVS above (section 2) and by speakers’ qualitative impressions explored below (section 5).
(3)
To preview, we find evidence consistent with all of these hypotheses. Men (1), people from rural hometowns (2), and conservatives (3) use more Southern-shifted variants for several vowels.
4.2. Statistical Analysis
For each vowel, we used a function in R to compare multiple mixed-effects linear regression models in the lme4 package (Bates, Mächler, Bolker & Walker 2015). All models include random intercepts for speaker; word; discourse context (interview versus reading passage); and covid protocol (distinguishing those who talked to the interviewer in-person versus via Zoom, as described above; note that all participants were recorded on the Audio-Technica microphone rather than a computer). We do not include a random effect for the interviewer because it would be partly collinear with each speaker (since some members of the student research team only interviewed one speaker), but we acknowledge that our interviewees may have accommodated their speech to the interviewer (Rickford & McNair-Knox 1994; Kendall 2013:158-181) in ways that vary across the corpus.
As for the fixed effects, the most basic model (Model (4)) includes phonological factors, known to affect vowel realization in ways unrelated to our social hypotheses: the log-transformed duration of the vowel, the place of articulation of the following sound, and—if applicable—the voicing of the following sound. (We only study PRIZE in pre-voiced contexts, so we omit voicing of the following sound in those models.)
(4)
The next model adds demographic factors, motivated by prior literature as well as our own hypotheses: gender (binary categorical) and MetroSize (ordered categorical).
(5)
Next (Model (6)) we add the ideological predictor of a speaker’s OverallConservatism (taking the original 0-100 scale and z-score normalizing it), reflecting our own hypothesis. Model (6) is the maximal additive model, including all predictors motivated by our hypotheses.
(6)
Next, we consider a model allowing demographic and ideological predictors to interact (7).
(7)
The nested structure of these models is motivated theoretically, in that the linguistically fundamental predictors are always included within the more exploratory demographic and ideological ones. Any effect of OverallConservatism will therefore control for gender and MetroSize as well as phonological context, helping to ensure that such an effect is not spurious.
With four different vowels (FACE, DRESS, TRAP, PRIZE) and multiple candidate models per vowel, we follow a consistent procedure (a function in R) to compare models. First, following the advice of Gelman and Hill (2007) and Sonderegger (2023) to consider all theoretically motivated predictors, we explore the “maximal-additive” model (6). If a predictor is found meaningful there, then it is meaningful even when controlling for all other factors hypothesized to affect the vowel’s realization.
Next, we check which of the nested models is deemed by the corrected version of the Akaike Information Criterion (the AICc; Akaike 1974; Sugiura 1978) to show the “best” combination of data coverage and parsimony (“best-nested”). If a predictor is truly meaningful, it should improve the model’s predictive power to a degree that it leads to a better (lower) AICc.
On the other hand, when such models are compared using the AICc, their nested structure creates a problem: an unhelpful predictor could hide the effect of helpful ones added on top of it. These nested models assume that more-basic predictors should always be included in a model along with less-basic ones; but it is valuable to explore which predictors emerge as helpful when that assumption is suspended.
To explore this possibility, we use the Buildmer package (Voeten 2020) to carry out stepwise backward elimination of predictors deemed unhelpful by the AIC, starting from the maximal additive model (6), and again from the maximal interaction model (7). While Sonderegger (2023: 142) warns that stepwise elimination “should never be used as the only tool for variable selection,” we examine it critically as one among several tests to probe the effect of a hypothesized predictor. Finally, we compare all models, both the nested ones and those that emerge after stepwise variable selection, with respect to the AICc to find the one that emerges as the “best-overall.”
In sum, for each vowel, we examine the “maximal additive” model (6); the “best-nested” of the nested models (4)–(7) according to the AICc; the “best-stepwise” models after stepwise elimination of unhelpful predictors beginning from the maximal additive and maximal interaction models (6)–(7); and the “best-overall” model from among all these candidates. By comparing multiple models for each vowel, the analysis is more complicated to read, but also more transparent in that we explicitly test a baseline using only the phonological factors known to shape vowel realization, and ask whether our social and ideological factors meaningfully improve upon it.
These methods were used to analyze FACE, DRESS, TRAP, and PRIZE. The results for all four vowels are summarized in Figure 3; Table 4 gives the output of the “maximal additive” models (6).
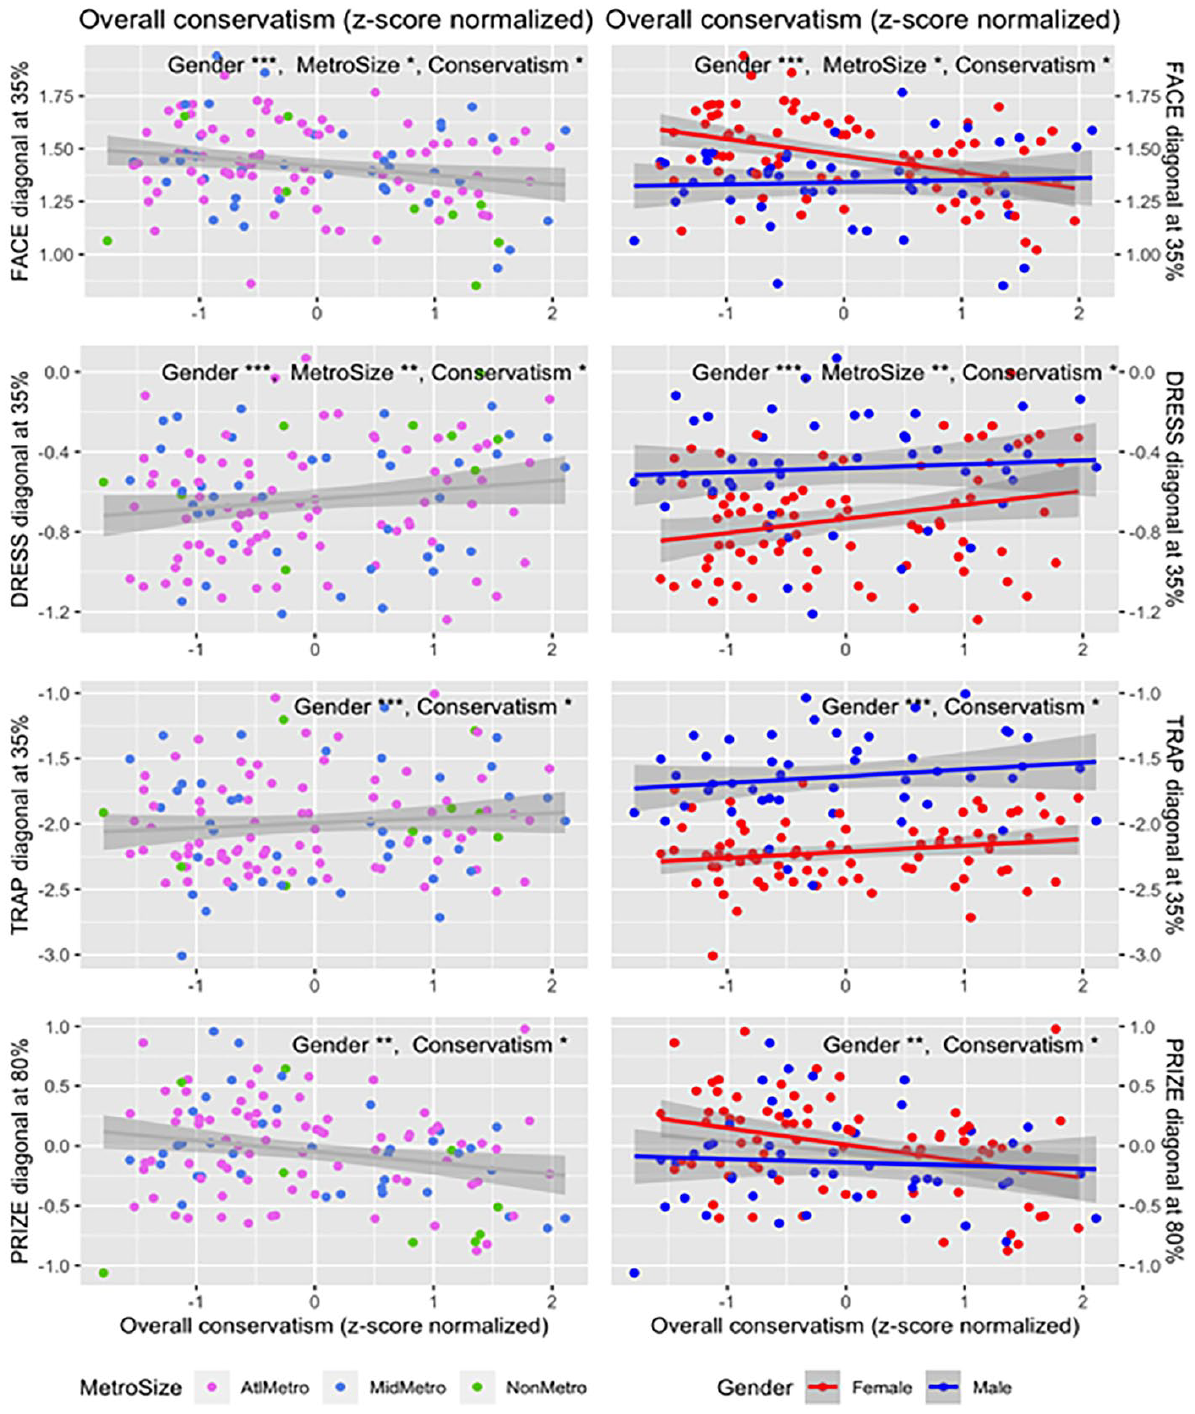
Each Speaker’s Mean Diagonal for FACE, DRESS, TRAP, and PRIZE, Color-Coded by MetroSize and Gender (Colour version of the Figure is available online.)
Beta Coefficients (from the Maximal Additive Model) for Each Vowel
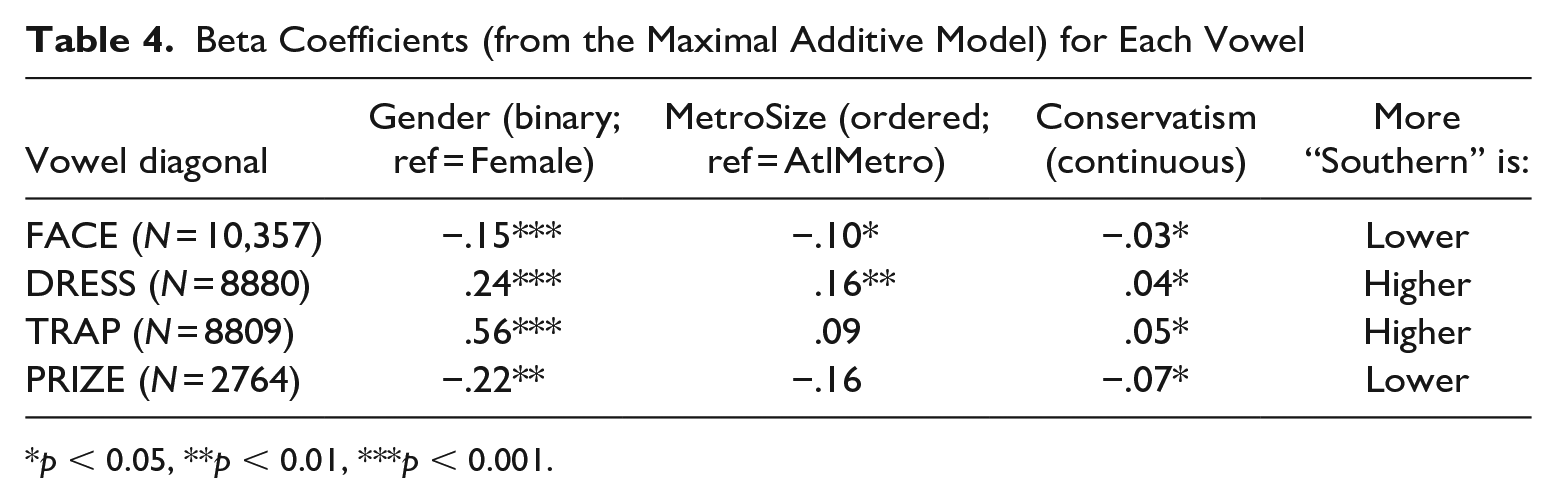
p < 0.05, **p < 0.01, ***p < 0.001.
4.3. FACE: Predicted by Gender, MetroSize, and OverallConservatism
For FACE, the AICc’s “best-overall” model finds effects of gender (β = −.15, t(120) = −4.81, p < .001), MetroSize (β = −.10, t(118) = −2.54, p = .013), and OverallConservatism (β = .03, t(119) = −2.12, p = .036), such that a lower (more “Southern”) diagonal is found strikingly for men, and more subtly for rural people and conservatives.
These effects (gender, MetroSize, OverallConservatism) persist in the maximal additive model (6). The “best-nested” model by the AICc is (5), including gender and MetroSize but not OverallConservatism. The “maximal interaction” model (7) finds a clear effect of OverallConservatism (β = −.11, t = −4.89, p < .001) as well as an interaction between gender and OverallConservatism (β = .09, t = 3.42, p < .001), such that liberal women have a particularly high/front (non-“Southern”) FACE; but this model has a higher (worse) AICc than simpler alternatives.
In sum, for FACE, lower/backer (more “Southern”) tokens are found for men, rural people, and conservatives.
4.4. DRESS: Predicted by Gender, MetroSize, and—in Some Models—OverallConservatism
For DRESS, the AICc’s “best overall”—which is also the “best-nested” model—finds a significant effect of gender (β = .24, t(124) = 5.21, p < .001) as well as MetroSize (β = .17, t(121) = 2.76, p < .01), such that men and people from rural hometowns have a higher/fronter (more “Southern”) DRESS.
These effects persist in the maximal additive model (6). This maximal additive model also finds a small effect for OverallConservatism (β = .04, t(120) = 2.03, p = .04), but it is only marginally significant and is not included in the AICc’s best models.
For DRESS, higher/fronter (more “Southern”) tokens are found for men and people from rural hometowns. Depending on how the best model is selected, a subtle effect is also found for conservatives.
4.5. TRAP: Predicted by Gender and OverallConservatism
Turning to TRAP, the AICc’s “best-overall” model finds significant effects of gender (β = .55, t(119) = 12.09, p < .001) as well as OverallConservatism (β = .05, t(120) = 2.25, p = .028), such that men and conservatives have a higher/fronter (more “Southern”) TRAP.
These effects persist in the maximal additive model (6). The “best-nested” model (5) includes only the demographic predictors of gender and MetroSize, but the stepwise variable selection drops MetroSize and adds the ideological predictor of OverallConservatism. Thus, stepwise selection allows OverallConservatism to emerge as meaningful when we test it independently of MetroSize.
For TRAP, higher/fronter (more “Southern”) tokens are found for men and conservatives.
4.6. PRIZE: Predicted by Gender and OverallConservatism
For the PRIZE vowel in pre-voiced contexts, the overall “best” model according to the AICc includes a significant effect of OverallConservatism (β = −.07, t(119) = −2.24, p = .027) as well as gender (β = −.21, t(118) = −3.07, p < .01), such that men and conservatives show a lower/backer (more monophthongal, more “Southern”) realization at 80 percent duration.
The effects of gender and conservatism persist in the maximal additive model (6), but no effect is found there for MetroSize. Thus, the “best-nested” model is the simplest model (4), including only phonological factors. When stepwise selection is used to discard MetroSize as unhelpful, we find a simpler and more explanatory model that uses gender and OverallConservatism but not MetroSize, which emerges as the “best overall.”
For PRIZE, we find lower/backer (more monophthongal, more “Southern”) tokens for men and conservatives.
4.7. Quantitative Results: Discussion
Combining these results (shown in Figure 3 and Table 4), we find evidence consistent with the hypotheses set out above.
As predicted (8), men show more Southern-shifted variants for all four vowels, with highly significant p values and large effect sizes. These findings make sense if the fading of the SVS and the rise of the LBMS constitute changes in progress, typically led by women.
(8) (a) Consistent with our data for FACE, DRESS, TRAP, and PRIZE.
Consistent with (9), we find that speakers from rural hometowns show more Southern-shifted variants for FACE and DRESS. The effect of MetroSize is slight, perhaps because only a few of our speakers come from rural hometowns.
(9) (a) Consistent with our data for FACE and DRESS.
Finally, consistent with (10), we find that conservatives overall show subtly more Southern variants of FACE, TRAP, and PRIZE. In the maximal additive model (but not the AICc’s “best-overall” model), this effect is also found for DRESS.
(10) (a) Consistent with our data for FACE, DRESS, TRAP, and PRIZE.
It is notable that, for PRIZE, the effect of conservatism found in the maximal additive model is about a third as large (β = −.07) as the effect of gender (β = −.22)—whereas for other vowels, the effect of conservatism is relatively smaller (Table 4). It is often suggested (Dodsworth & Kohn 2012; Reed 2016; Wade 2022) that PRIZE is the most iconic and salient feature of the SVS. We speculate that the metalinguistic greater awareness of this variable may drive its strong connection to political ideology above and beyond the usual demographic factors that condition subconscious changes in progress.
Stepping back, these results show that the maintenance or loss of the SVS in Georgia is predicted not just by the expected demographic factors, but also by a speaker’s political ideology, which we suggest may shape their attitude toward the politicized social meanings evoked by the SVS. Depending on one’s criteria for model selection, we detect statistically significant effects in the predicted direction for three or four of our four vowel types: a robust finding.
To concretize these findings, we release two reading passages through the Open Science Framework (https://osf.io/9rvtn/), from participants who explicitly consented to sharing them. Both women are from the Atlanta area. “Victoria” (4799) has an OverallConservatism score of 70 out of 100, while “Zoe” (9827) has an OverallConservatism of 8 out of 100.
5. Qualitative Comments
To interpret the correlation between the SVS and political conservatism, we chart the ideological landscape of Southernness, rurality, education, and politics as described in qualitative comments from our speakers when asked about social and political meanings of southern accents at the end of the interview.
5.1. Rurality, the South, and Southern Accents
In response to questions such as “Do you consider yourself to be a Southerner?” and “What does that mean; what are Southerners like?,” many speakers link Southernness to rurality and the idea of “country”:
(11) “Southerner uh to me means country, definitely not from like a city, very like rural area; you either own a farm, live on a farm, or like your family works on a farm.” (6081 “Trevor” from DeKalb County; RUCCode = 1, conservatism = 31/100)
(12) “[My friend] is very Southern, drives a big old pickup truck, and as country as could be.” (6500 “Brady” from Newton County; RUCCode = 1, conservatism = 67/100)
This connection between Southernness and rurality is a frequent association in the folk dialectology literature, and the explicit equation of Southernness with “country” follows previous work (Hall-Lew & Stephens 2012). Many participants discuss both place-linked and behavior-linked aspects of “country,” such as rurality, farms, hunting (with guns), and pickup trucks.
Rurality, and by extension, dress and behaviors coded as rural, are linked not just to Southernness but to the “Southern accent.” Describing acquaintances with Southern accents, speakers mention those who participate in rural activities such as fishing, driving trucks, and hunting (which, again, implicates the partisan issue of gun ownership).
(13) “My friend [. . .] he’s like on the bass fishing team at Georgia College, very like what you think of as a country guy, so he definitely has the most Southern accent of anyone I know.” (5022 “Marisa” from Muscogee County; RUCCode = 2, conservatism = 60/100)
(14) “[The kids with Southern accents at my school] were definitely redneck circles I mean the kids who’d go around wearing like boots everywhere; usually they were really proud of having a truck and fishing and hunting.” (5012 “Gary” from Paulding County; RUCCode = 1, conservatism = 55/100)
Here, we see the enregisterment of language to places, people, and behaviors. Both participants draw boundaries around themselves, using examples from “friends” and out-groups to showcase the activities performed by people with Southern accents. The archetypal “country guy” exemplifies a true Southerner, co-occurring with identifications as “redneck,” a term which often has negative connotations (Shirley 2010; Hall-Lew & Stephens 2012).
Because Southernness is tied to rurality, the geographically southern city of Atlanta—home to over half of Georgia’s population—is ideologically separated from the South:
(15) “From my perspective, Southern is like rural versus city and [. . .] Atlanta’s like one of the bigger cities so I’ve never really connected to like the Southern stereotypes.” (9801 “Liam” from DeKalb County; RUCCode = 1, conservatism = 25/100)
(16) “I think if you live in Atlanta or metro Atlanta—I know because I do live in that area—you’re not going to be that Southern.” (6081 “Trevor” from DeKalb County; RUCCode = 1, conservatism = 31/100)
Atlanta is disconnected from the South not just because it is urban, but because it is home to many new arrivals from elsewhere:
(17) “I sort of take Atlanta as uh its own entity that’s sort of just been sort of been put in Georgia just owing to the people um coming from different states [. . .] it’s less representative of what Georgia was traditionally than the rest of the state might be.” (8347 “Jonas” from Fulton County; RUCCode = 1, conservatism = 37/100)
Atlanta is considered non-Southern in terms of accent as well as culture, with Atlantan speakers intuiting the finding (Thomas 1997; Dodsworth & Kohn 2012) that the SVS is fading in urban areas and thus citing their urban hometown as the reason that they do not consider themselves to have a “Southern accent.”
(18) “At least the way in my mind I see things [. . .] is that we don’t really have any accent at all and [that] might just be the outcome of living in a city or near a city.” (9906 “Hamilton” from Henry County; RUCCode = 1, conservatism = 80/100)
This separation of Atlanta from the South further cements the linkage between Southernness, rurality, and Southern accents.
5.2. Southern Accents and Perceptions of Education
As previewed above (section 2), speakers are aware—even if they themselves disagree—that the SVS is perceived to connote low education or lack of intelligence (Campbell-Kibler 2007; Lippi-Green 2022:214-230). Many of our participants explicitly reject such an association, but acknowledge it as a stereotype held by others:
(19) “I think it’s kind of not emphasized enough in society that like just because you’re from the South doesn’t mean you’re uneducated.” (5148 “Vivian” from Chatham County; RUCCode = 2, conservatism = 15/100)
However, some speakers suggest that the linkage between Southern features and low education reflects reality, because they believe Southern and rural areas possess low-performing school systems:
(20) “Yeah [a Southern accent] makes you definitely seem like dumber honestly [. . .] cause you know like the education system in the South is just not as great in other parts of the country which is just like a horrible thing to say.” (3600 “Kayla” from Cobb County; RUCCode = 1, conservatism = 14/100)
(21) “A lot of people with heavy Southern accents are probably not from the cities that probably have better school systems and university systems.” (1739 “Lucas” from Fulton County; RUCCode = 1, conservatism = 36/100)
Other speakers suggest the inverse statement of the same ideology, namely that higher education leads to regionally unmarked speech patterns:
(22) “I think I have less of a dialect because of the higher education.” (3747 “Andrew” from Gwinnett County; RUCCode = 1, conservatism = 22/100)
(23) “I have noticed that like a lot of people on [our college] campus don’t really have that thick Southern accent [. . .] just because you want to be able to communicate clearly with like people from all different backgrounds.” (5023 “Sean” from Forsyth County; RUCCode = 1, conservatism = 53/100)
In other words, our participants acknowledge existing wider ideologies connecting Southern accents to low education or intelligence, but many of them explicitly reject such ideologies themselves, engaging them by offering counterexamples. Some participants link Southern accents to a lack of education; others suggest that higher education lessens Southern accents, evoking a hegemonic standard language ideology (Bourdieu 1991:46-65; Milroy 2001; Lippi-Green 2022:55-63) whereby regionally unmarked features facilitate clear communication with diverse audiences.
5.3. (Non)-Southern Accents and Political Beliefs
Finally, speakers commented directly on the connection between Southern accents, unmarked regional accents, and perceptions of political beliefs. Some speakers suggest that Southern features connote political conservatism, or at least that others may think so:
(24) “When I hear a very like thick Southern accent [. . .] I know it’s not necessarily right but I do assume that they’re more conservative politically, probably more Republican.” (7791 “Elena” from Bibb County; RUCCode = 3, conservatism = 20/100)
(25) “I feel like most people who have like a Southern drawl or something like that are supposed to be like you associate them with like Republicans.” (4013 “Ben” from Thomas County; RUCCode = 4, conservatism = 66/100)
While Southern accents are thought to connote conservatism, some speakers observe that regionally unmarked accents are also politically unmarked, rather than symmetrically connoting a liberal orientation:
(26) “I guess I kind of like associate people with a more Southern accent as more Republican [. . .] But I guess like you know having not having an accent doesn’t lend itself to either side.” (4281 “Mina” from Hall County; RUCCode = 3, conservatism = 24/100)
(27) “I feel like it’s kind of one-sided, like if I hear someone with a Southern accent I’m more likely to think they’re conservative; but if I hear anyone else then I don’t really think about their politics at all.” (5038 “Noah” from Muscogee County; RUCCode = 2, conservatism = 60/100)
We saw above that Southern features are linked to perceived low education, but the absence of Southern features does not symmetrically imply advanced education. In the same vein, Southern features may signal conservatism, but the absence of Southern features does not convey leftism. In both cases, a regionally unmarked speaker is free from initial stereotypes, reflecting the hegemony of standard varieties (Lippi-Green 2022:46-65).
When asked about politics and Southern accents, many participants suggest that language evokes attributes (rurality, hunting and associated gun ownership, low education) which in turn, may point to political leaning. These narratives echo arguments for indirect indexicality (Ochs 1992; D’Onofrio 2020), where broader categories like “gender” or “class” may not be indexed directly with individual features, but rather emerge through the constellation of several features together. Here, participants suggested that politics may be indirectly indexed through the more immediate connections to region, place, or education.
Because the South has voted Republican in recent decades, speakers suggest that there may be a correlation (though, they caution, not necessarily a causal relation) between Southern features and political conservatism:
(28) “You’re in the South, you have a Southern accent and if you’re in the South, you’re in the Bible Belt so there is correlation, but you do learn in in statistics like everyone says correlation doesn’t mean causation.” (5537 “Abraham” from Bryan County; RUCCode = 2, conservatism = 82/100)
(29) “I think it’s more of a correlation, like because I guess for example like [most states] in the South are Republican states and it’s not necessarily because they have a Southern accent it’s more so just geography and just the politics of the area.” (5034 “Colin” from Muscogee County; RUCCode = 2, conservatism = 25/100)
Speakers link Southern accents to political conservatism not just because they see the South as conservative holistically, but also because, within the South, they connect these features to rural areas and rural areas to conservatism:
(30) “If you have like some sort of Southern accent or you sound like a redneck or you’re from the backwoods, somebody’s going to think you have a shotgun in the back of your car and if you have a shotgun then you are a Republican.” (3086 “Victoria” from Douglas and Haralson Counties; RUCCode = 2, conservatism = 70/100)
(31) “I feel like definitely the Southern accent gets more pronounced as you move out of urban areas and I think that’s demographically speaking like those are places with more conservative beliefs typically.” (4242 “Rafael” from DeKalb County; RUCCode = 1, conservatism = 8/100)
Conversely, speakers link urban areas to regionally unmarked accents and to liberal politics:
(32) “My political beliefs and my accent have been shaped by where I grew up, Atlanta, um, and it’s a very urban place so [. . .] it changes how I, how I view politics, maybe just cause they, were formed in the same atmosphere, environment.” (9766 “Karl” from Fulton County; RUCCode = 1, conservatism = 18/100)
(33) “If you surround yourself with a bunch of you know people in a city who are more likely to be um liberal then I think you’re going to talk more like someone from the city.” (1137 “James” from Gwinnett County; RUCCode = 1, conservatism = 28/100)
One liberal speaker further draws a direct connection between low education and conservatism:
(34) “I think that people who are conservative maybe don’t have as full of a view on the world as people who are liberal; um, they tend to be more uneducated.” (5148 “Vivian” from Chatham County; RUCCode = 2, conservatism = 15/100)
In all of these cases, language is linked to politics via an intermediary. The most direct relationship is the region’s overall political character; participants suggest that a regionally marked language variety might, by extension, cause a listener to make assumptions about politics typical of the region. For sociocultural traits, participants return to themes that they have already connected to Southern accents, such as rurality or education. Southern linguistic features evoke enregistered ideas of “rednecks” or “country” (Hall-Lew & Stephens 2012), in turn linked to politics. The same process occurs for education, where first a listener might hear regional features and think a speaker is uneducated, and from there they impute political beliefs.
Although our speakers acknowledge that Southern accents are stereotypically associated with political conservatism, dozens of them caution that people should not be pre-judged by their accent:
(35) “I am very strongly against judging people for their accent no matter what kind of accent it is.” (9909 “Genevieve” from Cobb County; RUCCode = 1, conservatism = 37/100)
(36) “I don’t think you can judge someone’s political beliefs based on their accent or where they’re from; there’s a variety of people everywhere you go so I would never just immediately assume someone’s one thing or another.” (3842 “Daniel” from Gwinnett and Cobb Counties; RUCCode = 1, conservatism = 60/100)
In sum, our speakers suggest that Southern accents may be stereotyped to evoke conservatism based on the voting history of the South, or by extension from their ideological connections to rurality or education. On the other hand, they contend, one cannot presume a person’s political beliefs based on their accent. This tension between subconscious semiotic links and conscious denial of bias, however, reveals a social pressure to use or eschew Southern features. Our speakers may not consciously pass judgment on these features, but they acknowledge that other people may do so.
5.4. Qualitative Results: Discussion
Although Georgia is rapidly urbanizing, we find that speakers associate Southernness and Southern accents with rurality, which they in turn associate with conservatism based on “redneck” stereotypes and on the rural/urban polarization of American politics (Gimpel, Lovin, Moy & Reeves 2020). They connect Southern accents to low education, which they link to conservatism based on the recent voting patterns of non-college-educated White Americans (Carnes & Lupu 2021). Many speakers caution that such generalizations should not be used to pre-judge people based on their speech, but acknowledge that these associations are widely indexically available.
Thematically, much of the discussion of politics and language echoes arguments made by D’Onofrio and Benheim (2020). They suggest that the decline of the NCVS “may not constitute orientation away from the locale itself, but rather from particular [NCVS]-linked racialized and classed Chicagoan personae” (D’Onofrio & Benheim 2020: 471) such as that of a working class Irish Catholic. In this way, speakers’ retreat from a regional vowel system reflects dis-affiliation from particular enregistered character types associated with it. Parallel to the fading NCVS in Chicago, we argue that some Southern features may be retreating among young liberal speakers in Georgia not because they completely dis-affiliate from the South, but because they dis-affiliate from a stereotyped White “country” Southerner (Hall-Lew & Stephens 2012), a character type they associate, by extension, with political conservatism.
Note, however, that this rejection reifies existing language ideologies into concrete social facts. Much of the discourse explaining why people do or don’t have Southern accents references factors such as education, urbanity/rurality, or desire for clear communication. The asymmetrical valuation of accents reflects the hegemony of standard language and the construction of unaccentedness (Lippi-Green 2022:55-63). The opposite of having Southern features is not “sounding liberal,” but not having to be stereotyped along this axis at all. The most common theme in the qualitative data is not a renegotiation of Southern language and meaning, but of possible negative evaluations of Southern speech. Consequently, the observed statistical effects may arise not because conservatives embrace Southern features, but because liberals are particularly motivated to eschew them.
The indirect connection between language and political orientation evidenced by our speakers may also explain why the statistical effect size of political ideology is not large in our data. If speakers are directly engaging with enregistered stereotypes tied to education and rurality, then the connection to politics arises indirectly (Ochs 1992), moderating any statistical effects. This multi-step process echoes the proposed intermediate semiotic position of personae in variation (D’Onofrio 2015, 2020; King 2021). Notably, the variable with the largest effect size is PRIZE: the most iconic, stereotyped vowel in the Southern Shift (Reed 2016; Wade 2022). We suggest that PRIZE may allow for more direct, conscious manipulation by speakers because this variable enregisters a connection to White country stereotypes.
6. Conclusion
This paper finds evidence for a connection between White speakers’ political beliefs and their use of vowels implicated in the Southern Vowel Shift. We find that for FACE, DRESS, TRAP, and PRIZE, a speaker’s vowel realization is strongly predicted by their gender, with men using more “Southern” variants—lagging women in a change-in-progress away from the SVS. For FACE and DRESS, a smaller effect is found for hometown, with more rural speakers using more “Southern” variants (lower/backer FACE, higher/fronter DRESS). For FACE, TRAP, marginally for DRESS, and most strongly for PRIZE, we also find small effects of self-reported political orientation as quantified by feelings thermometers, with conservatives using more-“Southern” (lower/backer FACE, higher/fronter DRESS and TRAP, more monophthongal PRIZE) than liberal speakers.
Thus, we propose that certain elements of Georgia’s traditional “Southern accent” are fading faster among speakers who dis-affiliate from the social meanings of rurality and conservatism that are indexically associated with it in their metalinguistic commentary. In this rich semiotic landscape, we look forward to work further examining the social perceptions of Southern accents by both Southern and non-Southern listeners, as well as the effect of such perceptions on production choices. We are also working to analyze the non-White speakers whom we set aside here to broaden the linguistic picture of our diversifying state.
Footnotes
Appendix
“OverallConservatism” was collated from 100-point feeling-thermometers about twelve politicized topics inspired by Everett (2013). Six topics relate to culture, six to economics. Table A1 shows these topics and the corresponding versions in Everett (2013), adapted to suit the changing political climate: for example, Everett’s topic of “traditional marriage” is less salient now that the Supreme Court legalized gay marriage (Obergefell v. Hodges, 2015), so we reformulated it as “LGBTQ rights.” In Table A1, the asterisk* indicates reverse coding (so that greater conservatism is indicated by subtracting that rating from 100).
For each such topic, participants were asked:
How positive or negative do you feel about
on the scale of 0 to 100, where 0 represents VERY NEGATIVE, and 100 represents VERY POSITIVE?
For all topics not marked by an asterisk, a higher rating on the feeling thermometer was taken to indicate greater conservatism; in contrast, all topics marked by an asterisk* were reverse-coded, so that greater conservatism is indicated by subtracting the feeling-thermometer rating from 100. Across all twelve topics, a participant’s mean rating constitutes their OverallConservatism score.
Acknowledgements
We are extremely grateful to all the speakers who shared their voices with us. We thank the student researchers on Lelia Glass’s “Language and Identity in the New South” research team at Georgia Tech (2021-present), who gathered and transcribed much of the data. Madison Liotta and Madelyn Scandlen helped get this project off the ground in its early days, Marcus Ma’s Bed Word speech-to-text tool made transcription far less onerous, and James Stanford encouraged Lelia to welcome undergraduates into research through sociophonetics. We are also indebted to the editors and reviewers of the journal for very constructive feedback. This project was supported at Georgia Tech by the Digital Integrative Liberal Arts Center (DILAC) and the Vertically Integrated Projects program.
Declaration of Conflicting Interests
The author(s) declared no potential conflicts of interest with respect to the research, authorship, and/or publication of this article.
Funding
The author(s) disclosed receipt of the following financial support for the research, authorship, and/or publication of this article: This project was supported at Georgia Tech by the Digital Integrative Liberal Arts Center (DILAC).