
Abstract
In this paper, we introduce a method for mapping lexical innovation, which we then use to track the origin and spread of new words on American Twitter, based on a multi-billion-word corpus of Tweets collected between 2013 and 2014. We first extract fifty-four emerging words from the corpus by searching for words that are very uncommon at the end of 2013 but whose use rises dramatically over the course of 2014. We then map the origin and spread of each of these words. Based on these results, we identify five main regional patterns of lexical innovation on American Twitter, primarily associated with the West Coast, the Northeast, the Mid-Atlantic, the Deep South, and the Gulf Coast. We conclude by proposing explanations for these results and by discussing their significance to theories of language variation and change, including both the actuation and diffusion of lexical innovations.
1. Theories of Linguistic Innovation
Lexical innovation has been studied from various perspectives. Linguists have long catalogued the processes through which new words are formed (Miller 2014) and tracked how the meanings of words change over time (Geeraerts 2010). More recently, researchers have focused on how words become lexicalized as they gradually settle in on particular forms and meanings and how words become institutionalized as they enter into the standard vocabulary of a language (Brinton & Traugott 2005). Lexicographers have also devoted considerable effort to identifying and defining neologisms, including through the analysis of newspaper corpora (Baayen & Renouf 1996) and internet search engine results (Kerremans et al. 2011). Although there has been sustained interest from linguists on the formation and development of new words, regional patterns of lexical innovation—both in terms of their origin and spread—have been left largely unexplored. Dialectologists study lexical variation, concentrating on sets of synonyms with clear regional distributions (Kurath 1949; Carver 1987), but dialect surveys usually map the use of well-established or archaic words and rarely consider how their use changes over time. Similarly, lexicographers record details about the geography of words, but dictionaries usually provide far too little detailed information to be the basis of thorough spatial analysis (Dollinger 2016).
Despite the lack of research on regional patterns of lexical innovations, the geographic spread of linguistic change more generally is an active and important area of research in sociolinguistics, with several theories of linguistic diffusion having been proposed (see Britain 2002, 2012; Wolfram & Schilling-Estes 2003). Most notably, the “wave model” predicts that new forms spread out radially from a central location limited only by physical distance, whereas the “hierarchical model” (as well as the more specific “gravity” and “cascade models”) predicts that diffusion is also limited by population density, with forms spreading from one urban area to the next, only later reaching the rural areas in between. Some empirical evidence, primarily related to sound change, has been presented in support of both the wave model (Bailey 1973; Trudgill 1986; Bailey et al. 1993; Boberg 2000; Nerbonne 2010) and the hierarchical model (Trudgill 1974; Callary 1975; Trudgill 1986; Hernández-Campoy 1999), but other patterns of linguistic diffusion have also been observed. For example, in one of the few studies that considers the spread of non-phonological forms, Bailey et al. (1993) propose a “contra-hierarchical model” to explain the spread of fixin to in Oklahoma, which moves from rural to urban areas. Alternatively, Horvath and Horvath (1997) propose a “cultural hearths model” to explain the diffusion of /l/ vocalization in Australia, which first spreads within one cultural region before moving on to the next. Similarly, Boberg (2000) found that linguistic diffusion was slowed by the border between the United States and Canada.
Overall, research on linguistic diffusion has demonstrated that physical distance, population density, and cultural patterns constrain the geographical spread of language change, but the relative strength of these factors is unclear and appears to only partially explain the spread of linguistic innovations. In large part, our understanding of linguistic diffusion is limited because it is difficult to observe the spread of innovations through elicitation. Consequently, only a few innovations have ever been mapped, mostly involving sound change, with the spread of lexical innovations being especially under-researched. In addition, because it is difficult to collect regionalized longitudinal data through surveys and interviews, the spread of linguistic innovations has primarily been mapped over apparent time (i.e., based on the age of informants) and across a relatively small number of locations, further limiting the precision of previous research.
Although our understanding of linguistic diffusion is limited, we know even less about the actuation of linguistic innovations—the motivation for language change and the context in which that change takes place (Walkden 2014)—which Weinreich et al. (1968) identified as the basic problem in the study of language change (see also Labov 2001) and which Croft (2000) identified along with diffusion as one of the two basic problems in the study of language change. 1 The limitations of traditional approaches to data collection are especially clear in this context: there has been so little direct empirical research on linguistic actuation, including from a geographical perspective, because linguists cannot directly elicit the authentic creation of new forms. This situation has even led some linguists to claim that the origins of innovations cannot be observed, only their diffusion (Britain 2012).
Fortunately, corpus linguistics offers solutions to these problems, as it allows for the open-ended analysis of language variation and change in large amounts of natural language data (Szmrecsanyi 2011; Grieve 2015). Admittedly, regionalized corpora have been far too small to observe variation in the use of common content words, much less forms as rare as new words, but this situation has recently changed with the growth of social media. Computational linguists have now begun to analyze incredibly large amounts of geo-coded and time-stamped data harvested online, especially from Twitter, to understand regional patterns of lexical variation and change (e.g., Eisenstein et al. 2010, 2014; Bamman et al. 2014; Doyle 2014; Jones 2015; Huang et al. 2016). For example, Eisenstein et al. (2014) investigated lexical patterns in more than 100 million geo-coded American Tweets collected between 2009 and 2012. After identifying 2603 words of various types whose frequency changed significantly over time, they modelled networks of lexical influence across 200 metropolitan areas and tested the degree to which various external factors explain their structure, finding that ethnicity was a key predictor of diffusion patterns, in addition to space and population density, as predicted by the wave and hierarchical models.
Taking advantage of this new source of language data, this study maps patterns of lexical innovation in American English on a large scale for the first time. To accomplish this goal, we introduce a quantitative approach for the spatial analysis of linguistic innovation, which we use to map the sources of new words and their spread in an 8.9-billion-word corpus of geo-coded Tweets collected from across the contiguous United States between 2013 and 2014. Our study is organized as follows. First, we extract a large set of emerging words from the corpus. Second, we map the origin and spread of each of these words on Twitter. Third, we identify common regional patterns of lexical innovation, including both hubs of lexical innovation and pathways of diffusion. Finally, we conclude by offering explanations for our findings, considering how our results can inform theories about the actuation and diffusion of linguistic innovations, while highlighting the descriptive and methodological contributions of our study.
2. A Corpus of American Tweets
The corpus analyzed in this study represents American Twitter and consists of 8.9 billion words of geo-coded American mobile Twitter data, totaling 980 million Tweets written by 7 million users from across the contiguous United States, posted and downloaded between October 11th, 2013, and November 22nd, 2014, using the Twitter API (http://dev.twitter.com) (see Huang et al. 2016; Grieve et al. 2017; Nini et al. 2017). We focused on Twitter because this variety of language provides a uniquely large and accessible source of geo-coded and time-stamped natural language data. 2 Specifically, our corpus represents mobile Twitter, as geo-coded Tweets are produced when users post on their smartphones with geocoding enabled, resulting in a record of the precise longitude and latitude of the user at the time of posting.
To identify patterns of lexical innovation in American Twitter, we stratified the corpus by both time and geography. The corpus was stratified by day based on the time-stamp information provided with each Tweet. Although the period of time represented by the corpus spans 409 days, in total the corpus includes 399 days, because ten days are missing due to various technical issues that interrupted data collection. The corpus contains an average of 22 million words per day, but ranges from 10 to 29 million words per day. The corpus was stratified by county using the longitude and latitude provided with each Tweet. In total, the corpus contains 3075 county equivalents out of 3108 total county equivalents in the contiguous United States, with missing data primarily occurring in small, sparsely populated counties in the Central States. On average, the corpus contains 2 million words per county, but ranges from 300 to 300 million words per county. Overall, 98 percent of the counties are represented by at least 10,000 words and 79 percent of the counties are represented by at least 100,000 words.
It is important to acknowledge that Twitter cannot be used to track all the emerging words of the English Language. Twitter can provide only a partial picture of lexical innovation, as many words that are emerging in other varieties of English will be absent from Twitter. A different set of emerging words, for example, would likely be found in a corpus of workplace interaction or scientific writing. New words in other varieties might also follow different regional patterns. New scientific vocabulary, for example, might originate from universities and spread along academic networks. Furthermore, the demographics of Twitter will also affect the types of emerging words we identify. Although Twitter is a very popular social media platform, with 21 percent of all Americans using Twitter regularly, including users from a wide range of demographic backgrounds, the user base of American Twitter differs from the general population, with somewhat higher engagement from younger people, African Americans, and urban residents (Duggan & Brenner 2013). 3 Consequently, our analysis will be more likely to identify innovations originating from these specific demographic groups. Despite these limitations, at this time, Twitter is the only variety of language that can be sampled at the necessary scale and with the necessary metadata to allow for the type of analysis reported in this study, providing us with a unique chance to observe regional patterns of lexical innovation in natural language on a large scale.
3. Finding Emerging Words
To map patterns of lexical innovation in American Twitter, we first identified a set of emerging word forms in the corpus, which are relatively new word forms that are entering into general usage on Twitter for the first time. For the purposes of this study, we define a “word form” as a case-insensitive string of alphabetic characters, hyphens, and apostrophes. Notably, this corpus-based definition treats creative spellings and acronyms as distinct forms, as Twitter is a type of written language. We then define an “emerging word form” as a word form that is very uncommon at the start of the period of time under analysis, but whose relative frequency rises over that period of time.
Specifically, we identified potential emerging word forms in the corpus following the procedure described in Grieve et al. (2017). First, we extracted the word forms that occurred at least 500 times in the complete corpus, which amounted to 97,246 distinct types. 4 Second, we calculated the relative frequency of each form in the 2013 segment of the corpus to measure the popularity of the form at the start of the period of time under analysis. Third, we measured the relative frequencies of each of the 97,246 forms across the 399 days in the corpus, normalized to control for variation in the total number of words per day. Fourth, we measured the degree to which the usage of each form showed a monotonic increase over time by comparing the rank of the relative frequency per day of each form to the chronological rank of the day using a Spearman correlation coefficient. Finally, we extracted the 398 forms with a Spearman correlation coefficient larger than .70 and with a 2013 relative frequency smaller than once per million words. These correlation coefficient and relative frequency cut-offs were selected because they are common thresholds in correlation analysis (Hinkel et al. 2003) and corpus linguistics (Biber et al. 1998). Furthermore, they allow for a sufficiently large sample of emerging words to be identified so that common patterns of lexical innovation can be mapped through a multivariate spatial analysis. Setting these values differently would result in a somewhat different sample, but under reasonable settings, a similar core set of forms would be identified and the analyses that follow would be largely the same.
This set of 398 potential emerging word forms was then filtered by hand. First, all proper nouns (e.g., partynextdoor, timehop) were removed from the list to focus on newly emerging word forms as opposed to people and products that happened to become popular over the course of 2014. Three forms, idgt, lituation, and thotful, that were introduced as proper nouns in song titles, were retained, as they were being used regularly outside that context in the corpus. Second, all dictionary words (e.g., feminists, infusion) were removed from the list, using the Merriam-Webster Dictionary for reference, to focus the analysis on the identification of relatively new word formations, as opposed to well-established words whose recent usage might not reflect their origin. Finally, numerous terms, including many acronyms and abbreviations, primarily related to the medical industry (e.g., pacu, cath), whose frequency increased on Twitter in 2014 due to a growing use of geo-coded employment advertisements, were also removed from the list.
Through this process, eighty-one true emerging word forms were identified. These are listed in Table 1, along with a working definition, established through online searches and close readings of Tweets from the corpus containing these forms. The table is organized into fifty-four word lemmas, which were obtained by grouping together all inflected forms and variant spellings. The most common form is listed in the first column. In most cases, the lemma consists of a single form, but some lemmas contain up to eleven forms. This creates an imbalance in the dataset, with certain lemmas represented by far more forms than others, which is especially problematic for the multivariate analysis. We therefore chose to focus our analysis on one form per lemma, specifically the fifty-four emerging word forms listed in the first column of Table 1.
Emerging Words
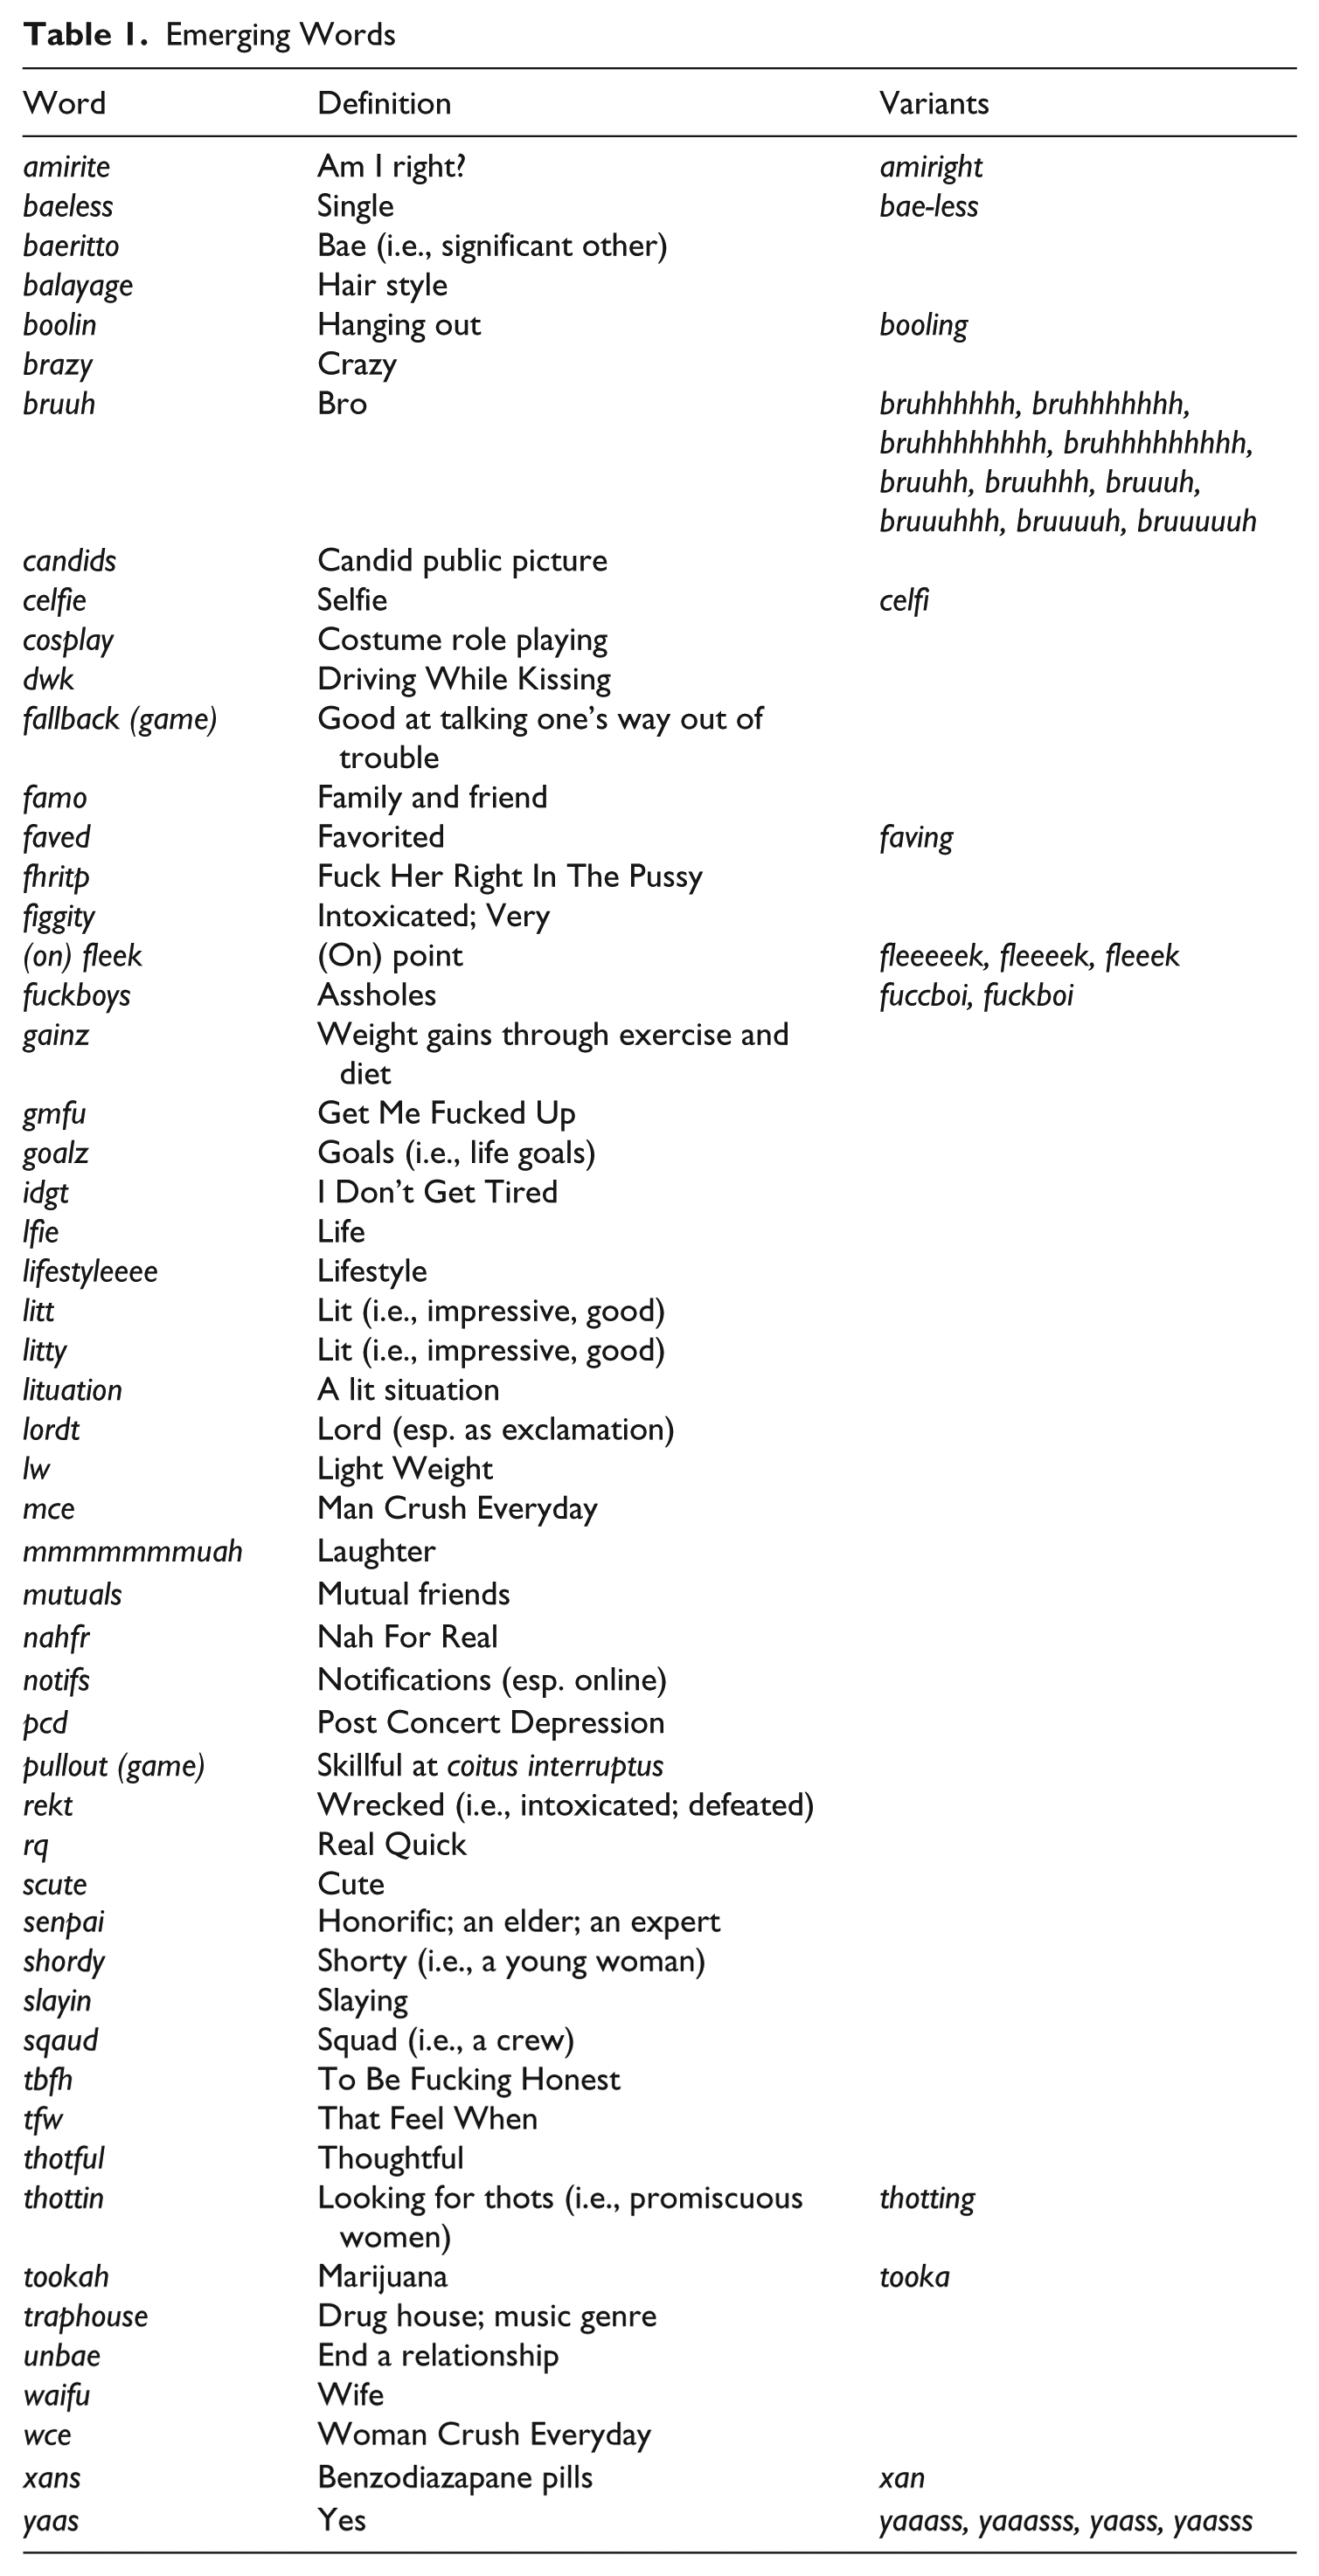
For the most part, these fifty-four words can be characterized as relatively new forms of everyday slang (Green 2011) and appear to be used across various registers, including spoken varieties (Grieve et al. 2017). Common topical domains include family and friends (e.g., boolin, famo), relationships and sex (e.g., baeless, pullout), intoxication (e.g., traphouse, xans), technology (e.g., candids, celfie), and Japanese culture (e.g., senpai, waifu). Most of these words are the result of standard word formation processes, such as compounding (e.g., fuckboys, traphouse), derivation (e.g., unbae, lituation), truncation (e.g., notifs, xans), and blending (e.g., brazy, boolin). The list also includes eleven acronyms (e.g., gmfu, tfw), which represent multiword expressions that generally occur in spoken language, but whose use as acronyms on Twitter is presumably encouraged by the length restrictions placed on Tweets. Similarly, the list contains twelve forms that are spelling variants of established words, which seem to mark non-standard meanings (e.g., gainz, litt) or pronunciations (e.g., bruuh, yaas). Notably, a number of these words appear to be associated with African American English, which is perhaps not surprising given the demographics of the Twitter user base. For example, derivatives of bae and thot were largely popularized through urban music, while brazy and boolin are associated with the predominantly African American Bloods street gang, who often modify existing words by replacing the letter ‘c,’ which is associated with the rival Crips gang, with the letter ‘b’ (Grieve et al. 2017).
4. Mapping Lexical Innovation
There are various ways to map the origin and spread of an emerging word. The simplest approach is to map the relative frequency of the word in all texts from each location in a corpus over a series of time periods, normalized by the total number of words in all texts from that location during those periods. It is also possible to map the cumulative relative frequency of a word by calculating its relative frequency in all the texts from each location from the start of the corpus up to a series of points in time. We prefer mapping cumulative relative frequencies because it helps to further control for variation in sample size across locations, as the amount of data available on a given day in a given county is often very limited, while also highlighting locations where the word had been used in the past, making regional patterns clearer.
For example, we map the cumulative relative frequency per billion words of baeless from the start of the corpus up until eight points in time in Figure 1, where darker shades indicate a high relative frequency in that county, lighter shades indicate a low relative frequency, and white indicates no occurrences of the word, and where the scale is based on the quartiles for non-zero values in the complete corpus. 5 The maps show that the earliest usages of baeless were concentrated in the South in a number of largely discontinuous counties, especially in Georgia. The word then spread through much of the South by the end of the first quarter of 2014, before moving to urban areas farther afield, first to the Midwest by mid-2014, and then eventually to the Northeast and the West. By the end of 2014 the word had spread across most of the country, although its usage was still concentrated in the South.
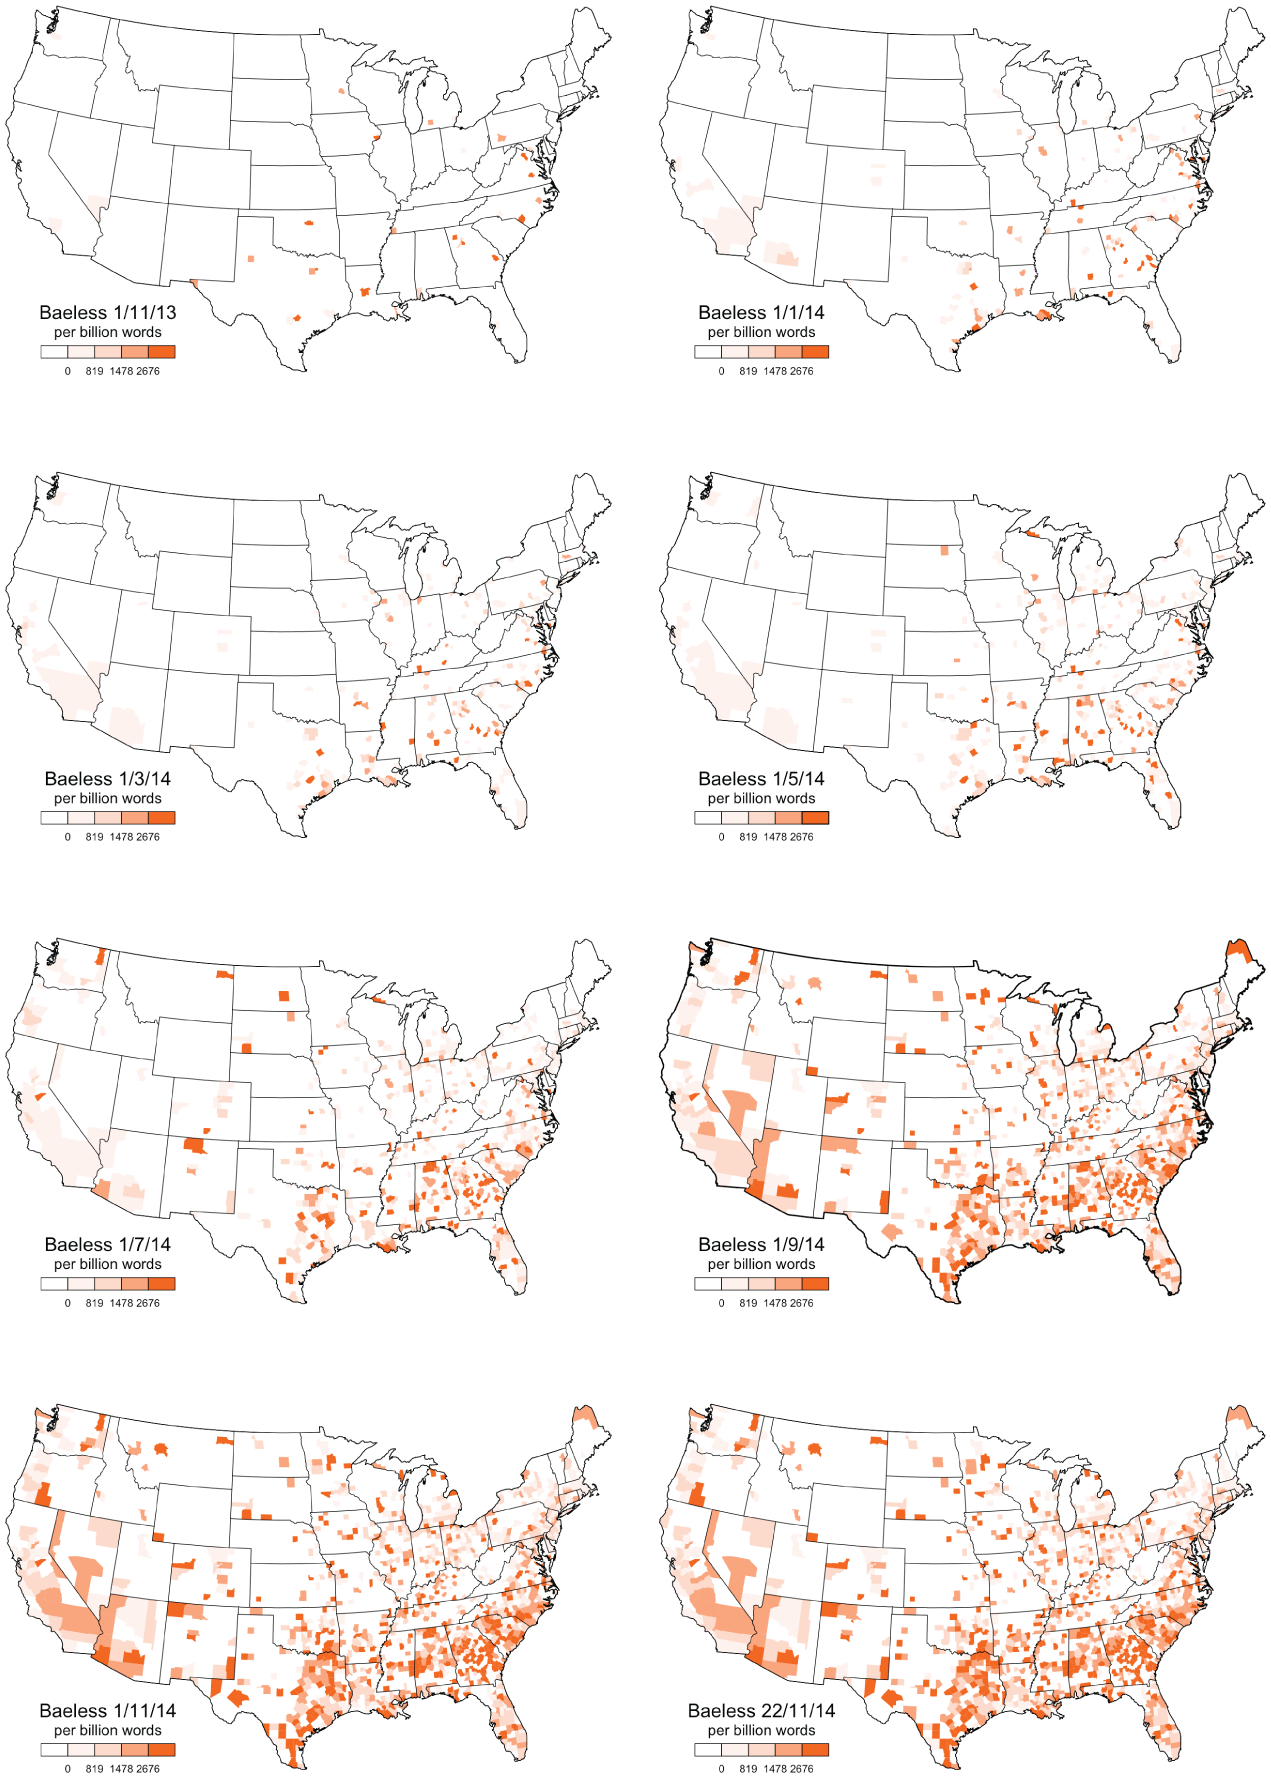
Cumulative Relative Frequency Time Series Maps for Baeless
In addition to a series of maps, it is also possible to plot change in the usage of a word over time on one map, which simplifies not only visualization but also multivariate analysis. There is, however, no standard solution to this problem. A basic approach is to map the relative frequencies of the word for some period of time (e.g., any one of the maps presented in Figure 1), but this ignores change over time, making it difficult to distinguish the origin of a word from its spread. Another approach is to map the time since the word first occurred, but this ignores the amount of data available at each location; in other words, patterns of usage can be obscured by variation in sample size, which tends to correspond to patterns of population density. A better option is to take both types of information into consideration and map the time since the word first reached a specific relative frequency threshold, allowing for the origin and spread of a word to be plotted together, while controlling for variation in the amount of data at each location.
For example, Figure 2 maps the number of days since the cumulative relative frequency of baeless first reached 1087 occurrences per billion words by county, where darker shades indicate the word hit this relative frequency threshold at a relatively early date. We selected a relative frequency threshold of 1087 occurrences per billion words because baeless is used at least this often in 25 percent of counties in the complete corpus, although we could have used another threshold (see below). We then measured and mapped the number of days, relative to the end of the corpus, that had elapsed since the cumulative relative frequency of the word first reached this 3rd quartile relative frequency threshold in each county. These lexical emergence maps appear to successfully represent the underlying patterns visible in the geographical time series, as can be seen by comparing Figures 1 and 2, which both show that the form originates in the South, especially Georgia.
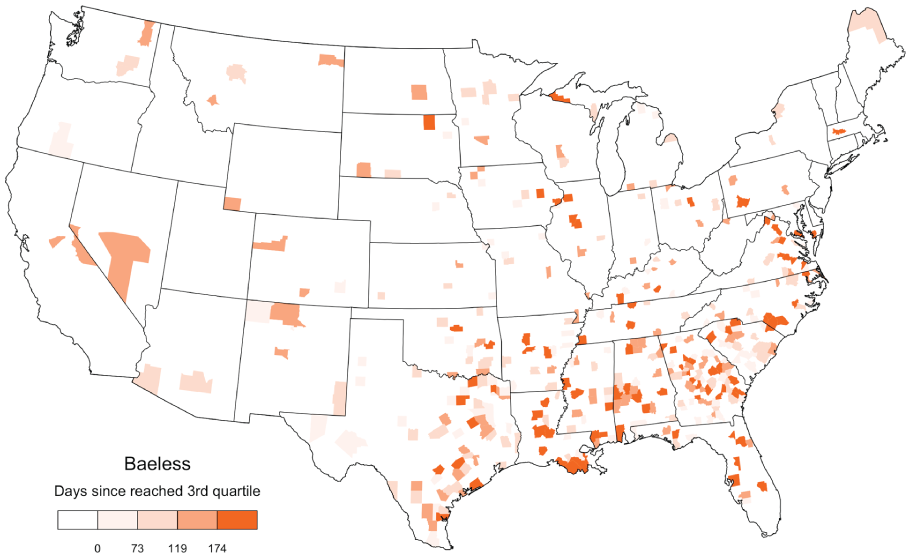
Days Since the Relative Frequency of Baeless Reached 3rd Quartile Overall
Lexical emergence maps for the fifty-four words are presented in Appendix I (available in supplementary materials online). Various sources of lexical innovation are attested in these maps. Perhaps the clearest overall pattern is a distinction between words that are primarily associated with the South (e.g., baeless, fallback), many of which appear to come from African American English, and words that are primarily associated with the rest of the United States (e.g., amirite, gainz). There are also several words associated with more specific parts of the country, including Louisiana (e.g., idgt, lordt), Georgia (e.g., boolin, brazy), the Mid-Atlantic (e.g., thottin, tookah), the West Coast (e.g., cosplay, tbfh), and New York (e.g., litt, lituation). Many of these maps also show regional patterns of spread, with words reaching much of the rest of the country on Twitter by the end of 2014.
To confirm this interpretation, we ran a series of global Moran’s I spatial autocorrelation analyses, which test the degree to which the values of a regional variable exhibit spatial clustering or dispersion (Bivand et al. 2008; Grieve 2018). Specifically, we calculated Moran’s I using a twenty-five neighboring county spatial weights matrix (see section 4). We found that all fifty-four lexical emergence maps exhibit significant levels of global spatial autocorrelation (p < .0001). In other words, our analysis shows that the origin and spread of lexical innovations on Twitter is geographically patterned, as broadly predicted by the wave model. This basic result was to be expected—all new words must begin somewhere and if they are to enter into common usage, they must spread out from this source—but this is the first time that such a large number of emerging forms has been mapped at the same time, providing empirical support for an important theoretical assumption in linguistics.
Although physical distance affects the emergence of new words on Twitter, it leaves much about these maps unexplained. Emerging words do not first occur in one county or in one cluster of counties before spreading out radially to adjacent counties. Counties with the earliest attestations of a word do tend to be found primarily in one part of the country, but these regions are often large and contain as many counties where the word is never used at all, and there are often early usages scattered across the rest of the country. Clearly other factors therefore affect the spread of emerging words on social media. These factors appear to include population density, as predicted by the hierarchical model, given that these emerging words often seem to spread to major urban areas before reaching the rest of the country. Overall, however, regional patterns of lexical innovation on Twitter are highly complex, making it difficult to draw generalizations through the manual analysis of so many maps. To identify common regional patterns of lexical innovation we therefore conducted a multivariate spatial analysis of these maps.
5. Multivariate Spatial Analysis
The lexical emergence maps identify many different regional patterns. To find common patterns in these fifty-four maps, we subjected the complete set of maps to a “multivariate spatial analysis,” which is a method for detecting common patterns of regional variation in dialect maps (Grieve et al. 2011, 2013; Grieve 2016). Specifically, because these maps represent regional patterns of lexical innovation, a multivariate spatial analysis allowed us to find common regional patterns of lexical innovation.
In the first stage of the multivariate spatial analysis, the underlying regional signal in the map for each linguistic variable is isolated using a Getis-Ord Gi* local spatial autocorrelation analysis (Bivand et al. 2008; Grieve 2011, 2018). This technique compares the values of the variable around each location to see if that location is part of a high or low value cluster, where the search space is defined by a spatial weights matrix (Getis 2009). For example, a nearest neighbor spatial weights matrix specifies that each location is compared to its nearest neighbors, including itself. If the values at these nearby locations tend to be relatively high, a positive z-score is assigned to that reference location, whereas if they tend to be relatively low, a negative z-score is assigned. These z-scores are then mapped across the locations to visualize any underlying regional patterns in the values of the variable. In essence, the local spatial autocorrelation analysis, as applied here, smooths and interpolates the lexical emergence maps, much like drawing an isogloss by hand in a traditional dialect study. For example, based on the data mapped in Figure 2, the local spatial autocorrelation map for baeless using a twenty-five nearest neighboring county spatial weights matrix (identified using county centroids) is presented in Figure 3, where darker shades mark the general areas where baeless occurred relatively frequently on Twitter at a relatively early point in time. Local spatial autocorrelation maps for all fifty-four emerging words are presented in Appendix II (available in supplementary materials online).
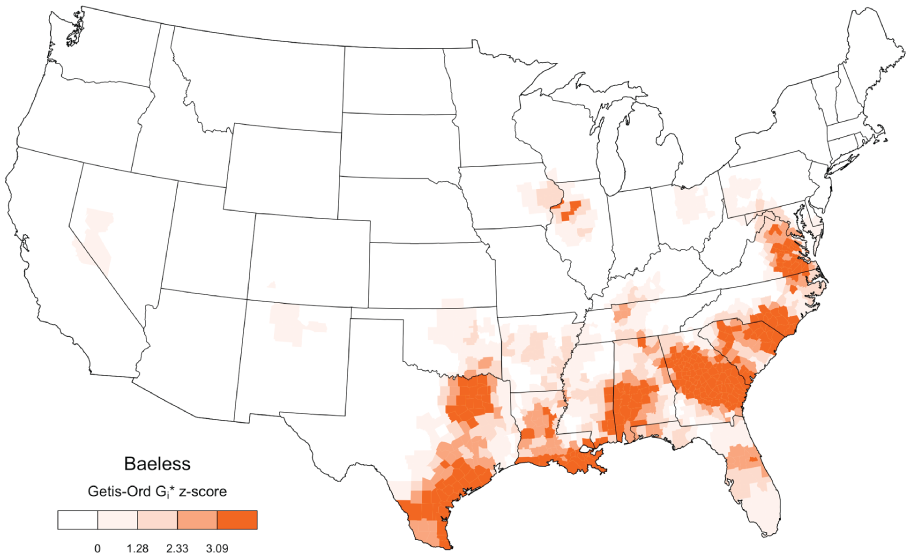
Local Spatial Autocorrelation Map for Baeless
In the second stage of the analysis, the local spatial autocorrelation maps for the complete set of linguistic variables are subjected to an exploratory factor analysis to identify the most important patterns of regional variation (Fabrigar & Wegener 2012). In essence, the factor analysis compares the local spatial autocorrelation maps for every pair of variables to find the most commonly attested patterns in the dataset, much like searching for bundles of isoglosses in a traditional dialect study. Each pattern is represented by a dimension, ordered by the prevalence of the pattern it represents. Each dimension is associated with a set of factor scores, which are mapped to visualize that common regional pattern, and a set of factor loadings, which are inspected to see the degree to which the map for each variable is represented by the map for that dimension.
Before presenting the common patterns of lexical innovation identified by this analysis, it is important to acknowledge that this method, like all complex statistical workflows, requires many decisions to be made. First, before conducting the multivariate spatial analysis, when reducing the time series to a single map for each emerging word, it is necessary to select a relative frequency threshold. Second, when isolating the regional signal from each lexical emergence map using a local spatial autocorrelation analysis, it is necessary to select a type of spatial weights matrix. Finally, when identifying common regional patterns using a factor analysis, it is necessary to select the type of factor analysis, the method for rotating the factor solution, the approach to calculating factor scores, and the number of dimensions to be extracted (i.e., the number of regional patterns).
To assess the effect of varying these settings and to help us better understand the common patterns of lexical innovation in our dataset, we mapped the results of a range of different multivariate spatial analyses, including based on two different relative frequency thresholds (3rd quartile, 90th percentile), four different numbers of nearest neighbors (five, ten, twenty-five, fifty), and three different numbers of dimensions (four, five, six regions). For all twenty-four of these analyses, a nearest neighbor spatial weights matrix was used because it is a standard approach that helps control for an uneven distribution of locations, and an ordinary least squares factor analysis was used, because it is suitable for datasets with relatively high skewness and kurtosis values (i.e., that depart from normality). In addition, the dimensions were rotated to improve interpretability, specifically using oblimin rotation, which allows the dimensions to be non-orthogonal, thereby potentially identifying common patterns of variation in the dataset more precisely. Factor scores were also computed using the regression method. Varying these two parameters had relatively little effect on our results.
The common patterns of lexical innovation identified by each of the twenty-four multivariate spatial analyses are mapped in Appendix III (available in supplementary materials online). Most notably, we find that all these analyses identify relatively clear regional patterns, which are also relatively consistent across the twenty-four analyses, attesting to the strength of these patterns. The four-dimension solutions are especially stable, with the same general patterns identified in all cases, including Northeast, South, Gulf Coast, and West Coast regions, as well as some non-contiguous extensions. The five-dimension solutions are also relatively stable and consistent with the four-dimension solutions, with the Northeast, Gulf Coast, and West Coast regions being preserved, and with the South being divided into Mid-Atlantic and Deep South regions. Finally, the six-dimension solutions also identify five similar regions, but the sixth region varies, moving from the South to the West to the Midwest. It is also notable that when only two regions are extracted, the analysis consistently identifies an opposition between the South and the rest of United States.
Given these results, we believe that the five-dimension solutions provide the most meaningful and reliable summary of our data: the five-dimension solutions are consistent with each other as well as the four-dimension solutions, whereas the six-dimension solutions are less stable. Furthermore, the fourth and fifth dimensions generally account for similar amounts of variance explained across analyses, whereas the sixth dimension accounts for considerably less. Although the five-dimension solutions are largely in agreement, the effect of varying the other parameters is not inconsequential. Most notably, the composition of the Mid-Atlantic region, whose division from the Deep South differentiates the four- and five-dimension solutions, shifts across the five-dimension solutions, depending primarily on how the relative frequency threshold is set. The core of this region always includes Washington D.C. and Baltimore and extends through eastern Virginia and North Carolina. Otherwise, the region sometimes extends north to include Philadelphia (3rd quartile solutions), sometimes jumps to Chicago and other parts of the Midwest (3rd quartile solutions), and sometimes extends around the edges of the Deep South and Gulf Coast regions (90th percentile solutions). The composition of the other four regions depend less on the relative frequency threshold, but all become larger as the number of nearest neighbors considered increases, reflecting greater levels of smoothing in the individual local spatial autocorrelation maps being aggregated.
In addition to the interpretability and consistency of the different analyses, the amount of variance explained by each can be compared. Despite their geographic similarity, the eight five-dimension solutions account for between 16 percent and 59 percent of the variance in the fifty-four maps, where higher amounts of variance explained are primarily due to increasing the number of nearest neighbors. Although accounting for more variance is generally good in the context of factor analysis, selecting the solution that accounts for the highest amount of variance (3rd quartile, fifty nearest neighbors) is not necessarily best, as this increase in variance explained is largely driven by more aggressive smoothing of the individual maps, which risks obscuring important local patterns. Alternatively, selecting the analysis that accounts for the least amount of variance explained (90th percentile, five nearest neighbors) risks amplifying the effect of low level noise and consequently missing large-scale patterns.
Taking these issues into consideration, we chose the 3rd quartile, twenty-five nearest neighbor, 5-dimension solution, as our final model for three main reasons. First, it aligns well with the full range of five-dimension solutions, as well as the underlying word maps associated most strongly with each dimension. Second, it accounts for a relatively high amount of variance explained (49 percent) despite being run under relatively conservative parameter settings. Third, it is geographically interpretable, with each of the five regions of lexical innovation reflecting regional patterns in topography, population density, and culture.
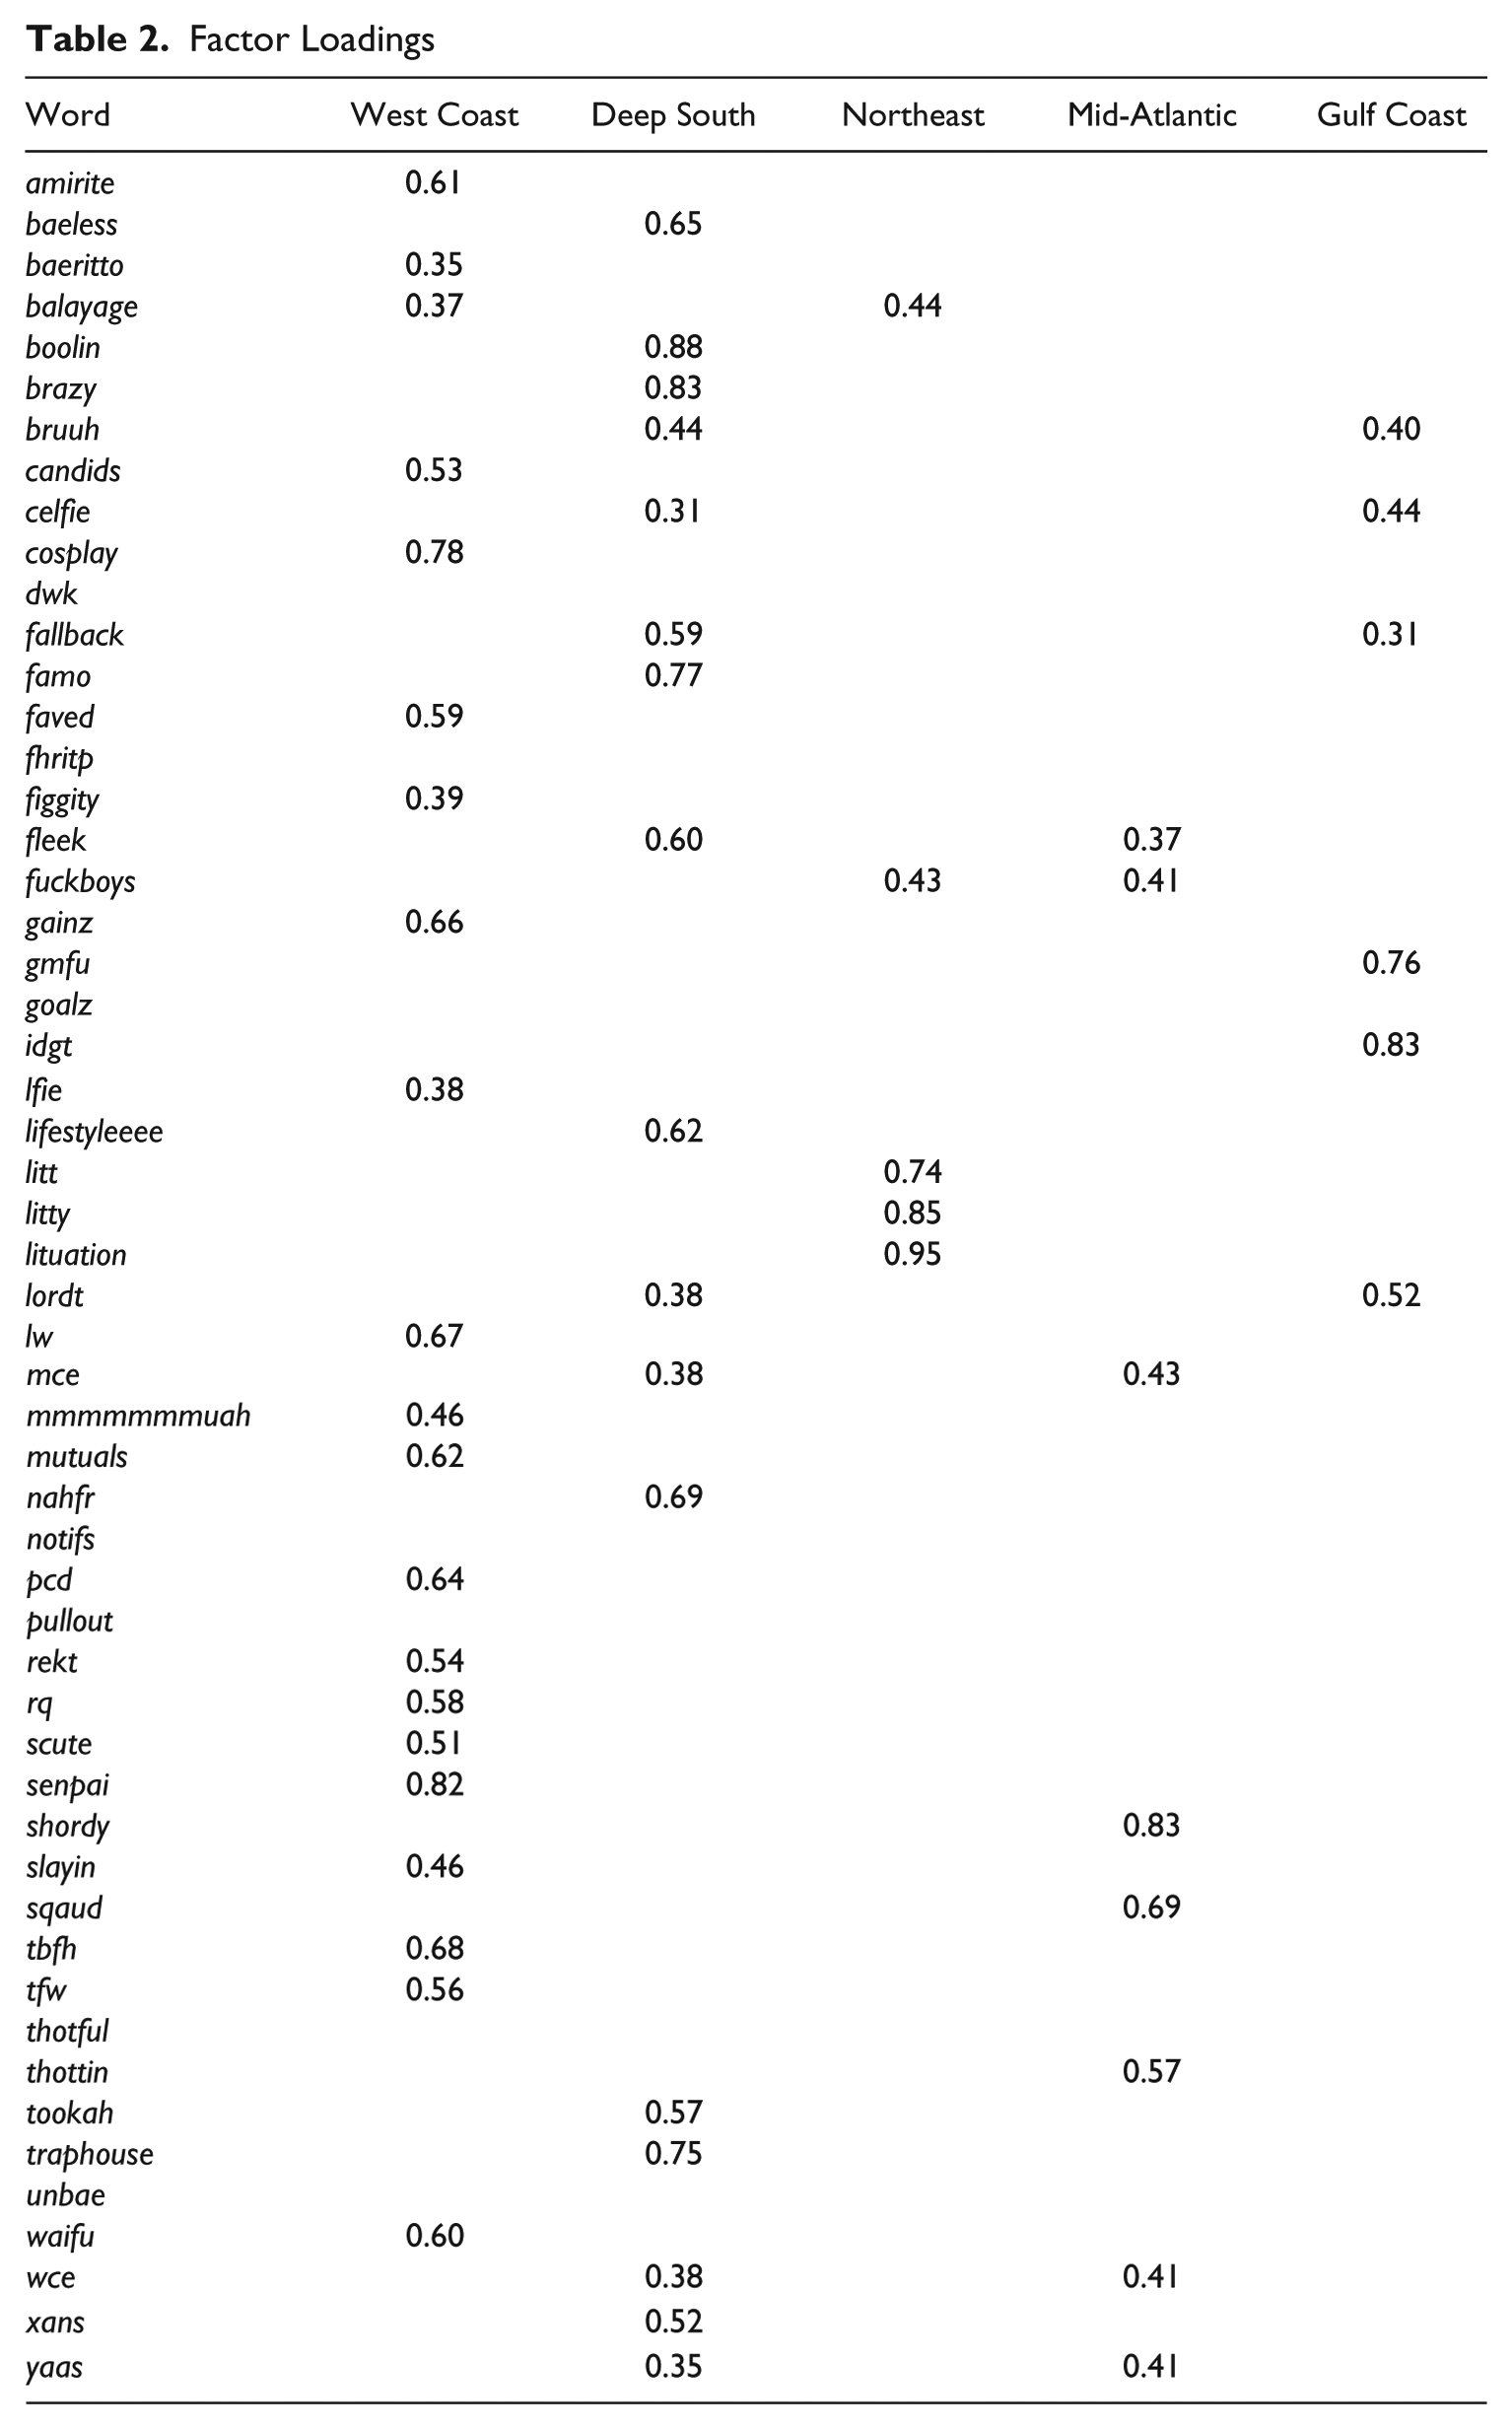
The five patterns of lexical innovation found by this analysis are mapped individually in Figure 4, where the degree of shading reflects the strength of the association of each county with that factor, and together in Figure 5, where shading reflects the factor with which each county is most strongly associated (a color version of this map is available online). The general West Coast region accounts for the most variance (16 percent), followed by the Deep South (14 percent), the Mid-Atlantic and Northeast (7 percent), and the Gulf Coast (6 percent). The factor loadings for this solution are presented in Table 2, which shows the degree to which each emerging word is represented by each dimension, where a strong positive loading (> .3) indicates that the map for the word is relatively similar to the map for that dimension (there are no strong negative loadings). Notably, all but six of the fifty-four words are strongly associated with at least one of the five dimensions. For example, senpai and cosplay are most strongly associated with the West Coast, boolin and famo with the Deep South, lituation and litty with the Northeast, shordy and thottin with the Mid-Atlantic, and gmfu and lordt with the Gulf Coast.
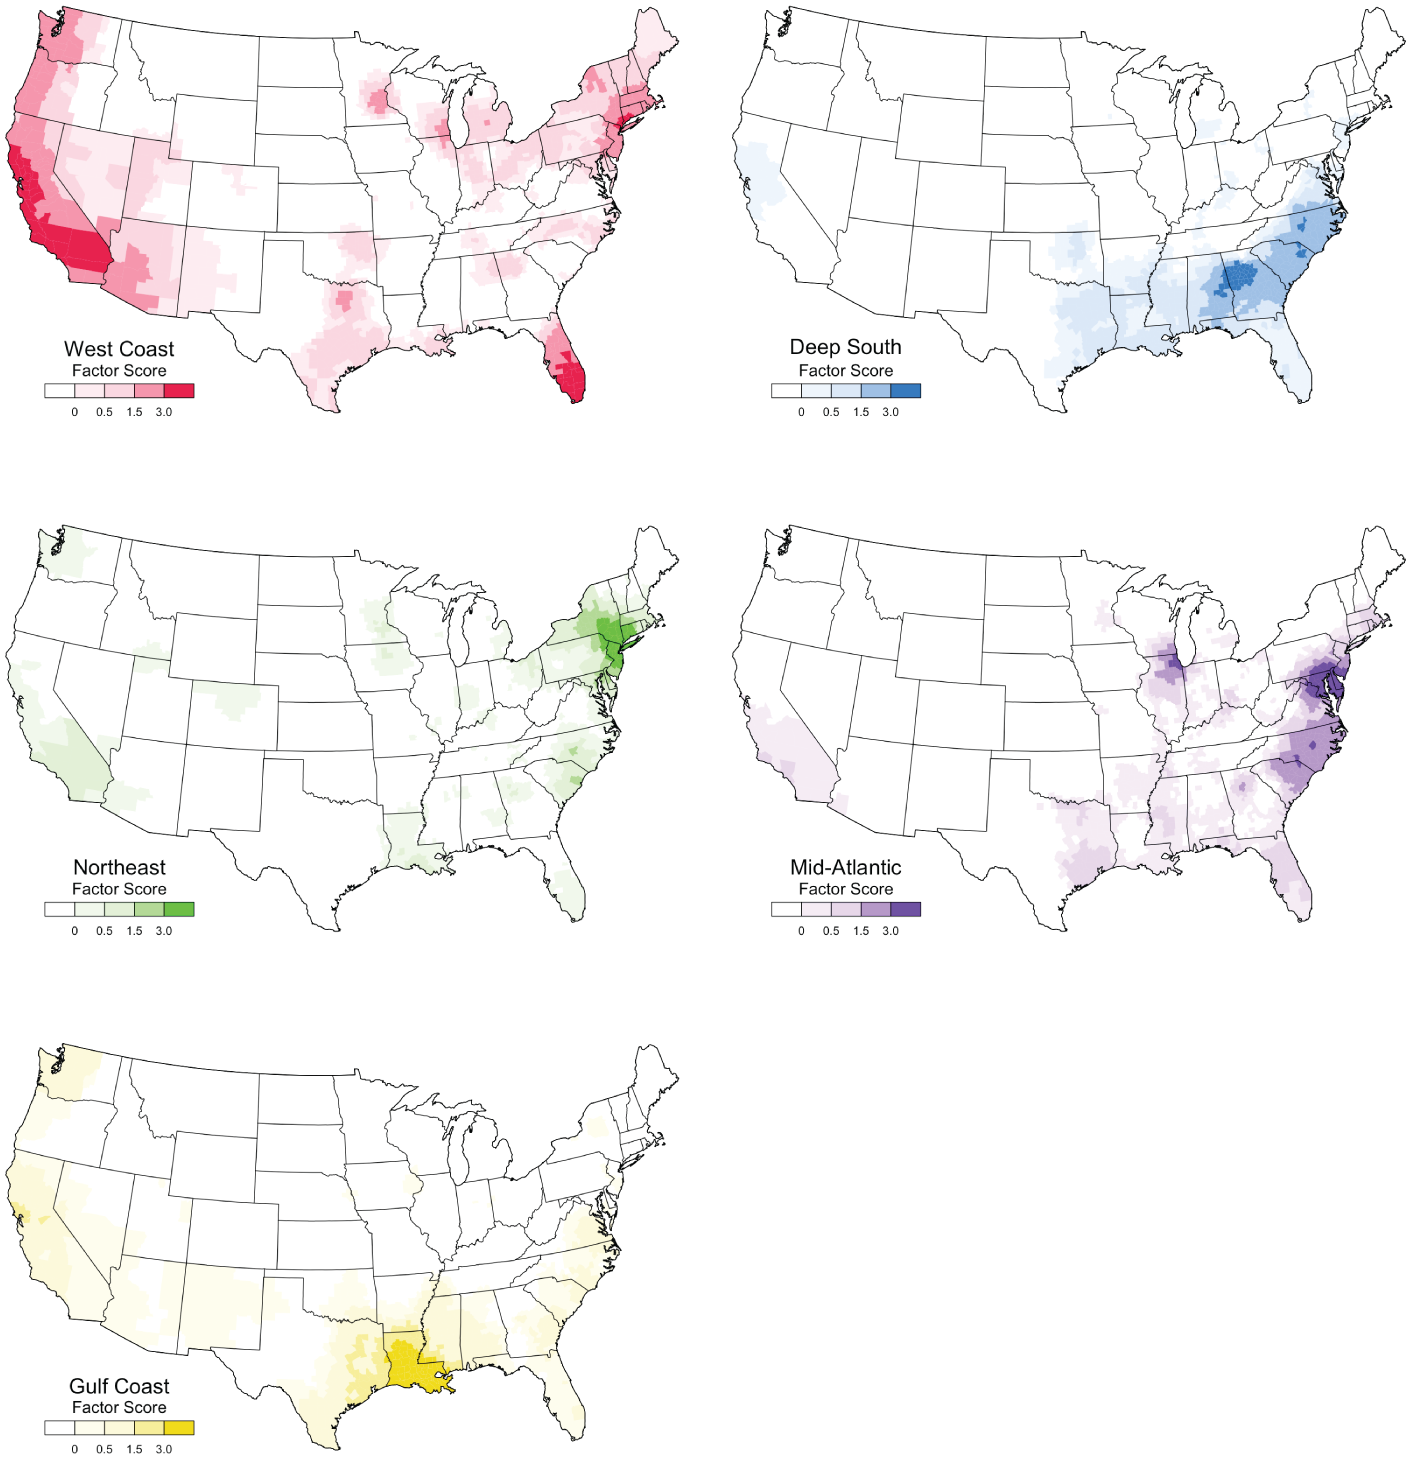
Five Common Regional Patterns of Lexical Innovation
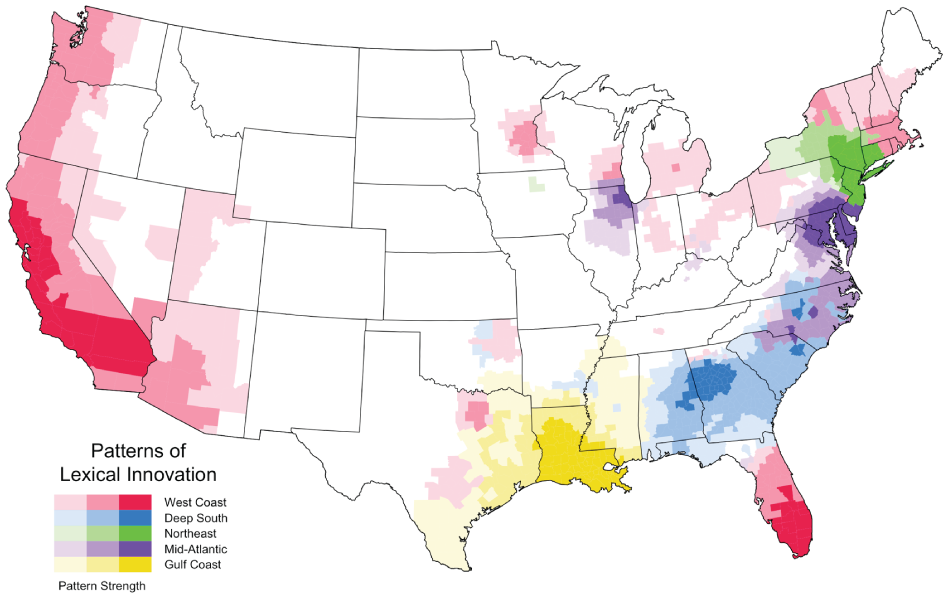
Regional Patterns of Lexical Innovation on American Twitter
Factor Loadings
Finally, although we chose to focus on this particular 5-dimension solution, we must stress that this map is meant to be representative as opposed to definitive: it is the map that we believe provides the most informative and consistent model of our data. In the next section, we therefore interpret these results accordingly, concentrating primarily on the broad regional patterns of lexical innovation, which are largely replicated across the solutions.
6. Common Patterns of Lexical Innovation
The basic finding of our multivariate spatial analysis is that regional patterns of lexical innovation are relatively consistent on American Twitter. We identified five common patterns that represent the lexical emergence maps for the majority of the fifty-four words under analysis. Furthermore, because we analyzed both the locations where emerging words occurred and the points in time when they occurred at these locations, each pattern effectively identifies both “hubs of lexical innovation,” the core regions from which emerging words tend to originate, and “pathways of diffusion,” the peripheral regions to which these words tend to spread. To better understand what these results reveal about lexical innovation on Twitter, it is therefore important to consider why people from these specific hubs are especially influential and why words spread along these specific pathways.
The most important pattern of lexical innovation identified by this study is primarily associated with the West Coast, with a hub of innovation that encompasses both Los Angeles and San Francisco, and an area of diffusion that stretches from Seattle and Portland in the Northwest to San Diego, Las Vegas, and Phoenix in the Southwest. The central role of California in lexical innovation on American Twitter is not surprising, given its large population and importance in the American entertainment and technology industries. This pattern, however, is also associated with a number of secondary regional clusters dispersed across the urban United States, especially around Miami and New York City, but also around Dallas, Minneapolis, Milwaukee, and across much of the urban North. The alignment between this pattern of lexical innovation and the distribution of urban areas can clearly be seen by comparing this map to a population density map (Spearman correlation coefficient = .57), as presented in Figure 6 (U.S. Census Bureau 2011). Given both its importance and its geographic extent, this first dimension likely represents a general pattern of American lexical innovation. This interpretation is supported by the words that are most strongly associated with this pattern, many of which are related to general cultural trends, including internet jargon (e.g., faved), gamer language (e.g., rekt), and anime (e.g., senpai). These trends seem to be largely non-local and in many cases the words denote new concepts associated with these trends as opposed to synonyms for existing terms. Perhaps California is leading many of these relatively new general American cultural trends and thus also leading in the use of associated vocabulary on Twitter, followed by other large cities from across much of the rest of the United States.
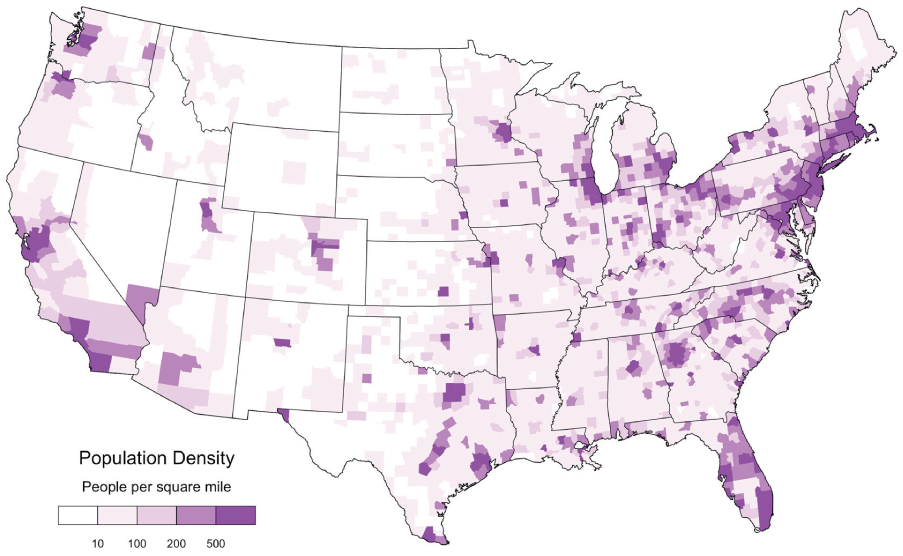
Population Density
The exception is the South, which is largely excluded from this first general pattern of lexical innovation. Our analysis divides the South into three regions, the most important of which is the Deep South, centered on the Atlanta Metropolitan Area. If we assume that only geography and population patterns predict regional patterns of lexical innovation, this result is hard to explain, as Atlanta is only the ninth most populated metropolitan area in the United States, and the area of diffusion does not follow patterns of population density. This result, however, appears to point to the importance of cultural patterns, specifically the influence of African American English on Twitter. The city of Atlanta has a majority African American population and the metropolitan area has the second largest African American population in the country after New York City (U.S. Census Bureau 2011). Atlanta is also generally recognized as a center of African American culture (Link 2013). The alignment between this pattern of lexical innovation and the distribution of African Americans can clearly be seen by comparing this map to the map for the percentage of African Americans by county (Spearman correlation coefficient = .74), as presented in Figure 7 (U.S. Census Bureau 2011). For example, the diffusion area falls off abruptly north of Atlanta even though this region is connected to the city by continuous and relatively dense settlement. This pattern presumably reflects the massive demographic shift from predominantly African American counties to predominantly white counties in the upper portion of the state. The African American source of these words is also reflected by the words most strongly associated with this dimension, which appear to be drawn primarily from African American English, including many words associated with Hip Hop Culture.
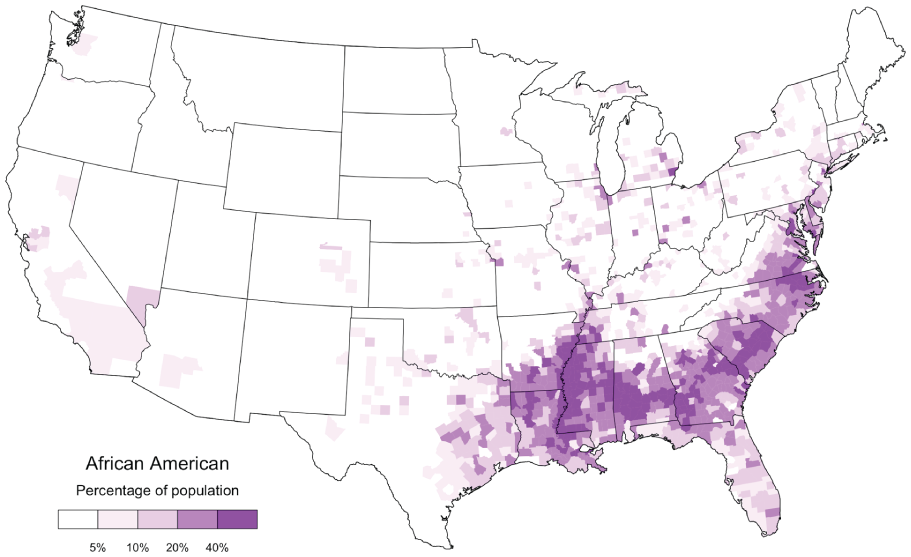
African American Population Density
The third most important pattern of lexical innovation identified by our analysis is the Northeast, centered on New York City, with an area of diffusion that includes western Connecticut, Upstate New York, and northern New Jersey—areas that are traditionally seen as falling within the cultural influence of New York City. Given that this is the largest city in the United States and the economic and cultural core of the country, the importance of New York City is to be expected. Words originating from this region on Twitter, however, appear to have relatively limited currency in the rest of the United States, with the Northeast being the smallest and most restricted of our five regions. This is perhaps because when New York City participates in more widely distributed innovations, it patterns with the West Coast and the other major urban areas of the North. Similarly, words most strongly associated with this Northeast pattern, although relatively limited geographically, often do have secondary hotspots in California (e.g., balayage, fuckboys).
The fourth most important pattern of lexical innovation identified by our analysis, and the second southern region, is the Mid-Atlantic, centered on the Washington D.C.–Baltimore combined statistical area, with a natural extension into northern Virginia. The core of this region also extends into the Philadelphia metropolitan area and, like the West Coast pattern, this pattern is also associated with a strong discontinuous cluster, in this case centered on Chicago. Notably, these cities are all characterized by large African American populations. Other than New York City and Atlanta, the Chicago, Washington D.C., and Philadelphia metropolitan areas have the largest African American populations in the United States, while Baltimore has the 11th most African Americans and a higher percentage of African Americans than all these metropolitan areas other than Atlanta (U.S. Census Bureau 2011). Furthermore, other than New York City, these are the four cities that received the greatest influx of African Americans during the Great Migration in the early twentieth century, when millions of African Americans fled persecution in the South (Tolnay 2003). Washington D.C. has also been referred to as the capital of Black America (Parliament 1975). The area of diffusion further attests to the likely African American source of this pattern, with the major pathway of diffusion running through Virginia and North Carolina corresponding remarkably well to areas with the highest proportion of African Americans in those states. Even the division between North and South Carolina, where the Mid-Atlantic and Deep South regions abut, reflects a clear drop in African American population. Once again, the words associated with this dimension also largely appear to be associated with African American culture (e.g., fleek, shordy).
Finally, the Gulf Coast region, which is the weakest of the five regions, is centered on New Orleans and Louisiana more generally, with extensions into eastern and coastal Texas, Mississippi, and up the Mississippi River toward Memphis. Although New Orleans is a relatively small city, with the metropolitan area just making it into the top fifty in the United States (U.S. Census Bureau 2011), it sits in the middle of an area of extended urban settlement along the Gulf Coast, which stretches from Houston to the western end of the Florida Panhandle. It is also a city of immense and distinctive historical and cultural importance (Faber 2015) and a major African American city (Germany 2007; Blassingame 2008), in the top ten of all metropolitan areas in the United States in terms of percentage of African Americans, as are Shreveport and Baton Rouge (U.S. Census Bureau 2011). These cities also fall within one of the densest regions of African American settlement in the nation, separated from the Deep South by a band of counties with relatively low African American population around the Alabama-Mississippi border. The words associated with this region also support this interpretation, as they appear to be drawn from African American English. For example, idgt is an acronym that was popularized by African American rapper Kevin Gates, who is from Baton Rouge.
Although these five patterns are complex and diverse, they do allow for certain generalizations to be made about the nature of lexical innovation in this variety of language, including both the actuation (i.e., the origin) and the diffusion (i.e., the spread) of innovations on Twitter. The actuation of language change has been the subject of relatively little empirical analysis, primarily because it is so difficult to observe. Even with our multi-billion-word corpus, we almost certainly have not observed the first occurrence of any of the fifty-four words on Twitter, much less in language more generally. Still, our analysis does identify the regions from which these words originated, at least on Twitter. At the most basic level, each of our five hubs of lexical innovation is centered on a metropolitan area: cities therefore appear to be the source of most new words on Twitter. Even though our underlying dataset is normalized, this finding is not surprising, given the size, influence, and diversity of urban areas; however, because these five regions are not centered on the five largest metropolitan areas in the United States, population patterns do not fully explain our results. For example, Dallas is the fourth largest metropolitan area, but is just one of the many secondary clusters associated with the general West Coast region, whereas nearby Houston is ranked fifth, but falls within the Gulf Coast region, which is centered on the far smaller city of New Orleans. Furthermore, these hubs do not map onto American “megaregions”—the areas of continuous and dense urban settlement that are beginning to link cities together across the United States (Florida et al. 2008). For example, the Boston-Washington megaregion contains New York and Washington D.C., which are at the core of our Northeast and Mid-Atlantic patterns, while Boston is more strongly associated with our general West Coast pattern, whose core region itself spans the Northern and Southern Californian megaregions. Rather than population patterns, the cultural significance of a city appears to be a better predictor of its lexical influence: all our hubs of lexical innovation are centers of American arts, industry, media, and politics. In addition, our three southern hubs (Atlanta, Washington D.C., New Orleans) are associated with very large African American populations and are considered important centers of African American culture.
In large part because it is easier to observe the spread as opposed to the origin of linguistic innovations, the geographic diffusion of linguistic innovations has garnered far more attention than their actuation, allowing us to interpret our findings in light of specific theories of diffusion. In particular, our results broadly support claims that physical distance and patterns of population density affect the spread of linguistic innovations, as predicted by the wave and hierarchal models. For example, the effect of population density is demonstrated by how the largely unsettled Appalachian, Coast, and Sierra Nevada mountain ranges cut off our coastal regions from the rest of the United States. However, the areas of diffusion we identify do not spread out radially from their hubs, nor do they consistently follow patterns of population density. For example, New York City’s relative lack of influence in eastern New England and Atlanta’s relative lack of influence in northern Georgia show that diffusion can be slowed despite continuous settlement. Once again, the cultural landscape appears to provide a better explanation for our results: our five patterns align, often with remarkable precision, to the cultural regions of the United States. For example, our basic division between the North and the South reflects the division between the Union and the Confederacy, which is perhaps the most important cultural divide in the United States. Perhaps even more important, however, this division reflects the distribution of African Americans in the United States. Taken together, the three southern areas of diffusion are essentially coterminous with the area of densest African American settlement in the country (see Figure 7). Furthermore, our African American patterns appear to often override more general population patterns, for example in Georgia and North Carolina, where more innovative areas are not necessarily more populous (see Figure 6) but do generally contain higher percentages of African Americans (Figure 7).
Overall, these results suggest that cultural geography, rather than physical distance or population density, is the main determinant of regional patterns of lexical innovation on American Twitter (see also Horvath & Horvath 1997; Boberg 2000; Eisenstein et al. 2014). New words tend to originate from culturally influential cities and spread within the cultural region from which they originate before diffusing across the rest of the United States. Even our first pattern, which primarily follows population density, can be seen as reflecting an important cultural division between urban and rural America. Furthermore, these results show that African American culture is an especially important source of lexical innovation on American Twitter. Although African Americans are somewhat overrepresented on Twitter compared to the general population (see section 2, esp. endnote 3), they are still clearly in the minority, whereas three of our five common patterns of lexical innovation appear to be primarily associated with African American English, showing the inordinate influence of African American English on Twitter.
Finally, in addition to extending our understanding of linguistic innovation, these results also appear to tell us something about African American dialect regions. African American English has traditionally been seen as a monolithic variety of language lacking regional dialects (Labov et al. 1968; Wolfram 1969). This assumption has recently been challenged on several fronts (e.g., Wolfram 2007), including based on the empirical analysis of Twitter data (Jones 2015), which found that African American dialect regions correspond at least in part to settlement patterns created through the Great Migration (Tolnay 2003). These findings are broadly supported by our results, although the urban areas of the Mid-Atlantic are connected to urban areas in the Midwest, despite being primarily settled by African Americans originating from different parts of the South. Furthermore, given that the main regional differences in African American English identified in this study are in the South, the Great Migration cannot explain these patterns. Rather, the distribution of African Americans appears to offer a better explanation, with the three southern regions identified here corresponding broadly to areas of relatively dense African American settlement that are separated by areas of relatively less dense settlement. These modern patterns also broadly correspond to historical differences, which can be explained in part by variation in plantation culture, with sugar plantations dominating in southern Louisiana, tobacco plantations dominating in Virginia, and cotton plantations dominating in the Deep South (Hurt 2015). Our analysis of lexical innovation may therefore constitute a first step toward mapping and explaining the regional dialects of African American English.
7. Conclusion
In this paper, we introduced methods for mapping individual and common patterns of lexical innovation in large time-stamped and geo-coded corpora. We then reported the results of using these methods to map the origin and spread of new words in a multi-billion-word corpus of American Twitter collected between 2013 and 2014. Based on the maps for fifty-four emerging words, we identified five common regional patterns of lexical innovation, primarily associated with the West Coast, the Northeast, the Mid-Atlantic, the Deep South, and the Gulf Coast.
Because this is the first time that such a large sample of emerging words—or of any type of linguistic innovation—has been mapped in one variety of language, these results extend our understanding of the actuation and diffusion of linguistic innovation in several ways. In addition to mapping individual emerging words and identifying five common patterns of lexical innovation on American Twitter, we believe our study has made five more general contributions to our understanding of language change:
Regional patterns of lexical innovation can be observed in written online communication, even though most of these words do not appear to have first occurred on social media.
Emerging words on Twitter tend to originate from a small number of hubs of lexical innovation and spread along relatively consistent pathways of diffusion.
Emerging words on Twitter tend to originate from urban areas, but the cultural influence of an urban area appears to be more important than its size.
The diffusion of emerging words is affected by geography and population density, as predicted by the wave and hierarchical models, but also by cultural patterns, with emerging words tending to spread within cultural regions first.
African American English is the main source of lexical innovation on American Twitter.
The degree to which these results can be generalized across different registers, dialects, eras, and languages, as well as different levels of linguistic analysis, is an open question. Twitter is only one variety of language, which does not account for a large percentage of most people’s linguistic output and which presumably is not the variety where most of these words were first used or through which most of these words are primarily spread. A corpus of Twitter can therefore only partially reflect patterns of lexical innovation in the language as a whole, as would be the case for a corpus representing any variety of modern American English, including spoken varieties—especially in the modern world, where communication takes place across so many channels, online and off. However, given that almost all these words appear to be used in everyday speech, and given that Twitter is a marginal variety of language that is geographically unconstrained and that therefore should not necessarily show such patterns, we believe our results may in fact reflect the general spread of these words in American English. Regardless, this analysis has provided us with an unprecedented testing ground for theories of actuation and diffusion, and has clearly demonstrated that these patterns are far more complex than has been previously observed.
Finally, this study has provided a methodological framework for future research on the spatial analysis of linguistic innovation, by showing how the origin and spread of emerging words can be measured and mapped. Crucially, this paper has introduced a method for reducing a geographical time series for a single word down to a single map, which is not only useful for visualization, but as a precursor for dimension reduction, as demonstrated in this study. Although this method was used here to study emerging words, it could also be used to map the use of any linguistic form over time. This study has also shown how multivariate spatial analysis, an approach that was developed for the analysis of dialect patterns, can be used to identify common sources of linguistic innovation. More broadly, this study has illustrated how the quantitative analysis of very large corpora of natural, written, online communication allows for new research questions of considerable general importance to linguistic theory to be pursued. There can be no doubt that as more data becomes available online from across a wider range of varieties, and as techniques from data science become more widely accepted in linguistics, our understanding of language variation and change will continue to be enriched.
Supplemental Material
JEngL_Supplemental – Supplemental material for Mapping Lexical Innovation on American Social Media
Supplemental material, JEngL_Supplemental for Mapping Lexical Innovation on American Social Media by Jack Grieve, Andrea Nini and Diansheng Guo in Journal of English Linguistics
Footnotes
Acknowledgements
In addition to our funders, we would like to thank Alexandra D’Arcy, Matthew Gordon, Peter Grund, Alice Kasakoff, David Saad, Nikhil Sonnad, Emily Waibel, and two anonymous reviewers for their comments on this study, as well as Hans-Jörg Schmid, Daphné Kerremans, Jelena Prokic, and Quirin Würschinger, who invited us to present this research at the Dynamics of Lexical Innovation Workshop at LMU Munich, 28–30 June 2017.
Declaration of Conflicting Interests
The author(s) declared no potential conflicts of interest with respect to the research, authorship, and/or publication of this article.
Funding
The author(s) disclosed receipt of the following financial support for the research, authorship, and/or publication of this article: The research reported in this article was funded by the Arts and Humanities Research Council (UK), the Economic and Social Research Council (UK), Jisc (UK) (Jisc grant reference number 3154), and the Institute of Museum and Library Services (US), as part of the Digging into Data Challenge (Round 3).
Notes
Supplemental Material
Supplemental material for this article is available online.
Author Biographies
References
Supplementary Material
Please find the following supplemental material available below.
For Open Access articles published under a Creative Commons License, all supplemental material carries the same license as the article it is associated with.
For non-Open Access articles published, all supplemental material carries a non-exclusive license, and permission requests for re-use of supplemental material or any part of supplemental material shall be sent directly to the copyright owner as specified in the copyright notice associated with the article.