



Abstract
The paper argues for the value of conducting surveys in vulnerable neighborhoods and provides a detailed account of a cost-effective strategy for surveying a recognized hard-to-survey population. The approach is illustrated through insights from the Vulnerable Neighborhoods Survey, conducted in three Nordic countries. The strategy focuses on a small number of specific neighborhoods and implements a range of measures to lower participation barriers. A key component involves combining random and non-random sampling techniques to facilitate the recruitment of a broad segment of residents. According to comparisons with registry data, the strategy produces samples that resemble the population on multiple demographic factors.
Keywords
Introduction
Cities across Europe are increasingly grappling with residential segregation (Andersen 2019; Musterd 2023; Tammaru et al. 2015). This paper focuses on one extreme of this spectrum: neighborhoods characterized by low socio-economic status, high levels of migration-driven ethnic diversity, and a poor reputation in other parts of the country (Cassiers and Kesteloot 2012; Lichter, Parisi and Ambinakudige 2020; Wacquant 2008). We argue that such vulnerable neighborhoods constitute crucial spatial and social contexts for advancing contemporary social science theory, with survey methodology playing a pivotal role in unlocking their analytical potential. To this end, the paper proposes a cost-effective survey strategy for addressing the challenges of reaching a population recognized as hard to survey (Kappelhof 2015; Tourangeau et al. 2014). It also responds to a call in the comparative survey research literature for methodological transparency that enables replication by other scholars (Lupu and Michelitch 2018).
Prior research addressing the challenges of surveying vulnerable neighborhoods has typically adhered to standard procedures while drawing larger samples from the target population (e.g., Andersson, Brattbakk and Vaattovaara 2017; Sampson 2012; Tolsma, van der Meer and Gesthuizen 2009). This strategy aims to reduce response bias under the assumption that data are missing at random—that is, that residents who decline to participate only differ from those who do on observable variables (Bailey 2024; Kalton 2009; Stoker and McCall 2017). However, this assumption is generally unrealistic (Bailey 2024), but particularly so in vulnerable neighborhoods where many residents face circumstances that make them less willing or able to participate in surveys for reasons directly tied to relevant sociological outcomes (Brick and Tourangeau 2017; Chen, Stubblefield and Stoner 2021). To address this limitation, we propose an alternative survey strategy designed to reach all segments of neighborhood residents more effectively and at a cost that remains manageable even for researchers with limited budgets.
The core of the proposed strategy is to focus on a small number of qualifying neighborhoods and, within them, to recruit a large share of residents. By concentrating efforts on a limited number of areas during a brief but intense period of field work, it becomes possible to employ a broad set of survey operations that minimize barriers to participation (Zhang and Wagner 2024), and that would be prohibitively resource-intensive if respondents were drawn from a statistically representative sample of all neighborhoods in the target population. Generalizations to the broader population of vulnerable neighborhoods can then be made through case study logic, by ensuring that the selected neighborhoods are either typical of the population as a whole or critical for the theoretical propositions under examination (Eckstein 1975; Seawright and Gerring 2008).
To reach broad segments of the population, the strategy combines both random and non-random sampling procedures. Random sampling is implemented at the level of addresses or housing units rather than individuals, with all residents at each address invited to participate to cost-effectively obtain a large and broad sample. This is complemented by non-random outreach in locations where specific hard-to-reach groups are likely to be found—for example, young men who socialize in public spaces. Beyond the outreach sampling, another similarity with intercept surveys (Henley and McCoy 2018) is the use of short interview times. To compensate for the reduced analytical leverage associated with short interview durations, participants are invited to take part in an online follow-up survey.
The overall ambition of the strategy is to obtain a representative sample of neighborhood residents while keeping the sample large enough to support fine-grained analyses, including in the follow-up online survey. However, as already discussed, true representativeness is widely considered close to impossible, even among easier-to-reach populations (Bailey 2024). A more modest ambition, therefore, is to reach a broad segment of residents, thereby generating unique data that address critical social issues, particularly given the limited existing knowledge about residents of vulnerable neighborhoods. Ultimately, how ambitious the claims supported by the sample can be is a question that must be resolved once data collection has been completed.
A further distinguishing feature of the strategy is that neighborhood surveys are preferably conducted in-house, involving direct participation from the primary researchers rather than outsourcing to an external survey provider. This approach not only helps minimize direct expenses but also ensures greater control over survey operations.
We demonstrate the feasibility of the strategy through the Vulnerable Neighborhoods Survey (VNS), an original data collection effort carried out in three cities—one each in Denmark, Finland, and Sweden. The surveyed neighborhoods—two in each city—all qualify as vulnerable within their respective national contexts, according to the criteria outlined above (diverse, disadvantaged, and poorly reputed). The VNS was conducted in two waves: first, face-to-face (F2F) interviews carried out in the neighborhoods, followed by online interviews with respondents who volunteered to participate one more time. To provide a national benchmark, we also commissioned a survey provider to conduct nationwide surveys in the three countries, which included most questions in the VNS. Since the F2F survey is the most original component and a prerequisite for the follow-up, our presentation focuses primarily on the F2F data.
In the following sections, we first substantiate the claim that neighborhood surveys can be leveraged for a broad range of analytical purposes. We then clarify the challenges of recruiting adequate samples in these contexts and outline the survey strategy implemented to overcome them. Subsequently, we evaluate the strategy by analyzing response rates and refusals, comparing unweighted respondent samples to registry data, and estimating associated costs. The final section concludes with recommendations for future research.
Why Survey Vulnerable Neighborhoods?
Vulnerable neighborhoods have been a topic of research within academic disciplines such as urban geography (e.g., Andersson and Hedman 2016; Mercader-Moyano, Morat and Serrano-Jiménez 2021), criminology (e.g., Pauwels et al. 2018), housing studies (e.g., Posthumus, Bolt and van Kempen 2013; Zhu, Holden and Schiff 2024), and social work (e.g., Brisson and Roll 2012; Gitterman 2014), as well as in fields related to segregation (e.g., Lichter, Parisi and Ambinakudige 2020) and neighborhood effects (e.g., Sampson 2012). We suggest several overlapping rationales for why other research areas could also benefit from the development of cost-effective methods for surveying residents in these neighborhoods.
First, drawing on principles from qualitative research (Patton 2001), neighborhood surveys serve as a form of “intensity sampling” due to the high concentration of individuals with low socioeconomic status, minority status, and non-native origin, making them suitable for addressing research questions related to social exclusion (Harvey 2010; Lee and Kim 2018; Wilson 1987). Correspondingly, from a methodological perspective, large samples of “reluctant” respondents, who would likely decline participation in a standard survey, provide a basis for examining the conditions that contribute to survey response bias (Kappelhof 2015). Specifically, do individuals who are less likely to take part in standard surveys hold different views compared to those who are more easily persuaded to participate?
Another similar rationale stems from the ethnic diversity within neighborhoods. By bringing together individuals with varying and often unusual experiences for the national context in a confined area, vulnerable neighborhoods can be viewed as social laboratories for both horizontal inter-group relations (Dinesen and Sønderskov 2015) and vertical relationships between groups and institutions (Superti and Gidron 2021). For example, neighborhood surveys provide opportunities to capture the nature of relations between majority and minority groups, as well as among immigrant groups of various countries and ethnic origins (Adida and Robinson 2023).
Yet another rationale arises from the fact that these neighborhoods are politicized (Esaiasson and Sohlberg 2025). After the ethnic dimension became central in the debate on disadvantaged neighborhoods at the turn of the century (Escafré-Dublet and Lelévrier 2019), issues such as cultural clashes, often framed as parallel societies (Dancygier and Margalit 2020), enclavization (Sunier 2021), religious radicalization (Azzam 2007; Varady 2008), social cohesion (Goodhart 2013; Hopkins 2010), and limited statehood (Risse and Stollenwerk 2018) have become increasingly pertinent. From other theoretical perspectives, these neighborhoods and their residents become focal points for questions regarding spatial stigmatization (Hancock and Mooney 2013; Wacquant, Slater and Pereira 2014), structural discrimination (Sisson 2021), and social inequalities (Slater 2018). Regardless of the theoretical framework, neighborhood surveys generate rich data to explore such perspectives.
A further rationale is that vulnerable neighborhoods differ from the rest of the country in numerous ways on factors related to well-being and prosperity, to the extent that they can be considered a distinct population (Lee and Kim 2018). Following the same logic that justifies surveys of ethnic and religious groups (e.g., Dell’Isola 2022; Koopmans 2014; Kööts-Ausmees and Realo 2016; Morales et al. 2020), it is relevant to study the conditions within this population. Importantly, the purpose of such a study is not to estimate the extent to which individuals are affected by living in the specific context (neighborhood effects), but rather to analyze the residents as a collective of individuals with shared experiences that make them stand out from the population at large (Lee and Kim 2018).
By extension, there are normative reasons for conducting neighborhood surveys. Surveys with representative samples of citizens are a primary means of understanding how people relate to society (Verba 1996). However, due to issues of limited accessibility and political power, this opportunity for a collective voice has rarely been extended to residents of vulnerable neighborhoods. Neighborhood surveys can address this imbalance by providing residents with the opportunity to express their own concerns and attitudes.
Why Neighborhood Surveys are Challenging?
In Tourangeau's (2014) definition, a population is hard to survey because one or more of the following five criteria are fulfilled: it is hard to sample, e.g., general registers cannot be used to generate a sample frame (Cepeda and Valdez 2010); hard to identify, e.g., drug users and other stigmatized groups (Maxwell 2000); hard to contact, e.g., internally displaced persons and refugees (Eckman and Himelein 2022); hard to persuade, e.g., uninterested and busy individuals (Dillman, Smyth and Christian 2014); and hard to interview, e.g., people with language difficulties (McGraw et al. 1992). Regarding residents in diverse and disadvantaged neighborhoods, all five criteria are met.
Beginning with sampling and identification, the Nordic countries, the context for our study, are known for having high-quality population registers with accurate address information (Jervelund and De Montgomery 2020). This provides a strong foundation for drawing probability samples of named individuals who live in the identified neighborhoods. However, the quality of population registers is lower in vulnerable neighborhoods compared to other areas. This discrepancy is due to a higher number of people living under precarious social conditions and greater uncertainty regarding personal information among those born in countries with less organized population statistics (Eraliev 2023; Lindberg 2020; Tax Authority 2024).
More formally, errors in population registers result in overcoverage (inclusion of individuals who have moved away from the neighborhood, or who are registered in the area without actually residing there) and undercoverage (individuals residing in the neighborhood that are not included, perhaps because they have not been able to secure an approved rental contract and/or because they are in the country illegally). Other sources of error are incorrect address information and even cases of individuals with multiple identities (Tax Authority 2024; Toepoel, de Leeuw and Hox 2020). Although there is no basis for precise estimates of errors, these factors collectively introduce uncertainty into the accuracy of probability sampling of named individuals.
To address the challenges of contacting, persuading, and interviewing, the heterogeneity of the population is crucial. Among the residents in most neighborhoods, there are civically engaged individuals who are also willing to participate in traditional surveys. 1 This could suggest that drawing large samples in and of themselves might be a sufficient method for generating representative samples. However, this is a case where sample sizes are likely a poor indicator of response bias (Groves and Peytcheva 2008; Kappelhof 2015; Stoker and McCall 2017; Toepoel, de Leeuw and Hox 2020), as vulnerable neighborhoods often contain large groups of residents who are difficult to recruit and may differ significantly in their responses to relevant survey variables.
Consider that many individuals might be difficult to contact because they work long hours, are hesitant to trust strangers, or prefer to hang out in groups in public places rather than at home. Additionally, many may decline to participate when contact is established due to lack of interest, caution, or because they are occupied with other activities. For instance, some individuals have been mistreated by authorities, and some with radical views on religion and society may be cautious about communicating with representatives perceived to be associated with the establishment, factors that underline the importance of establishing trust between the survey provider and respondents (Gengler et al. 2021). Finally, some individuals may be challenging to interview because they lack proficiency in the survey language or have difficulty understanding the survey questions. To reduce the risk of response bias, survey operations need to be designed to lower barriers to participation (Dutz et al. 2025; Groves, Singer and Corning 2000; Kappelhof 2015; Schouten, Peytchev and Wagner 2017).
A Strategy for Cost-Effective Neighborhood Surveys
The survey strategy we propose is based on an intensive examination of specific neighborhoods, with fieldwork lasting 3 to 5 weeks per neighborhood. The strategy is more cost-effective when primary researchers themselves organize data collection, rather than subcontracting fieldwork to external survey providers.
The strategy of locally grounded data collection, where primary researchers are directly engaged in planning and implementation, resembles the typical qualitative study (Patton 2001), though with the distinct aim of conducting standardized large-N interviews. Like in qualitative studies, the planning and data collection process gives the researchers opportunities to observe and interact with local actors and residents. By borrowing from the toolkit of qualitative methods, such as making extensive field notes (Phillippi and Lauderdale 2018), the survey results can be contextualized.
In the following, we detail the proposed strategy and illustrate it with our exemplar survey, the VNS. We applied a standard survey protocol across all neighborhoods, with minor adjustments tailored to local conditions. The resulting survey quality reflects a combination of survey operations rather than the isolated effects of distinct initiatives. However, local variations in implementation offer a basis for “informed guesses” about best practices in survey strategy. The survey data and documentation are publicly available (Sønderskov et al. 2026).
Selection of Neighborhoods
The first step of the data collection is selecting one or more neighborhoods that meet the study's theoretical criteria for inclusion. To generalize the findings based on case study logic, the selected neighborhoods should either be typical cases for the population of interest, or critical in relation to theory (Eckstein 1975; Seawright and Gerring 2008).
“Neighborhood” is a multidimensional concept that can be defined in terms of both spatial or physical and social, symbolic, and relational elements (Mustered, Andersson and Galster 2019; Perry 1929 [1999]; van Ham et al. 2013; Wilson 1987). Geographers tend to focus on spatial scale and boundary definitions (Tammaru et al. 2015), whereas urban sociologists typically emphasize local social life, social networks, and institutions (Sampson, Morenoff and Gannon-Rowley 2002).
Here, we take a more practical approach that aligns with the proposed survey strategy. This implies that three key elements need to be in place for an area to be considered a suitable neighborhood. First, the boundaries of a neighborhood need to be recognized and agreed upon by residents and researchers to determine what and who belongs to the neighborhood. Second, to allow the sample to be matched against official data, census data must be available for the selected unit. Finally, the population should be neither too small nor too large. As we elaborate below, our proposed strategy involves contacting a substantial part of the residents, which, together with available resources, imposes an upper bound on the number of inhabitants. On the other hand, meaningful statistical analyses across subgroups impose a lower bound; not least if one follows our advice about a follow-up survey (which typically implies substantial attrition). Based on these considerations, the number of eligible residents might range from 3,000 to 12,000.
In the VNS, neighborhoods were identified according to these three elements, and as typical cases of “vulnerable neighborhoods” within their respective national contexts, meeting three specific criteria: relatively low average socioeconomic resources, a high proportion of immigrants and their descendants (resulting in ethnic diversity), and designation as targets of policy programs for neighborhood development, reflecting poor reputation.
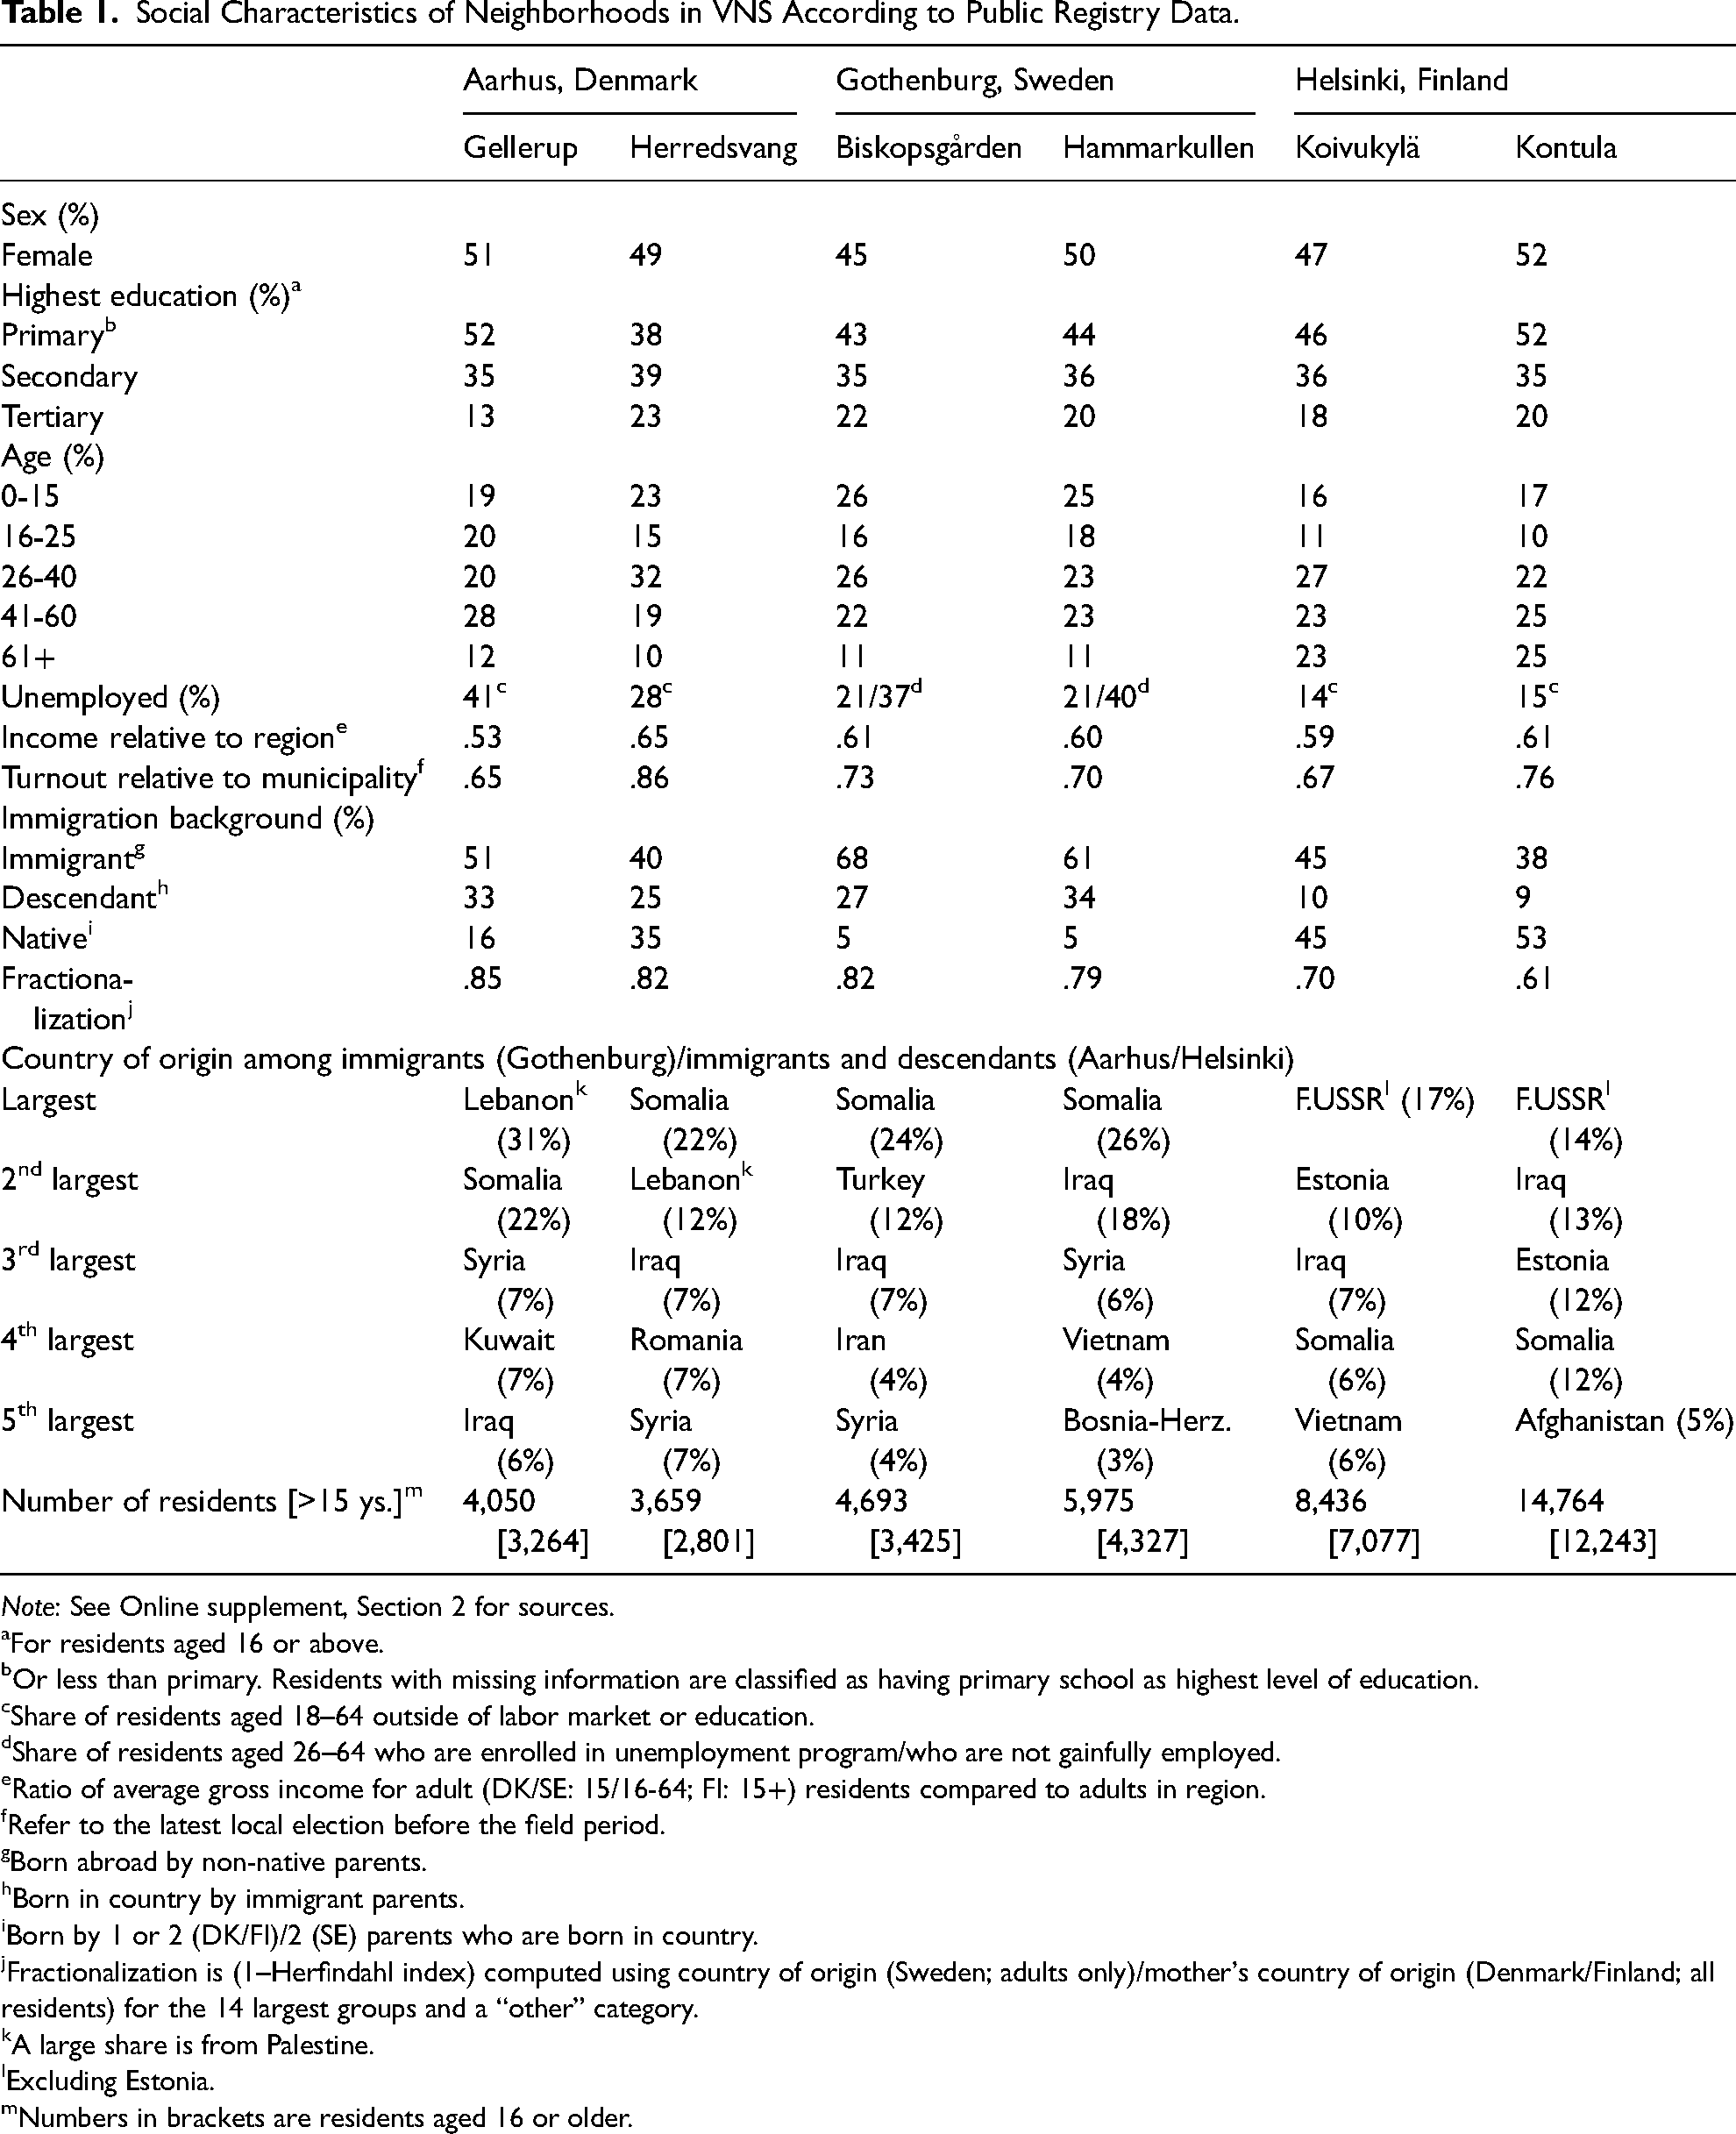
In Sweden, public discourse on vulnerable neighborhoods centers on roughly 60 areas identified by the national police authority as being in particular need of police and social interventions (Gerell, Puur and Guldåker 2022). From this list, we selected two neighborhoods in the country's second-largest city, Gothenburg: Biskopsgården and Hammarkullen. In both neighborhoods, more than 90 percent of residents are of non-native origin, and the average income is approximately 60 percent of the city’s mean. 2
In Finland, we selected two neighborhoods in the Helsinki metropolitan area: Koivukylä and Kontula. There is no official list of vulnerable areas in Finland, but it is generally acknowledged in public discourse that the selected neighborhoods are among the most segregated in the country, and city authorities have been, and continue to be, focusing on them as part of development programs aimed at increasing their attractiveness (Rosengren, Rasinkangas and Ruonavaara 2023). The average income in these areas is approximately 60 percent of the metropolitan average, while the proportion of non-natives is approximately 50 percent—a high figure by Finnish standards, where the immigrant population is significantly smaller than in Sweden and Denmark.
In Denmark, we selected two neighborhoods in the country's second-largest city, Aarhus: Herredsvang and Gellerup/Toveshøj (hereafter Gellerup). The selection was based on the pool of neighborhoods that are or have previously been included on the government's list of “parallel societies,” indicating a high level of vulnerability in terms of both social disadvantage and ethnic diversity, as well as a poor public reputation (e.g., Lundsteen 2023). In terms of diversity, Gellerup resembles the Swedish cases (84 percent non-native residents), whereas Herredsvang parallels the Finnish cases, with comparatively lower levels of non-native residents (65 percent). Average income relative to their region is 53 percent and 65 percent, respectively.
As discussed above, census data—despite its high quality in the Nordic countries—do not fully reflect conditions on the ground. Some individuals may live at another location than registered by the authorities, a phenomenon that may be more frequent among individuals with fewer resources. Moreover, official statistics may be less precise for immigrants. This is particularly true for education in the Danish and Finnish neighborhoods, where the proportion of individuals with only primary education is inflated because a significant proportion of foreign-born residents’ educational qualifications are not recorded by the authorities (Danmarks Statistik 2024: 58; Witting 2024).
The cross-country comparability is somewhat hampered due to differences in registration practices across countries. For example, Swedish data limitations imply that descendants are classified as native Swedes regardless of their background when calculating fractionalization—a measure of ethnic diversity. Using the mother's country of origin, as we do in Denmark and Finland, would drive up the Swedish fractionalization metric, probably above the Danish one. All in all, Table 1 shows that the six neighborhoods are clearly disadvantaged and diverse, but also hold notable differences, which may allow for comparative analyses.
Social Characteristics of Neighborhoods in VNS According to Public Registry Data.
Note: See Online supplement, Section 2 for sources.
For residents aged 16 or above.
Or less than primary. Residents with missing information are classified as having primary school as highest level of education.
Share of residents aged 18–64 outside of labor market or education.
Share of residents aged 26–64 who are enrolled in unemployment program/who are not gainfully employed.
Ratio of average gross income for adult (DK/SE: 15/16-64; FI: 15+) residents compared to adults in region.
Refer to the latest local election before the field period.
Born abroad by non-native parents.
Born in country by immigrant parents.
Born by 1 or 2 (DK/FI)/2 (SE) parents who are born in country.
Fractionalization is (1–Herfindahl index) computed using country of origin (Sweden; adults only)/mother's country of origin (Denmark/Finland; all residents) for the 14 largest groups and a “other” category.
A large share is from Palestine.
Excluding Estonia.
Numbers in brackets are residents aged 16 or older.
Sampling and Identification
The second stage in the data collection process involves selecting individuals to survey. The logic is to achieve broad coverage by combining residential door-knocking at all apartments at randomly selected street addresses with approaching hard-to-reach groups in public spaces within the neighborhood, as well as by interviewing a large proportion of residents in the targeted age groups (cf. Reichel and Morales 2017). To include as many respondents as possible within the limited time frame, all residents present in a visited apartment should be invited to participate, rather than selecting specific members of the household (such as the next birthday method commonly used in individual-based probability sampling). In the absence of lists of named individuals, eligible residents can be identified through an initial screening question asking whether the respondent lives in the area and, in doubtful cases, whether they meet the minimum age requirement for inclusion in the survey (16 years in the VNS).
In the VNS, hard-to-reach groups for whom outreach sampling techniques were deemed necessary included foreign-born low-educated mothers and older residents who may be hesitant to open the door to strangers, young people who spend time in public spaces, and men outside the labor market (Kappelhof 2015). By actively seeking out individuals in public settings, it becomes possible to sample on characteristics that are expected to covary with survey participation but that are unobservable in the information available from public registers. For example, registers do not distinguish between young people who prioritize their schoolwork and are therefore often at home, and those who prefer to socialize in public places.
In the VNS, a target sample size of 800 respondents per neighborhood was set, which allows for accurate per-neighborhood and between-neighborhood analyses, and makes it analytically meaningful to invite respondents to participate in the follow-up online survey (assuming a participation rate of about 50 percent). Limiting factors of the sample size are available resources, but also the number of residents in the neighborhoods. A sample of 800 respondents represents between 8 and 24 percent of the target population in the respective VNS neighborhoods. In view of the many contingent factors that influence an individual's availability for contact attempts during a short and intensive fieldwork period, 24 percent coverage may be close to the maximum one can realistically hope for in surveys like the VNS.
The sampling method with a random component—residential door-knocking at randomly selected street addresses—was given the greatest emphasis in the VNS. Overall, seven out of ten interviews were conducted in residences, with the highest proportion of interviews conducted in public places (46 percent) observed in one Gothenburg neighborhood (details are provided in the Online supplement, Section 3).
The sampling of street addresses—building entrances—needs to be adapted to local conditions. In Aarhus, the smaller populations made it possible to visit all addresses twice (a full sample). In Gothenburg, the neighborhoods were deemed sufficiently homogeneous to justify a random sampling of street addresses, with stratification by block to account for potential local variations among residents. In Helsinki, the neighborhoods are more heterogeneous, with social housing and privately owned apartments interspersed. To compensate for the expected variation in motivation to participate (Dutz et al. 2025; Schouten, Peytchev and Wagner 2017), more visits were made in blocks with the highest shares of non-native and low-income residents. To keep track of the sampling, it is advisable to record visits and response frequencies (Kappelhof 2015). Such process data allow for adjustments in sampling on a day-to-day basis.
The supplementary sampling in public spaces also needs to be adapted to local conditions. Drawing on insights from the intercept survey literature (Miller et al. 1997), ethnographic studies (Anderson 1999; Venkatesh 2000), and our own prior field work, we expected to reach foreign-born low-educated mothers and older residents in the courtyards outside building entrances, at playgrounds and social gatherings; members of informal youth groups at neighborhood squares and shopping malls; and unemployed men at local cafés and restaurants. Knowledge of local conditions also allows for recruitment during events taking place in the area during the field period. In the VNS, this included a local food festival, the annual distribution of free amusement park passes by the housing company, and a fundraiser meeting in favor of Palestinians displaced from Gaza following the October 7 Hamas-led attack on Israel.
Such outreach sampling allows for an element of snowballing, where small-group opinion-leaders encourage others present in the group to join in. With a pragmatic approach to sampling, the two sampling processes can also overlap, such as when outreach interviews conducted in the courtyard outside a building lead to a participant encouraging their neighbor, who lives in a selected address, to also participate.
However, contacts in public spaces do not always proceed smoothly. For instance, recruitment in a Helsinki shopping mall proved inefficient, as many visitors were from other areas and therefore not part of the target population. Sampling planning also requires a risk assessment. In general, it is safe to survey the diverse and disadvantaged neighborhoods of the Nordic countries during the daytime and early evenings, but certain precautions are still necessary. Enumerators were instructed to enter residents’ apartments only if they felt safe. A basic safety measure was for enumerators to work in pairs, and for the entire group conducting interviews on a given day to stay in continuous contact via chat apps.
Contacting, Persuasion, and Interviewing
The survey operations used in the VNS aimed at lowering participation barriers are based on standard protocols in responsive and adaptive survey designs (RASD), but with adjustments to account for the fact that we are surveying unnamed respondents from a defined residential area rather than named individuals dispersed over a larger territory (Chun, Heeringa and Schouten 2018; Tourangeau et al. 2017). Table 2 presents 14 survey operations we used for contacting, persuasion, and interviewing.
Contacting, Persuasion and Interviewing in the VNS.

Contacting
Three primary survey operations include providing advance information about the study, securing access to the buildings where respondents reside, and making repeated contact attempts. The parameters for repeated contact attempts are the same as in standard surveys—contacts should be made at different times (Fuchs, Bossert and Stukowski 2013)—but the conditions for the other contact operations differ in neighborhood surveys.
In neighborhood surveys, it is possible to provide in-advance information by broadly announcing the study to the entire area and the relevant addresses. In the VNS, methods included posting flyers in public spaces and stairwells. Likely even more effective in raising awareness among residents is turning the survey into a neighborhood event. In the VNS, enumerators wearing identifiers like brightly colored t-shirts with the university logo, moving through the area, sparked curiosity among many residents and served as conversation starters during contacts.
Gaining entry through locked gates and entrances is a persistent obstacle for making contact in F2F interviews within apartment complexes, which are common in diverse and disadvantaged neighborhoods (Beullens et al. 2018). With an intensive field period of a few weeks in specific areas, there is the opportunity to arrange with local housing companies to borrow key cards that provide access to selected buildings. This arrangement proved particularly effective in Gothenburg, where a single public housing company owns most buildings in the selected neighborhoods. In Helsinki, where property ownership is more fragmented, gaining access to the relevant buildings was more challenging.
Recruiting
To persuade residents to participate, a common recommendation is to use flexible survey modes (Toepoel, de Leeuw and Hox 2020). In the VNS, enumerators were equipped with programmed tablets that allowed for two modes: Computer Assisted Personal Interviewing (CAPI) and Computer Assisted Self-Administered Interviewing (CASI) (Tourangeau and Smith 1996). Specifically, respondents could choose between having the questions read aloud (CAPI) or answering the survey themselves on the tablet, with the enumerator available to address any questions about the questionnaire (CASI).
Interviews using the CASI mode were quicker and provided respondents with greater anonymity. The ability to switch the survey language with the press of a button also made CASI useful for interviewing individuals in languages not spoken by the enumerator but pre-programmed into the system (e.g., a Danish-speaking enumerator and an Arabic-speaking respondent). Enumerators noted that respondents with higher education and better reading comprehension were more likely to choose the CASI mode, whereas those with lower literacy skills tended to prefer CAPI. 3 The survey was configured in the survey software Qualtrics, and participants completed the survey through an app installed on tablets.
Matching the enumerator and respondent is a secondary persuasion operation according to RASD. This typically refers to matching language proficiency and shared ethnic background, as well as gender (e.g., Vercruyssen, Wuyts and Loosveldt 2017). In neighborhood surveys, however, matching takes on a broader meaning, including the experience of living in diverse and disadvantaged areas, or even within the specific neighborhood if the enumerators are locally rooted.
In the VNS, interviews were conducted by around 15 enumerators in each city. Among the enumerators were individuals proficient in commonly spoken languages in the areas. For example, Somali was represented in all neighborhoods, Arabic in Gothenburg and Aarhus, and Russian in Aarhus and Helsinki. Most enumerators were undertaking university education in social sciences, the gender distribution was relatively balanced, and about one-fifth had personal experience living in a diverse and disadvantaged neighborhood. Primary researchers participated on the same terms as other enumerators in Gothenburg and Helsinki (for detailed information, see Online supplement, Section 4).
The VNS was not designed to evaluate the causal impact of specific survey operations. However, in our assessment, successful recruitment depends less on matching than on more general factors such as understanding the purpose of the study, familiarity with the survey method, and feeling comfortable in the situation (Lee and Kim 2018). Language matching facilitates contact outside the majority language domains, but is not a necessary factor. Personal experience in the area may be an advantage, but it also carries risks, such as the enumerator's authority being challenged by peers or older individuals. Gender matching did not appear to have any significant impact on recruitment, although female enumerators were generally more successful in recruiting participants than their male counterparts. Online supplement, Section 5 provides analyses that substantiate these claims.
A third response-enhancing survey operation under the RASD framework assumes that individuals have different reasons for participating in a survey. Rather than using a standardized recruitment protocol, the survey request should be framed in a way that aligns with the particular interests of the respondent (Zhang and Wagner 2024).
In the VNS, all teams of enumerators participated in collective training sessions lasting between 4 and 6 h. Enumerators were instructed always to inform respondents that the survey was sponsored by the local university, but they could then choose from a set of suggested reasons to encourage participation: the survey addresses interesting issues about the neighborhood; the interview is an opportunity to express opinions; participants will receive feedback on the results; local politicians will be informed of the findings; the survey is brief; similar studies are being conducted in two other Nordic cities; and participants will receive a gift voucher (a conditional incentive). Naturally, all information provided was factually accurate. 4
The administration of the gift voucher needs to be adapted to university rules and national legislation (e.g., regarding taxable income). For the VNS, this involved different approaches in each city. In Gothenburg, vouchers worth approximately 10 Euros were handed to respondents without any formalities, while Aarhus participants had to sign a document confirming that they had received a voucher of equivalent value. Participants in the Helsinki study received an electronic lottery ticket with a high chance of winning a voucher of 50 Euros. We assess that the incentive to participate was lower in the lottery format used in Helsinki than when the voucher was handed out directly, and that the voucher had a greater impact in Gothenburg than in Aarhus.
The selective incentive also introduced some unexpected complications during fieldwork. In Gothenburg, the voucher proved to be in such high demand that it risked introducing bias into the sampling process. Some residents contacted outdoors, especially younger individuals, but also adults, attempted to complete the survey multiple times on different days. Given the absence of a sampling frame with named individuals, it cannot be ruled out that some succeeded. No similar problem was noted in Aarhus, possibly as an unintended positive consequence of the signed receipt protocol.
Other complications included some youths contacted in public spaces not taking the survey seriously, opting for the CASI mode, and rapidly clicking through the questionnaire to claim the voucher. Additionally, underage residents in public spaces sometimes falsely claimed to be 16 years old to participate.
The experience from Sweden raises questions about the appropriate size of incentives. A compensation of €10 for the time required to participate is at the higher end of standard reimbursements in F2F surveys (Mercer et al. 2015), which, on the one hand, can boost participation. However, incentives can also be too high as it raises concerns about coercion for vulnerable groups, even when participation involves minimal risk (Singer and Couper 2008). It is therefore important to adapt incentives to local conditions. In retrospect, we consider that a voucher worth around €5 would have been more appropriate in the VNS, and that the higher amount could instead have been offered for participation in the more demanding online follow-up survey.
Regardless of the incentive level, it is important to acknowledge certain challenges to data quality. Best practices for managing issues related to attractive incentives could include asking brief questions about respondents’ year of birth to identify underage individuals and reminding those who appear motivated solely by the incentive to take the survey seriously before handing over the tablet for a CASI interview. Additional measures are also needed to safeguard data quality during the data management phase. In the VNS, we made efforts to identify respondents who may have participated more than once. We also recorded interview duration, allowing users to exclude suspiciously short interviews from the analysis.
Interviewing
The final barrier-lowering survey operation involves accommodating the respondent's varied circumstances during the interview itself. The VNS interview protocol was designed to accommodate residents with low motivation, limited majority language proficiency, and lower levels of formal education by tailoring questionnaire length and providing multiple language options and assistance during the interview.
In standard-quality F2F interviews with hard-to-survey populations, a 50-min interview can be considered short, given the high cost per interview response (Kappelhof 2015). In the VNS, this interview duration was considered excessively long. To reduce the cognitive load on residents with limited formal education, and because the interviews were conducted without prior notice to respondents on a spontaneous basis, the VNS questionnaire was designed to take 15 min in CAPI mode and around 10 min in CASI mode.
To further increase motivation, the questionnaire began with questions about local living conditions—topics that previous research has shown to enhance survey participation among low-SES groups (Groves and Couper 1998). To address the limited command of the majority language, the survey was translated into Arabic, English, Russian, and Somali, and the tablets were programmed to switch survey languages with a single button press. For respondents who preferred other languages, we allowed for on-the-fly translations, where, for example, a native-speaking relative or friend translated into the respondent's mother tongue, or the respondent used a translation app on their phone.
Close to 80 percent of the interviews were conducted in the majority language, with English and Arabic being the second and third most used languages (Table 3, see Online supplement, Section 6 for details). English was the most frequently used minority language in most neighborhoods, particularly in the Finnish neighborhoods, with around 20 percent of interviews in English. The only exception is the Swedish neighborhood Hammarkullen, where Arabic clearly outplaced English (10 vs. 2 percent of interviews). The status of the Russian language highlights the importance of adapting survey languages to local conditions. Several interviews were conducted in Russian in the Finnish neighborhoods (4–5 percent), while Russian was seldom used in the other neighborhoods.
Language of Interviews in the VNS, F2F (Percent).

Note: Information is missing for 19 interviews. Based on enumerators post interview records. Overall: Across all neighborhoods, Minimum/Maximum: Lowest/highest value in a single neighborhood. “Other” refers to interviews with a mix of languages (e.g., Danish and Arabic), and to interviews with on-the-fly translations to other languages such as Kurdish; see Online supplement, Section 6.
At the same time, the low prevalence of interviews in Somali demonstrates that there is not necessarily a correlation between the size of a group and the value of offering the survey in the corresponding language. Despite the large group of Somali residents (over 20 percent of non-natives in the Swedish and Danish neighborhoods, see Table 1), only a few interviews were conducted in Somali. This is largely due to the fact that Somali is primarily a spoken rather than a written language (Mansur 1998); unlike Arabic-speaking respondents, only a small number of Somali-born respondents chose to self-administer the interview in their native language when paired with an enumerator who did not speak Somali.
To compensate for low familiarity with abstract concepts (e.g., political left-right placement, tolerance, and discrimination), enumerators were instructed to simplify and clarify such concepts. The common denominator for these survey operations was that we traded an increased risk of measurement errors for a reduced risk of biased estimates due to systematic non-response.
With our proposed sampling strategy, it is advantageous for enumerators to carry two or more tablets. This enables them to conduct multiple interviews simultaneously in larger households or with groups of residents in public spaces.
Collecting Auxiliary Data
Auxiliary data in the form of enumerators’ notes on the interview situation is valuable for contextualizing survey responses and response patterns (e.g., Rao 2021). These notes may cover a wide range of observations, from locked entrance doors to respondents’ language proficiency. In surveys such as VNS, where register-based information on sample individuals’ characteristics is unavailable, an additional purpose of such data collection is to gather information about refusals, enabling non-response analysis.
In the VNS, auxiliary information from enumerators was systematically collected after each personal contact. When invitations to participate were declined, enumerators recorded observable social characteristics of non-respondents, including gender, age, non-native background, and, if applicable, likely country of origin. They also noted the probable reasons for refusal, such as language barriers, time constraints, lack of interest, low trust, or other factors. For completed interviews, enumerators documented the primary survey language, the respondent's proficiency in the majority language, and their level of engagement with the interview.
Collecting Additional Surveys
Once contact and familiarity have been established through F2F encounters in respondents’ neighborhoods, a follow-up survey provides a cost-effective way to extend the study's analytical leverage. An online follow-up survey is therefore a natural next step. Surveying the general population is also worth considering for comparative purposes. Nationwide surveys enable analyses of similarities and differences between residents in vulnerable neighborhoods and the population at large, which are essential for assessing the distinctiveness of the former.
In the VNS, we conducted an online follow-up survey, contacting respondents who had consented to be recontacted by email or text message. The follow-up was conducted four to six months after the F2F survey. In total, 49 percent consented to be contacted again, and 47 percent of those responded to the follow-up invitation, yielding an overall response rate of 23 percent (with some variation across neighborhoods; see the last two columns of Table 4).
Sample Sizes and Response Rates in the VNS, F2F and Online.

Note:
Aged 16 and older, see Table 1.
Contacts are discounting contact with people who claimed not to live in the relevant neighborhood; percentages refer to share of target population.
Percentages refer to share of contacted/share of target population.
Percentages refer to share of interviewed sample.
Percentages refer to share of those who agreed to be interviewed/share of those originally interviewed.
The 23 percent response rate was lower than hoped for, as it implies that the number of respondents is somewhat limited for meaningful single-neighborhood analyses in some cases. This underscores the importance of not compromising on the number of respondents in the first wave if a follow-up survey is planned. That said, a response rate of 23 percent is considerably higher than what could be expected when contacting hard-to-reach populations solely through email or text messages (Choudhury et al. 2012).
In the VNS, we also conducted nationwide surveys in the three countries to enable comparisons between residents in vulnerable neighborhoods and the general population. These surveys were fielded three months after the follow-up survey, although a stronger temporal overlap would have been preferable for analytical purposes.
Considering Research Ethics
A fundamental requirement for ethical survey research is that respondents provide informed consent to participate. This means that potential participants must be informed about the purpose of the study, how their responses will be used, who is conducting the research, any risks involved in participation, and that participation is voluntary and can be withdrawn at any time without explanation (Singer 2008). This information can be provided both orally and in writing, with varying levels of detail depending on the respondent's preferences.
In accordance with the VNS survey protocol, relevant information was communicated orally during the initial contact and supplemented by written information in three formats: a short summary displayed on the screen, a longer clickable version available on the screen, and a full document accessible either in print or online. Additionally, respondents’ consent was sought at three distinct stages: during the initial recruitment, towards the end of the F2F interview when they were invited to participate in the follow-up online survey, and upon receiving the invitation to the online questionnaire.
Experience from the VNS suggests that residents primarily base their decision to participate on their general trust in the survey sponsor—in this case, the local university. When respondents engaged with the detailed information about the study, it was typically as a form of distraction while waiting for the interview to begin. Concerns about anonymity were only raised when respondents were asked to provide their mobile number or email address for the follow-up survey. However, even though hardly anyone accessed the detailed information, the overall impression was that the survey's credibility was enhanced by the availability of laminated printed material in multiple languages.
Another ethically significant decision involves whether to disclose the actual names of neighborhoods when reporting findings. In the case of the VNS study, we found it justifiable to be transparent about the specific areas studied. This approach aims to draw the attention of policymakers and the public to residents’ perspectives, acknowledge that most residents are willing to discuss their neighborhoods, and ensure transparency in our conclusions. Given that these neighborhoods are already nationally recognized, we consider the risk of reinforcing negative stereotypes to be minimal.
Evaluation: Sample Characteristics
Sample Sizes and Response Rates
Table 4 shows that enumerators made between 944 and 1,496 contact attempts per neighborhood, corresponding to 12 percent to 36 percent of the target population. Overall, 63 percent of those contacted agreed to participate, and all neighborhood surveys either met or came close to meeting the target of 800 interviews. The largest deviation from this target was in Herredsvang, Aarhus, where 669 residents were interviewed. However, as Herredsvang is the least populated neighborhood, almost one in four (24 percent) adult residents participated in the survey.
The overall acceptance rate of 63 percent of all residents with whom contact was established is high in the current survey climate (Holtom et al. 2022) and suggests that our strategy was successful in generating participation. High acceptance rates upon contact furthermore suggest that lack of sample representativeness is primarily due to contact failure rather than outright refusals. A skewed sample composition due to contact failure rather than refusals likely implies less bias on survey variables of interest such as trust, perceived safety, and alienation (Durrant and Steele 2009; Fitzgerald and Fuller 1982).
Recruitment was generally easier in public spaces than at residential door-knocking, as the acceptance rate upon contact was 78 percent in public places versus 59 percent at the door. The estimated differences between the modes of contact are approximate, as acceptance rates in public spaces may be inflated due to enumerators neglecting to register contacts with individuals who quickly indicated disinterest, for example, by not breaking their stride. In contrast, an explicit refusal at the door was likely registered in all cases.
Further supporting the belief in fairly high response rates upon contact, the results in Table 5 show that this pattern extends to residential door-knocking, as recorded in the process data files using households as the unit of analysis. Overall, one or more individuals in every other household (48 percent) participated when the door was opened, and contact was established.
Acceptance Rate per Household During Residential Door-Knocking, VNS, F2F.

Note: Unit of analysis is households. See Online supplement, Section 7. Overall: across all neighborhoods; Minimum/Maximum: lowest/highest value in a single neighborhood.
The results confirm that establishing contact during apartment visits can be challenging; overall, only four of ten doors opened (44 percent). It is difficult to have a well-informed prior on the expected contact rates in vulnerable neighborhoods, but one potential reference point is the experience of Swedish housing companies when conducting door-knocking campaigns to reach tenants. In Hammarkullen and two adjacent vulnerable neighborhoods, contact rates between 51 percent and 56 percent were reported after a single contact attempt, and the contact rate reached 58 percent after three visits (details in Online supplement, Section 8). This suggests that the VNS achieved slightly lower contact rates than housing companies using their own staff.
The total acceptance rate during residential door-knocking—defined as cases where the door was opened, and one or more individuals in the apartment participated in the survey—ranged from 12 percent to 29 percent across neighborhoods. The rationale behind the sampling strategy in the VNS is that interviews conducted in public spaces will compensate for systematic non-response obtained with residential door-knocking.
Another indicator of the risk of biased samples is the enumerators’ assessments of the reasons why residents declined an interview upon contact. Table 6 reports the distribution across four stated reasons and an “other” category. The ranking of the reasons is consistent across all areas, with lack of interest being the most common and trust issues the least common reason for declining the invitation. However, the neighborhoods in Helsinki are notable for having relatively more refusals due to a lack of interest and relatively fewer refusals due to language barriers, which reflects the comparatively smaller non-native population. 5
Enumerators’ Assessment of the Reasons for Refusals, VNS, F2F (Percent).

Note: Number of refusing individuals 2,725. See Online supplement, Section 9 for statistics per neighborhood and examples of reasons for refusal classified as “Other.” Overall: across all neighborhoods; Minimum/Maximum: lowest/highest value in a single neighborhood.
Who Were Reached?
The survey strategy's more modest aim is to produce an analytically useful sample that includes neighborhood groups typically very difficult to recruit without considerable effort. To assess this form of “intensity sampling” (Patton 2001), Table 7 reports the share of the sample consisting of several such particularly hard-to-reach groups.
Sample Composition per Particularly Hard-to-Reach Groups Across all Neighborhoods.

Note:
All statistics are from the F2F survey except for questions on health and life satisfaction, which are from the follow-up survey. See Online supplement, Section 10 for statistics per neighborhood.
Results confirm that the sample provides valuable opportunities to analyze many contemporary issues, regardless of whether it is fully representative of the neighborhood residents. For instance, one in ten respondents (11 percent) has limited proficiency in the native language without compensating fluency in English, and 17 percent are neither employed, studying, nor receiving a pension. Notably, 6 percent of respondents report having less than a primary school education, often equating to functional illiteracy. Further illustrating the diversity of the sample, nearly half of the respondents (47 percent) practice Islam, one in five (24 percent) are not citizens of the country, and one in three (30 percent) identify as belonging to a group that is discriminated against in the country.
Section 14 of the Online supplement illustrates what it entails in practice to interview groups of individuals who would likely have declined invitations to participate in a traditional survey, assuming they had even been approached.
Benchmarking Against Registry Data
The survey strategy's more ambitious goal is to obtain a representative sample. To evaluate this, we compare the sample(s) with registry data on key social characteristics, including groups typically underrepresented in surveys—men, individuals with low levels of education, young people, immigrants, and those outside the labor market (Bates 2017; Shaghaghi et al. 2011).
The comparison is necessarily approximate, as the variables in the registry do not perfectly align with those in the survey questionnaire. The most significant discrepancy likely concerns education, as the lowest educational categories are inflated in the registry due to the coding of missing values, while survey respondents may overstate their attainment for reasons related to social desirability (Black, Sanders and Taylor 2003). A similar dynamic applies to self-reported employment status, where social desirability may lead to underreporting of non-employment in the survey sample.
Results displayed in Table 8 fall in line with standard findings in survey research. In particular, individuals with low levels of education are substantially underrepresented across all neighborhoods. An exception to the expected pattern is that the youngest residents are well represented and, in some neighborhoods, even markedly overrepresented. Additionally, for the immigrant group, there is a strong alignment between the sample and register data concerning the five largest countries of origin in each neighborhood.
Comparing Neighborhood Sample to Registry Data.

Note: Cell entries in parentheses represent percentage point difference between the sample and registry data for the target population (residents aged 16 and above) or for the entire population (in cases with missing information about adults specifically). Coding details in Table 1 (registry data) and Online supplement, Section 11 (survey data).
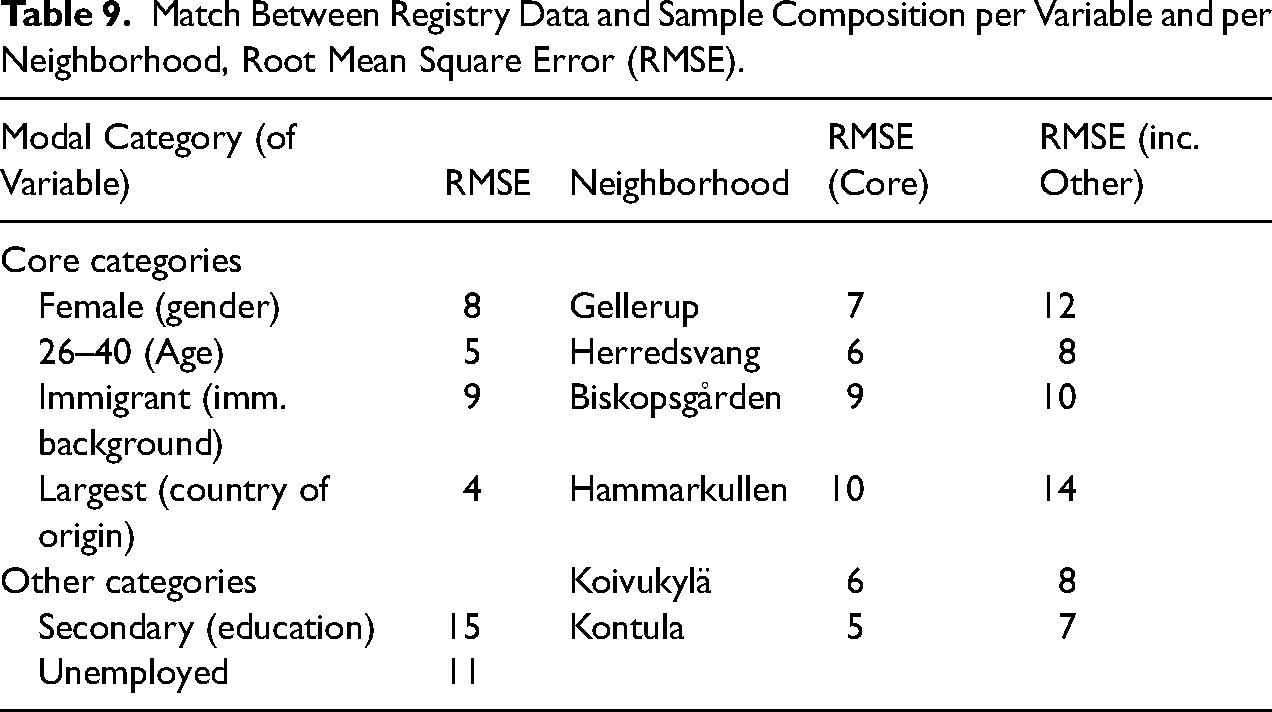
For a more comprehensible picture, Table 9 summarizes the match between the unweighted sample and the registry data using the root mean square error (RMSE) (MacInnis et al. 2018). As a rule of thumb, RMSE scores below 5 can be considered small, scores between 5 and 10 moderately high, and scores above 10 high. Using these threshold criteria and focusing first on the four core categories with the best alignment between survey data and registry data, the RMSE scores are moderately high across all categories and neighborhoods. For the two additional categories, the results confirm that education is the most problematic factor for recruitment (RMSE = 15), while the score for unemployment is slightly above the threshold for high (RMSE = 11). The scores remain moderately high for four out of six neighborhoods, even when the two less precise categories are included.
Match Between Registry Data and Sample Composition per Variable and per Neighborhood, Root Mean Square Error (RMSE).
Further insight into the potential for neighborhood surveys to generate quality samples is provided by participation patterns in the follow-up online survey. As is typically the case in online surveys, individuals with lower levels of education and immigrants are less likely to participate. While the skewness of the sample increases in the follow-up regarding social characteristics, panel attrition is notably smaller when it comes to attitudes. Among a broad set of trust indicators, only one is substantially related to participation in the follow-up (details in Online supplement, Section 12). The results corroborate the pattern observed in the F2F survey, indicating systematic skewness in terms of social characteristics. At the same time, they suggest that this tendency has limited consequences for survey variables of substantive interest (Stoker and McCall 2017).
Overall, our neighborhood survey strategy has yielded samples that are skewed towards females, individuals with higher levels of education, those active in the labor market, and native-born residents. Nonetheless, the unweighted samples closely mirror the composition of countries of origin among residents with a foreign background. Given the challenges involved and the uncertainty surrounding educational attainment—the least well-represented factor in the sample—the samples can be considered a fairly accurate representation of the diverse neighborhood populations.
Weighting of the Data
Given that we have access to registry data, we could weigh the data on observable parameters and thereby increase representativeness on the observed parameters (Bailey 2024). However, the value of such an approach hinges on whether the data are missing at random (MAR, i.e., missingness is correlated with observables but uncorrelated with outcomes of interest) or missing not at random (MNAR, i.e., correlated with outcomes of interest even after conditioning on observables). If the data are MAR, weighting on all relevant observables will achieve representativeness, whereas weighting will not achieve representativeness—and may even reduce it—if the data are MNAR (Bailey 2024). Unfortunately, it is impossible to determine the missingness mechanism in surveys like ours (and most other surveys, see Spiess 2016), but non-response is most likely related to outcomes of interest as discussed above. The benefits of weighting are therefore uncertain.
Nevertheless, weighting is sometimes preferred, and data collectors should therefore consider providing survey weights. In the VNS data, we provide a weight based on gender, age, and immigrant status. In Section 13 of the Online supplement, we replicate Tables 8 and 9 using this weight. The discrepancies between the sample and the target population (reported in Table 8 and Table S10) are generally reduced, as are the corresponding RMSE values (Table 9 and Table S11). Reductions in discrepancies are largest for variables included in the weight (e.g., gender), which follows naturally from the procedure, whereas improvements are limited—or discrepancies even worsened—for variables not included in the weight. This phenomenon, combined with the uncertainty about whether weighting reduces or increases discrepancies for the outcomes of substantive interest, illustrates the challenges associated with weighting.
Cost Estimates
A key argument for the neighborhood survey strategy is cost-effectiveness. To illustrate the cost structure, Table 10 lists the major components of the preparatory expenses. This breakdown assumes the study is conducted at an institution with basic survey infrastructure, including a license with a survey software provider.
Major Cost Items for Neighborhood Surveys.

Under this assumption, the largest expenses include salaries for enumerators, purchasing tablets (preferably two or more per enumerator on duty), translating the questionnaire into two or more languages, and procuring incentives such as gift vouchers. Importantly, several of these costs can be reduced or even eliminated for those operating on a shoestring budget. For instance, generative AI can be employed for questionnaire translation, significantly reducing translation expenses.
To provide an overview of fieldwork costs, Table 11 lists the total hours VNS enumerators spent in the field in each neighborhood. The pattern is relatively consistent across the neighborhoods, with differences reflecting factors such as the geographical size of the areas, the ease of accessing building entrances, and, naturally, the efficiency of individual enumerators.
Fieldwork Time in the Vulnerable Neighborhood Survey.

Highlighting the advantages of an in-house approach, there are considerable opportunities to conduct fieldwork on a minimal budget. In fact, three to four researchers willing to dedicate their time to data collection could conduct the interviews themselves, incurring no additional funding costs beyond their own salaries and selective incentives for participation. A rough estimate based on cost structures in the Nordic countries suggests that a neighborhood survey following the VNS design can be conducted on a budget ranging from €15,000 to €45,000 per neighborhood.
Discussion
This paper has highlighted the importance of Europe's vulnerable neighborhoods and their relevance to a wide range of sociological questions. We have proposed a cost-effective survey strategy designed to mitigate the risks of non-random missingness that often arise when oversampling from such areas. The strategy relies on intensive engagement with a small number of neighborhoods, using F2F interviews and a mix of random and non-random sampling approaches, and emphasizes the direct involvement of primary researchers in data collection.
The need for neighborhood surveys of this type arises in a context of increasing difficulty in motivating respondents to participate in surveys (e.g., Annemieke, Hox and de Leeuw 2020). This challenge is especially pronounced among groups at risk of social exclusion, underscoring the importance of exploring innovative survey methodologies—even when this requires moving beyond the gold standard of probability-based sampling (Reichel and Morales 2017).
The case study—the Vulnerable Neighborhood Survey—demonstrates that it is possible to generate large and diverse samples from six neighborhoods in Denmark, Finland, and Sweden that capture substantial portions of groups unlikely to participate in traditional surveys. These samples are also fairly representative of key observable social characteristics in the target population, as shown by public registry data. The VNS samples, for example, include groups that are extremely difficult to reach using standard approaches, such as individuals with minimal educational backgrounds and limited proficiency in the native language.
The paper also offers a detailed account of the survey strategy and its implementation in practice. This documentation is intended to support the replication of components found to be useful, while leaving room for alternative solutions to the challenges that inevitably emerge during fieldwork. Key assumptions that warrant further examination include whether the mixed sampling strategy yields lower response bias than probability sampling conducted under conditions of low response rates, and whether findings from a small number of strategically selected neighborhoods can be generalized to the broader population of vulnerable neighborhoods within the national context.
Another important avenue for further research follows from the Total Survey Error (TSE) framework (Groves 2004; Toepoel, de Leeuw and Hox 2020). The framework identifies three core components—representation error, cost-effectiveness, and measurement error. This paper has primarily addressed the first two, but efforts to reduce representation error and contain costs may inadvertently increase measurement error, for instance, through on-the-fly translation of survey questions. A full evaluation of the proposed approach, therefore, requires balancing all three elements of the TSE framework.
Vulnerable neighborhoods—characterized by disadvantage, diversity, and stigmatization—are found in cities across the world. Although the survey strategy outlined in this paper is designed to be applicable beyond the Nordic welfare states, the conditions for conducting neighborhood surveys may be less favorable, or at least substantially different, in countries with weaker commitments to reducing inequality (Arbaci 2007). For instance, the importance of matching enumerators to respondents’ social characteristics is likely to be greater in neighborhoods that, like the French banlieues, are more physically degraded and socially marginalized than their Nordic counterparts (Andersson 2007; Musterd 2005). Ultimately, the degree to which an intensive, neighborhood-targeted survey strategy can be generalized across diverse national contexts remains an empirical question.
Supplemental Material
sj-pdf-1-smr-10.1177_00491241261450123 - Supplemental material for Rationale and Methodologies for Surveying Vulnerable Neighborhoods: Lessons From Three Nordic Countries
Supplemental material, sj-pdf-1-smr-10.1177_00491241261450123 for Rationale and Methodologies for Surveying Vulnerable Neighborhoods: Lessons From Three Nordic Countries by Peter Esaiasson, Kim Mannemar Sønderskov, Henning Finseraas, Niels Nyholt, Oskar Rönnberg, Jacob Sohlberg and Mari Vaattovaara in Sociological Methods & Research
Footnotes
Acknowledgments
We would like to thank Nazita Lajevardi, Sebastian Lundmark, Laura Stoker, and two anonymous reviewers for their feedback and suggestions. A special thanks to Felix Cassel for technical support and coordination.
Declaration of Conflicting Interests
The authors declared no potential conflicts of interest with respect to the research, authorship, and/or publication of this article.
Funding
The authors disclosed receipt of the following financial support for the research, authorship, and/or publication of this article: The project is part of the Future Challenges in the Nordics research programme (2021–2027), funded by the Society of Swedish Literature in Finland, The Finnish Cultural Foundation, The Swedish Cultural Foundation in Finland, Stiftelsen Brita Maria Renlunds minne, Riksbankens Jubileumsfond and The Kamprad Family Foundation for Entrepreneurship, Research & Charity. Kim Mannemar Sønderskov acknowledges support from the Danish National Research Foundation (Grant No. DNRF144).
Pre-Registration Statement
The study was not preregistered. The empirical analysis presented here illustrates the design principles we propose.
Research Ethics
Our survey research with residents in vulnerable neighborhoods has received approval from the Swedish Ethics Appeal Board (#22-2023/ 3.1). It has also been approved by Aarhus University's Research Ethics Committee (BSS-2023-055 and BSS-2024-005-S).
ORCID iDs

Data,Code,and Materials Availability Statement
Data and code to replicate the results reported in the article are available here: https://doi.org/10.17605/OSF.IO/FEXCH. The data comprise the entire VNS dataset.
Supplemental Material
Supplemental material for this article is available online.
Notes
Author Biographies
References
Supplementary Material
Please find the following supplemental material available below.
For Open Access articles published under a Creative Commons License, all supplemental material carries the same license as the article it is associated with.
For non-Open Access articles published, all supplemental material carries a non-exclusive license, and permission requests for re-use of supplemental material or any part of supplemental material shall be sent directly to the copyright owner as specified in the copyright notice associated with the article.
