
Abstract
We present an item response model for ordinal public opinion data to understand individual-level variation in attitudes as a function of covariates. The approach allows investigating how individuals (or population subgroups) differ in substantive stances and attitude strength. It is a two-dimensional partial credit model that incorporates covariates linked to attitude direction and strength into the basic model. We exemplify the types of substantive insights into heterogeneity that can be obtained from the approach but not from existing models with two applications: attitudes toward gender equality (European Values Study) and the evaluation of presidential candidates (American National Election Study).
Introduction
Attitudes, like many other important concepts in research on public opinion, are latent constructs that cannot be directly observed or measured with a single survey question. Several contributions have shown that multiple survey items better gauge issue attitudes than an individual item does (e.g., Ansolabehere et al. 2008; Carsey and Layman 2006; Layman and Carsey 2002). While these studies used factor analysis or structural equation modeling, item response theory (IRT) modeling is on the rise in public opinion research to address the challenge of measuring latent constructs (e.g., Bafumi and Herron 2010; Caughey and Warshaw 2015; Jessee 2016; Treier and Hillygus 2009). Using a battery of items tapping the specific domain under study, IRT modeling captures the relationship between the latent quantity and the item survey responses by positioning individuals on the latent attitude or preference scale. We contribute to the field by presenting an explanatory approach for understanding how individuals (or population subgroups) differ in attitudes, which draws on classic ordinal data to measure attitudes and can be applied to standard mass public opinion surveys.
Attitudes represent how people evaluate objects, persons, or issues. The common and well-established instrument to measure attitudes is a series of items that are evaluative statements linked to the latent trait along with ordered response options (e.g., Abelson 1992; Bizer et al. 2003), which indicate the respondent’s level of agreement or disagreement with each statement (e.g., ‘‘strongly disagree,” ‘‘disagree,” ‘‘agree,” ‘‘strongly agree’’), or the level of (dis)approval or (un)favorableness. Such graded scales demand IRT models that account for the underlying ordinal data structure. Even though graded scales, designed to measure attitudes (Likert 1932), are standard in public opinion surveys, IRT models that can handle the ordinal responses and thoroughly explore the available information provided by the item batteries and covariates are not widely used in the social sciences; standard models without covariates have been applied, for example, by Duck-Mayr and Montgomery (2023) or Hill and Tausanovitch (2015).
In psychometrics, multidimensional item response models have been proposed that allow the inclusion of not only attitude parameters but also particular response style effects, which are also relevant to the model proposed in the present paper. Models for the analysis of rating data from multiple scales can be based on Bock’s nominal response model (Bock 1972). The link between the basic nominal model (without covariates) has been investigated, for example, by Huggins-Manley and Algina (2015) and Thissen et al. (2010).
Various models that incorporate response style effects and are derived from Bock’s model have been considered by Bolt and Johnson (2009), Falk and Cai (2016), Suh and Bolt (2010), Bolt and Newton (2011), or Bolt and Johnson (2009). However, the considered models do not include covariate vectors. Response style effects are also addressed by so-called IRTrees models (Böckenholt 2017; Böckenholt and Meiser 2017; De Boeck and Partchev 2012; Jeon and De Boeck 2016) but without the inclusion of covariates. Alternative approaches to modeling response styles have been proposed within the framework of latent class models (see, e.g., Moors 2003; Morren et al. 2011).
The effect of covariates is an explicit topic in the explanatory item response modeling (EIRM) approach (De Boeck and Wilson 2004, 2016). Within this framework, various models, including polytomous response models, have been proposed; see, in particular Tuerlinckx (2004). The approach presented here can be seen as an explanatory item response model with a specific, novel parameterization that enables the separation of attitude direction and strength.
The effect of covariates can also be modeled within the general framework of structural equation modeling (SEM); see, for example, Bartholomew et al. (2011) or Skrondal and Rabe-Hesketh (2004). SEM approaches have their roots in factor analysis and path analysis. They are typically multidimensional, involving several latent variables, and are available in program packages such as Mplus (Muthén and Muthén 2023) or mirt (Chalmers et al. 2025). The objective is to study the causal relationship between these latent variables and responses. The model considered here represents an alternative approach to modeling the impact of covariates, utilizing estimation methods and specific parameterizations that have not been employed in SEM.
The statistical models presented here draw on the contribution by Schauberger and Tutz (2022), who introduced multivariate ordinal regression models within the framework of random effects and response styles in the statistical literature. While that work provides the statistical foundations, developing a taxonomy of ordinal models that include subject-specific random effects and response-style components, our contribution adds a substantive layer by interpreting these models through attitudinal constructs from social psychology.
By embedding the ordinal IRT modeling approach with covariates within a substantive conceptual framework informed by the social psychology literature (e.g., Howe and Krosnick 2017; Petty et al. 2023), we demonstrate how it can yield nuanced insights into how individuals differ in the ways they think or feel about topics concerning society and what population subgroups hold stronger or weaker attitudes than others. Without requiring additional survey items, the model captures and separates variation in two key attitude-related dimensions: direction and strength. Attitude direction refers to the substantive stances different individuals have about topics or persons, while attitude strength reflects the intensity with which that stance is held. Such interpretation enables practitioners to address their social science questions about heterogeneity in attitudes from a substantively conceptual perspective.
In contrast to Schauberger and Tutz (2022), we also engage in a discussion and comparison with alternative approaches commonly used in the social sciences, as well as testing models with differing numbers of latent variables. The model estimation is computationally efficient as it is based on convenient maximum likelihood methods. We provide an in-depth discussion of parameter interpretation tailored to the needs of applied social science researchers and outline a straightforward way to jointly visualize the covariate effects for attitude direction and attitude strength. The approach is quite general and can be applied to many different domains to test theoretical expectations about heterogeneity. We exemplify the types of insights that can be obtained with two applications using standard mass public opinion surveys: attitudes toward gender equality (European Values Study, EVS) and the evaluation of presidential candidates (American National Election Study, ANES).
Section “Ordinal IRT Modeling and Adjacent Categories” sets the methodological ground for the ordinal item response model we propose to study heterogeneity in attitudes. Section “Modeling Variation in Attitudes” outlines the model and its substantive motivation, discusses parameter estimation, and investigates differences with alternative approaches. Section “Applications” presents the applications. Section “Conclusion” concludes.
Ordinal IRT Modeling and Adjacent Categories
IRT models that account for ordinal data are multivariate versions of ordinal regression (see Agresti 2010; Tutz 2022). Ordinal IRT modeling in public opinion research is based on the following information:
Several ordinal item response models have been proposed in the literature (for taxonomies of models, see Thissen and Steinberg 1986; Tutz 2020). 2 Our approach to understanding variation in attitudes builds on the partial credit model (PCM). Since the model was proposed by Masters (1982) and Masters and Wright (1984), it has been applied to a wide range of practical measurement problems in psychometrics that demonstrated its usefulness in various contexts (for an overview, see Masters 2016).
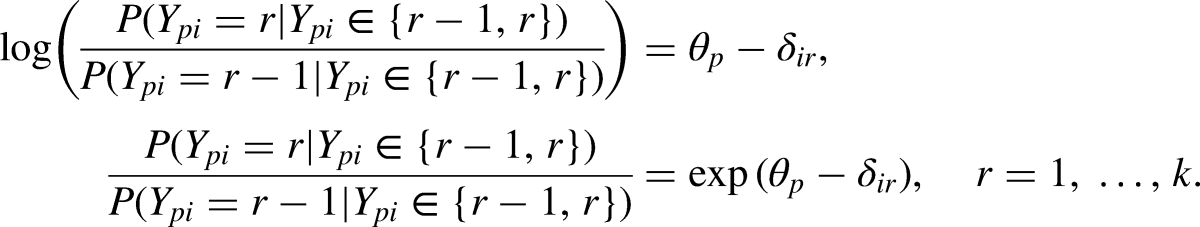
The partial credit model is the most general member of the Rasch family of latent trait models (Rasch 1960, 1961), which can be derived from the assumption of a latent continuous random variable. It belongs to the class of adjacent-categorical models whose defining property is a conditional comparison between two adjacent (immediate preceding or following) response categories. The simplicity of the partial credit model lies in this defining characteristic of using pairs of adjacent categories as it assumes that the preference is in response category
An alternative model is Samejima (1995)’s graded response model, which uses cumulative response categories. Whereas under adjacent-categorical models the effects pertain to individual categories, they refer to the entire scale under cumulative models, usually yielding larger effect magnitudes (see Agresti 2010). Previous research showed that including covariates is much easier to obtain for the partial credit model than the graded response model, which involves a considerably more complex parameterization and, therefore, way more sophisticated interpretation (Schauberger and Tutz 2022). The graded response model also tends to suffer from estimation problems (with substantially longer computation) because the modeling of cumulative probabilities comes with restrictions on the range of permissible parameter values, and the restriction gets more severe with the inclusion of covariates. Therefore, we draw on extensions of the partial credit model that account for covariate effects to provide a computationally straightforward approach that can be easily applied and interpreted.
We first present the basic version of the partial credit model to outline its underlying conditional structure and implications for parameter interpretation. Then, we discuss specific model properties that are desirable in empirical applications. These properties remain under the extensions to model individual-level variation in attitudes we present in Section “Modeling Variation in Attitudes”. Since the partial credit model is quite new to the discipline, it is worth discussing these issues in detail before introducing the extensions.
The Basic Partial Credit Model
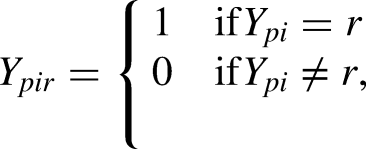
Let the person location parameter the item parameters

The probabilities for the simplest model with three response categories (
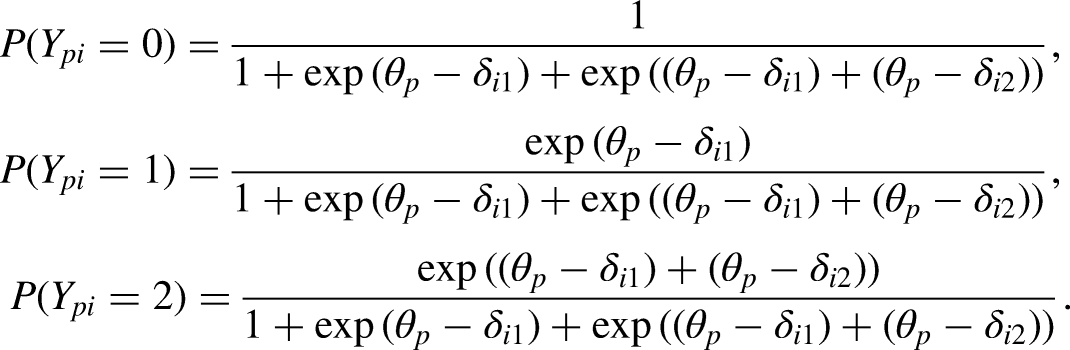
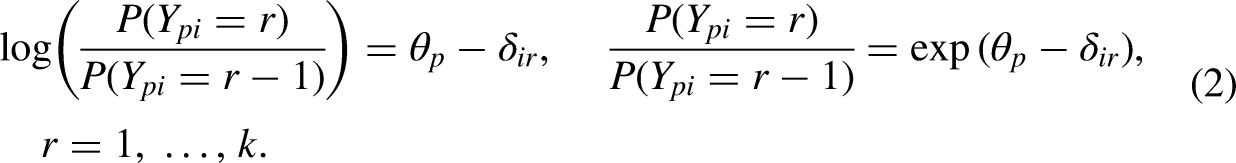
An alternative, simpler presentation of the model is based on local odds that compare the adjacent categories


Specific Properties
The partial credit model has several specific properties that make it attractive in empirical applications. A desirable property of ordinal item response models is specific objectivity, which separates the person location parameter
Even though the basic partial credit model measures attitudes and comes with desirable properties, it does not account for variability in attitudes across individuals or population subgroups. Next, we consider model extensions that allow investigating how attitudes and their strength depend on covariates and embed them into a substantive conceptual interpretation.
Modeling Variation in Attitudes
We aim to include covariates to model individual-level variation in attitudes and their strengths based on a simple parameterization that permits a straightforward substantive interpretation without the need for extra survey questions on the intensity of the feeling.
Attitudes, defined as ‘‘mental representations’’ of what people favor or oppose (Bizer et al. 2003: p. 247), are complex latent concepts with many different properties or attributes that have evolved throughout its longstanding research history in social psychology (for recent reviews, see Howe and Krosnick 2017; Petty et al. 2023). Petty and Krosnick (1995: pp. 5–6) proposed in their influential edited volume four dimensions to categorize the manifold attributes of attitudes: ones that refer to (i) the attitude itself (e.g., extremity), (ii) the cognitive structure (e.g., attitude accessibility or ambivalence), (iii) to the subjective beliefs (e.g., personal involvement or attitude certainty), and (iv) the cognitive processes of attitude formation (e.g., elaboration). 4
We aim to capture the first, potentially most essential, dimension that refers to ‘‘aspects of the attitude itself’’ (Petty and Krosnick 1995: pp. 5–6) defined as: “Attitudes are presumed to vary along an evaluative continuum ranging from a strongly positive orientation to a neutral orientation to a strongly negative orientation. This continuum can be decomposed into valence (i.e., positive or negative) and extremity (degree of favorability).”
Drawing on this conceptualization, we present a parameterization that incorporates the two components and their variation across individuals so that it allows disentangling what covariates help explain each of the components and the relations among them.
The first component (positive or negative valence), also referred to as attitude direction (e.g., Krosnick and Abelson 1992: p. 178), is captured by modeling the level of (dis)agreement as a function of covariates. The resulting covariate effects permit understanding how individuals differ in their substantive stances, revealing what is favorable or unfavorable by whom and who is pro or con.
The second component (extremity) is typically operationalized as the deviation from the neutral scale midpoint (Abelson 1995; Krosnick and Abelson 1992). Our parameterization incorporates it by modeling variation in individual tendencies to middle or extreme response categories. We call this component attitude strength 5 because the parameterization captures the spectrum between weak and strong attitudes as follows: individuals with weak attitudes (which can also be understood as nonattitudes) tend to choose neutral middle categories. By contrast, individuals with strong attitudes tend to choose extreme categories (e.g., ‘‘strongly agree’’ or ‘‘strongly disagree’’). We link these individual tendencies to covariates as well. The resulting covariate effects allow for uncovering how individuals differ in the strength or intensity of their substantive stances and what population subgroups hold stronger or weaker attitudes than others.
It is helpful to introduce the extensions to incorporate attitude direction and attitude strength step by step to the basic partial credit model in Equation (1); this is what we do next. Then, we present the comprehensive model with both components and discuss parameter estimation. The section closes by investigating differences with the hierarchical approach proposed by Zhou (2019).
Variation in Attitude Direction: Location Effects
Let

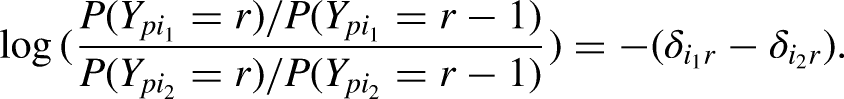
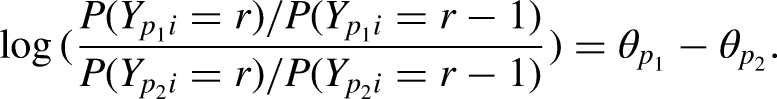
The interpretation of the covariate effects is seen by considering the local odds

Variation in Attitude Strength: Scaling Effects
The variation in attitude strength is captured by the widening or shrinkage of thresholds referred to as scaling. Weak attitudes are linked to the tendency to middle categories (widening of thresholds). Strong attitudes are linked to the tendency to extreme categories (shrinkage of thresholds). In the following, we first add a term for individual scaling to explain the logic of the parameterization; then, we add covariates. For simplicity, we ignore the location effects term
Individual Scaling
The model that incorporates individual scaling is given by

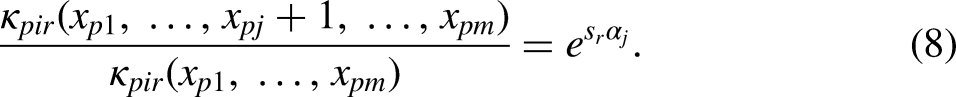
Table 1 illustrates how the factor
Individual scaling for ordered response categories
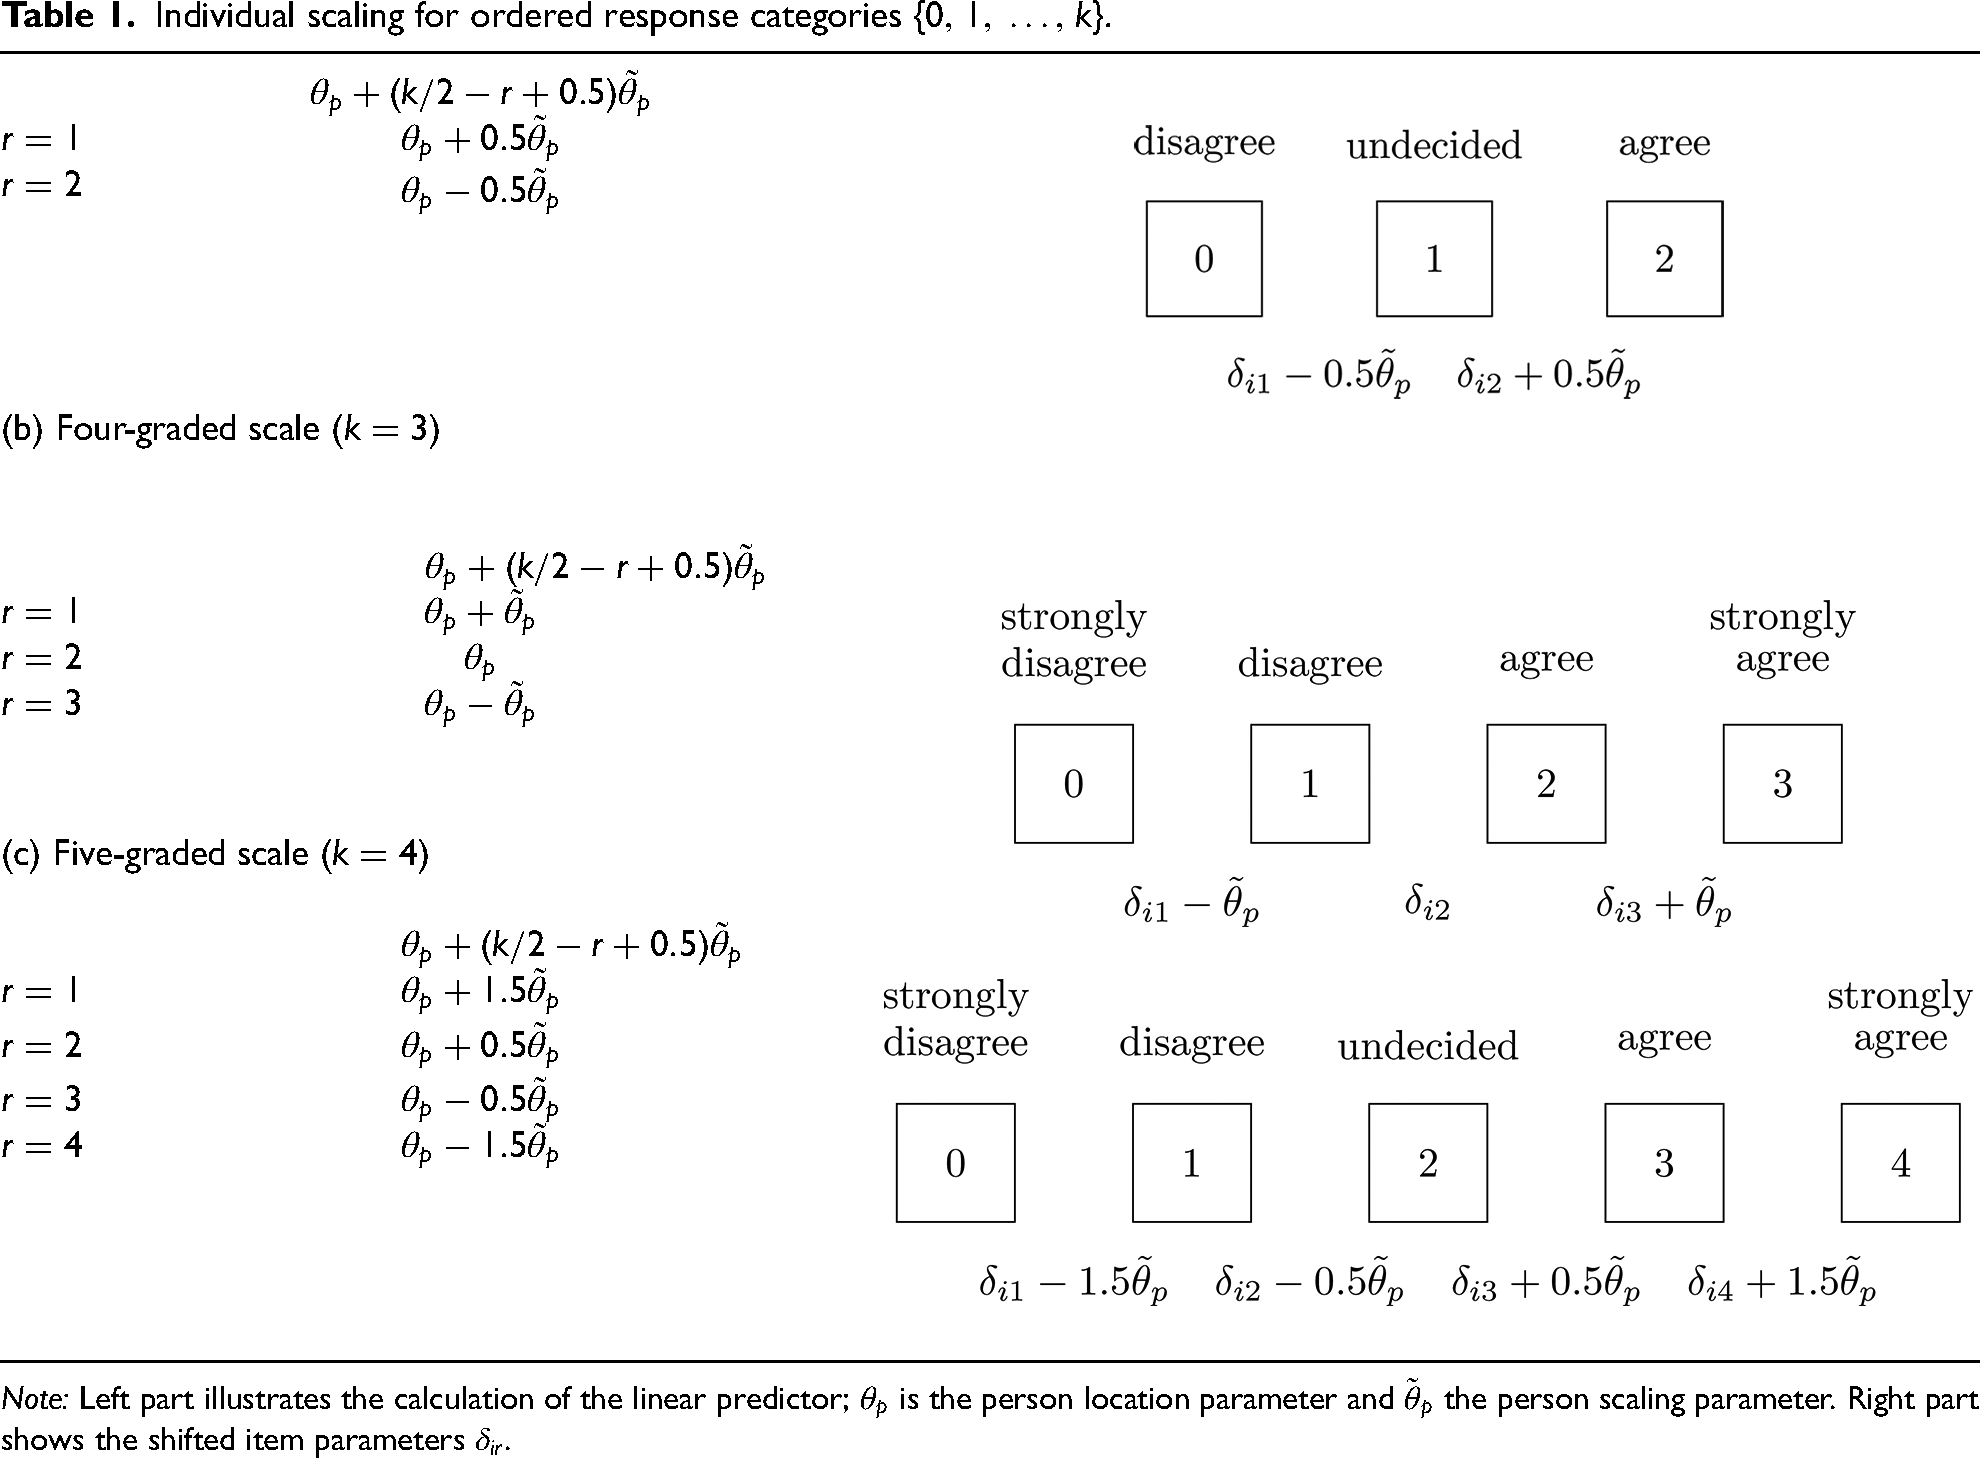
Note: Left part illustrates the calculation of the linear predictor;
It is seen from Table 1 that
Summary of items and response categories.
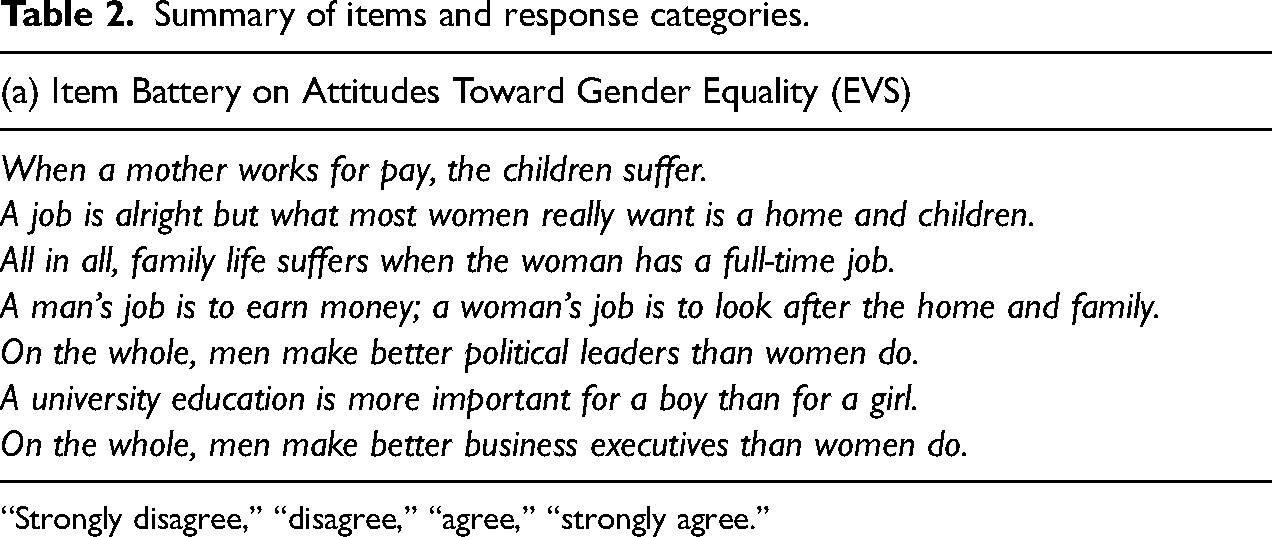
‘‘Strongly disagree,’’ ‘‘disagree,’’ ‘‘agree,’’ ‘‘strongly agree.’’
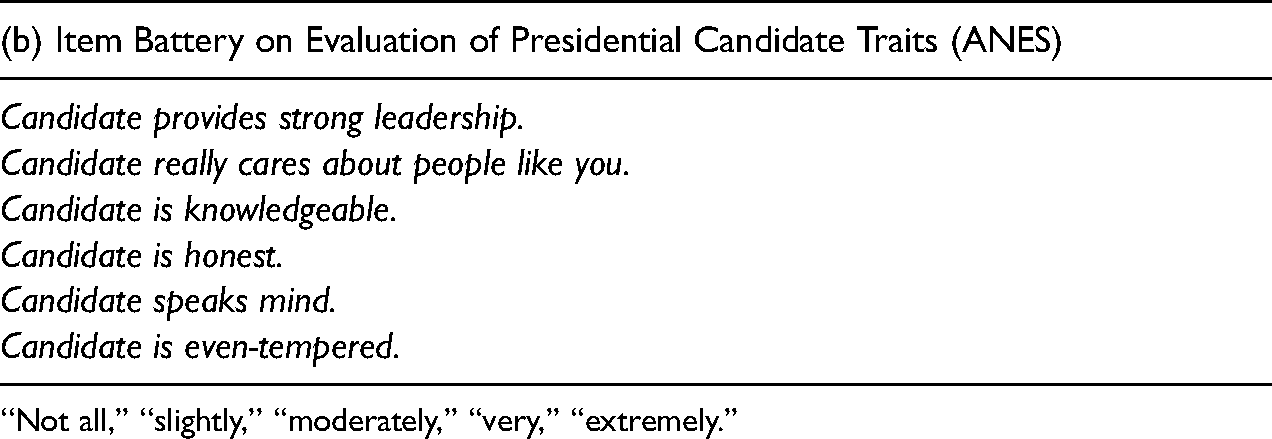
‘‘Not all,’’ ‘‘slightly,’’ ‘‘moderately,’’ ‘‘very,’’ ‘‘extremely.’’
In particular, when
When
Figure 1 visualizes how the sign of the person scaling parameter
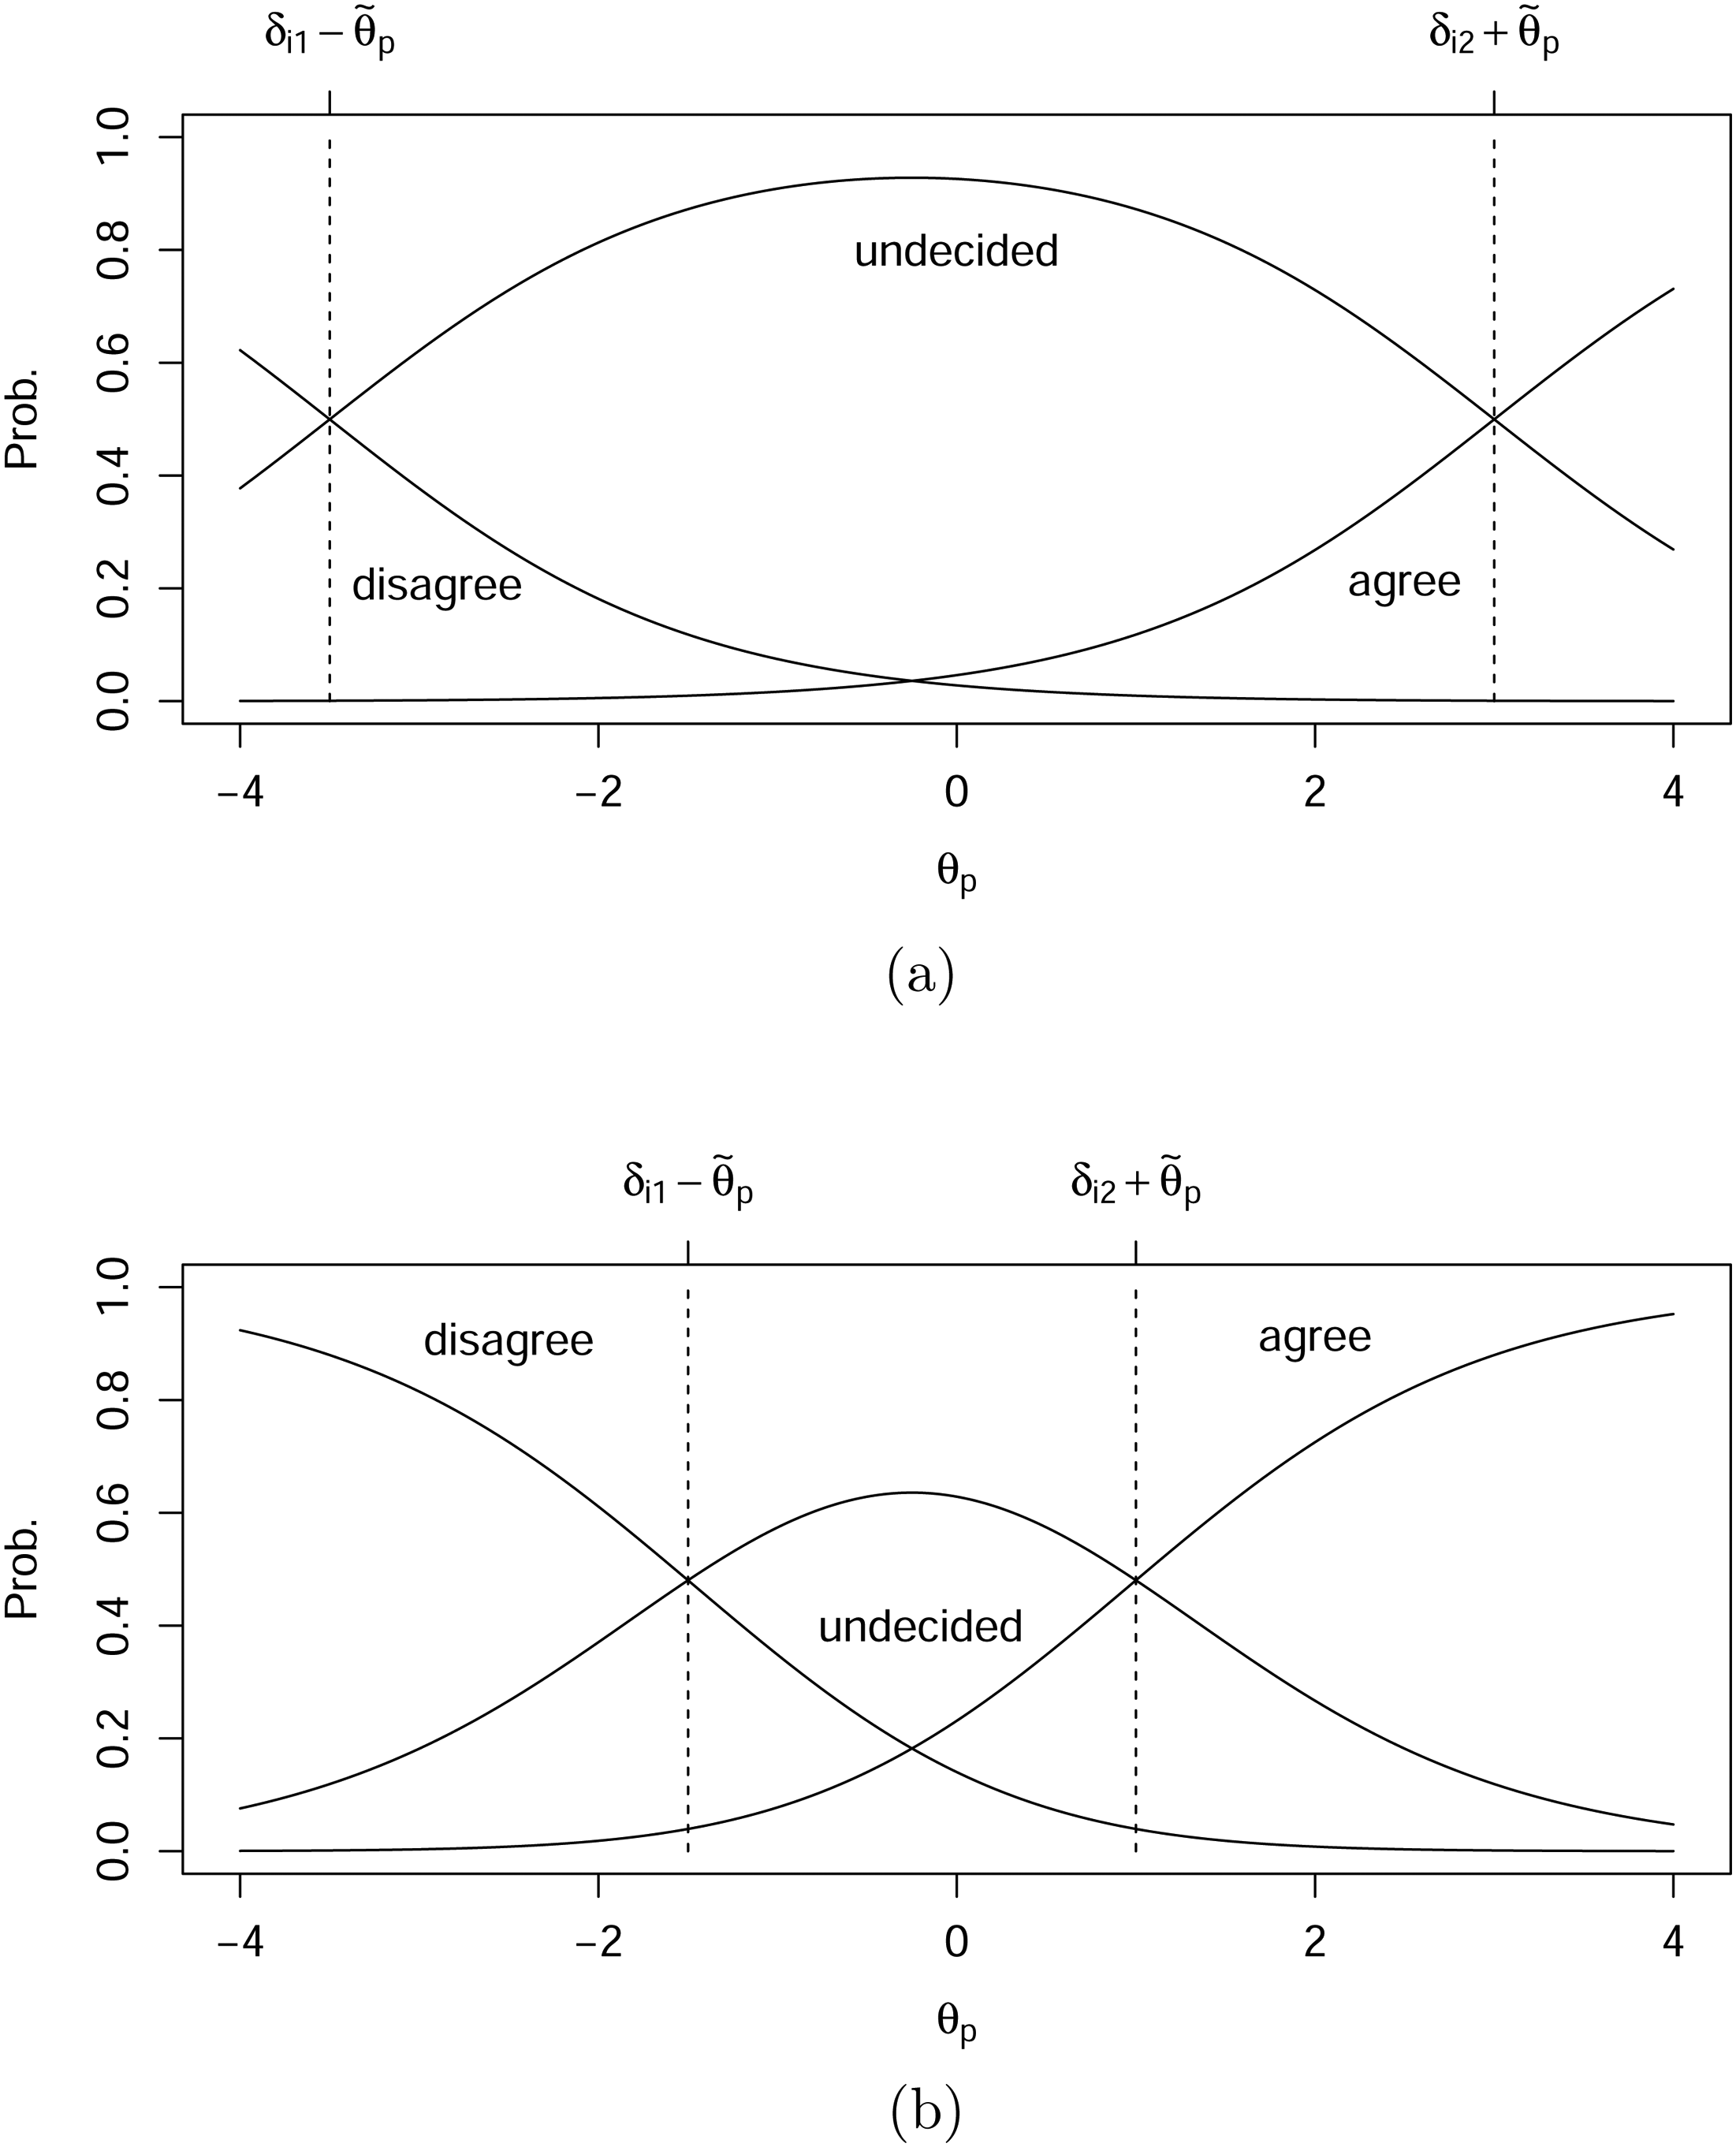
Visualization of positive and negative scaling for three-graded scale. (a) Positive scaling (
It is important to note that the parameterization in Equation (6) yields specific traits such that the second dimension
Linking Individual Scaling to Covariates
Next, we link individual scaling indicating the attitude strength to covariates by adding the term 
The dimensions we consider and link to covariates are the attitude direction and attitude strength, derived from the concepts of valence and extremity proposed by Petty and Krosnick (1995: pp. 5–6). The second dimension, attitude strength, is strongly related to response styles, which have been modeled in particular within the framework of IRT models (Böckenholt 2017; Böckenholt and Meiser 2017; De Boeck and Partchev 2012; Jeon and De Boeck 2016) but typically without the inclusion of covariates. Explanatory item response models, as proposed in De Boeck and Wilson (2004), include covariates but do not model extremity of responses in the way proposed here.
The Comprehensive Model and Parameter Estimation
The comprehensive model with location and scaling effects depending on covariates is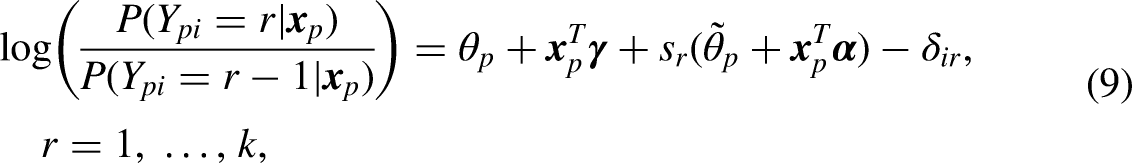

Covariate effects (

The marginal likelihood is given by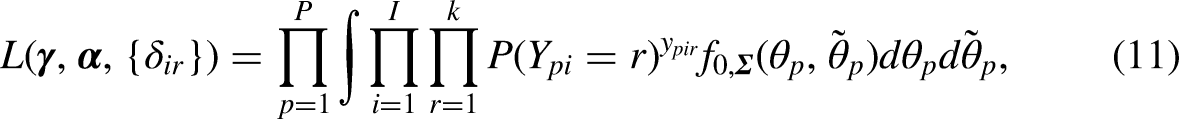

Maximization can be obtained by the expectation-maximization (EM) algorithm (e.g., Bock and Aitkin 1981) or numerical integration such as Gauss–Hermite quadrature (e.g., Liu and Pierce 1994); for more details, see Schauberger and Tutz (2022).
6
The models can be fitted using the R package MultOrdRS (Schauberger 2024). Users can choose between two optimization algorithm:
Alternative Approach
Alternative models that account for heterogeneity beyond location effects have been considered by Zhou (2019) who uses a hierarchical approach to extend graded response and partial credit models. A discussion will illustrate the differences in parameterization and the benefits of our approach to model variation in attitudes. 7
Zhou (2019) builds on the basic partial credit model (see Equation (1)) with the linear predictor
8


However, the model differs from the model propagated here with respect to the additional heterogeneity. Zhou’s approach is a one-dimensional person parameter model; it does not include a separate parameter that accounts for scaling effects. Thus, it does not account for the heterogeneity of individuals concerning the tendency to middle or extreme categories. It can only detect which individuals (or population subgroups) show a high, low, or no variance, a rather unstructured variation with no individual effects. By contrast, our parameterization comes with two person parameters, one for the location (
The comparison of the approach propagated here and Zhou’s model illustrates the various ways covariates can be incorporated into a two-trait PCM model. Covariates can directly impact item responses, covariates can fully determine the latent traits, or both strategies can be combined. The model presented here is of the latter type: latent traits are replaced by latent traits that are combined with the effects of covariates. The heterogeneity in the form of latent traits is kept and effects are included that directly influence responses. Zhou’s approach is of the second type: latent traits, more accurately, the parameters that determine the distribution of latent traits are determined by covariates.
It should be mentioned that approximate estimates might be obtained by using the package LatentGOLD (Vermunt and Magidson 2025); see Appendix E in the online supplement for syntax.
Applications
We demonstrate the substantive insights our approach can obtain with two standard public opinion surveys that contain typical item batteries to measure attitudes. The first application investigates attitudes toward gender equality using data from the European Values Study 2017 (EVS 2022). The second uses data from the American National Election Study 2016 (ANES 2017) and analyzes the evaluation of presidential candidates.
The applications differ in the number of items and response categories (summarized in Table 2, see Appendix A in the online supplement for details). The response format for the seven-item battery on statements that tap gender equality attitudes is a four-graded scale without a neutral middle category. Higher categories indicate opposing gender equality and lower ones favoring gender equality. The six-item battery on candidate traits comes with a five-graded scale, running from ‘‘not at all’’ to ‘‘extremely’’ with the middle category‘‘moderately.’’ Higher (lower) categories correspond with positive (negative) evaluations.
Application: Attitudes Toward Gender Equality
Since the 1970s, a growing research body reports gender differences in public opinion, campaigning, or voting, demonstrating the significance of gender equality attitudes (e.g., Fox and Lawless 2011; Oshri et al. 2023; Pérez and Tavits 2019; Schaffner 2005). We investigate variation in gender equality attitudes in three European countries with considerable differences in the EU Gender Equality Index 2023 (EIGE 2023): Sweden, Germany, and Hungary. Sweden occupies the first rank (82.2 points out of 100). Germany (70.8) is ranked slightly above the EU average score of 70.2, and Hungary (57.3) occupies the second-last place before Romania. As covariates, we consider standard demographics: gender, age, income, and urban–rural location. The models were fitted separately for each country.
Model Comparisons
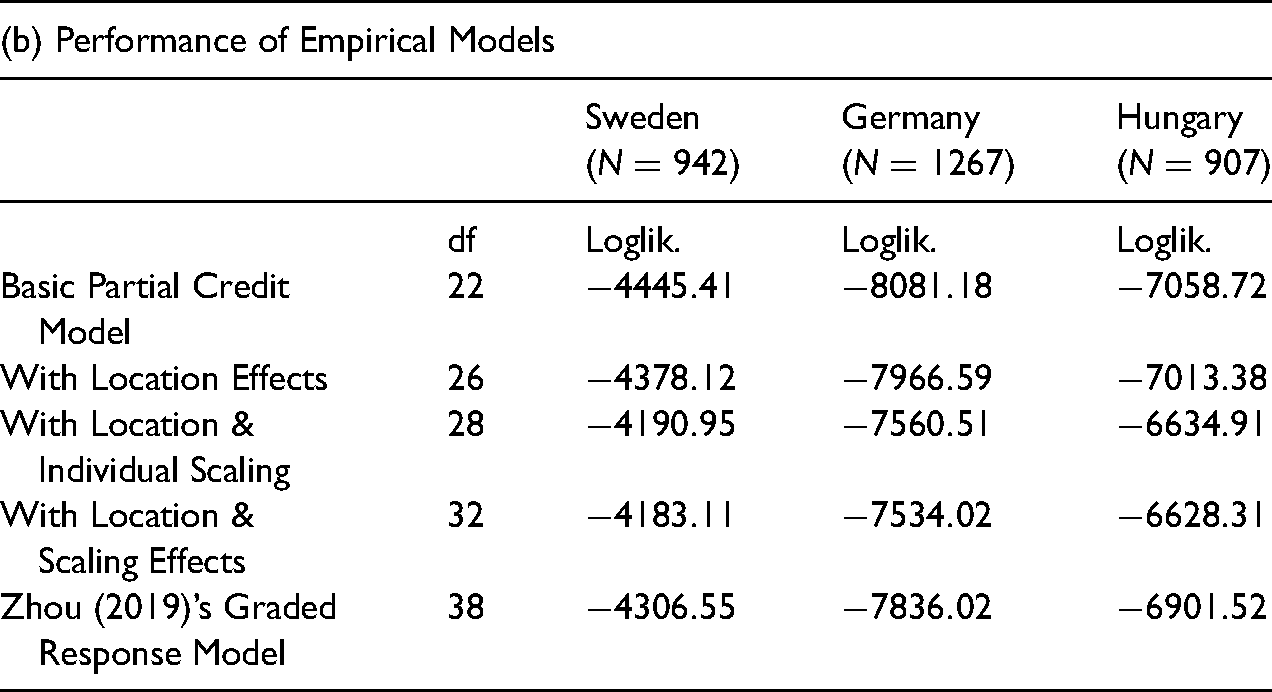
We test the presented extensions of the partial credit model by estimating four models. The first is the basic version. The second adds location effects to account for variation in attitude direction. The third adds individual scaling to incorporate variation in attitude strength. The fourth is the comprehensive model with covariates for both location and scaling effects. The basic models have 22 degrees of freedom (df): 21 item parameters
Comparisons of empirical models.
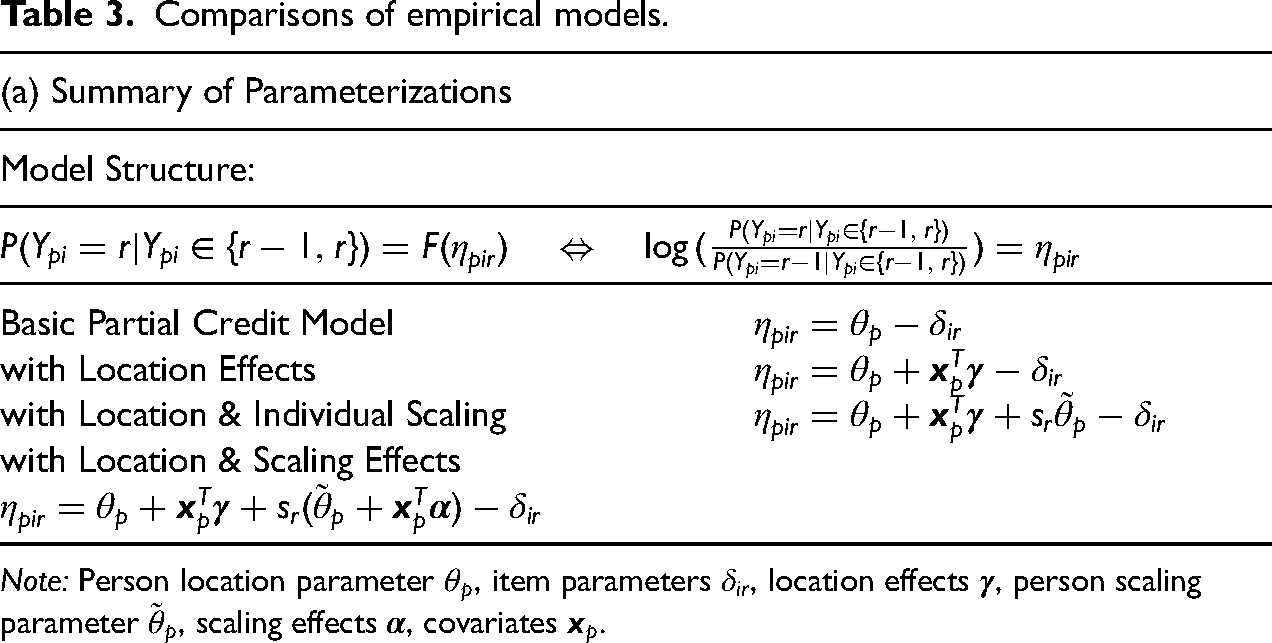
Note: Person location parameter
Note:
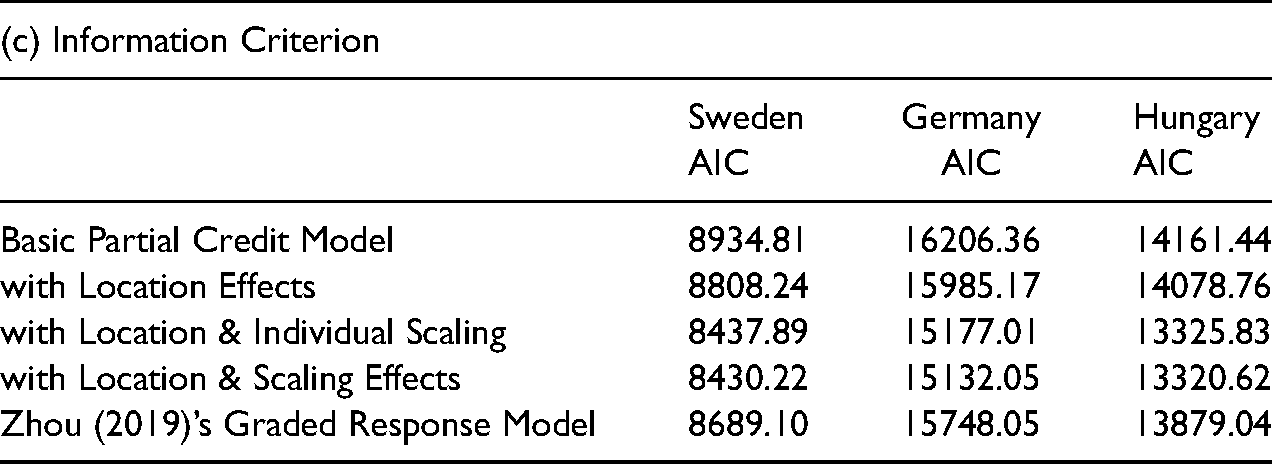
Panel (b) compares model performance based on the loglikelihood, and panel (c) reports the Akaike information criterion (AIC), including a comparison with Zhou (2019)’s graded response models (not nested in the previous models, see Section “Alternative Approache”). Comparing the parameterizations shows that model fit improves with each proposed extension. The performance measures suggest that the two-dimensional comprehensive models with attitude direction and strength provide better fits than the one-dimensional models with attitude direction only.
The comprehensive models also lead to better model fits than the graded response models, which have the same number of item and covariate parameters, two intercept estimates (
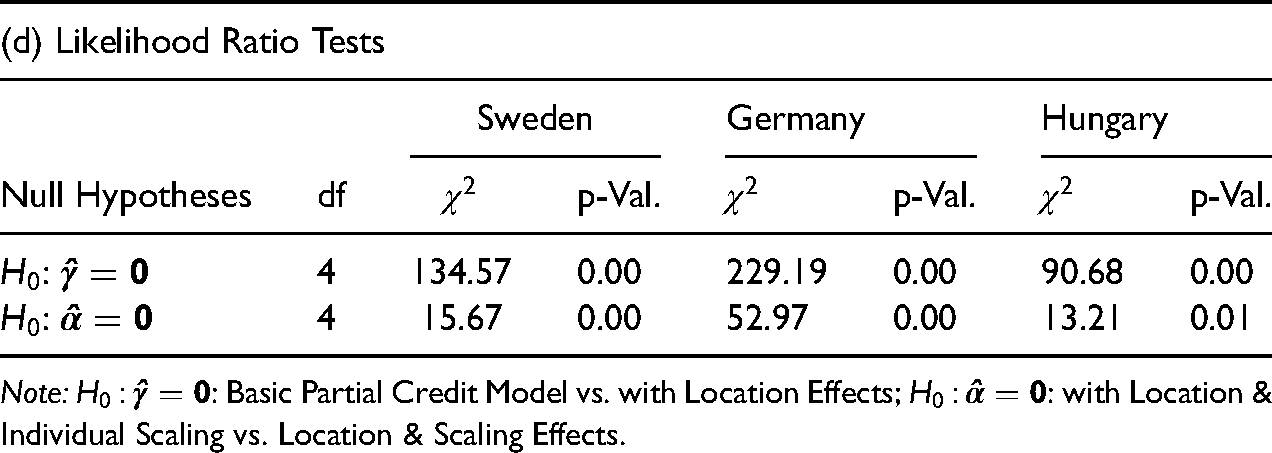
Panel (d) presents likelihood ratio tests. The first tests operate within the one-dimensional models and contrast the basic models to ones that add location effects
One- and two-dimensional latent trait models are not compared by likelihood ratio testing. While likelihood ratio tests are formally appropriate when comparing nested models (i.e., when covariates are added), they require certain regularity conditions for their test statistic to follow a
Next, we interpret the estimates of the comprehensive models and present an easy-to-grasp way to jointly visualize the covariate effects for attitude direction (location effects
Effect Visualization and Interpretation
The covariate effects can be easily grasped by depicting the local odds in Equation (10) with the tuples (
All location effects are significant, except town size in Sweden. The estimates are as one would expect: males and older people are more likely to oppose gender equality; those with higher income levels and residing in places with higher populations are more likely to favor gender equality. The effect sizes decrease in the same order as the rating in the gender equality index (except for age), indicating that the differences in attitude direction are more substantial the higher the country is ranked in the gender equality index. The significant scaling effects reveal that males hold weaker attitudes (or, reversely, females hold stronger attitudes) in Sweden and particularly in Germany, whereas there are no gender differences in attitude strength in Hungary. Older people are more likely to have weak (younger people are more likely to have strong) gender equality attitudes, notably in Sweden. Finally, there are only significant differences in attitude strength between urban and rural areas in Germany, suggesting stronger gender equality attitudes the higher the residence population.
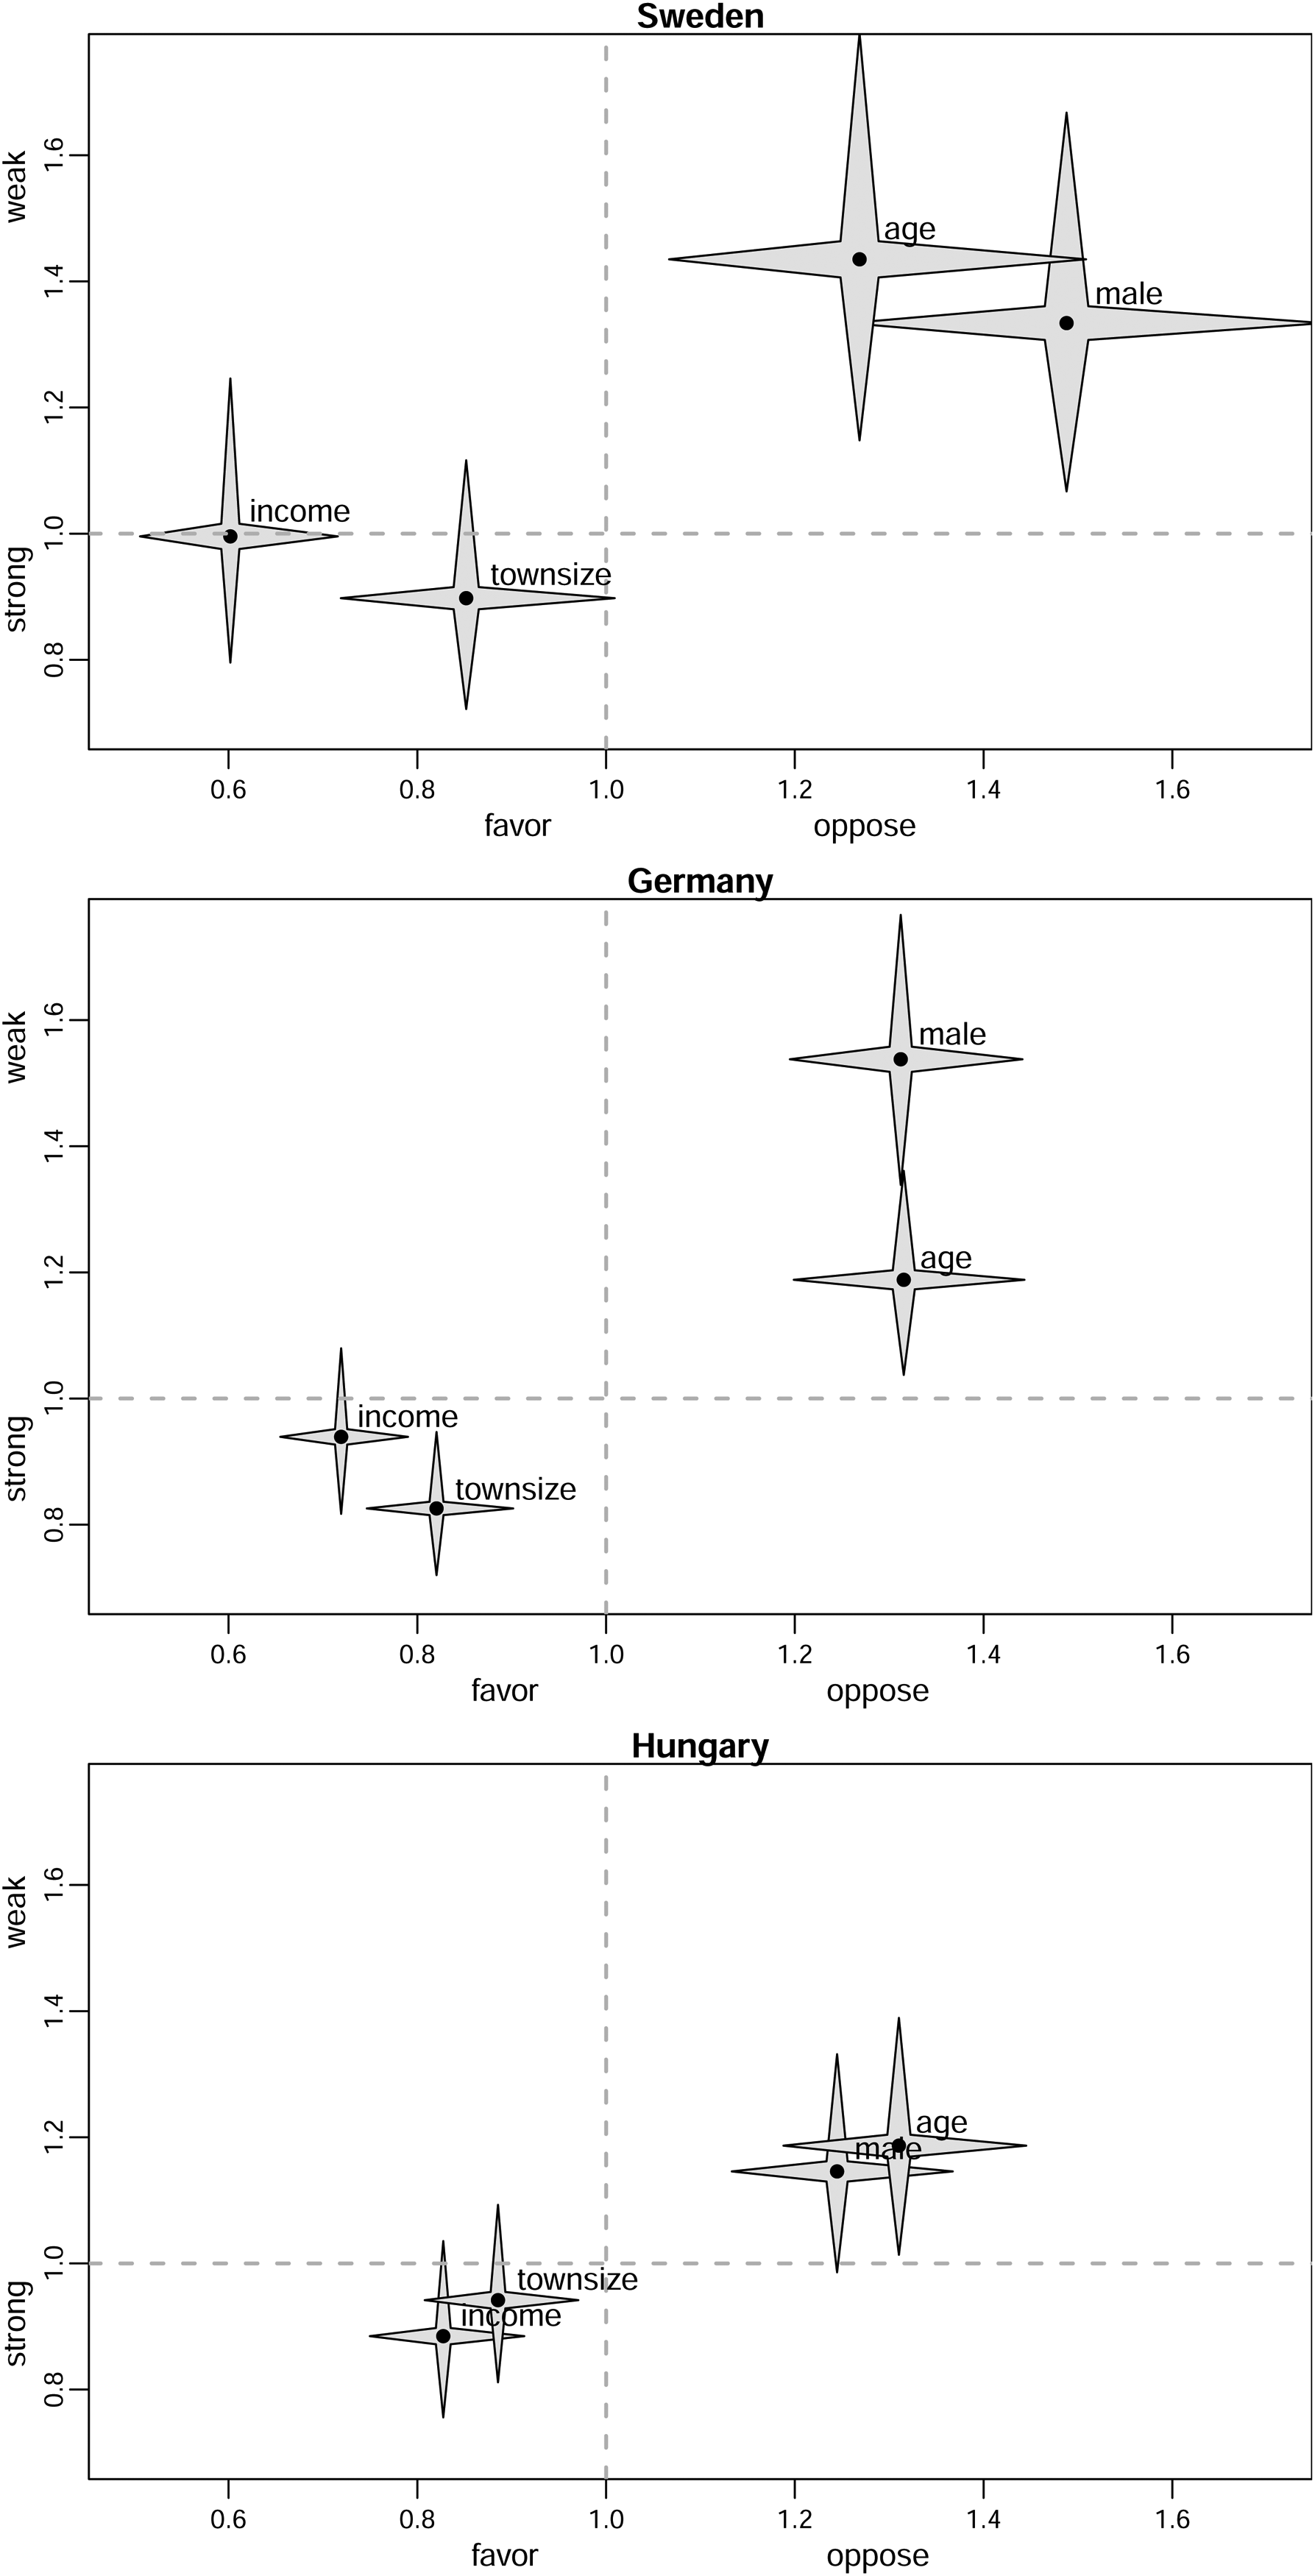
Attitudes toward gender equality: location and scaling effects. Note: Location effects
The capability of star plots lies in their ability to clearly display effects and their significance. As shown in the images, the stars are approximately the same size. However, if covariates are not standardized, variables with a wider range, such as age and income, will produce very small stars. This occurs because the corresponding effects are diminished when covariates are not standardized.
For simplicity, we treated town size as an interval-scaled variable. We reran the model for Sweden with town size as a categorical variable, reported in Appendix D in the online supplement. It is seen that using a linear effect for town size, which is more parsimonious, yields a smaller AIC value (8430.22) than the one with town size as a categorical variable (8436.614). Additionally, the dummy-coded effects (with reference category 1) are monotone, which also supports that a linear effect specification might be a sufficiently good approximation.
Application: Evaluation of Candidate Traits
This section demonstrates the types of insights the approach can obtain in studying the evaluation of candidate traits: the attitudes of voters toward the candidate’s personality or character, also referred to as candidate image or valence (e.g., Franchino and Zucchini 2015; Mauerer and Tutz 2024; Stone and Simas 2010; Stone et al. 2004). The application uses the ANES’s traditional presidential candidate traits battery (see Table 2). We selected the 2016 election and analyze the Democratic candidate Hillary Clinton and the Republican candidate Donald Trump. Again, we include standard demographics as covariates: gender, age, self-identifications as African American or Latino, and education, and fitted separately for each candidate.
As for the first application, likelihood ratio tests demonstrate the null hypotheses (
Figure 3 visualizes the location and scaling effects of the covariates. Almost all location effects indicating attitude direction are significant. Females, African Americans, Latinos, and higher educated are more likely to have a positive orientation (valence) toward Clinton. The results for the Republican candidate point in the opposite direction: the same subgroups are more likely to have a negative orientation toward Trump. These findings are indicative of markedly polarized attitudes. The largest differences in attitude direction are obtained for African Americans. In addition, older people are more likely to evaluate Trump positively, whereas there are no significant age differences in evaluating Clinton. Furthermore, all location effects are more considerable for Clinton than Trump, suggesting the subgroups that positively (or negatively) evaluate the candidates do so much more toward Clinton than Trump.
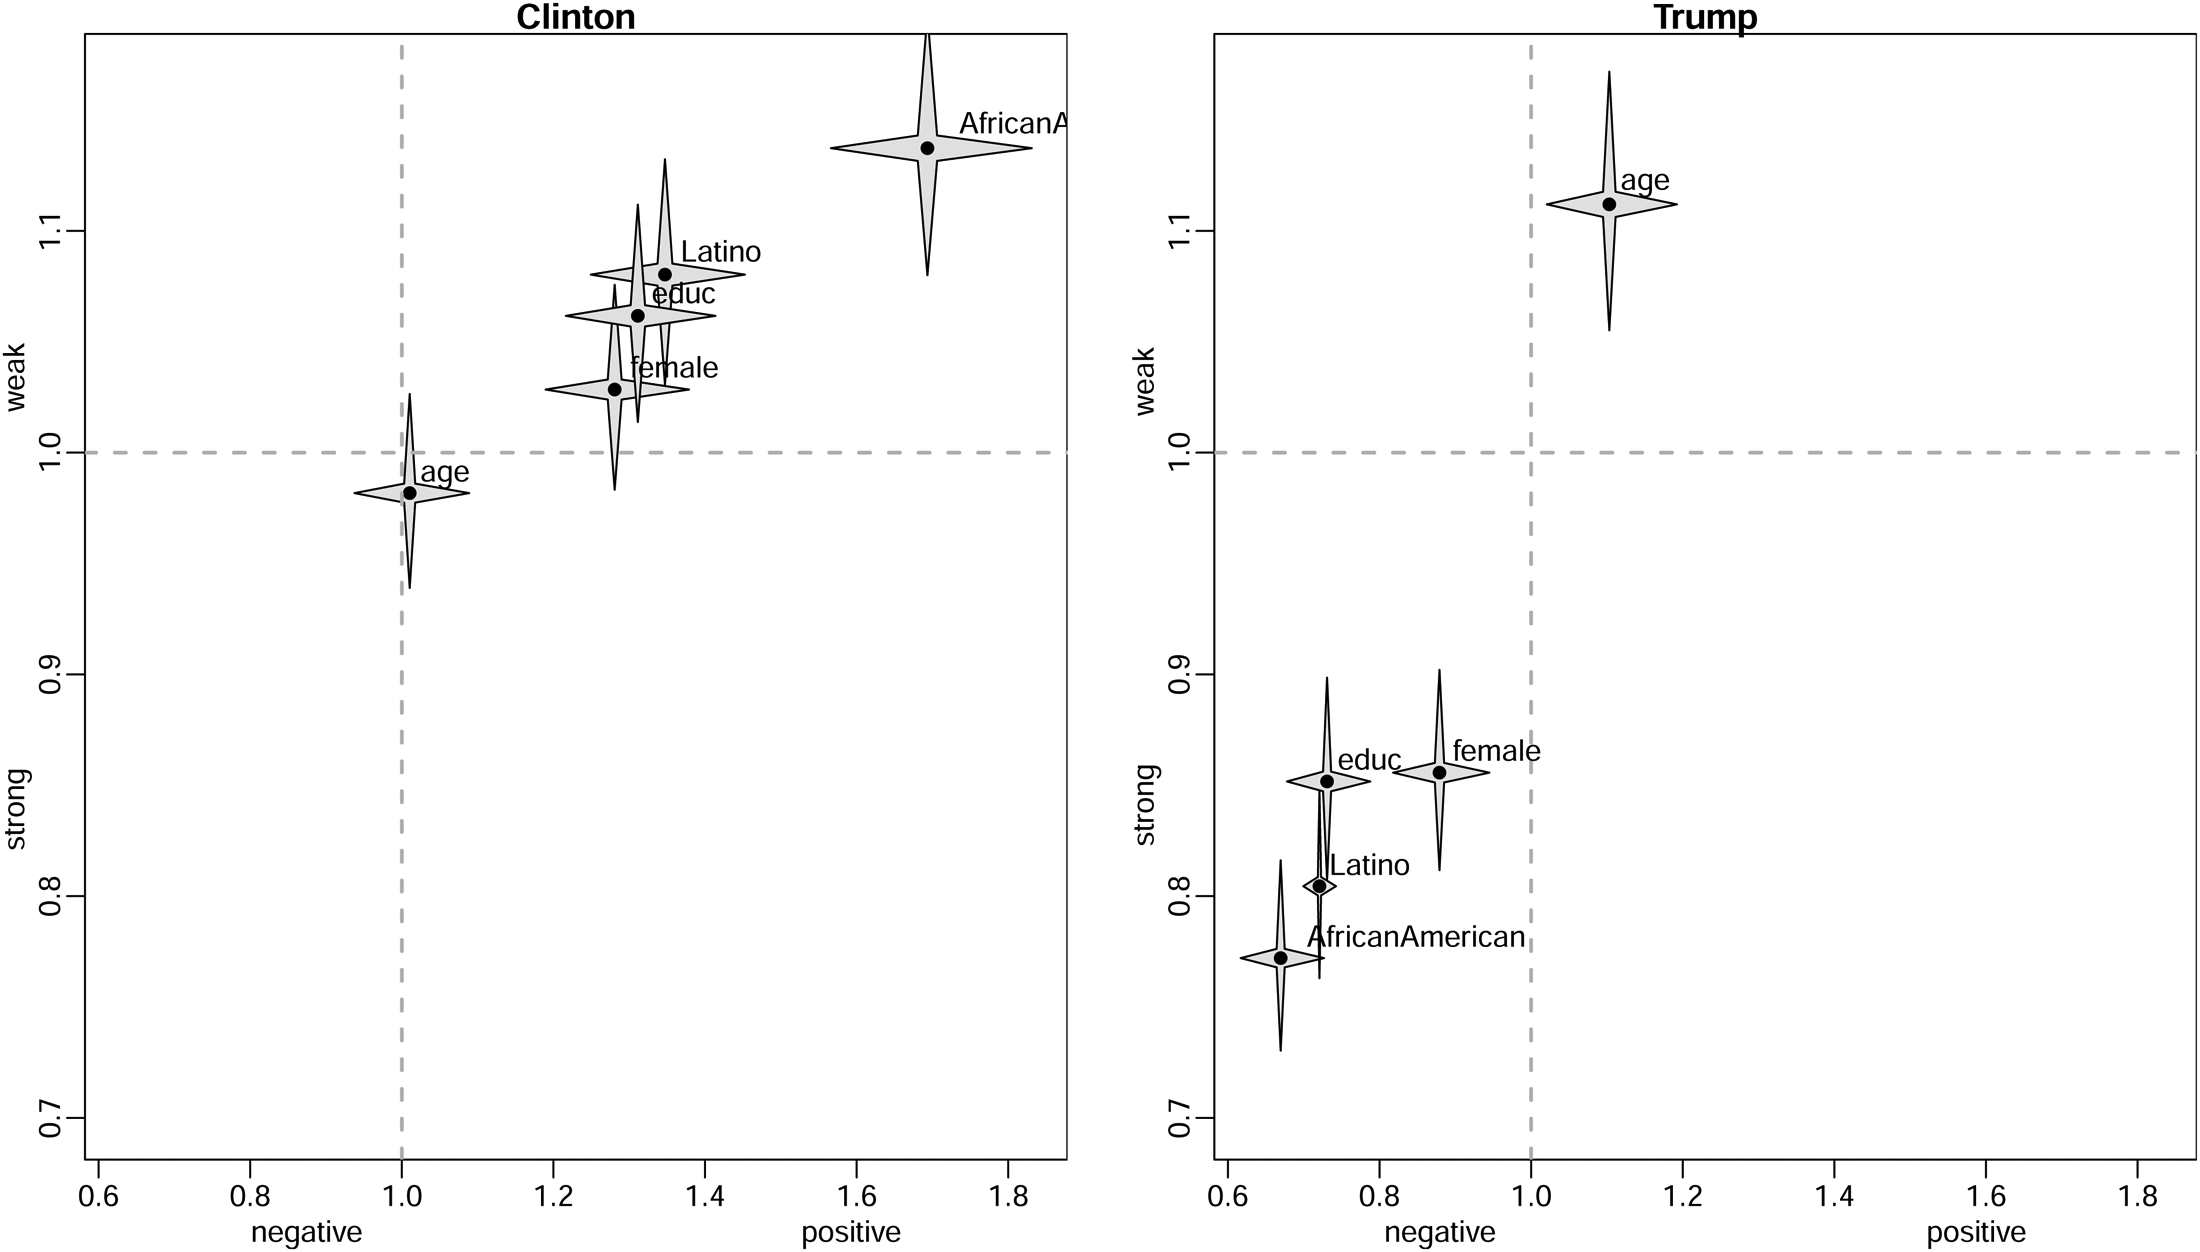
Evaluation of candidate traits: location and scaling effects. Note: Location effects
Most scaling effects indicating attitude strength are significant as well, except gender and age for Clinton. We also see pronounced polarization here and the reversed pattern as for the location effects. All scaling effects are larger for Trump than Clinton. All subgroups with a positive valence toward Clinton tend to hold weaker attitudes, and all subgroups with a negative valence toward Trump tend to hold very strong attitudes. Only older people are more likely to have weak attitudes in their evaluation of Trump. Especially African Americans, who are more likely to have a negative orientation toward Trump than the others, are the ones with the highest attitude strength. By contrast, the same subgroup, more likely to evaluate Clinton positively than the others, holds the weakest attitude strength toward Clinton.
Relations Among Attitude Direction and Attitude Strength
Finally, we present the covariance and correlation between location and scaling effects to investigate the relations among attitude direction and attitude strength. These values also help us understand how homogeneous or heterogeneous individuals are in their attitudes. The estimated (co)variance matrix 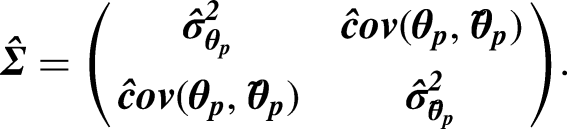
The values for the evaluation of candidate traits suggest there is much more heterogeneity in attitude direction when evaluating Clinton than Trump. This result reveals considerable variability in the valence for Clinton, whereas the reversed pattern is observed for attitude strength. Here, the respondents are more heterogeneous in the evaluation of Trump. The moderate correlations between location and scaling effects indicate that those respondents with a very positive orientation toward the candidates tend to have strong attitudes, and those with a very negative orientation tend to hold weak attitudes.
Covariance and correlation of comprehensive models.
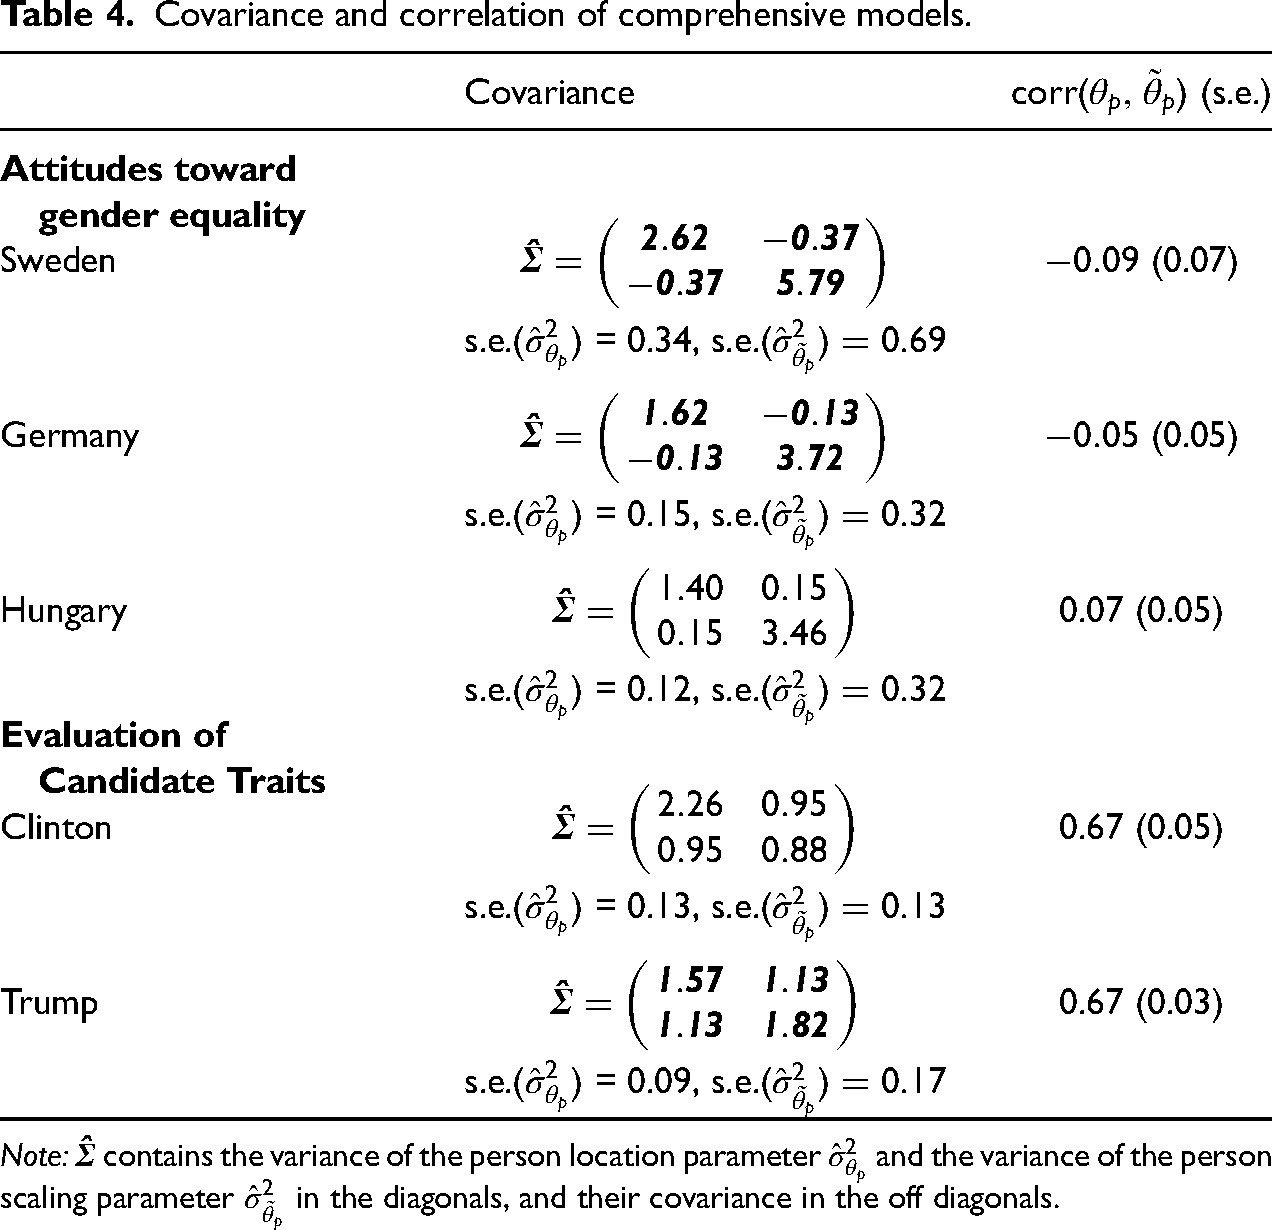
Note:
Conclusion
Attitudes, such as people’s evaluations of issues or political figures, are integral parts of public opinion research. IRT has become a popular modeling approach to measure attitudes by relying on a series of survey items that tap the specific domain of interest. The present contribution provides an explanatory modeling tool to understand attitudes better. It presents, discusses, and applies an item response model that can handle the classic ordered response options of item batteries and allows for investigating variability in attitudes across individuals as a function of covariates. Drawing on conceptualizations from the social psychology literature, we present a parameterization that captures two essential components that refer to the attitude itself: direction and strength. The approach allows the simultaneous study of both components, the relations among them, and disentangles what covariates explain each component. The applications to attitudes toward gender equality and the evaluation of candidate traits exemplify the types of substantive insights that can be gained by the approach but existing models are unable to reveal.
We present extended versions of the partial credit model that include covariates to account for attitude direction and strength. An alternative model, widely used in latent trait theory and often providing a better fit than the PCM (Maydeu-Olivares 2005), is Samejima’s graded response model (Samejima 1969, 2016). The main reason why we rely on the PCM is that parameterization is simpler. A linear predictor of the form
Supplemental Material
sj-pdf-1-smr-10.1177_00491241251403078 - Supplemental material for An Ordinal Item Response Model for Understanding Attitudes
Supplemental material, sj-pdf-1-smr-10.1177_00491241251403078 for An Ordinal Item Response Model for Understanding Attitudes by Ingrid Mauerer and Gerhard Tutz in Sociological Methods & Research
Footnotes
Data,Code,and Materials Availability Statements
The datasets analyzed and the code used during this study and documentation for the code are available in the Harvard Dataverse repository: Mauerer and Tutz (2025). Replication data for: An ordinal item response model for understanding attitudes. ![]() , Harvard Dataverse, Version 1.0.
, Harvard Dataverse, Version 1.0.
Declaration of Conflicting Interest
The authors declared no potential conflicts of interest with respect to the research, authorship, and/or publication of this article.
Funding
The authors disclosed receipt of the following financial support for the research, authorship, and/or publication of this article: Ingrid Mauerer gratefully acknowledges financial support from the EMERGIA program (EMC21-00256), Junta de Andalucia, Spain.
Preregistration Statement
This study was not preregistered because the presented empirical analyses use publicly available data that already existed before the study was begun and are cited in the reference list.
Supplemental Material
Supplemental material for this article is available online.
Notes
Author Biographies
References
Supplementary Material
Please find the following supplemental material available below.
For Open Access articles published under a Creative Commons License, all supplemental material carries the same license as the article it is associated with.
For non-Open Access articles published, all supplemental material carries a non-exclusive license, and permission requests for re-use of supplemental material or any part of supplemental material shall be sent directly to the copyright owner as specified in the copyright notice associated with the article.