
Abstract
Interviewer effects are a common challenge in face-to-face surveys. Understanding the conditions that make interviewer variance more likely to occur is essential in tackling sources of bias. Earlier evidence suggests that certain features of the survey instrument provide more ground for interviewer influence. For instance, attitudinal, sensitive, complex or open-ended questions invite more interviewer variance. In this article, we aim to validate earlier results, previously derived from single-country studies, by using the large cross-national sample of the European Social Survey (ESS). We compare 29,330 intra-interviewer correlations derived from 984 survey questions from 28 countries using data from 10 waves of the ESS. The questions were manually coded based on several characteristics. These features of survey questions were then used as predictors of intraclass correlations (ICCs) in multilevel models. The results show that question characteristics account for a significant portion of the variation in ICCs, with certain types, such as attitude and non-factual questions, items appearing later in the survey, and those using showcards, being especially susceptible to interviewer effects. Our findings have important implications for both interviewer training and questionnaire design.
Introduction
Interviewers have played a crucial role in conducting high-quality standardized measurements via surveys (Converse 1987). Their ability to follow standardized procedures and manage interactions with respondents can greatly influence the reliability and validity of the data collected. Non-zero correlations among responses collected by a particular interviewer, often referred to as interviewer effects, are a common concern in survey research (West and Blom 2017). While some of the intra-interviewer correlations arise from variable nonresponse errors across interviewers (as interviewers successfully recruit different groups of people), interviewers also introduce correlations in responses to the survey questions (West et al. 2013; West and Olson 2010). Research suggests that interviewer effects can vary across three primary domains: respondent characteristics, interviewer characteristics, and survey design features. In this article, we focus on the impact of the survey instrument.
The survey instrument determines several key aspects of the interaction between the respondent and the interviewer, including the topic, the cognitive demands placed on both the respondent and the interviewer, and the duration of the interview. Consequently, prior research found that interviewer effects vary with survey questions (e.g., Dykema et al. 2020, Holbrook et al. 2006, Holbrook et al. 2016, Mangione et al. 1992, Olson and Smyth 2015, Olson et al. 2019, Pickery and Loosveldt 2001, Schnell and Kreuter 2005). A relatively consistent finding is that attitudinal, sensitive, ambiguous, complex, and open-ended questions are more prone to interviewer effects (West and Blom 2017). Such types of questions either request confidential information or increase the cognitive burden on respondents. A common characteristic of these questions is that they complicate the respondent’s ability to successfully complete each of the four steps of the response process (Tourangeau et al. 2000). Challenges throughout this process, such as uncertainty and comprehension issues, provide more opportunities for respondents to seek clarification and assistance, thereby increasing the potential for interviewers to influence the response process (Olson et al. 2019).
The European Social Survey (ESS) is a valuable source for studying this issue, given that several prior studies found considerable interviewer effects in this research series. Beullens and Loosveldt (2016), analyzing interviewer effects for 48 continuous items, covering 36 countries in six ESS rounds, found that ignoring interviewer effects can lead to an overestimation of effect sizes and an underestimation of standard errors, increasing the risk of misinterpreting relationships between survey variables. Other studies using ESS data found that interviewers and their characteristics impact the level of nonresponse (Blom et al. 2011; Lipps and Pollien 2010), the measurement among older people (Beullens et al. 2019), the speed of the interviewer (Vandenplas et al. 2018) and straightlining behavior (Loosveldt and Beullens 2017; Vandenplas et al. 2018). Other non-ESS European surveys have found similarly strong interviewer influence (e.g., Olbrich et al. 2025).
The main research question of this study is what types of survey questions are prone to interviewer effects. Our study extends existing work in three ways. First, prior studies (Belak and Vehovar 1995; Collins and Butcher 1982; Fellegi 1964; Holbrook et al. 2006; Hyman et al. 1954; Mangione et al. 1992; O’Muircheartaigh 1976; Schnell and Kreuter 2005; Van Tilburg 1998) investigated only a small subset of questions or focused on a single country. We compare intraclass correlations (ICCs) derived from 984 survey questions from 28 countries using data from 10 waves of the ESS. This dataset enables us to enhance the robustness and generalizability of earlier findings. Second, this dataset enables us to examine cultural variations in the link between interviewer effects and question characteristics. Interviewer effects vary between countries in the ESS. For instance, Beullens and Loosveldt (2016) found that interviewer effects are particularly pronounced in eastern and southern European countries. Studies have also shown that there is substantial evidence that the use of scales (e.g., choosing extreme or middle values) is culturally determined, regardless of their substantive meaning (De Jong et al. 2008; Hui and Triandis 1989; Van Vaerenbergh and Thomas 2013). Third, we analyze previously unexplored question characteristics, such as those using showcards or interviewer notes. Whilst we use survey questions as predictors that can explain variability in interviewer effects, we also consider interviewer effects as a quality indicator for survey questions. Thus, our findings can provide robust insights into both interviewer training and questionnaire design.
Theory and Hypotheses
Our expectations are grounded in the response process theory (Tourangeau et al. 2000). According to the theory, survey respondents engage in a series of cognitive steps, including comprehension, retrieval, judgment, and response formatting. Certain question characteristics can complicate these steps. For example, a sensitive question about income may complicate the judgment process, while poorly structured response categories or unfamiliar response formats can introduce uncertainty in the response formatting stage. The core assumption is that such complications during the response process can create opportunities for the interviewer to step in. This may happen either because respondents explicitly ask for clarification, or because interviewers perceive uncertainty and feel compelled to probe, rephrase, or offer assistance, sometimes even unconsciously. Table S1 in the Online Supplement provides a summary of which survey components are expected to impact respondent-interviewer interaction at each stage of the response process. In this section, we identify survey instrument characteristics that may impact respondent-interviewer interactions and develop hypotheses for each characteristic. Hypotheses were formulated in cases where a theoretical grounding regarding the characteristic was evident. Conversely, in those cases where the theoretical grounding was weak or empirical evidence was inconsistent, a research question was formulated instead of a hypothesis.
Topic
Some questionnaires are focused on a single topic, while those in large-scale surveys typically cover multiple topics. As a result, survey questions may exhibit within-questionnaire differences depending on the topic they address. Different topics may amplify different psychological and social responses (Dykema et al. 2020), which can affect all cognitive steps of the response process. For instance, certain survey topics are more sensitive than others (e.g., questions about income, health, sexual behavior, or political beliefs). As we discuss later, sensitive topics are expected to invite more socially desirable responses (Krumpal 2013; Tourangeau et al. 2000), that is, respondents providing answers during the response phase that they believe are more socially acceptable or desirable, rather than being fully truthful. The cognitive demand during the comprehension, retrieval or judgement phases may also vary with the topic. For instance, demographic variables may require more readily available responses than other topics that are more cognitively demanding (Olson et al. 2019). Accordingly, research shows that people spend less time answering demographic questions than attitudinal questions (Bassili and Fletcher 1991; Olson and Smyth 2015; Yan and Tourangeau 2008). The higher cognitive load associated with a difficult topic may lead respondents to seek guidance or rely on the interviewer’s interpretation, increasing the chances of the interviewer’s influence on the responses. The respondent’s level of interest and engagement can also likely vary with the topic. Interviewer effects might be more pronounced when respondents are disengaged, as they may rely on cues from the interviewer to shape their answers. Relatedly, in topics where the respondent lacks confidence or knowledge, they may rely on the assistance provided by the interviewer to judge the appropriateness of their answers (Cannell 1953; Schnell and Kreuter 2005).
Importantly, question characteristics impact both actors in the interaction. For instance, the perceived topic sensitivity or the interviewer’s interest in the topic may be related to interviewer bias regardless of the respondents’ behavior. While these considerations suggest a strong impact of the topic on respondent-interviewer interactions, one would also expect significant within-topic variation between survey questions.
H1: Demographic questions are distinctly less prone to interviewer effects than other survey question topics.
Attitudes, Opinions vs. Factual Questions
Questions measuring attitudes or other non-factual information (e.g., opinions) are expected to be more prone to interviewer effects. Contrary to factual questions, that may have clear, objective answers, these questions often involve subjective judgments and interpretation, making respondents more vulnerable to the influence of the interviewer’s presence. Attitude questions often address personal beliefs, values, or preferences on various topics, such as political views, social issues, or consumer preferences. The answers to these questions may not be readily available for respondents, or they can be subject to cognitive biases (Tourangeau 1987). Existing evidence, however, is not consistent. A group of studies found non-factual questions yielding higher interviewer variance (Belak and Vehovar 1995; Collins and Butcher 1982; Fellegi 1964; Hyman et al. 1954; O’Muircheartaigh 1976; Schnell and Kreuter 2005), whilst other studies reported no differences (Groves and Magilavy 1986; Kish 1962; Mangione et al. 1992; O’Muircheartaigh and Campanelli 1998). For instance, Mangione et al. (1992) coded 130 survey questions and using a small sample from suburban Boston found no differences in interviewer effects between factual and ‘opinion’ questions. Opinion questions, however, invited more undesirable interviewer behavior, such as inappropriate probing. Though prior evidence is mixed, the theoretical expectation is that non-factual questions invite more interviewer interference.
H2: Questions asking about attitudes and other non-factual information are more prone to interviewer effect than factual questions.
Question Difficulty
Difficult items may be the ones that require the respondent to perform retrospective calculations or memory searches (Kish 1962). Other definitions involve situations where the respondent is presented with a complex issue that they may have never previously considered (Schnell and Kreuter 2005), or questions with unevenly distributed or poorly aligned response options (van der Zouwen and Dijkstra 2002). While the first example can cause problems during the retrieval phase, the other examples can affect both the retrieval, comprehension and judgement phases. When facing such questions, respondents may not feel confident in their ability to answer independently (Groves and Magilavy 1986), and thus, rely on heuristics or external cues, such as the interviewer’s guidance, to formulate their answers. Inconfidence may induce satisficing, that is, where respondents provide answers that are satisfactory or adequate rather than optimal or fully considered (Krosnick 1991). Difficult items, such as questions on the respondent’s personal network (Van Tilburg 1998), ratings of political parties (Pickery and Loosveldt 2001), crime (Schnell and Kreuter 2005) and other topics (Dykema et al. 2020; Mangione et al. 1992) were associated with increased interviewer influence in prior studies.
H3: Difficult questions are more prone to interviewer effect than not difficult questions.
Question Sensitivity
The sensitivity of the question likely plays a role. A question can be sensitive if certain responses are likely to be viewed as socially desirable or if the question is potentially uncomfortable or distressing to answer (Schnell and Kreuter 2005). In situations where social desirability bias is at play, the reporting phase can be problematic. Respondents may look to the interviewer for approval or guidance on what might be considered an acceptable or “correct” response, resulting in increased interviewer variance. Several studies reinforced this assumption by finding higher interviewer influence for sensitive items about crime (Bailar et al. 1977; Fellegi 1964; Mangione et al. 1992; Schnell and Kreuter 2005). Olson et al. (2019), on the other hand, found that sensitive questions were characterized by more adequate answers and fewer clarification requests, possibly because respondents try to quickly get over these questions and avoid additional probing or uncomfortable interaction with the interviewer. Despite the mixed findings, we expected that sensitivity increases reporting issues and thus, interviewer effects.
H4: Sensitive questions are more prone to interviewer effect than factual questions.
Design Characteristics
Besides the content of survey questions, design characteristics may also alter the response process and thus, intensify interviewer influence. One such element is the level of measurement of survey questions. A part of survey questions is typically measured using categorical response options with nominal or ordinal categories. Another common type of measurement is the use of scales where the respondent can rank their answer on a scale and the interval between each category is clearly defined. Respondents are often asked to provide numerical or textual information. The level of measurement is expected to be particularly linked with issues during the mapping phase of the response process, but in the case of open-ended questions, the reporting phase may also be problematic. Some studies found that open questions tend to provide more room for interviewer variance than closed questions because respondents often ask for clarification for the former (Gray 1956; O’Muircheartaigh 1976) (but see Groves and Magilavy 1986, Mangione et al. 1992 for null results). Additionally, open-numeric, closed-nominal, and yes/no response option formats tend to be answered more quickly than open-ended text questions (Holbrook et al. 2006, 2016; Olson and Smyth 2015). Categorical questions can invite interviewer influence if the set of response options is complex or lengthy. Scales, on the other hand, may be easier to administer because they often provide a more straightforward framework for respondents to express their opinions or attitudes.
H5: Binary response options are distinctly less prone to interviewer effects than other levels of measurement.
Regardless of the level of measurement, researchers make decisions about the number of response options and scale points for each question. A high number of response options can help respondents map and match the retrieved information to response options effectively but requires more processing, keeping more information in memory, possibly increasing difficulty, completion time (Olson and Smyth 2015; Olson et al. 2019; Yan and Tourangeau 2008), and harming the validity or reliability (Alwin et al. 2017; Saris and Gallhofer 2007) of these questions. The increased cognitive load or mapping inconsistencies can push respondents to ask for help and rely more on interviewers during the judgement phase of the response process.
H6: There is a positive association between the number of response options and interviewer effects.
Notes and instructions are often used in face-to-face surveys to provide guidance for interviewers. These notes are often technical in nature, offering instructions on tasks such as how to record responses. While such notes may not directly affect respondents, they increase the cognitive and procedural burden on interviewers. 1 Other notes, however, provide guidance for the interviewer for prompting or probing if the respondents require clarification. That may cover an explanation of certain terms. Here is one example from the 10th Round of the ESS: ”INTERVIEWER: If necessary, remind the respondent that ‘online or mobile communication refers to communication taking place over the Internet or mobile networks, using mobile phones, computers, tablets or other digital devices.’”. The ESS questionnaire also includes footnotes that provide definitions of terms used in the questions and which may or may not be used by interviewers. These notes are intended to standardize probing, however, they may also increase the risk of unnecessary or undesirable probing, resulting in higher interviewer effects during the comprehension phase of the response process. To our knowledge, the only related evidence shows that when questions include parenthetical statements and these are read aloud, respondents are less likely to experience difficulties answering the question compared to when the statements are omitted (Dykema et al. 2016).
H7: Questions that involve interviewer notes or term definitions are more prone to interviewer effects than questions without interviewer notes.
Showcards are also widely used tools in face-to-face surveys (Saraç and West 2024). The goal of using showcards is twofold. First, showcards can reduce the cognitive burden on respondents since they do not have to rely on the interviewer’s reading pace and their memory to remember each response option. Second, they may decrease interviewer effects, simply because interviewers are not involved in the presentation of response options. Results about the impact of showcards on data quality are mixed. A recent study by Saraç and West (2024) analyzed showcard use in Round 9 of the ESS. They found that showcard use significantly reduced the presence of item-missing data and middle-point selection. In contrast, Jäckle et al. (2006) reported no evidence of showcard use resulting in primacy or recency effects in the ESS. Other studies showed that questions with showcards lead to more frequent comprehension and mapping problems (Holbrook et al. 2016).
H8: Questions without showcards are more prone to interviewer effect than questions with showcards.
The length of the question can also influence both respondents and interviewers. Long and complicated questions, or questions that are preceded by an introduction statement, are expected to negatively impact the respondents’ and interviewers’ required cognitive load. Respondents are required to keep more information in their working memory; they may experience comprehension issues, and thus may choose to satisfy, ask for clarification, and rely more on the interviewer (Holbrook et al. 2006; Olson et al. 2019). To reduce your cognitive load and facilitate smoother conversations, interviewers can intentionally leave out certain words or parts of long questions, which can also lead to unwanted clustering of responses. Dykema et al. (2020), Holbrook et al. (2016), using behavioral coding, found that interviewer reading errors were greater for longer questions (but see Holbrook et al. 2006 for opposite results).
H9: There is a positive association between the length of the questions and interviewer effects.
Lastly, the position of the question in the questionnaire can also influence respondent-interviewer interactions. Both respondent and interviewer fatigue increase as the interviewer progresses (Galesic and Bosnjak 2009; Narayan and Krosnick 1996). There is some evidence that later questions in a questionnaire yield lower data quality, but the literature is rather mixed (Holbrook et al. 2016, 2007; Olson and Smyth 2015; Olson et al. 2019; Saris and Gallhofer 2007; Yan and Tourangeau 2008). Fatigue can be particularly important in the case of the ESS, which employs an, on average, hour-long questionnaire. A compelling assumption is that respondents learn over time, and get more familiar with the tasks towards the end of the survey, possibly resulting in lower interviewer involvement. Holbrook et al. (2016) found a negative association between respondent comprehension difficulties and the number of previous questions. Following the response process theory, we assume that as both respondent and interviewer fatigue increase throughout the interview, complications in the response process, and thus opportunities for interviewer interference, are more likely to occur toward the end of the questionnaire.
H10: Questions that are placed towards the end of the questionnaire are more prone to interviewer effect than earlier questions.
Data and Methods
Data
The data used in this study comes from the ESS. The ESS is a biennial cross-national survey that captures comprehensive data on social attitudes and demographics across European countries since 2002. Data collection so far has involved computer-assisted face-to-face interviewing; however, a change to mixed mode self-completion has recently been initiated at ESS (ESS ERIC 2024). 2 The ESS is regarded as adhering to some of the highest methodological standards in survey research. According to its project specification (see e.g., ESS ERIC 2024), the ESS requires participating countries to put particular emphasis on minimizing interviewer bias through mandatory, structured interviewer training sessions and comprehensive data quality checks conducted both during and after the fieldwork. This may imply that interviewer effects in the ESS are lower compared to other cross-national surveys. On the other hand, the length of the questionnaires and the rigorous protocols aimed at maximizing response rates (e.g., the ESS requires a minimum of four contact attempts) can make ESS interviewers’ tasks more challenging, potentially leading to an increase in interviewer effects. While sampling designs vary between countries, both the within-household selection (next birthday approach) and the interviewing protocol are standardized across countries. We also note that the development of ESS questionnaires involves a complex process, including omnibus tests, pilot surveys, cognitive interviews, and reliability and validity predictions using the Survey Quality Predictor (Fitzgerald and Jowell 2010). Lastly, we point out one important change in survey mode in the methodology of the ESS. Data collection in the ESS has primarily involved a mix of F2F paper-assisted (PAPI) and computer-assisted (CAPI) modes. While some countries have consistently used CAPI across all rounds, most initially employed PAPI in the early rounds before transitioning to CAPI in later waves. Given that prior research has shown that PAPI and CAPI modes can impact measurement in the ESS (Koch and Blohm 2009) we later control for survey mode in our models.
In our analysis, we intended to use data from all countries and all rounds until Round 10 which involved face-to-face interviewing. Surveys using self-administered modes were excluded. Interviewer effects may change over time due to improved survey procedures and other learning effects, particularly if the same agencies are responsible for the fieldwork. For instance, using European cross-national samples, Olbrich et al. (2025) found that a change in the contracted fieldwork institutes (or interviewer supervisors) was associated with changes in the size of interviewer effects. Beullens and Loosveldt (2016) also found that ICCs change over time in countries such as the Czech Republic, Hungary, Ireland, Slovakia, and Spain.
In our estimations, it was crucial to have geographical information. Interviewer effects can often mirror regional variations when interviewers are exclusively assigned to specific geographic areas (Rohm et al. 2020; Schnell and Kreuter 2005; Vassallo et al. 2017). Thus we excluded data collections where primary sampling units (PSUs) were unavailable. 3 Data collections where the interviewers’ ID was unavailable were also excluded. 4 Following the guidelines of Hox (2010), interviewers with fewer than 10 cases were excluded to prevent unstable estimates of random effects. This resulted in a total of 259,123 respondents interviewed by 6,460 interviewers in 28 countries.
Selection of Survey Questions
The ESS questionnaire comprises two main sections: a ’core’ module that remains relatively consistent across rounds, and two or more ’rotating’ modules that change with each round to address specific topics. Our objective in selecting questions for analysis was to maximize both the number and diversity of the questions included, ensuring a comprehensive representation of various topics and formats. Some types, however, were excluded due to statistical limitations. Questions with response options that vary between countries (e.g., Which party did you vote for in that election?) were excluded. Textual open questions were also excluded, although these are rare in the ESS. We also considered distributions. Binary variables and categorical response options selected by fewer than 5% of respondents in the main dataset were excluded due to insufficient statistical power, which could have led to unreliable estimates (Schnell and Kreuter 2005). Lastly, for similar reasons, conditional questions asked only of a subset of respondents were excluded in some cases, based on a rule of thumb that required a minimum of 500 respondents to ensure reliable estimates. This selection procedure resulted in 984 questions available for analysis.
Coding of Survey Questions
The 984 ESS survey questions were classified in accordance with the ten content and design characteristics previously defined. Of the ten dimensions, three (number of response options, length and placement of the question) were not subjected to coding procedures, as their values could be objectively determined from the surveys. The remaining seven dimensions were subjected to manual classification by two independent coders. During this process, each question was assigned to a single category within each dimension. All disagreements were coded again by a third researcher. If a question could be classified into more than one category, coders were instructed to decide which one best fitted. Table S2 in the Online Supplement provides a summary of the categories within each dimension and the instructions provided to coders.
The level of agreement between independent coders was evaluated using Krippendorff’s Alpha (Krippendorff 2019), which was found to be an adequate inter-coder agreement measure to handle the different levels of measurement used for classifying ESS questions (Feng 2013; Gwet 2021). Variables with reliabilities above 0.8 were accepted (Krippendorff 2019). The alpha values ranged from 0.809 to 0.940 (please refer to Table S2 in the Online Supplement for the exact figures). Krippendorff’s Alpha was calculated using the package irr (version 0.84.1) of R (Gamer et al. 2019).
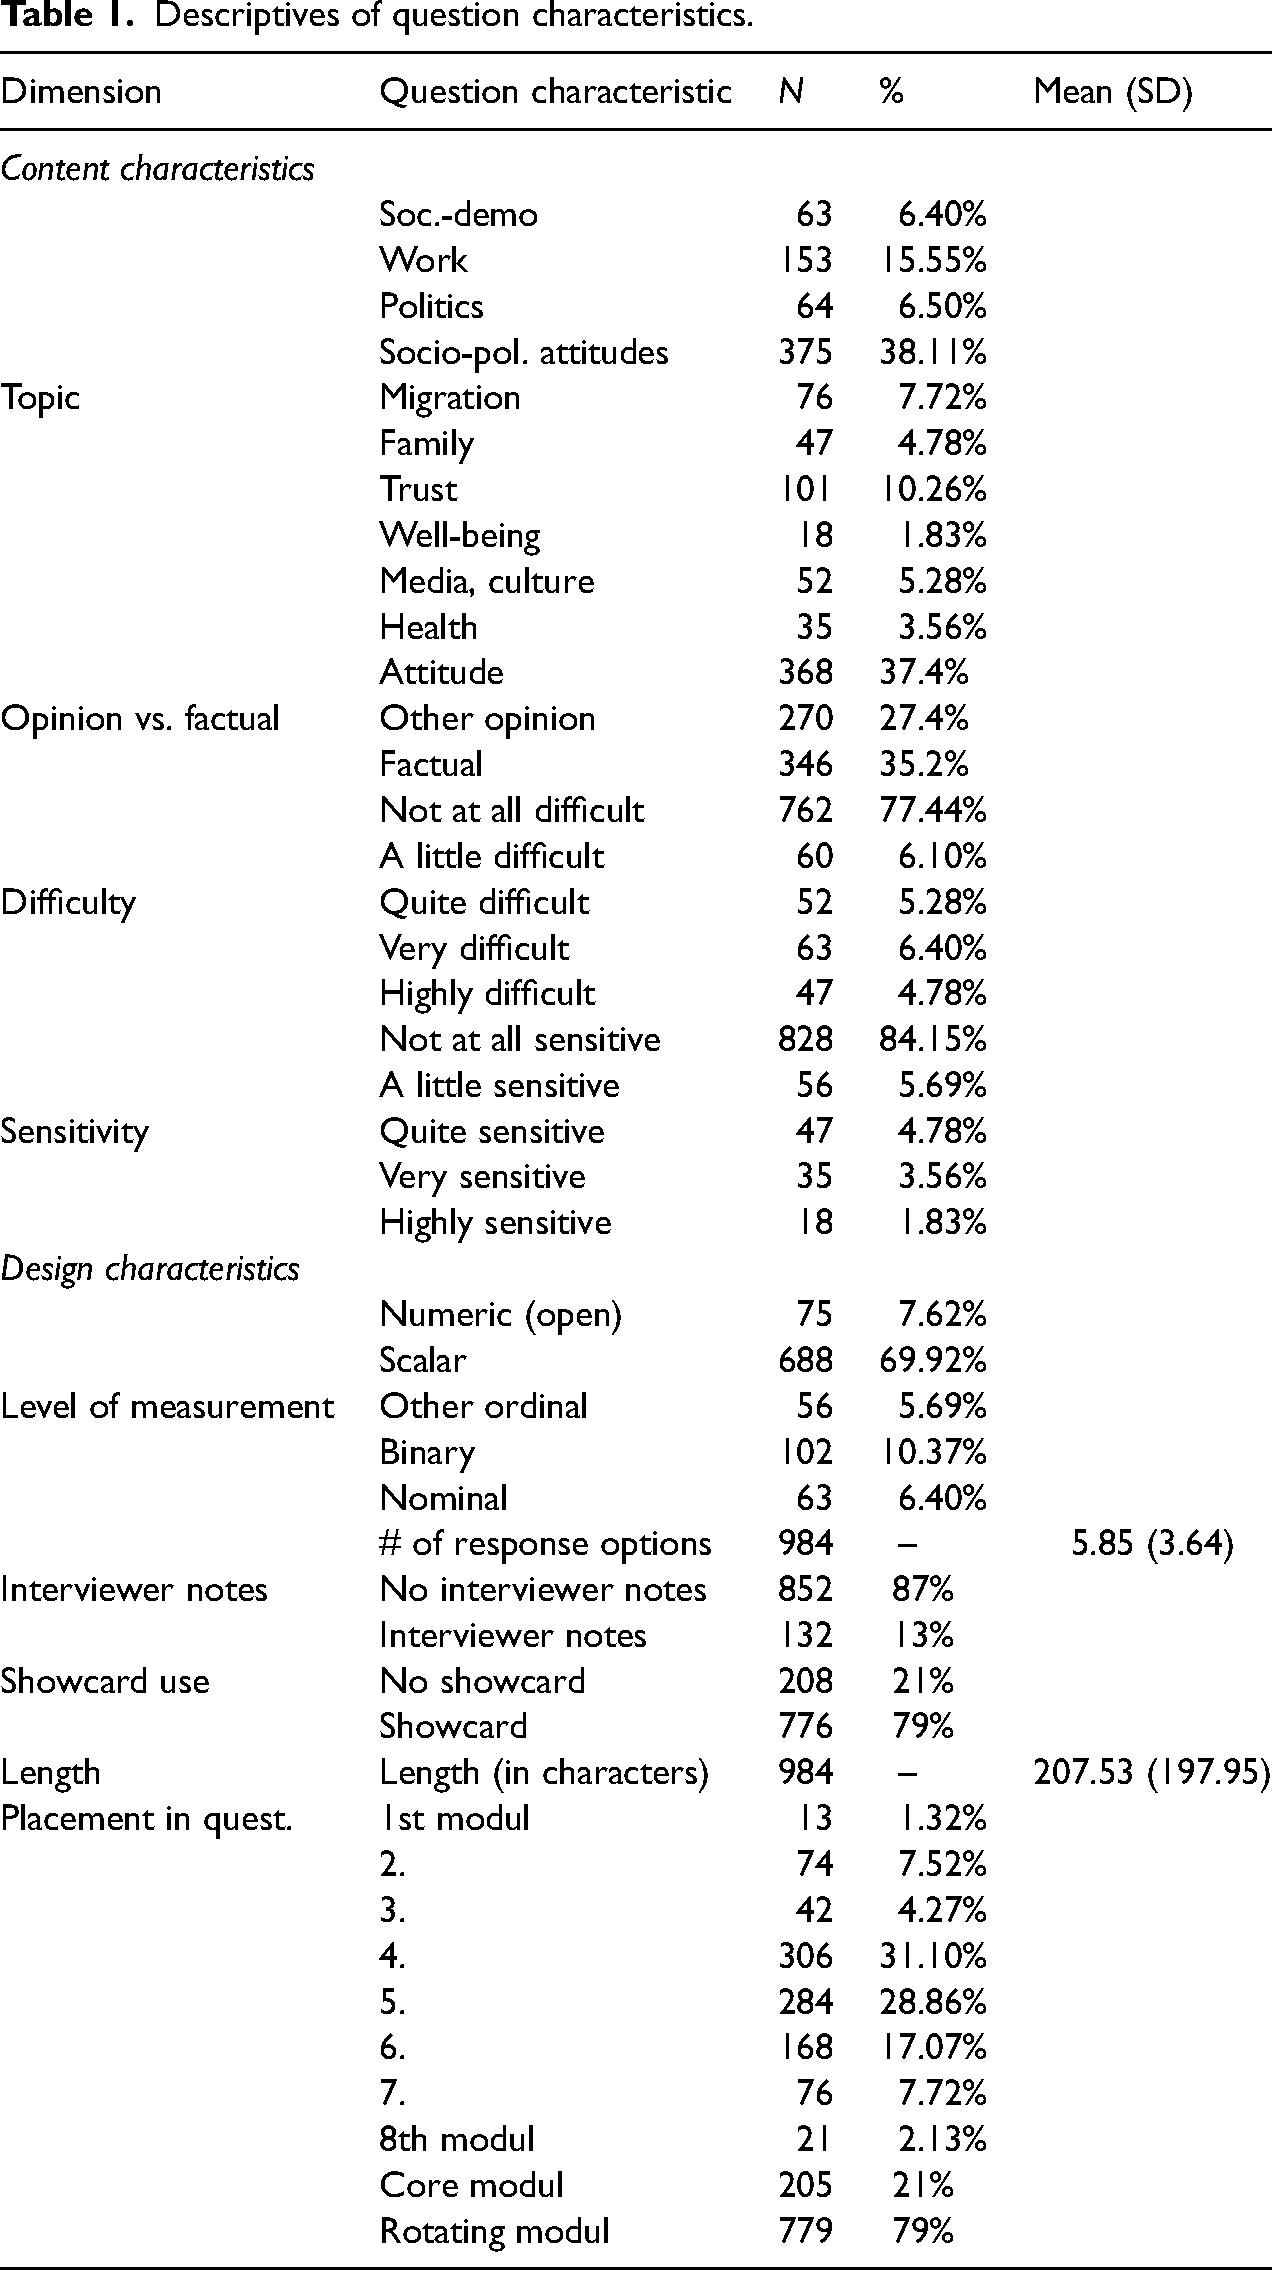
We provide descriptive distributions of question characteristics in Table 1.
Descriptives of question characteristics.
Estimation Strategy
In the first step of our estimation strategy, we calculated interviewer variance for each question. A common way of measuring interviewer variance is via ICCs. The ICC indicates the extent to which respondents’ answers are clustered by interviewers, reflecting the interviewer’s influence on the process by which respondents form their answers. Multilevel models were used to obtain ICCs. As mentioned earlier, geographical units needed to be considered in our estimation to separate interviewer effects from area effects. In nationwide face-to-face surveys, interviewers typically work within specific geographical areas, making it difficult to distinguish whether variations in responses are due to interviewer influence or regional characteristics (Rohm et al. 2020; Schnell and Kreuter 2005; Vassallo et al. 2017). To tackle this confounding effect and separate the interviewer and area variance, PSUs were included in the models. Interviewers and PSUs were cross-classified. As suggested by one of the anonymous reviewers, controlling for basic socio-demographic characteristics of the individuals can help to account for the clustering of similar respondents assigned to the same interviewer. As a robustness check, we estimated the ICCs using the same model specification but adding the respondent’s gender, age, and educational level as predictors. The correlation between the ICCs derived from the models with no control and with socio-demographic control was .97, thus, we focus on the models that did not involve socio-demographic control.
Due to the diversity of the questions, it was not feasible to apply a linear model to all questions. Logistic models were fitted for the binary variables. Nominal variables with a limited number of response options were dummy-coded, and logistic models were applied accordingly. The formula in logistic models slightly differs; in these cases, residual variance is fixed at
We used the following formula for obtaining ICCs from linear models: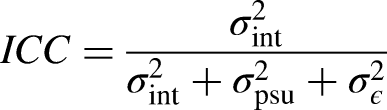
The models were fitted within each country and round (if the question was asked in that country and round). Listwise deletion was used to handle missingness on the individual level. We needed to further consider ICCs obtained from nominal and check-all-that-apply type questions. For these questions, we obtained an ICC for each response option, though they were coded as a single question in the question dataset. Including multiple ICCs for a single question would have resulted in an overrepresentation of that question in our analysis. To prevent this, we took the average of the ICCs derived from nominal and check-all-that-apply questions in each data collection. This resulted in a total of 32,943 ICCs.
In the next step of our estimation strategy, we used these ICCs as the unit of analysis (see Beullens et al. 2019, Schnell and Kreuter 2005 for similar approaches). We merged the dataset of ICCs with the question dataset and used the ICC as the dependent variable and the coded question characteristics as predictors. This dataset was also clustered. Each question appeared in multiple countries and rounds, that is, ICCs were nested within questions and countries. To account for this, we again apply random intercept multilevel models with random effects included for the question and the country. We fit the models hierarchically, starting with an empty model, adding content-related question characteristics as fixed effects in the next step, and adding design features in the next step. We added one methodological control variable to the models: whether the question was asked using a computer-assisted technique (CAPI) or paper and pencil (PAPI). In the next step, we fit the full model in four different regions (Western Europe, Eastern Europe, Southeastern Europe, and Southern Europe). Here we use country-fixed effects. As a final step, we computed two-way combinations of question characteristics (e.g., difficult and sensitive items). 5 To create a combination with the two continuous variables, binary variables were computed by dichotomizing each continuous variable at its mean. We added these two-way combinations to the full model separately to assess which combinations are the most influential in determining ICCs. Combinations with a prevalence lower than 5% were excluded.
Following Beullens et al. (2019), ICCs were multiplied by 100 to obtain more interpretable parameters, and this transformation also facilitated easier model convergence. We used Cook’s distance to detect potential outliers in the ICC variable, and excluded those observations with a Cook’s distance value exceeding the threshold of 4 times the mean, as they could disproportionately influence the model results (1,673 ICCs). The final dataset thus contained 29,330 ICCs and 984 questions. It was also important to assess multicollinearity, given that many features naturally go hand-in-hand. For example, demographic questions are typically factual, requiring binary or categorical responses, while attitude questions often use scales. The lmer package (Bates et al. 2015) of R was used to perform the models, and the car package (Fox et al. 2007) to assess multicollinearity.
Results
The mean of our dependent variable (ICC) was 0.09 (SD = 0.08, MED = 0.07) across all types of questions and 28 countries. Means of ICCs across the 10 rounds varied relatively strongly between countries, with the lowest in Iceland (0.02) and the highest in Greece (0.18, see Figure S1). In contrast, ICCs did not change substantially over time, when considering the full sample (see Figure S2). There is more variation within countries (see Figure S3). In some countries, ICCs have increased, while in others, interviewer effects have declined, and in most cases, no substantial change is observed. As shown in Figure 1a and b, ICC distributions and means vary with question type. For instance, questions about socio-political attitudes, migration, trust, or well-being were more likely to invite high interviewer effects, whilst topics such as demographics or work invited minimal interviewer variance. Questions requesting attitudinal or other non-factual responses were also associated with higher interviewer variance compared to factual questions. Question difficulty also tends to increase interviewer variance, whilst sensitivity yielded only slight differences in distributions. Regarding design characteristics, ICCs were the lowest for open numerical responses compared to other types showed similar levels. Questions with showcard use yielded higher interviewer variance than the ones without showcards, as well as those questions placed towards the end of the questionnaire. We found a weak positive Pearson correlation (r = .12, p < .001) between the number of response options and interviewer variance, and a low negative correlation with the length of the question (r =
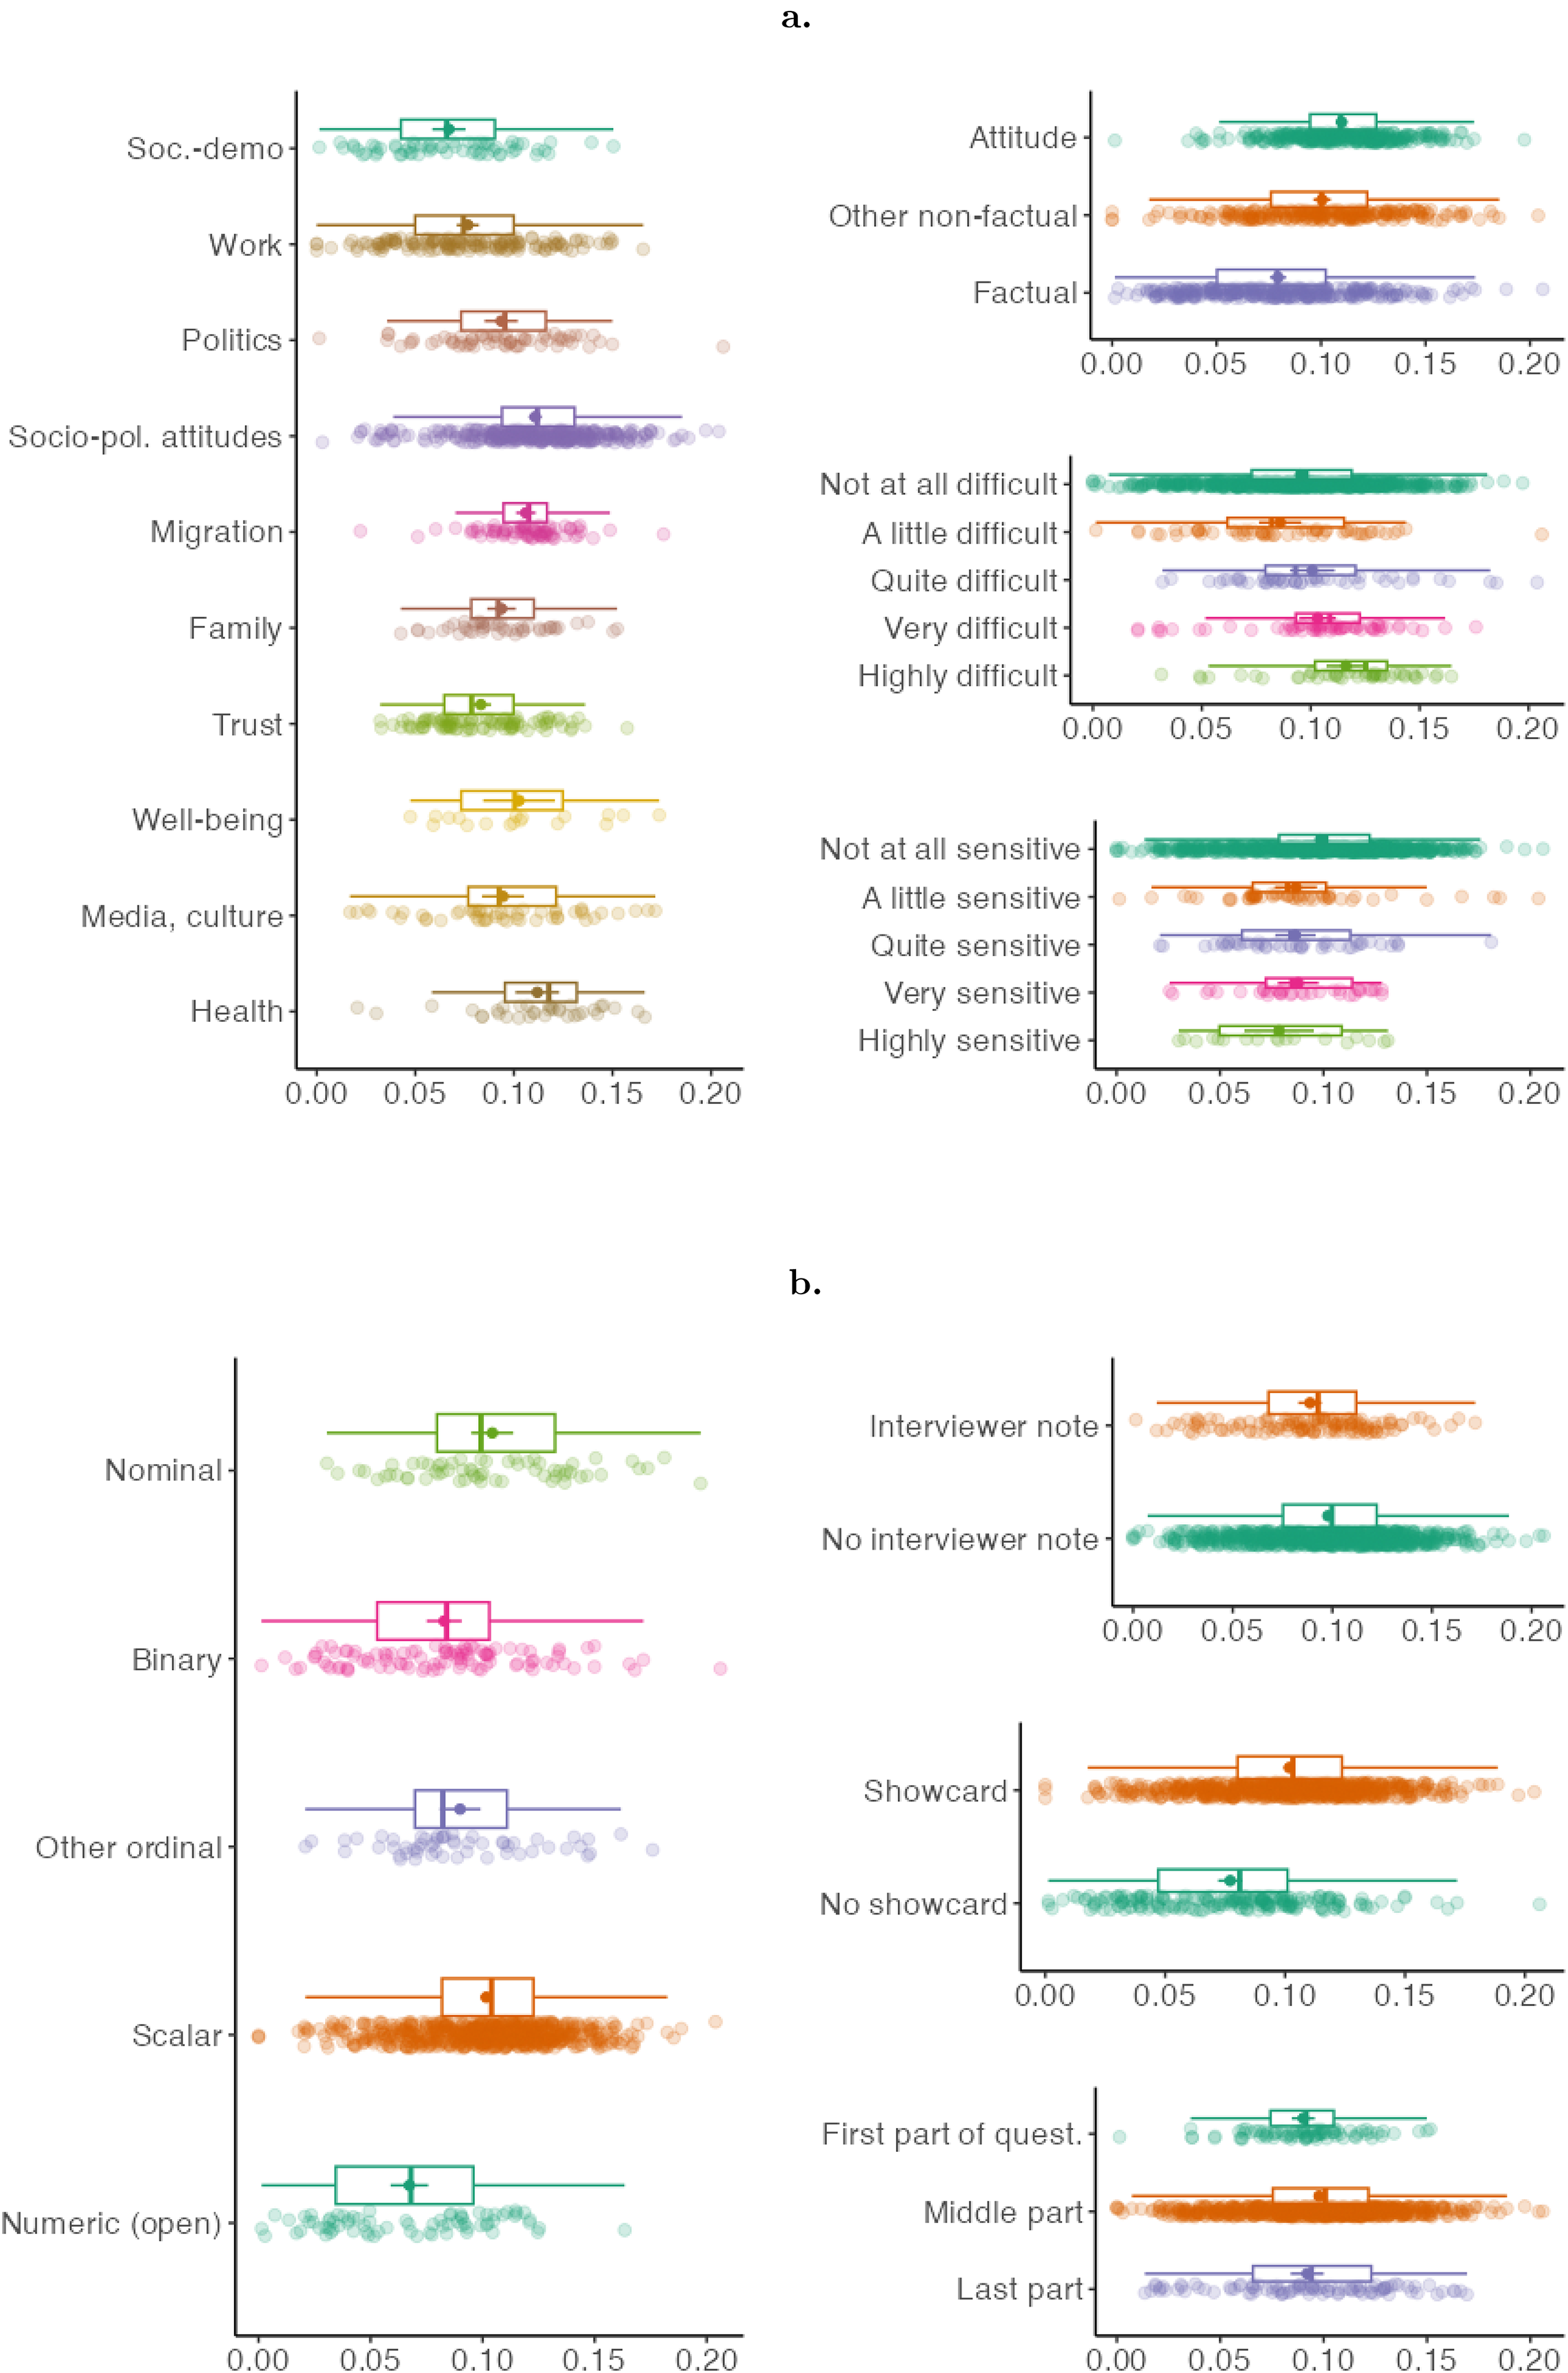
(a) Descriptive plots of ICCs per content-related characteristics (b) Descriptive plots of ICCs per design-related characteristics.
We now discuss the results of the multilevel models. 6 As shown in Table 2, the random effects in the empty model indicate that the question level accounted for 14% of the total variance, while country-level variation explained an additional 38% of the total variance. Next, we added content-related question characteristics as fixed effects. Content-related fixed effects accounted for 5.1% of the total variance, although the model’s total explanatory power did not increase because fixed effects explained some of the variability that was previously captured by the random effects. Relating to H1, several topics were significantly associated with interviewer variance. We only mention topics with high standardized betas, as the large sample size makes p-values less indicative of meaningful associations. In line with the descriptive results, socio-political attitudes, migration, health, media, and culture topics were associated with higher interviewer variance. Questions asking for factual information were less likely to be associated with high ICCs than attitude questions, which provides support for H2. Question difficulty was positively associated with interviewer variance (support for H3), whilst sensitivity was unrelated to variations in ICCs (rejection of H4). In the final model, we added design characteristic predictors. This increased the variance explained by fixed effects by 0.05 points, showing that design features also matter, but to a somewhat smaller extent than content features. The strongest design predictor was the level of measurement. The use of open numeric items decreased the likelihood of interviewer influence. Otherwise, scalar, binary and other types are fairly similar in this regard (rejection of H5). The number of response options was unrelated to interviewer variance, thus, we reject H6. We similarly reject H7, because the involvement of interviewer notes or term definitions was not associated with interviewer effects. Questions that involve the use of showcards yielded higher ICCs (rejection of H8), but question length was not linked to interviewer effects (rejection of H9). Lastly, questions placed toward the middle or end of the questionnaire were associated with higher ICCs (support for H10). We also note that the use of CAPI significantly increased the likelihood of a higher interviewer effect compared to the PAPI mode. When comparing the results of the multilevel models using the two types of ICCs (linear probability and logistic ICCs), we find that the observed associations are in the same direction, p-values are comparable with minor differences in effect sizes, except for one variable (see Table S4). The variable that captures the level of measurement shows that binary and nominal items increase ICCs, which was not present in the linear probability-based models.
Results of the multilevel models predicting ICCs.
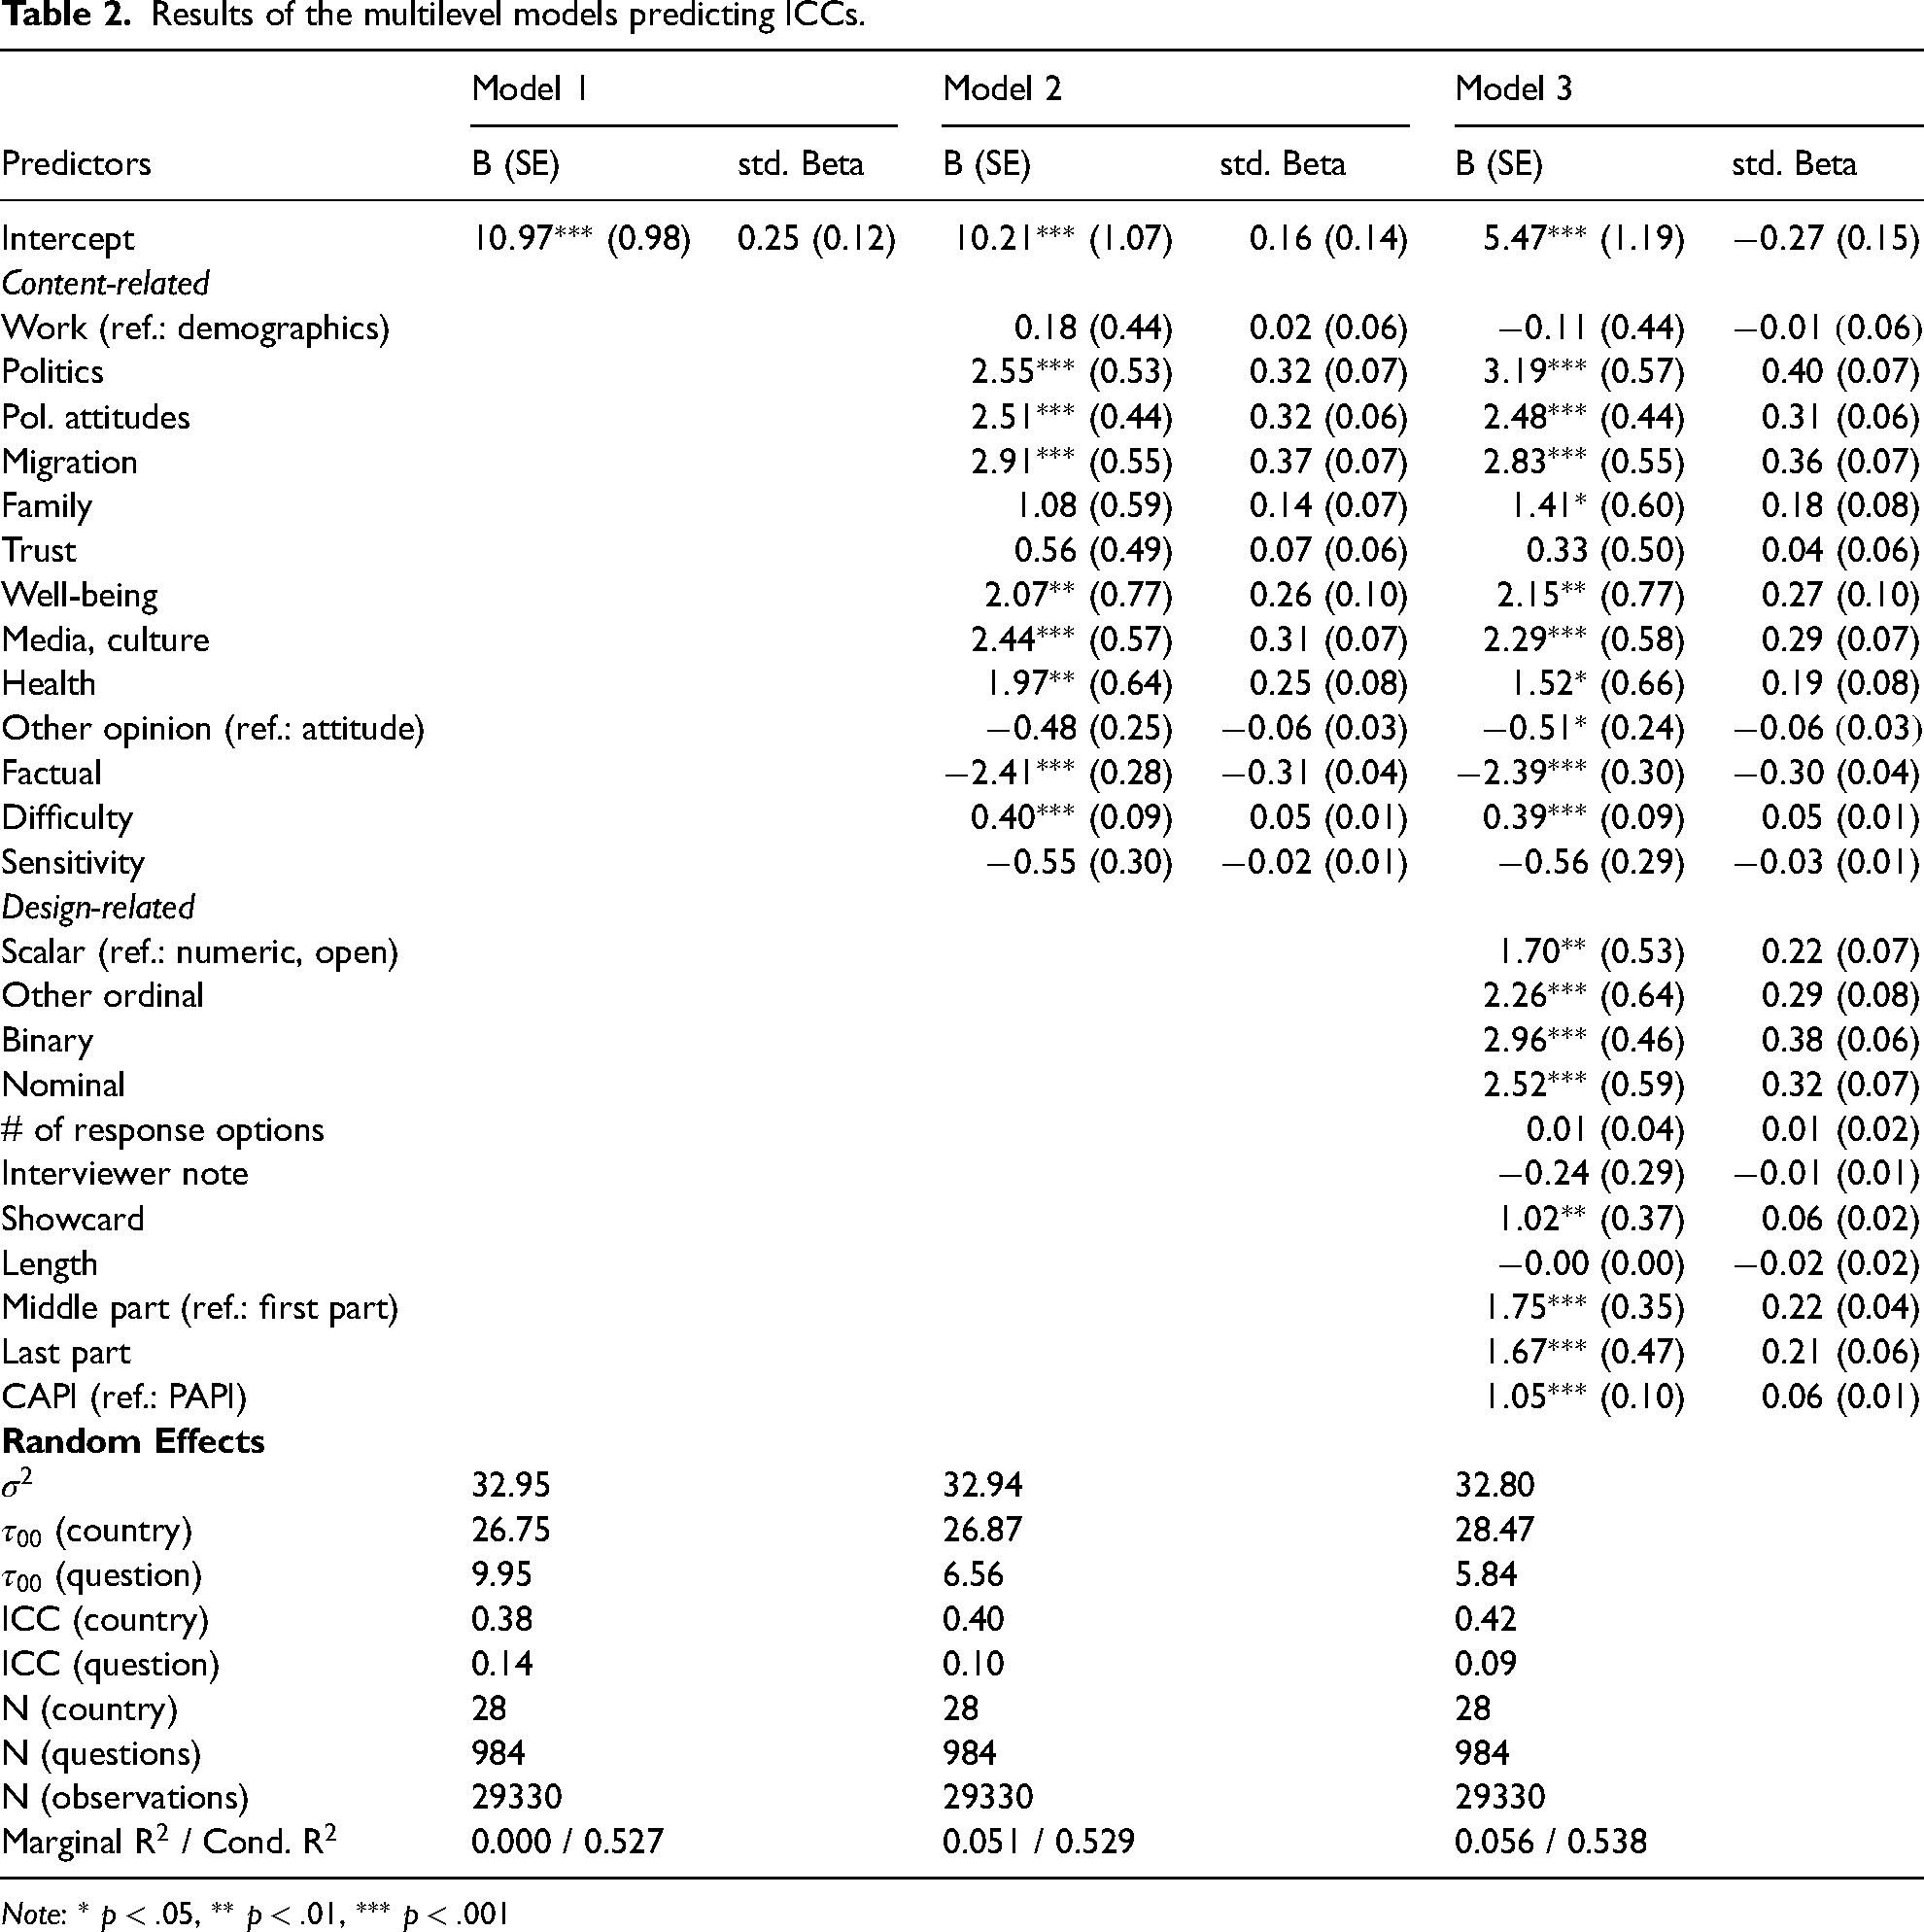
Note:
Table 3 summarizes the results of the full models fitted in the four regions. As suggested already by the high country ICCs, we found strong variation in these effects between regions. Particularly, Eastern Europe stands out. Standardized betas were the largest in this region; some of the effects were only significant in Eastern Europe. For instance, media, culture and health topics, or showcard use, increased interviewer effects only in this region. In contrast, few predictors were associated with interviewer effects in Western Europe. For example, socio-political attitudes and question difficulty did not appear to play a significant role in this region. However, some associations remain consistent across countries: factual questions tended to elicit fewer interviewer effects in all regions, as did questions with numerous open response options and those placed later in the questionnaire.
Results of the multilevel models predicting ICCs in different regions (with country fixed effects).
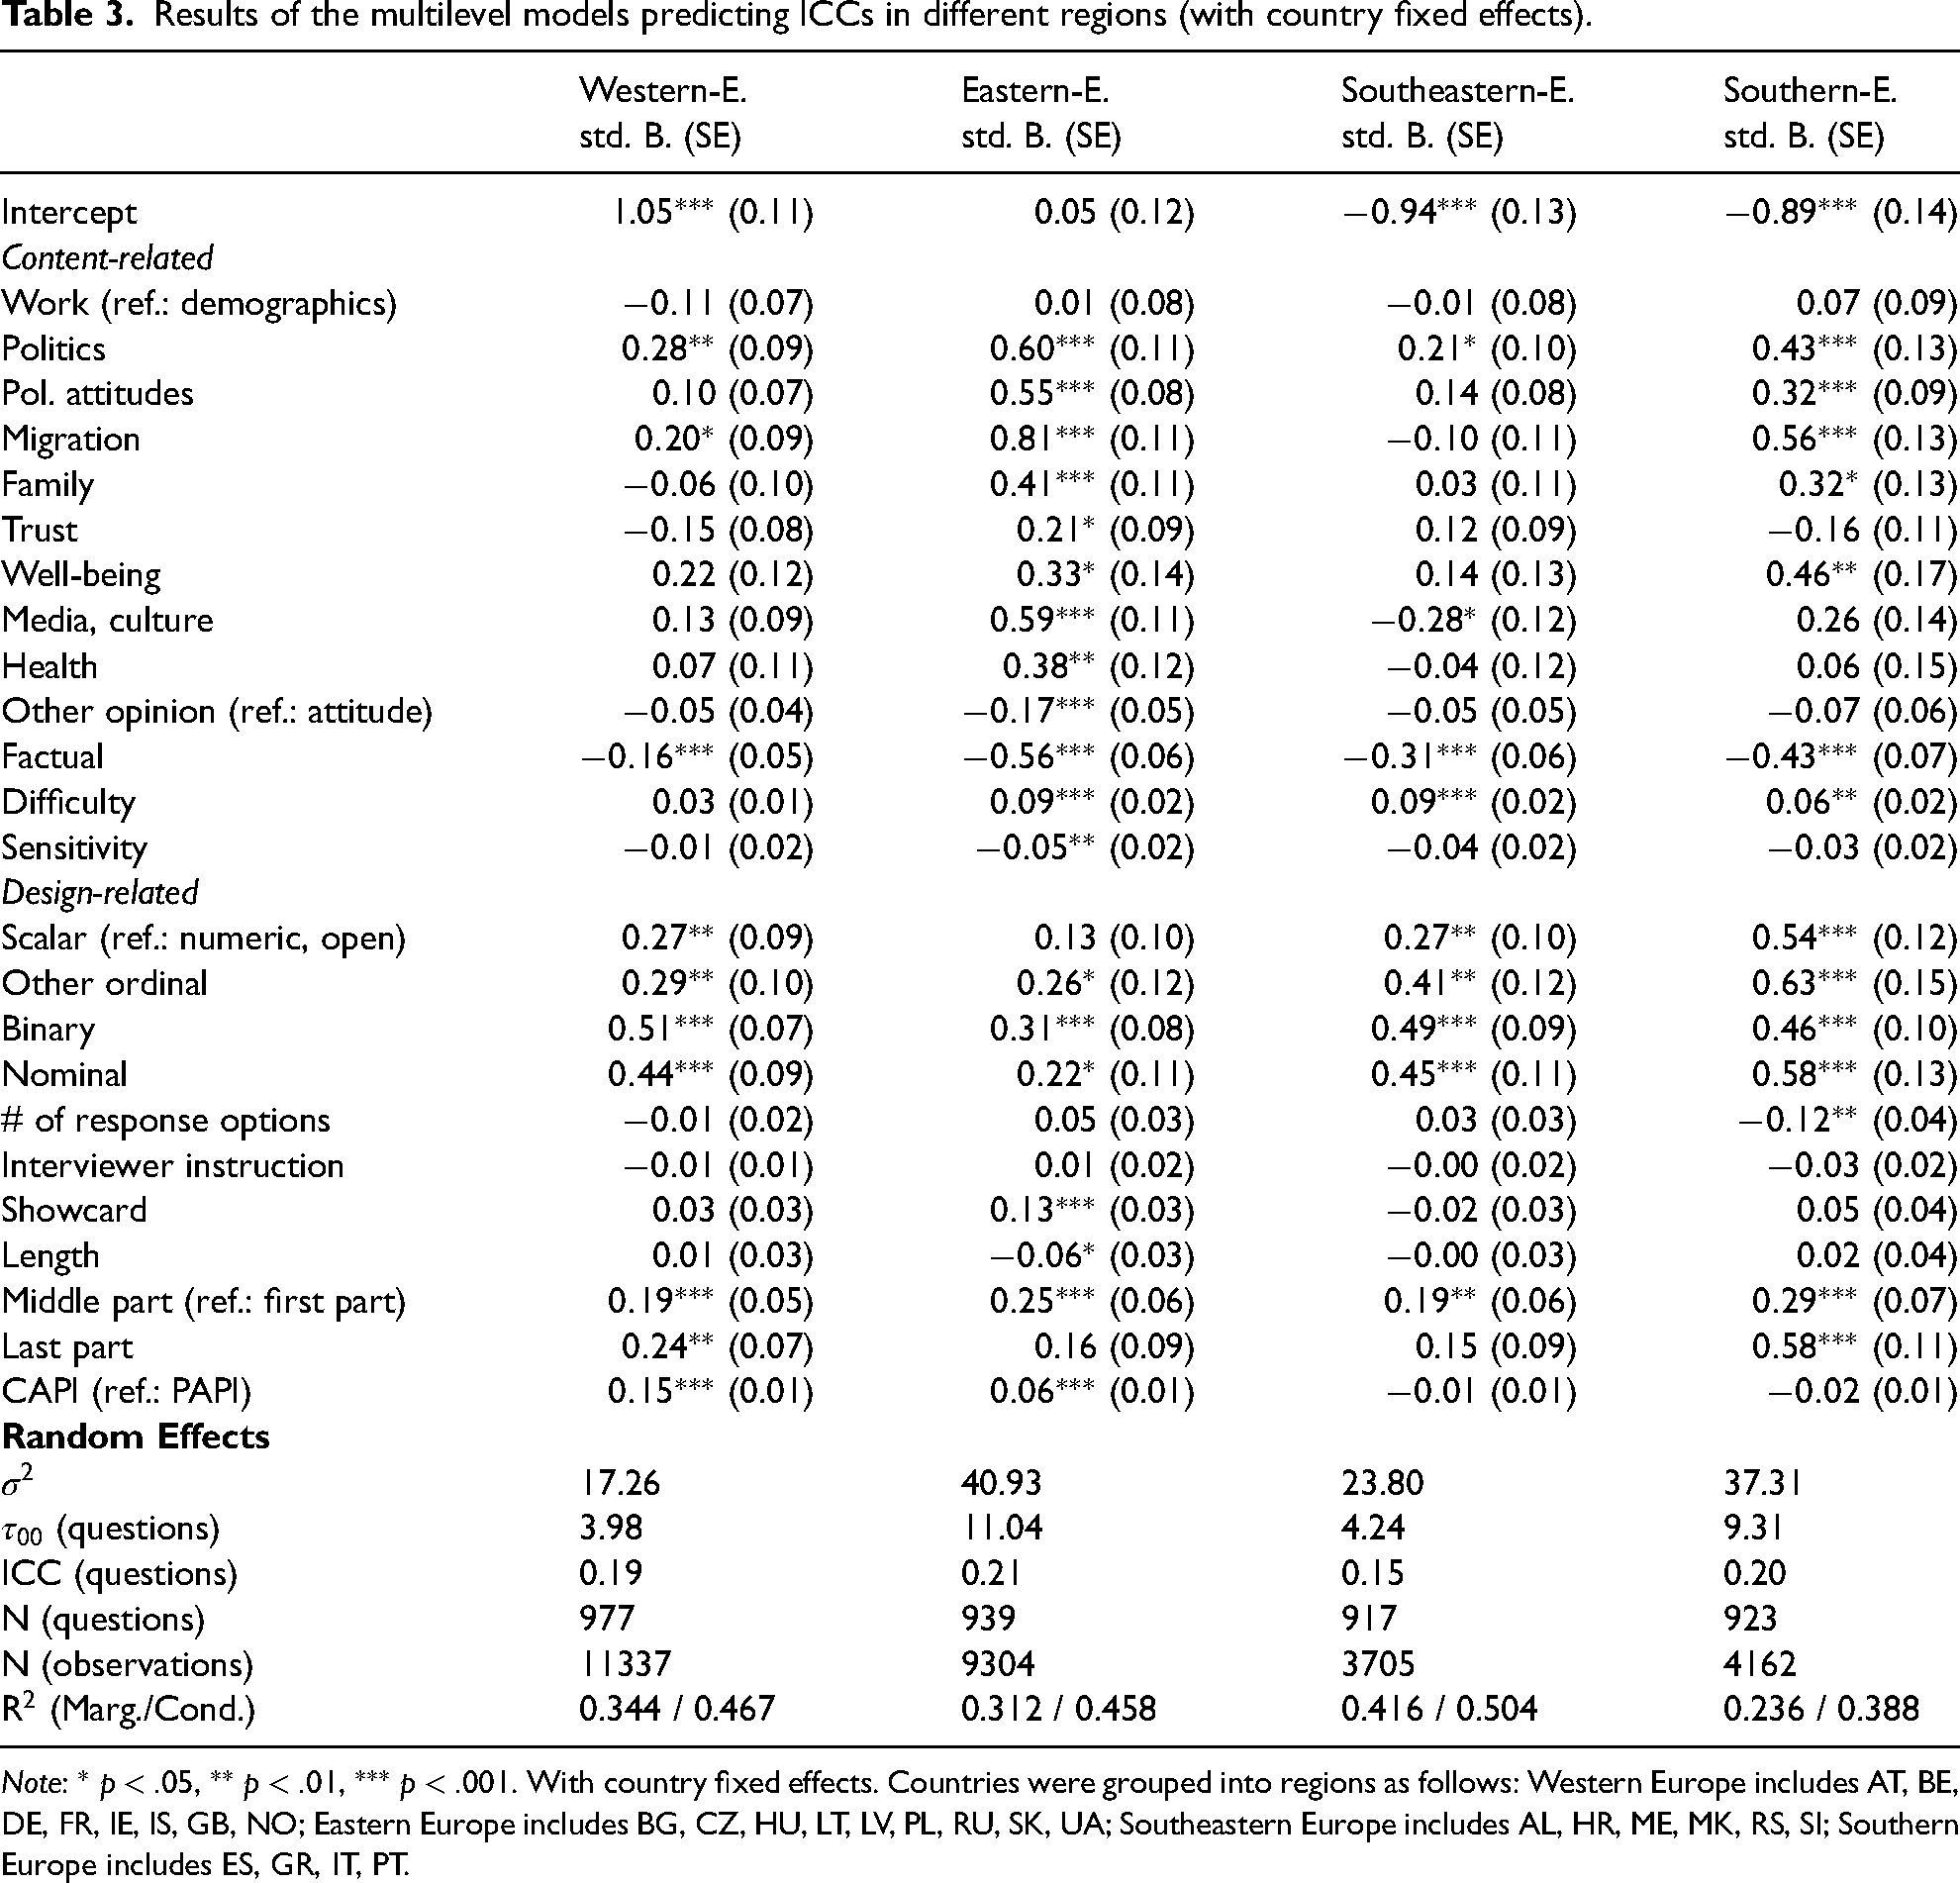
Note:
We found four two-way combinations that were significantly associated with interviewer variance, shown in Table 4. The use of showcards in combination with other characteristics indicated an increase in ICCs. Attitude and difficult questions that employ showcards were more likely to yield high interviewer variance. Late attitude questions also increased the likelihood of a high ICC. Somewhat contradictory, long and difficult questions showed a negative association with interviewer influence. The link with other combinations was either insignificant or not analyzed due to the low frequency of their occurrence.
Significant associations between combinations of question characteristics and ICC.
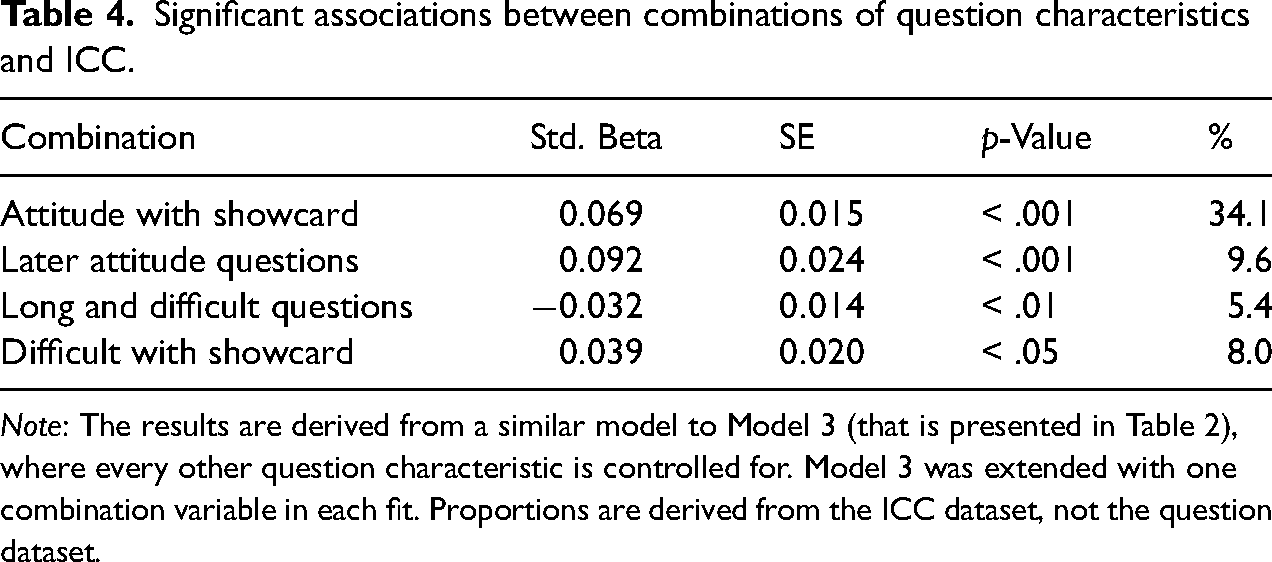
Note: The results are derived from a similar model to Model 3 (that is presented in Table 2), where every other question characteristic is controlled for. Model 3 was extended with one combination variable in each fit. Proportions are derived from the ICC dataset, not the question dataset.
Discussion and Conclusion
Interviewers in face-to-face surveys are both a key to securing high data quality and a source of instability in measurement (West and Blom 2017). Understanding the circumstances under which interviewer variance is more likely to occur is an important area of research. In this article, we analyzed 984 questions of the ESS asked between 2002 and 2022 in 28 countries to assess associations between question characteristics and interviewer influence in the measurement. We find that certain question characteristics explain a significant amount of the variation in ICCs and that certain topics, attitude and non-factual questions, later items and those applying showcards are the most prone to interviewer effects.
Our study reinforced earlier studies’ findings that non-factual, particularly attitudinal questions invite more interviewer influence (Belak and Vehovar 1995; Collins and Butcher 1982; Fellegi 1964; Hyman et al. 1954; O’Muircheartaigh 1976; Schnell and Kreuter 2005). People not only spend less time with demographic questions than other topics (Bassili and Fletcher 1991; Olson and Smyth 2015; Yan and Tourangeau 2008), but we show that demographic questions are also less prone to interviewer influence, likely because they require less processing and more readily available answers. Attitudes about socio-political issues or migration and health-related questions are the most critical topics. We suspect that on the one hand, respondents may experience more uncertainty during the comprehension and retrieval phases and ask more for assistance in the case of non-factual requests. On the other hand, interviewers may also feel the need for assistance and seek direct clarification. As found by Mangione et al. (1992), problematic questions are more likely to invite probing, and interviewers tend to show large inconsistencies in their probing behavior.
Somewhat contrary to some of the previous findings, question difficulty (Dykema et al. 2020; Mangione et al. 1992; Pickery and Loosveldt 2001; Schnell and Kreuter 2005; Van Tilburg 1998) only weakly predicted a high ICC. One explanation for this may be that the questions included in the ESS are not unusually difficult. The development of the ESS questionnaires follows a complex flow involving omnibus tests, pilot surveys, cognitive interviews and reliability and validity prediction using the Survey Quality Predictor (Fitzgerald and Jowell 2010). These steps are intended to ensure high-quality survey questions and measurement equivalence across countries. Thus, few of the questions involve extreme cognitive tasks or extensive recall. Many questions, however, confront respondents with social issues or value judgments they may not have previously considered, making the retrieval process challenging. Perhaps, much of the predictive power of this issue has been captured by attitude questions.
Also, contrary to the findings of some of the previous studies (Bailar et al. 1977; Fellegi 1964; Mangione et al. 1992; Schnell and Kreuter 2005), sensitivity was not related to variations in ICCs. It is possible that question sensitivity introduces response biases that our measure of interviewer variance could not capture. Social desirability bias may cause systematic distortions in distributions or high numbers of item-nonresponse. Additionally, respondents tend to give adequate answers to sensitive questions to avoid uncomfortable moments (Olson et al. 2019), decreasing the likelihood of interviewer probes or clarifications. We also note a methodological challenge here. The absence of clear associations may be related to the coding of sensitivity. A common challenge in evaluating the sensitivity of survey questions is that perceived sensitivity is highly influenced by the respondent’s cultural background and personal relationship with the topic (Mangione et al. 1992; Yan 2021). For instance, questions about alcohol consumption may be perceived as highly sensitive by individuals struggling with alcohol-related issues, while being considered non-sensitive at all by those who rarely consume alcohol.
The design of questions also plays a role. One of the strongest design predictors of ICCs is the use of a showcard. This technique is widely used in survey research. 78% of the questions in the ESS apply showcards. Their goal is to ease the burden on respondents and limit interviewer influence. Our results, however, suggest the opposite: showcards tend to increase interviewer variance, especially when the question is difficult or measures an attitude. We suspect that the visual presentation of the response options provides more opportunities for discussion or for interviewers to offer guidance. The fact that the association is stronger for attitude items reinforces this assumption. This resonates well with what (Holbrook et al. 2006) found, that the use of a showcard can be associated with comprehension or mapping problems. From a Total Survey Error perspective, however, showcards may still offer advantages in maintaining data quality (Saraç and West 2024). Our results are also suggestive that interviewer influence is a smaller issue for open, numeric responses than for other types. This is presumably because the open-ended questions in ESS do not require lengthy textual answers, but rather simpler, straightforward questions that can often be answered with a single number or short text (e.g., years spent in education, spoken languages). This format is likely to require less cognitive effort from respondents, as it is assumed that respondents can easily provide ready-to-provide answers. Our study also corroborates the assumption that survey fatigue increases throughout the interview since respondents seem to rely more on interviewers towards the end of the interview (see Holbrook et al. 2016 for similar findings). Furthermore, this association is stronger for attitude items, which reinforces this assumption. In contrast, a high number of response options does not solely predict interviewer variance. Interviewer notes are also intended to standardize probing and create a common understanding of the terms used in the questionnaire, but we found no evidence that these notes would decrease interviewer effects (no effect). Although other studies reported more interviewer reading errors for longer questions (Dykema et al. 2020; Holbrook et al. 2016), the length of the question was unrelated to ICCs. This may be related to some of the limitations we faced with the measurement of length. For instance, the first items in a battery were considered much longer than the preceding items in the batteries (often words only), although they are conceptually similar.
Our findings allow offering several recommendations for survey practitioners. The first is related to interviewer training. The results suggest that interviewer influence is particularly pronounced in certain topics and for questions with certain characteristics. In other words, certain questions are of poorer quality because they invite more interviewer influence. Survey practitioners should prioritize interviewer training on effective techniques for administering attitudinal and complex questions, as these are particularly susceptible to interviewer effects. Training should also emphasize standardizing the use of showcards and instruct interviewers to avoid unnecessary probing when showcards are used. The other set of recommendations is related to improving questionnaire design. We acknowledge that most practitioners do not intentionally create problematic items and that translating complex issues to simple survey questions is inherently challenging. At the same time, designing questions that are easier to comprehend, require relatively readily available information, and thus need minimal probing is essential in minimizing interviewer influence (Mangione et al. 1992). When including complex or challenging items, careful consideration should be given to their placement within the questionnaire, ideally avoiding the final sections to reduce the risk of respondent fatigue. Consideration should also be given to alternatives to showcards, for example, digital displays or interactive survey tools.
To our knowledge, this study was the first to examine the link between question characteristics and interviewer variance in a cross-cultural setting. Although our results suggest mechanisms that likely generalize well through these countries, we would also like to point to cross-cultural variability. Interviewer variance varied strongly between countries. Forty-two per cent of the total variance of ICCs was explained at the country level. We found strong variations in these mechanisms between countries. The biggest differences stand out between Western and Eastern European countries. This resonates well with prior research showing differential levels of interviewer effects in Europe (Beullens and Loosveldt 2016), adding that the differences may stem not only from interviewer behavior but also from broader institutional, cultural, and methodological contexts. For instance, variation in survey infrastructure, interviewer training protocols, or public trust in institutions may contribute to these regional disparities. The findings highlight the need to tailor survey design and interviewer management strategies to the specific regional and institutional contexts in which they are applied.
This study is not without limitations. The first relates to the coding of questions. In light of the partial disagreements between the coders, features like question difficulty or sensitivity are subjective in nature. Question difficulty may vary strongly with cognitive skills (Stone et al. 1990). Furthermore, the sensitivity of a question may be influenced by cultural and individual characteristics of the respondents (Andreenkova and Javeline 2018). For example, sensitive questions about minority groups may pose minimal challenges for majority group respondents but can lead to significantly greater issues for those belonging to minority groups (Mangione et al. 1992). The level of sensitivity perceived by respondents can also differ across cultures and regions (Yan 2021). Notably, the two coders had similar cultural backgrounds, and as a consequence, the perspectives of the different cultures were not represented when the level of sensitivity of the question was assessed. Another limitation is that we only focused on interviewer variance and ignored other types of response or nonresponse errors. This may explain some of the null findings regarding sensitivity. Other studies could focus on data quality aspects such as social desirability bias, straightlining or item-nonresponse. Furthermore, it was assumed that interviewers would not deviate from the instructions provided, consistently reading questions and answer options with precision and, when instructed, displaying the showcards. However, this is not always the case in practice (Kelley 2020; Neo et al. 2024).
Interviewer effects are a common challenge for survey research. With this article, we aimed to deepen our understanding of under which circumstances interviewers tend to influence the response process. It is cautionary, we believe, that even within the ESS, where strict guidelines in interviewer training are applied and survey questions are thoroughly pretested, we still identified numerous problematic questions that invite interviewer influence. This underscores the need for better training and carefully designed, evidence-based questionnaires.
Supplemental Material
sj-docx-1-smr-10.1177_00491241251372509 - Supplemental material for What Types of Survey Questions are Prone to Interviewer Effects? Evidence Based on 29,000 Intra-Interviewer Correlations From 28 Countries of the European Social Survey
Supplemental material, sj-docx-1-smr-10.1177_00491241251372509 for What Types of Survey Questions are Prone to Interviewer Effects? Evidence Based on 29,000 Intra-Interviewer Correlations From 28 Countries of the European Social Survey by Adam Stefkovics, Kinga Batiz, Blanka Zsófia Grubits and Anna Sára Ligeti in Sociological Methods & Research
Supplemental Material
sj-pdf-2-smr-10.1177_00491241251372509 - Supplemental material for What Types of Survey Questions are Prone to Interviewer Effects? Evidence Based on 29,000 Intra-Interviewer Correlations From 28 Countries of the European Social Survey
Supplemental material, sj-pdf-2-smr-10.1177_00491241251372509 for What Types of Survey Questions are Prone to Interviewer Effects? Evidence Based on 29,000 Intra-Interviewer Correlations From 28 Countries of the European Social Survey by Adam Stefkovics, Kinga Batiz, Blanka Zsófia Grubits and Anna Sára Ligeti in Sociological Methods & Research
Supplemental Material
sj-docx-3-smr-10.1177_00491241251372509 - Supplemental material for What Types of Survey Questions are Prone to Interviewer Effects? Evidence Based on 29,000 Intra-Interviewer Correlations From 28 Countries of the European Social Survey
Supplemental material, sj-docx-3-smr-10.1177_00491241251372509 for What Types of Survey Questions are Prone to Interviewer Effects? Evidence Based on 29,000 Intra-Interviewer Correlations From 28 Countries of the European Social Survey by Adam Stefkovics, Kinga Batiz, Blanka Zsófia Grubits and Anna Sára Ligeti in Sociological Methods & Research
Footnotes
Declaration of Conflicting Interest
The authors declared no potential conflicts of interest with respect to the research, authorship, and/or publication of this article.
Funding
The authors received no financial support for the research, authorship, and/or publication of this article.
Preregistration Statement
This study was not preregistered due to its reliance on secondary data and the need to harmonize and code a large number of survey items across multiple ESS waves before modeling. While the hypotheses and analytic approach were guided by prior literature, the complexity and scope of the data preparation process made preregistration impractical at the outset.
Code Availability
Notes
Author Biographies
References
Supplementary Material
Please find the following supplemental material available below.
For Open Access articles published under a Creative Commons License, all supplemental material carries the same license as the article it is associated with.
For non-Open Access articles published, all supplemental material carries a non-exclusive license, and permission requests for re-use of supplemental material or any part of supplemental material shall be sent directly to the copyright owner as specified in the copyright notice associated with the article.