
Abstract
In a probability sampling survey, adaptive data collection strategies may be used to obtain a response set that minimizes nonresponse bias within budget constraints. Previous research has stratified the target population into subgroups defined by categories of auxiliary variables observed for the entire population, and tailored strategies to obtain similar response rates across subgroups. However, if the auxiliary variables are weakly correlated with the target survey variables, optimizing data collection for these subgroups may not reduce nonresponse bias and may actually increase the variance of survey estimates. In this paper, we propose a stratification method to identify subgroups by: (1) predicting values of target survey variables from auxiliary variables, and (2) forming subgroups with different response propensities based on the predicted values of target survey variables. By tailoring different data collection strategies to these subgroups, we can obtain a response set with less variation in response propensities across subgroups that are directly relevant to the target survey variables. Given this rationale, we also propose to measure nonresponse bias by the coefficient of variation of response propensities estimated from the predicted target survey variables. A case study using the Dutch Health Survey shows that the proposed stratification method generally produces less variation in response propensities with respect to the predicted target survey variables compared to traditional methods, thereby leading to a response set that better resembles the population.
Introduction
The cost of collecting official statistics survey data has been on the rise in recent years, while budgets for these efforts have been decreasing (Luiten, Hox and De Leeuw 2020). This presents a challenge for statistical institutes, as they strive to maintain a balance between cost and data quality in their survey efforts. To address this challenge, many institutes are turning to adaptive survey design (ASD) (Schouten, Peytchev and Wagner 2017); ASD employs non-uniform data collection strategies, such as different survey modes or contact attempts for different population subgroups, to recruit a balanced set of respondents across subgroups on a budget; see Coffey, Reist and Miller (2020); Luiten and Schouten (2013); Van Berkel, Van der Doef and Schouten (2020) for recent applications. A balanced set of respondents more closely resembles a probability sample selected from a population, so that, for example, the distributions of certain characteristics of the respondents (e.g., age) agree with the corresponding distributions in the population (Särndal 2011; Schouten et al. 2016). If a subgroup of sample units (e.g., young adults) is less likely to respond to the survey, the response set is unbalanced and thus not representative of the population. Obtaining a balanced response set within budget through ASD can be framed as an optimization problem, with the objective of finding the optimal allocation of data collection strategies across subgroups to minimize nonresponse bias. Before optimizing for this objective, we first face a critical question:
How to stratify the target population into subgroups effectively and efficiently?
We aim to identify subgroups across which balanced responses minimize nonresponse bias (i.e., effectiveness) without inflating the variance of survey estimates (i.e., efficiency).
ASD is based on historical survey data with varying design features (e.g., mixed-mode surveys). It requires powerful auxiliary information observed for the entire population, such as sampling frames or administrative data (e.g., resident registers), in order to identify subgroups and tailor strategies accordingly before starting data collection for future surveys. Specifically, ASD uses estimated response propensities and costs under different data collection strategies from historical survey data to inform the stratification and optimal allocation of data collection strategies in future surveys. Traditionally, subgroups are the categories or cross-categories of observed auxiliary variables, such as age and sex. The balance of responses across these subgroups can be monitored during data collection. Särndal (2011) and Lundquist and Särndal (2013) derive a function of the coefficient of variation (CV) of response propensities as an indicator of balance. Similarly, Schouten, Cobben and Bethlehem (2009) derive a function of the standard deviation of response propensities as an indicator of representativeness (R-indicators) of a response set. As these indicators are at the survey level, Schouten et al. (2012) and Schouten, Shlomo and Skinner (2011) propose the partial R-indicators that are available at the variable level and at the variable category level to monitor data collection and to identify and prioritize subgroups defined by auxiliary variables. Schouten and Shlomo (2017) further demonstrate the use of partial R-indicators to build nonrespondent profiles, identifying lower-response categories in the auxiliary variables as subgroups. These methods identify subgroups based on auxiliary variables and allocate appropriate data collection strategies to balance responses with respect to auxiliary variables.
Even with a response set that is perfectly balanced with respect to auxiliary variables, nonresponse bias is not fully eliminated (Särndal 2011). Instead, if the selected auxiliary variables are only weakly correlated with the target survey variables, the variance of survey estimates may be inflated (Little and Vartivarian 2005). To illustrate, assuming that older adults are more likely to respond to face-to-face interviews but less likely to respond to web surveys than young adults, responses are unbalanced between age subgroups if web surveys are uniformly employed for the entire sample; follow-up with nonrespondents among older adults through face-to-face interviews may improve the balance. However, if the target survey variable (e.g. frequency of sedentary behavior) is weakly correlated with age, balancing responses between age subgroups may recruit respondents with similar values of the survey variable and thus have a limited effect on improving accuracy and may instead reduce the precision of the survey estimate. To alleviate the problem, alternative methods attempt to consider survey variables for monitoring data collection.
Wagner (2014) proposes to use regression diagnostic measures to identify subgroups of influential sample units that have outliers in the values of target survey variables predicted by auxiliary variables. For example, suppose that smoking behavior is the target survey variable that is predicted to be more heterogeneous among young adults than older adults, limited survey responses from young adults may distort the distribution of smoking behavior and the relationship between smoking behavior and age in the sample; thus, converting nonrespondents among young adults to respondents minimizes nonresponse bias in the estimate of smoking prevalence in the population. However, the likelihood of recruiting target nonrespondents is unknown, making it difficult to allocate field resources and control costs.
To effectively and efficiently use auxiliary information to balance the quality and costs of surveys, we propose a parsimonious stratification method—identifying the subgroups that differ the most in estimated response propensities with respect to the predicted survey variables. Using historical survey data, this method (1) predicts values of target survey variables from available auxiliary variables for respondents and nonrespondents, and (2) identifies subgroups consisting of predicted values of target survey variables that have different estimated response propensities under different data collection strategies. Thus, the identified subgroups capture heterogeneity in estimated response propensities and predicted target survey variables. Balancing responses across these subgroups by allocating appropriate data collection strategies reduces variation in estimated response propensities with respect to the predicted target survey variables. For example, suppose that smoking behavior is the target survey variable and is predicted by the auxiliary variables, a subgroup may consist of sample units that have a probability of smoking higher than 0.4 and are found to be reluctant to participate in face-to-face interviews, preferring instead to receive self-administered surveys; approaching sample units in this subgroup with a mailed invitation and having them complete a web survey may result in a balanced set of respondents with respect to smoking behavior and hence a more accurate and precise estimate of smoking prevalence in the population.
This ASD stratification method conforms to forming strata or cells for nonresponse adjustment following the principle to control both bias and variance. It resembles joint classification of response propensity stratification and predictive mean stratification (Vartivarian and Little 2002) and constructs strata that are homogeneous with respect to target survey variables and response propensities (Bethlehem 1988). Applying such principle to ASD protects against variance inflation in survey estimates by exploiting residual correlations between auxiliary variables and target survey variables at the data collection stage. Such an extension echoes the call to make the data missing at random (MAR) (Rubin 1976) assumption more plausible at the survey design and data collection stage, i.e., responses do not depend on survey variables after conditioning on auxiliary variables (Little 2022).
In addition to introducing a parsimonious stratification method, we propose to measure nonresponse bias by the CV of response propensities estimated from the predicted target survey variables. We use this measure to quantify the remaining nonresponse bias after implementing ASD with the optimal allocation of data collection strategies and to evaluate and compare the effectiveness of using different methods for stratification in minimizing nonresponse bias. We aim to find the ASD with minimal remaining nonresponse bias under the assumption that the underlying stratification is optimal.
The “Methods” section outlines the steps to design ASD using the proposed stratification methods as well as alternative traditional methods for comparison. The “A Case Study on the Dutch Health Survey” section examines the effectiveness of the proposed stratification method in a case study using the Dutch Health Survey. The “Discussion” section concludes with caveats and a discussion of future research directions.
Methods
With the objective of minimizing nonresponse bias, we outline the steps for designing an ASD based on historical survey data, using the proposed stratification methods and traditional methods. The steps we go through are:
Setting the framework for Bayesian ASD in the “Adaptive Strategies and Optimization Problem” section: We identify data collection strategies from historical surveys and introduce the optimization objective functions in which the design parameters are analyzed based on a Bayesian framework to facilitate ASD stratification and optimization. Stratifying the target population into subgroups in the “Stratify Target Population into Subgroups” section: We choose a number of stratification scenarios corresponding to the proposed and traditional methods. Specific to the proposed stratification method, we create models for predicting target survey variables. Estimating ASD design parameters in the “Estimate Design Parameters” section: We create models for estimating response propensities and costs and compute the quality and cost indicators. Optimizing ASD allocation of data collection strategies in the “Optimize Allocation of Strategies” section: We optimize the allocation of data collection strategies and describe how we use the CV of response propensities estimated from predicted survey variables to evaluate performance across stratification scenarios.
Our main contribution lies in steps 2 and 4. We summarize these steps as a practical guide in the “Summary of Steps in the Proposed Method” section.
Adaptive Strategies and Optimization Problem
In this section, we set notation and introduce the optimization objective functions. We do this within a Bayesian framework.
Data Collection Strategies
A survey design involves a variety of features such as sampling design, mode of administration, number of phases, type of questionnaire, and interviewer. A data collection strategy is a sequence of actions corresponding to the choices made for the design features. In this paper, we simplify data collection strategies consisting of two actions, namely two survey modes—web and face-to-face interviews. For example, in a historical survey with a mixed-mode sequential design, the default uniform strategy may be to invite all sample units to participate in the web survey and follow up with nonrespondents by face-to-face visits; an alternative strategy for future rounds may be to stop further efforts with selected nonrespondents at the end of the web survey for budgetary reasons. Instead of following up with all the nonrespondents, ASD determines which (groups of) nonrespondents to follow up.
Let the survey design consist of

Traditional non-ASDs use a single data collection strategy for the entire sample. In contrast, ASD adapts different strategies to different sample units. One key aspect of ASD is stratification, which separates sample units into subgroups with different estimated response propensities under different strategies. For example, a subgroup consisting of older adults may be less likely to respond to web surveys, but may be more likely to respond to face-to-face interviews. Considering the differences in response propensities, we may identify subgroups from historical surveys and adapt different data collection strategies for different subgroups of sample units in future surveys. Details on stratification follow in the “Stratify Target Population into Subgroups” section.
Let the target population consist of

Optimization Objective and Constraints
After identifying multiple data collection strategies and all possible allocations of strategies to the identified subgroups, we search for the optimal allocation of strategies, denoted by
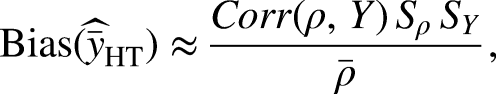
While cost is an observed quantity, response propensity is an unobserved, nonzero probability that can be estimated from observed data (Bethlehem, Cobben and Schouten 2011; Little 1986). Nonresponse bias occurs when the response propensity is correlated with target survey variables (Groves 2006). Addressing nonresponse bias implies reducing the correlation between the response propensity and target survey variables. Let

We allocate the same strategy to all units in the same subgroup and assume a simplified situation where, given the allocation of strategies
The optimization searches for the optimal allocation from
We acknowledge that recent research on optimizing data collection incorporates cost into the objective function to maximize the cost-quality trade-off (Coffey and Elliott 2024; Wagner et al. 2023). In our case, the survey stakeholders are more interested in understanding changes in quality while fixing budget, i.e., there is no direct need to reduce budget. Although the RR itself is a poor quality indicator, sufficient RRs can still reduce the risk of nonresponse bias (Hedlin 2020; Schouten, Cobben and Bethlehem 2009). Since the proposed method minimizes nonresponse bias with respect to a limited set of predicted target survey variables, it is necessary to ensure a certain RR to adequately capture variation in other survey variables. Details on optimization follow in the “Optimize Allocation of Strategies” section.
Bayesian Framework for ASD
We adopt the Bayesian framework for analyzing design parameters in survey data collection (Schouten et al. 2018). We fit models for predicting target survey variables and estimating response propensities and costs. Appendix A in the online Supplemental Material specifies the prior and posterior distributions of model parameters. As the posterior distributions cannot be computed analytically, we apply a Gibbs sampler using Markov Chain Monte Carlo (MCMC) methods to sample the model parameters. Appendix B in the online Supplemental Material specifies the full conditionals of the model parameters to facilitate Gibbs sampling.
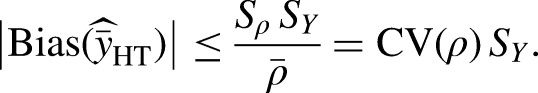
With the sampled model parameters, we obtain the posterior predictive distributions of target survey variables and treat the expectations as the predicted values for respondents and nonrespondents. We use the predicted values of target survey variables for the proposed stratification method (see the “Stratification Methods” section) and for the evaluation of remaining nonresponse bias after implementing ASD (see the “Determine Optimal Stratification” section). Similarly, we obtain the joint posterior distributions of response propensities and costs and derive the posterior distributions of quality and cost indicators under the given allocation. The optimization searches for the optimal allocation that minimizes the expectation of the CV of estimated response propensities at the subgroup level; meanwhile, the expectation of overall RR is greater than or equal to the specified minimum; and for draws from the posterior distribution of the required budget per respondent, the proportion of draws exceeding the specified maximum is lower than 0.10.
Stratify Target Population into Subgroups
In this section, we introduce the proposed stratification method based on predicted target survey variables. We also introduce competing stratification methods to which we compare the proposed method. We first describe these methods and then elaborate on how we predict target survey variables.
Stratification Methods
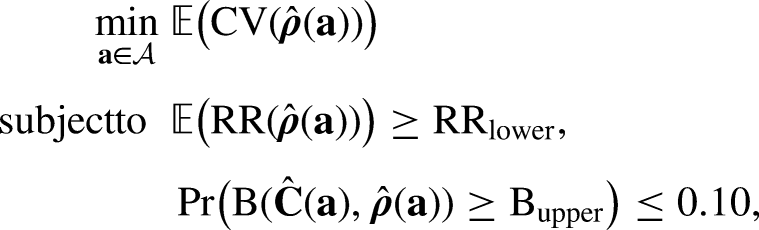
We consider five different stratification methods. Table 1 displays the different stratification methods. They vary in the predictors that are used and the indicator that is focused on. Two of the proposed methods use predicted target survey variables, one explaining the response indicator (Response
Stratification Methods Corresponding to Different Outcomes and Predictors in the Classification and Regression Trees (CART).
We use the classification and regression trees (CART) (Breiman et al. 1984) with predicted target survey variables to predict binary response indicators (see Lohr, Hsu and Montaquila 2015). CART can account for potential collinearity and interactions between predicted target survey variables. CART partitions the population into subgroups consisting of different values or combinations of values of predicted target survey variables, which have varying estimated response propensities under a given data collection strategy. For example, an identified subgroup of sample units with a probability of smoking higher than 0.4 may be less likely to respond to face-to-face interviews but may be more likely to respond to web surveys. As the response indicator corresponds to each strategy, we may build multiple CARTs and select one as the stratification that best differentiates between subgroups with varying estimated response propensities under different strategies.
In addition to the response indicator, we also use predicted target survey variables to explain the number of in-person visits to sample units when the face-to-face interview is an action in particular data collection phases. For example, the face-to-face interview can be used as a follow-up action in the subsequent phases for sample units who have not responded in the previous phase of the self-administered survey. The number of visits can serve as a continuous indicator of survey response; increasing the number of visits may be effective in recruiting respondents; if not, it indicates that the sample units are either unreachable or refuse to participate. On the other hand, the number of visits indicates the survey costs, as the more in-person visits, the higher the costs. Compared with the binary response indicator, the number of in-person visits captures variation in response behavior as well as the associated cost. While the focus of this paper is not on minimizing survey costs, for cost-sensitive ASD, we also identify subgroups that are homogeneous in terms of actual survey costs.
Predict Target Survey Variables
Using historical survey data, we model the observed values of target survey variables by auxiliary variables available at the start of data collection and predict the values of target survey variables for respondents and nonrespondents. Let 

Estimate Design Parameters
In this section, we create models for estimating response propensities and costs per sample unit under each data collection strategy and compute the quality and cost indicators under a given allocation of strategies.
Response Propensities and Costs
We assume that all units within the same subgroup have the same estimated response propensities and costs under the given strategy. Given data collection strategy
Let 
Similarly, we apply the linear model to estimate costs per sample unit by modeling the actual survey costs at the end of phase 
Based on the estimated response propensities and costs per sample unit, the subgroup-level estimated response propensities and estimated costs for subgroup 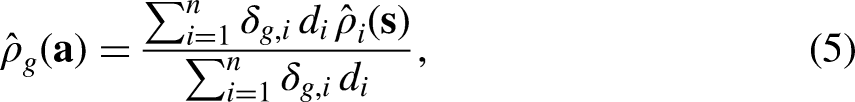
Quality and Cost Indicators
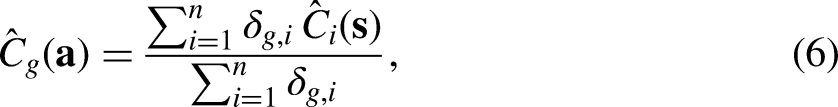
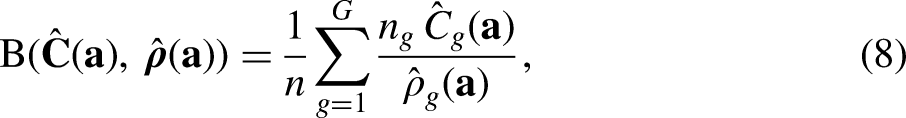
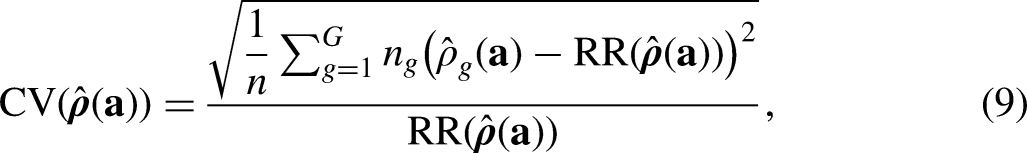
Three functions of subgroup-level estimated response propensities and estimated costs constitute the quality and cost indicators specified in the optimization problem—overall RR, required budget per respondent (B), and CV of subgroup-level estimated response propensities. The overall RR is computed as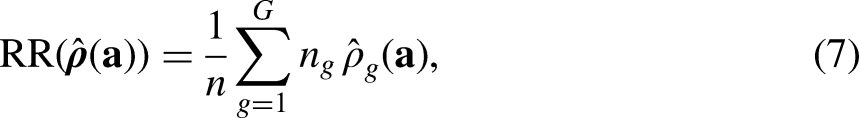
Optimize Allocation of Strategies
In this section, we search for the optimal allocation of data collection strategies to the selected subgroups and introduce a criterion to evaluate the performance of minimizing nonresponse bias.
Optimization through Synthetic Samples
From historical surveys, we may identify varying design features (e.g., survey modes) and construct the aggregation of data collection strategies; we may also identify subgroups with varying estimated response propensities for a given strategy and construct the aggregation of allocations of strategies over all subgroups. For each allocation of data collection strategies, we synthesize the sample based on the observed historical survey data to emulate the implementation of ASD given such allocation; we cannot add more data, but we can remove data to show the effects of interventions during data collection, which is referred to as “experiments in retrospect” (Lundquist and Särndal 2013; Särndal and Lundquist 2014). For example, in a non-adaptive sample, all units that do not respond at the end of the web survey phase receive follow-up face-to-face visits; for subgroups that are only allocated the web survey strategy, we exclude data collected after the web survey phase and record their responses at the end of the web survey phase as final survey responses.
For each stratification method specified in Table 1, we obtain synthetic samples realizing all possible allocations of data collection strategies and compute the quality and cost indicators for each allocation. After evaluating the conditions specified in the optimization problem, we find the optimal allocation that minimizes the CV, i.e., the one that minimizes nonresponse bias.
Determine Optimal Stratification
When comparing the optimal allocations between different stratification methods, it should be noted that the quality and cost indicators are specific to stratification. The underlying models for response propensities and costs are different because predictors, i.e., binary indicators of subgroup membership, vary by stratification methods. We thus propose an overarching criterion to evaluate remaining nonresponse bias given the optimal allocation of strategies—CV of individual response propensities estimated from predicted survey variables. Such criterion quantifies nonresponse bias with respect to survey variables predicted from the observed auxiliary variables, independent of stratification.
The prediction of survey variables has been specified in the “Predict Target Survey Variables” section. Similar to the specification of the response propensity model in the “Response Propensities and Costs” section, we apply the probit model to estimate individual response propensities by modeling the final survey response indicators in the synthetic sample given the optimal allocation but using target survey variables predicted from observed auxiliary variables, 
The corresponding CV of estimated individual response propensities is computed as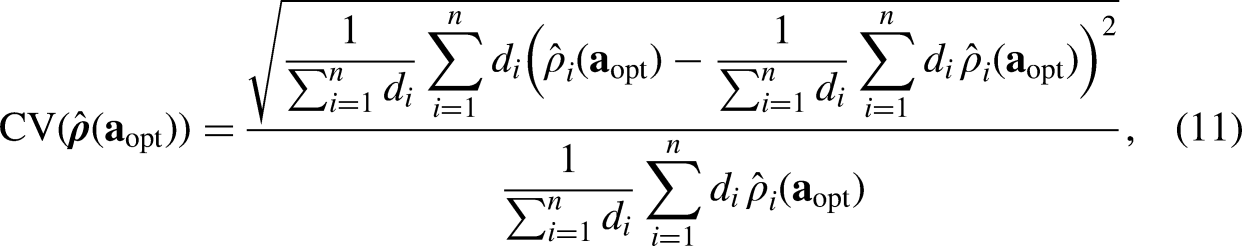
Summary of Steps in the Proposed Method
To assist application of the proposed stratification method in practice, the steps are summarized as follows:
Identify candidate data collection strategies, e.g. based on the choice of modes, choice of number of calls/visits, or choice of incentive; Collect historical survey data that includes the candidate data collection strategies and relevant auxiliary variables from the sampling frame or administrative data; Determine the target survey variables. Predict each target survey variable for each sample unit using the available auxiliary variables (i.e., Based on the predicted target survey variables ( Estimate the response propensity and cost under the candidate data collection strategies for the Allocate the candidate data collection strategies to Given a specific allocation, synthesize a sample and calculate the mean response propensity and cost by subgroup For each synthetic sample corresponding to each alternative allocation, calculate and compare the CV of the subgroup-level estimated response propensities, the overall RR, and the cost per completion (B); Select the allocation of strategies that provides the best performance in minimizing nonresponse bias per the conditions specified in the optimization problem.
A Case Study on the Dutch Health Survey
In this section, we present a case study using historical data from the Dutch Health Survey to illustrate the steps involved in designing an ASD and to evaluate the effectiveness of the proposed stratification method in minimizing nonresponse bias.
Survey Design and Adaptive Strategies
Survey Design
The Dutch Health Survey is designed to provide a comprehensive understanding of the health, medical contacts, lifestyle, and preventive behaviors of the Dutch population (Statistics Netherlands 2020). The target population is all individuals living in private households. For children under 12 years of age, the survey questions are answered by parents or guardians. Measurement stability and low nonresponse bias of target survey variables are top priorities for the survey stakeholders, as survey results are used to compare health statistics across time.
In this case study, we use data collected from the last three quarters of 2017 and the first quarter of 2018 and exclude respondents under the age of 12 from the sample. We aim to minimize nonresponse bias with respect to three target survey variables:
How is your health in general? This variable is measured on a 5-point scale: Very good, Good, Goes well, Bad, Very bad. The first two categories are recoded as healthy, and the last three are unhealthy. The item goes well in Dutch has no positive meaning. Do you ever smoke? This is a dichotomous variable: Yes/No. Obesity. This dichotomous variable is derived from body mass index (BMI) calculated from height and weight measurements (weight in kilos divided by squared height in meters): How tall are you? It is the height in centimeters, without shoes;
What is your weight in kilos? (We mean the weight before pregnancy.) It’s the weight in whole kilos, without clothes.
For adults, a BMI over 30 indicates obesity. For teenagers, the criteria depend on age.
For ease of illustration and application of stratification methods, we restrict the case study to binary indicators and leave the extension to nominal categorical variables for the future.
Adaptive Strategies
The Dutch Health Survey employs a sequential mixed-mode design, starting with a web survey followed by face-to-face interviews. Specifically, nonrespondents to the web survey receive either short face-to-face interviews (F2F-short) or extended face-to-face interviews (F2F-extended). The F2F-short mode involves three in-person visits and the F2F-extended mode involves additional visits to nonrespondents after the first three visits. We thus identify three data collection strategies—Web, Web + F2F-short, and Web + F2F-short + F2F-extended (shortened as Web + F2F-extended)—corresponding to three phases of data collection that sample units may go through in sequence—Phase 1 (Web), Phase 2 (F2F-short), and Phase 3 (F2F-extended).
For sample units that receive the Web strategy, data collection stops at the end of Phase 1, meaning that they are not followed up even if they do not respond. For sample units that receive the Web + F2F-short strategy, the data collection stops at the end of Phase 2. For sample units that receive the Web + F2F-extended strategy, the data collection stops at the end of Phase 3. Based on the observed survey data, we identify subgroups with varying estimated response propensities to these strategies and search for the optimal allocation of strategies to subgroups.
Stratification and Optimization
We perform all analyses in R (R Core Team 2023). For stratification, we use the
Stratification
For each stratification method in Table 1, we identify subgroups using the CART and estimate subgroup-level response propensities and costs. Specific to the proposed stratification methods, we predict target survey variables (health, smoking, and obesity) with categorical auxiliary variables extracted from registers, including age, sex, income, marital status, level of education, migration background, receipt of rent benefits, type of household, and level of urbanization in the area of residence. The results of prediction models for survey variables can be found in Appendix D in the online Supplemental Material.
We then use the predicted values of target survey variables to predict the survey response indicator and the number of in-person visits using the CART. For the Response
Identified Subgroups Using the Response
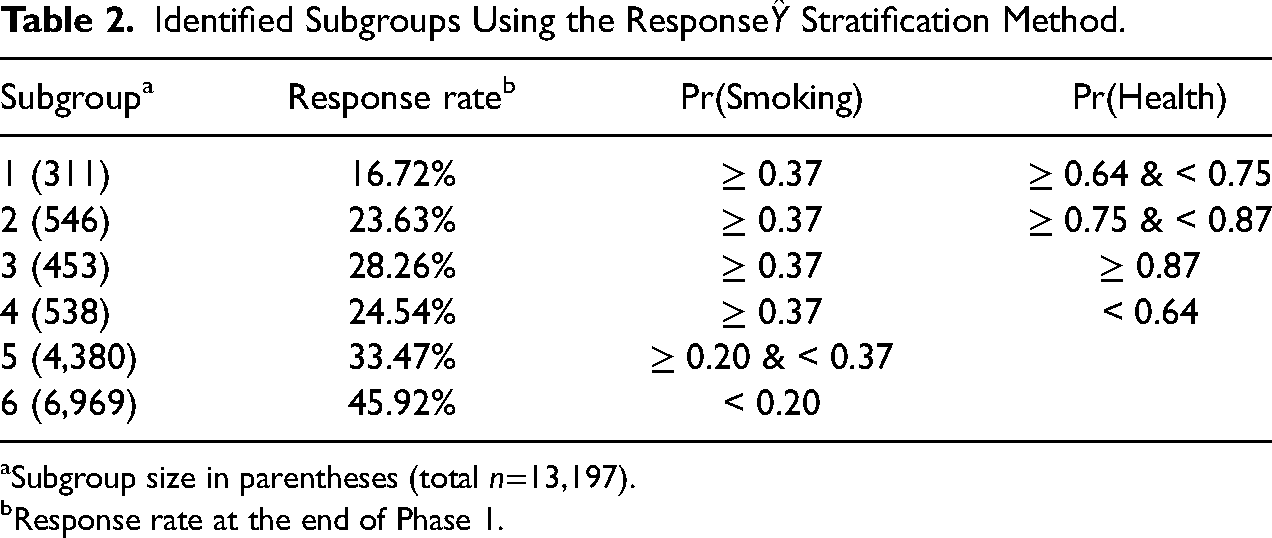
Subgroup size in parentheses (total
Response rate at the end of Phase 1.
Identified Subgroups Using the Visit
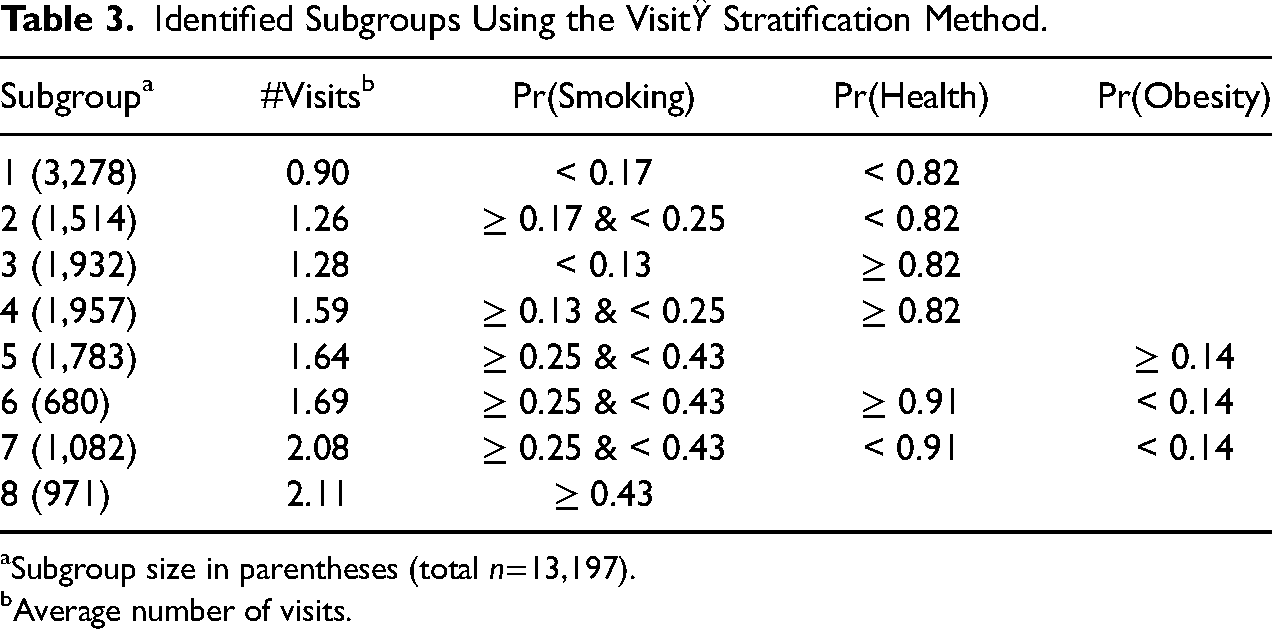
Subgroup size in parentheses (total
Average number of visits.
CART splits sample units based on the predicted probability of smoking, health, and obesity. For example, the first subgroup in Table 2 consists of the sample units in which the predicted probability of smoking is greater than or equal to 0.37 and the predicted probability of health is between 0.64 and 0.75. CART utilizes the predicted probability of obesity to predict the number of in-person visits but not the survey response indicator, suggesting that the probability of obesity may not distinguish between subgroups using the Response
Figure 1 shows the subgroup-level estimated response propensities for all subgroups under different data collection strategies, along with the 95% credible intervals. Different subgroups may have varying estimated response propensities to different strategies. Small subgroups exhibit great heterogeneity in estimated response propensities, as indicated by wide credible intervals. The estimated response propensities to the Web mode strategy are distinguishable from estimated response propensities to the other two strategies. Since few sample units reach Phase 3 (Web + F2F-extended), CART rarely distinguish them from those reaching Phase 2 (Web + F2F-short). It is evident that if one data collection strategy is applied uniformly to the entire sample, the variation in estimated response propensities may be substantial. We aim to optimally allocate strategies across subgroups, i.e., to balance estimated response propensities among subgroups while controlling survey costs.
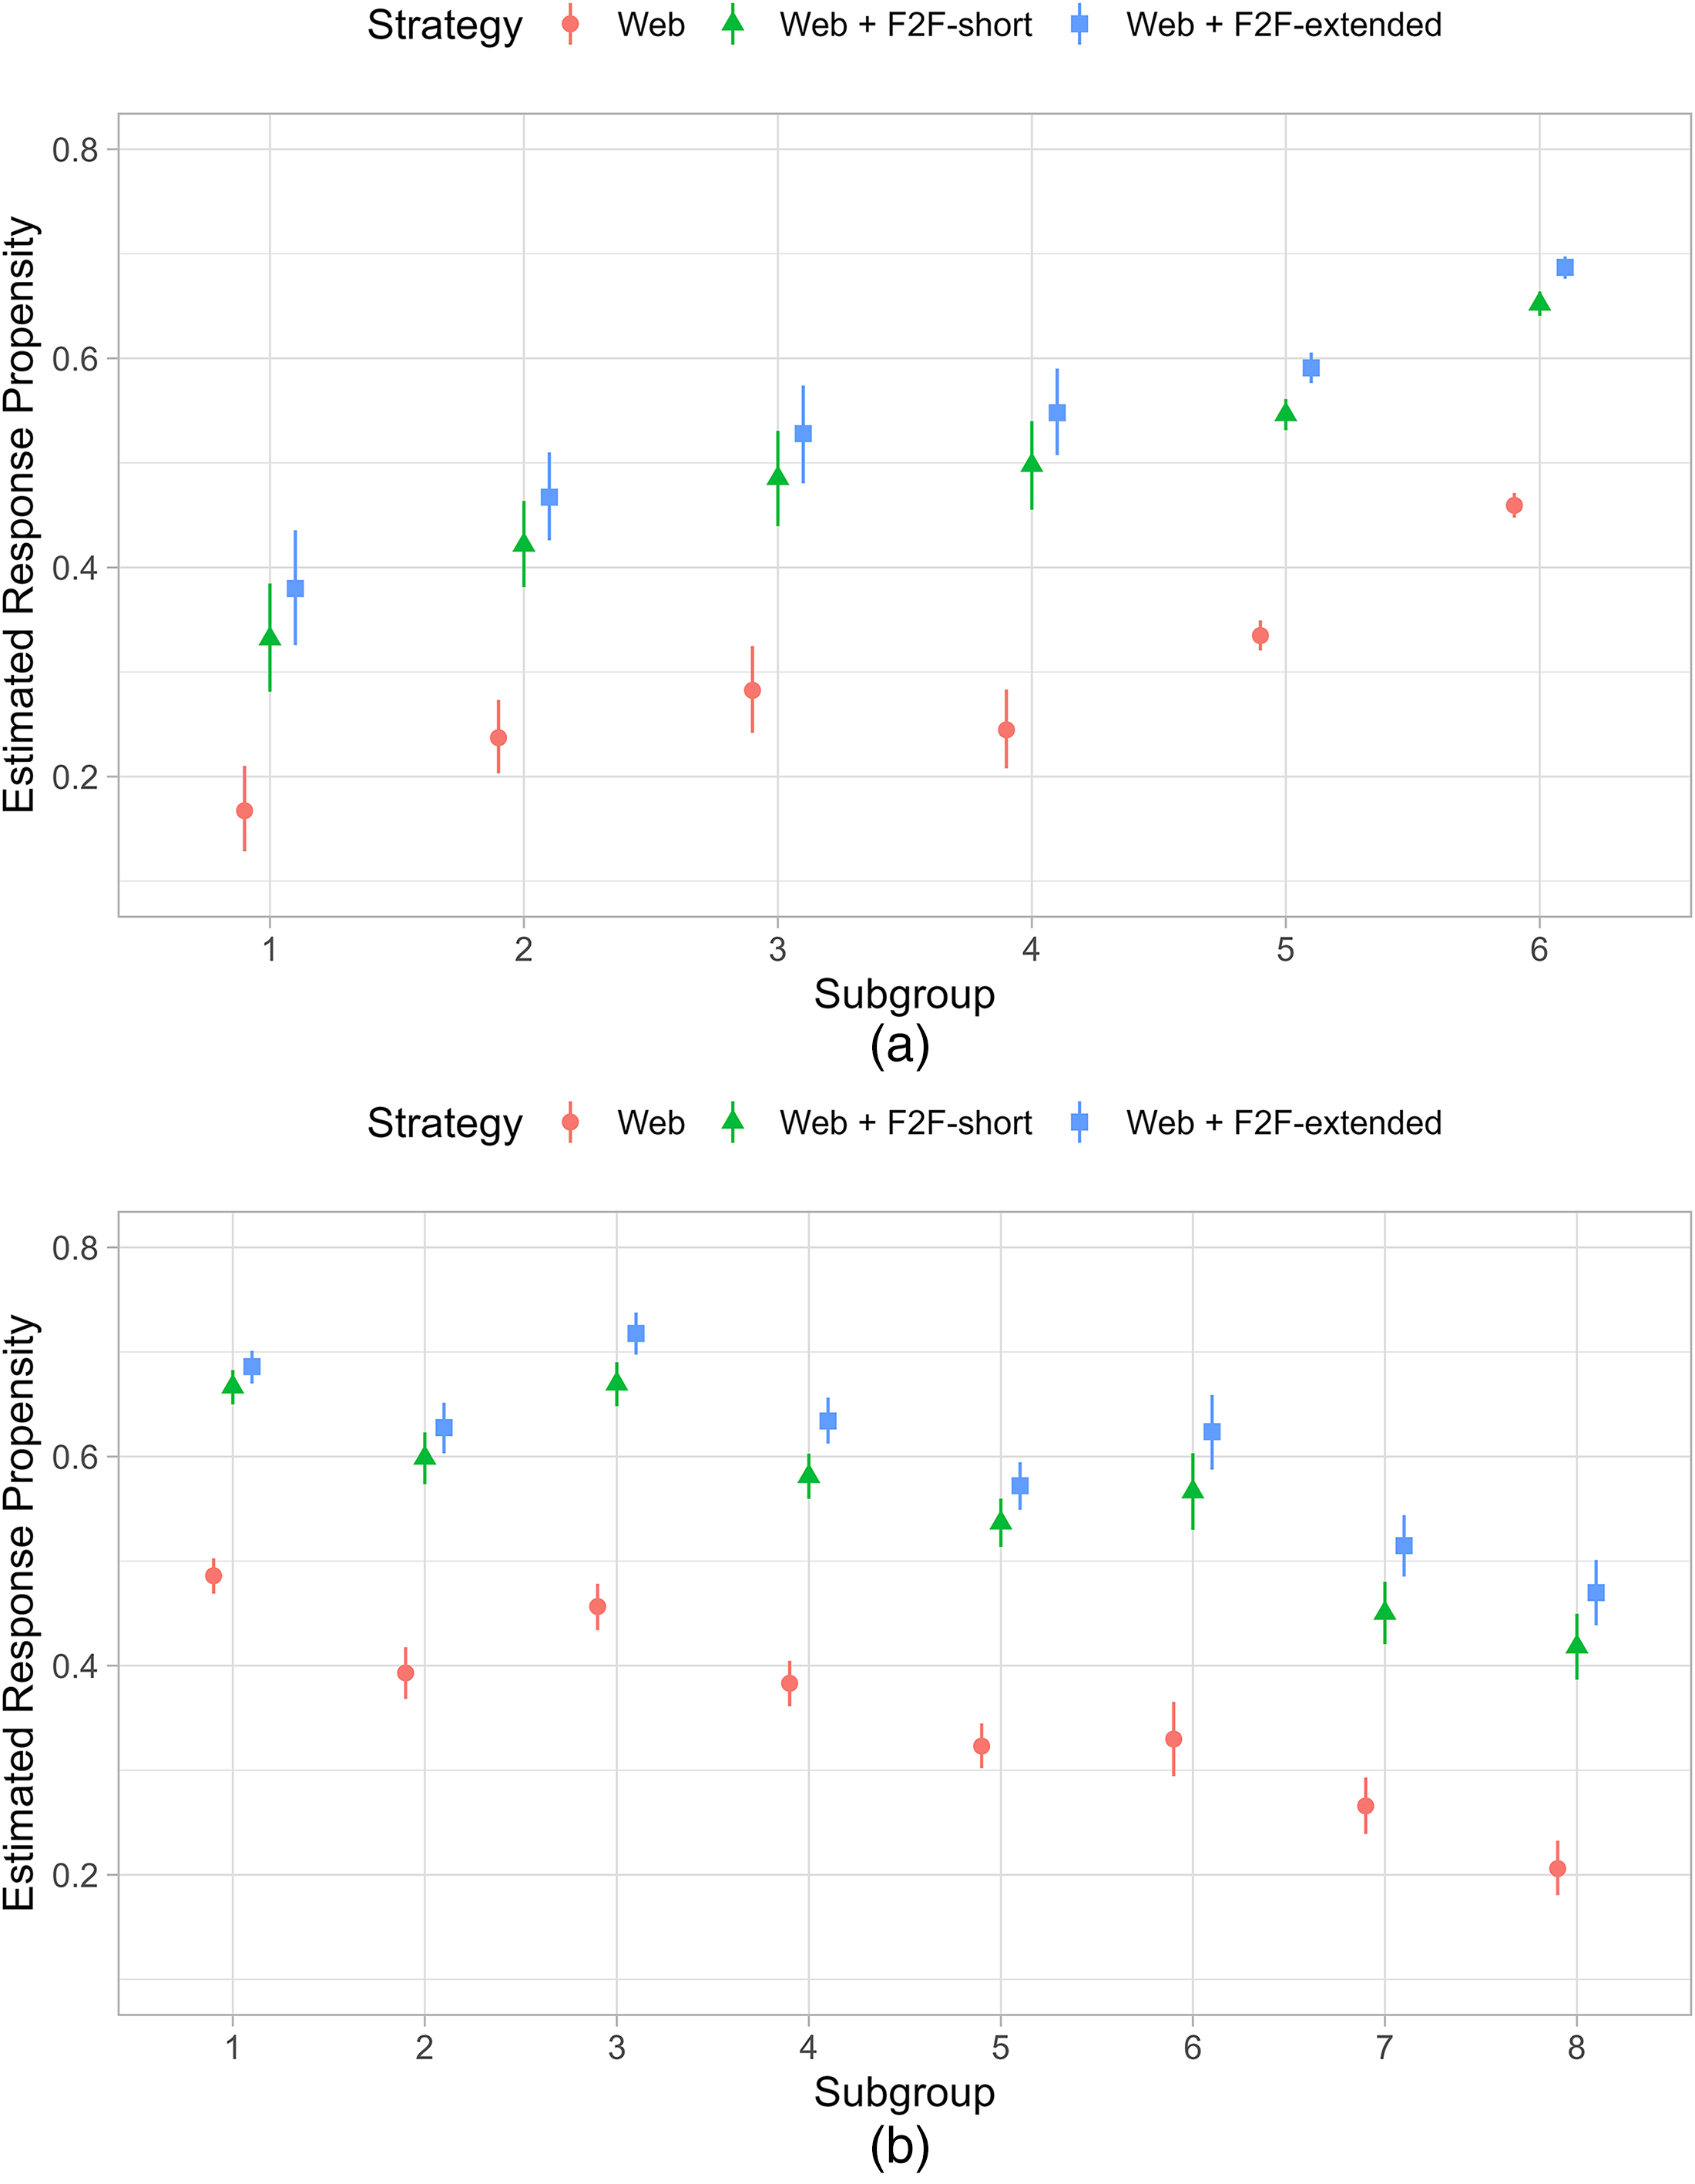
Estimated response propensities per subgroup and per strategy (Web, Web + F2F-short, and Web + F2F-extended). (a) Response
Optimization
Given the three data collection strategies and identified subgroups, we construct all possible allocations of strategies over all subgroups. For example, using the Response
We set a lower limit on the overall RR at 50% and an upper limit on the required budget per respondent at 90% of realized costs. Among all possible allocations of data collection strategies, the optimization filters out allocations that do not meet these constraints and locates the optimal allocation with the minimum CV. For each stratification method, we run the optimization and select the top five optimal allocations and compute the corresponding CV of estimated individual response propensities by (11).
Figure 2 shows the CV values of the top five optimal allocations for each stratification method, along with the 95% credible intervals. The proposed stratification methods Response
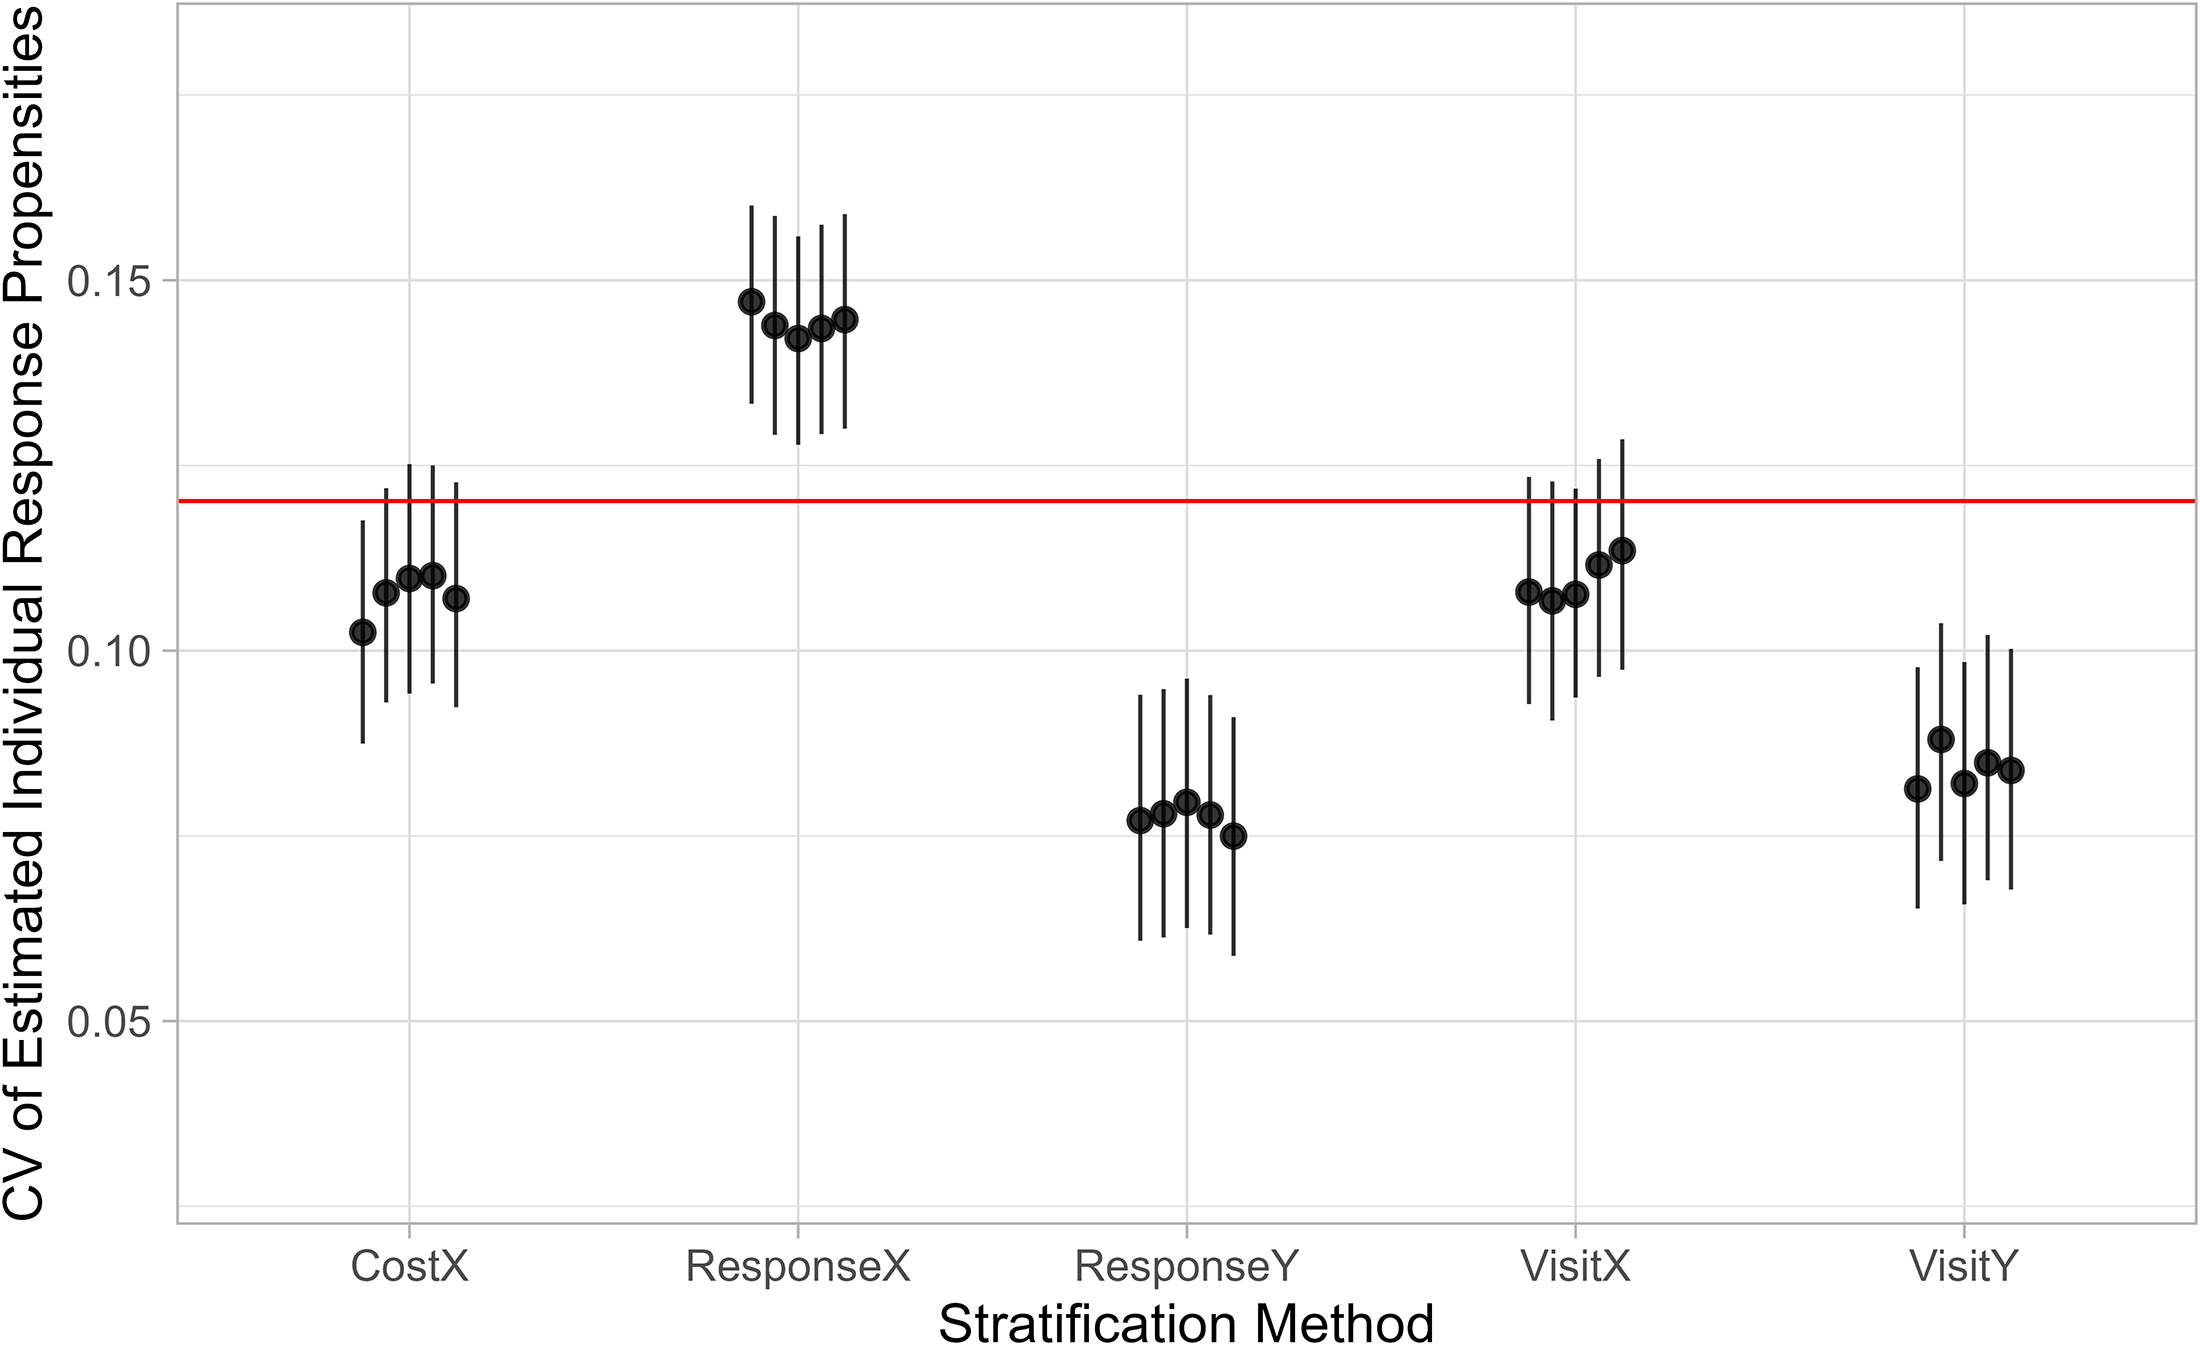
Coefficient of variation (CV) of estimated individual response propensities with respect to predicted target survey variables for optimal design solutions based on different stratification methods. The horizontal line indicates the CV in the observed sample.
Sensitivity to RRs and Budgets
We assess the robustness of the proposed stratification methods by varying the overall RR limit between 50% and 55% at 1% intervals and the budget limit between 80% and 100% of realized costs at 5% intervals. Varying the overall RR limit does not significantly alter the pattern. However, sudden changes in CV values occur when the budget limit varies, as shown in Figure 3. Specifically, when the budget limit is set at 95% and 100% of realized costs, the Response
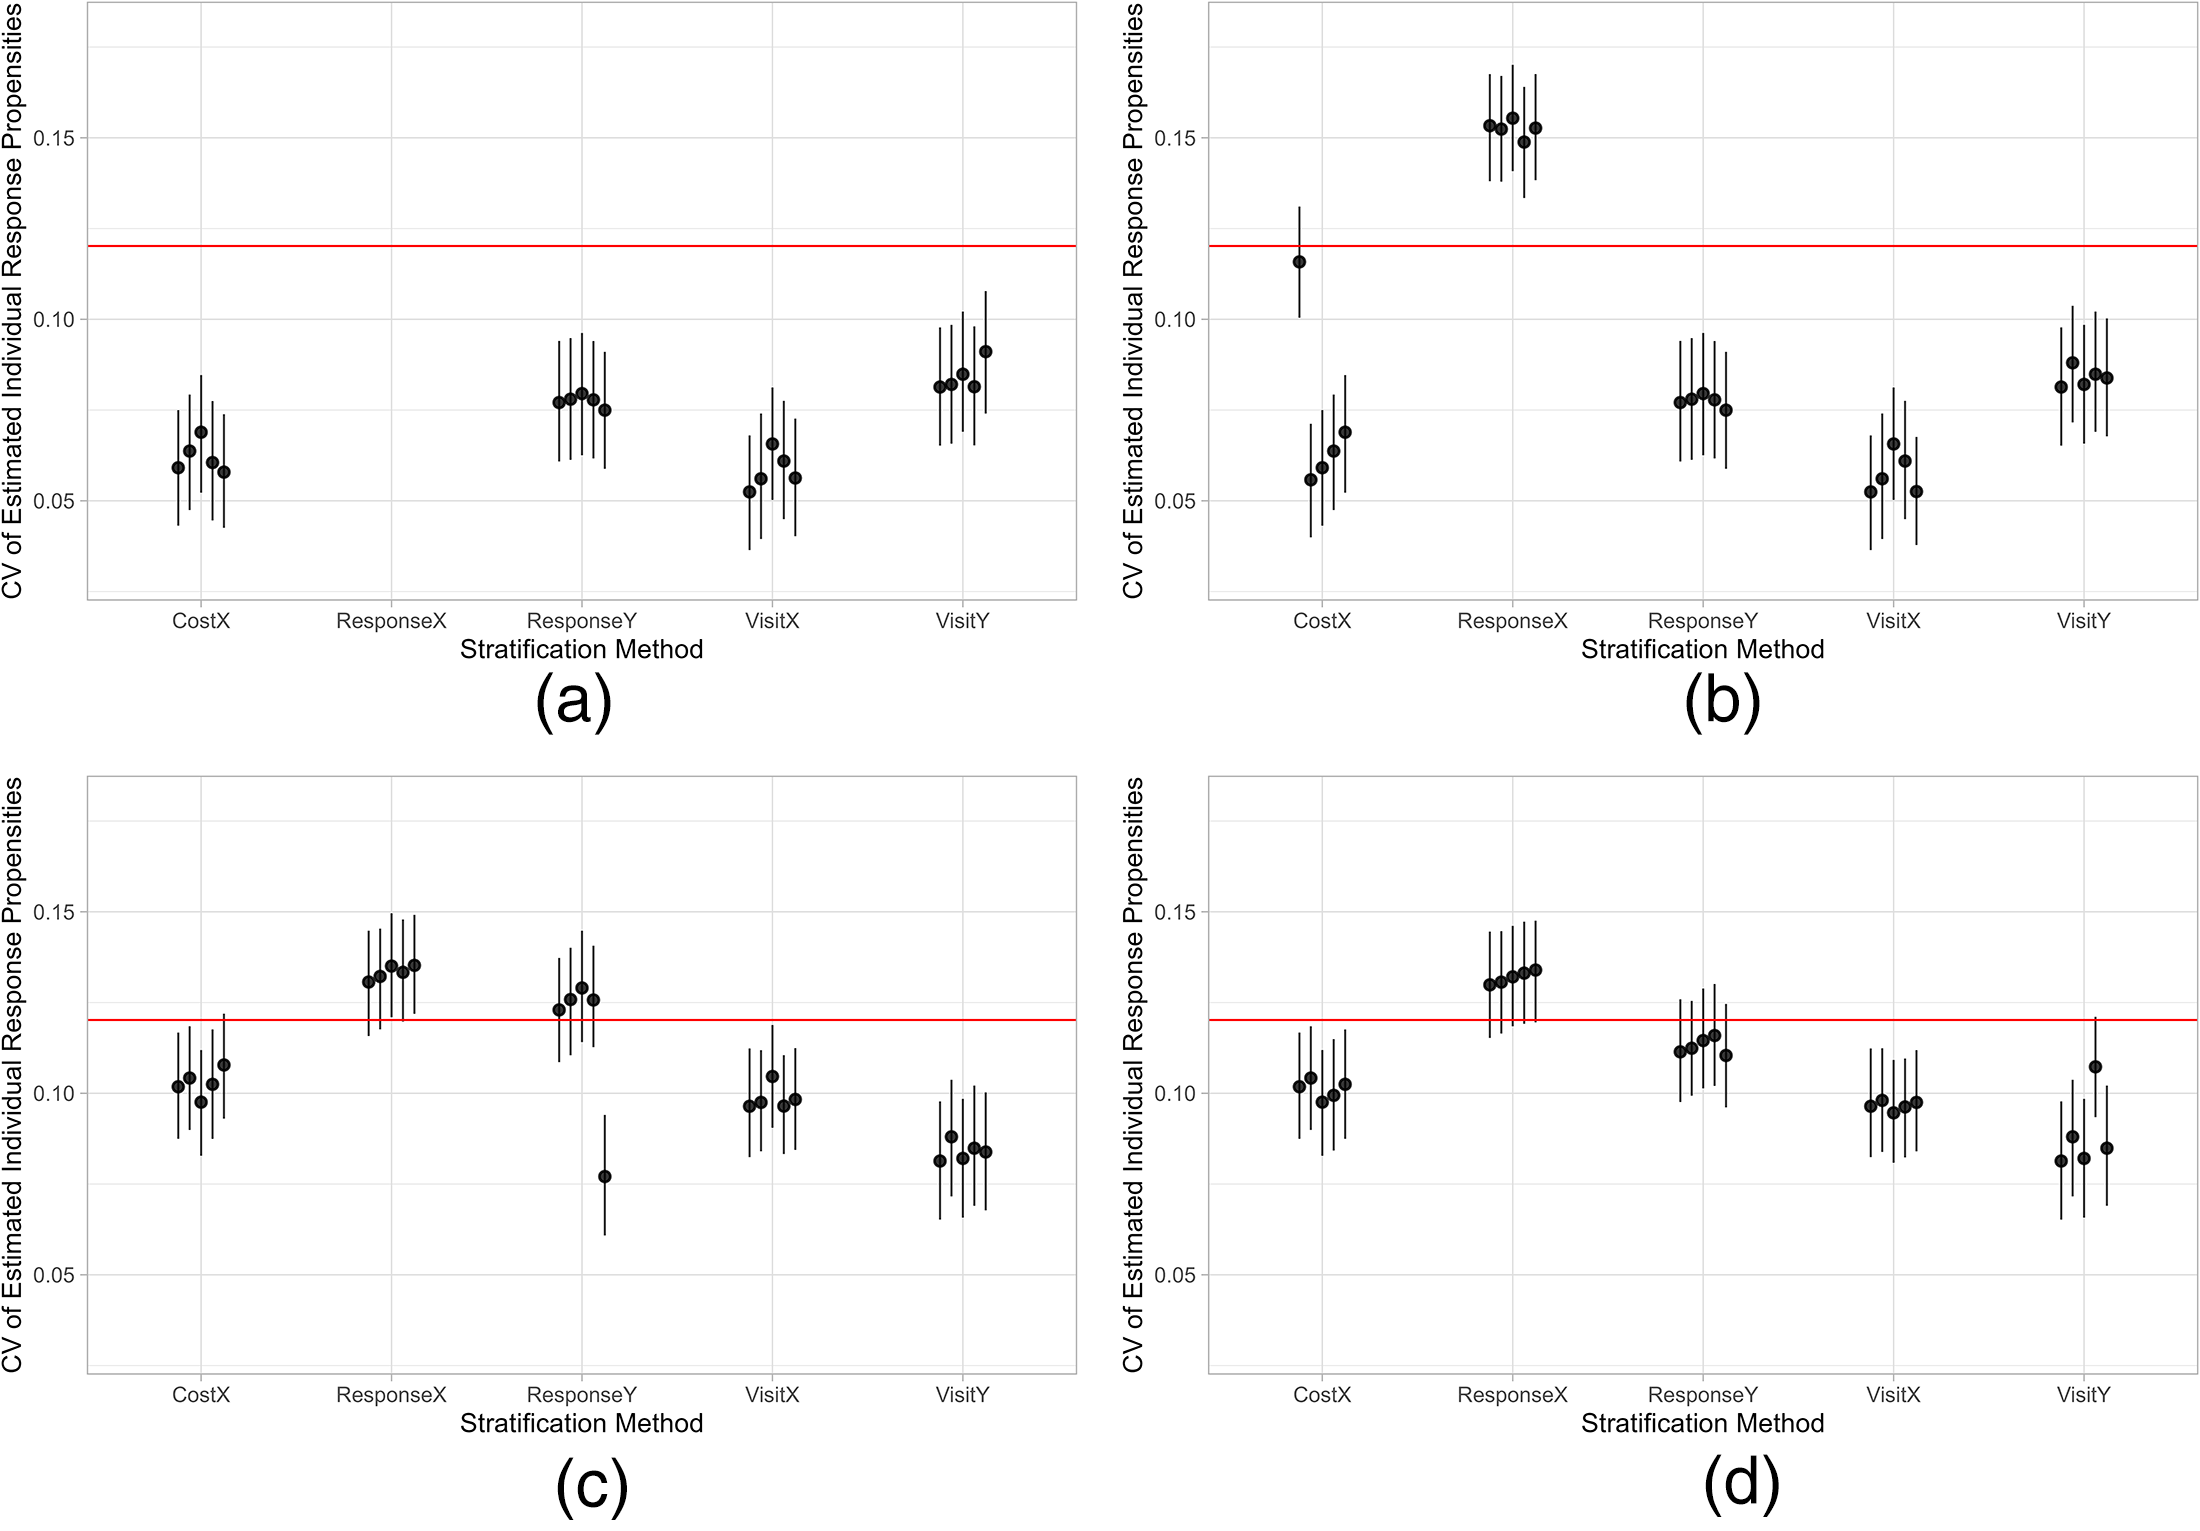
Coefficient of variation (CV) of estimated individual response propensities for the response rate limit at 50% and the budget limit at 80%, 85%, 95%, and 100% of realized costs. The horizontal line indicates the CV in the observed sample. (a) Budget limit 80%; (b) budget limit 85%; (c) budget limit 95%; (d) budget limit 100%.
The results suggest that ASD based on the traditional stratification method, ResponseX, may not minimize nonresponse bias in survey estimates effectively. While the proposed method, Response
Discussion
In this paper, we present a parsimonious stratification method for ASD, with the aim of minimizing nonresponse bias. This method uses auxiliary variables available prior to data collection to predict target survey variables and is therefore particularly suitable for multi-stage, mixed-strategy surveys conducted by statistical institutes with access to high quality administrative data. Stratification based on predicted target survey variables identifies subgroups defined by predicted target survey variables. Balancing responses across these subgroups minimizes the variation in estimated response propensities with respect to predicted target survey variables, thereby minimizing nonresponse bias but not inflating variances. We also establish a criterion for evaluating the effectiveness of the proposed method compared to other traditional methods that do not utilize target survey variables. We show through a case study that the optimal allocation based on the proposed method minimizes the variation in estimated response propensities with respect to predicted target survey variables, leading to more accurate survey estimates.
Similar to calibration methods (e.g., generalized regression estimator), the proposed stratification method relies on the auxiliary data available prior to data collection. This, obviously, creates a dependency on the amount and type of auxiliary data available. At Statistics Netherlands, these auxiliary data from the population registers are usually demographic and socio-economic and are usually weakly or moderately correlated with target survey variables. With more limited availability of auxiliary data, our proposed method looses efficacy but remains efficient. The proposed method can also be used to address nonresponse bias in longitudinal surveys where nonrespondents in subsequent waves may have responded in previous waves and these variables would more strongly predict the target survey variables than demographic variables. Perhaps, more importantly, the prediction of target survey variables must be based fully on historical survey response. This means that predictions are based on observed associations between target survey variables and auxiliary variables for respondents only. Doing so, it implicitly makes a MAR assumption. However, this assumption applies only to the maximal response that may be obtained by the set of data collection strategies under consideration. Sample units that would not respond to any of the strategies do not impact efficacy of our proposed method. It is, therefore, important to evaluate to what extent associations depend on the different strategies.
While we show the advantages of the proposed stratification method, we have not included some other stratification methods, such as methods based on partial R-indicators and regression diagnostic measures (Schouten and Shlomo 2017; Wagner 2014). Future research may evaluate these methods with the proposed criterion in this paper, i.e., CV of estimated individual response propensities with respect to predicted target survey variables. In addition, we primarily focus on bias reduction and assume potential variance reduction. Future research may explicitly examine whether the proposed method also protects against inflated variance in survey estimates.
The optimization in this paper is based on some simplifications for the sake of computational efficiency. We specify a deterministic allocation of strategies, i.e., for a given subgroup, a given strategy is either allocated or not. The ideal optimization allows the allocation probability to vary between 0 and 1. This avoids abrupt changes in strategy and smooths jumps in the values of quality and cost indicators. We also assume that all units in the same subgroup have the same estimated response propensities and costs. In other words, we assume that the response propensities, the number of in-person visits, and interview duration are relatively uniform within subgroups. While these assumptions are not realistic in general, the proposed stratification method is still motivated to effectively and efficiently minimize nonresponse bias. Future research may develop more flexible optimization techniques to accommodate a stochastic allocation of strategies and realistic assumptions about response propensities and costs.
Since subgroups are identified using historical survey data and carried over to future adaptive surveys, a critical but unrealistic assumption is that the stratification remains stable over time. We may update subgroups if a portion of the sample in future adaptive surveys is retained for randomized experiments using different data collection strategies. While Bayesian CART (Chipman, George and McCulloch 1998) is more flexible and allows for the incorporation of randomness in the tree structure and parameters, in practice, a single decision tree is often necessary for computational efficiency. We therefore use the conventional CART to generate a single tree for stratification. Future research may explore the use of Bayesian CART to improve the adaptability of stratification to changing circumstances.
Supplemental Material
sj-pdf-1-smr-10.1177_00491241251345463 - Supplemental material for An Optimal Stratification Method for Addressing Nonresponse Bias in Bayesian Adaptive Survey Design
Supplemental material, sj-pdf-1-smr-10.1177_00491241251345463 for An Optimal Stratification Method for Addressing Nonresponse Bias in Bayesian Adaptive Survey Design by Yongchao Ma, Nino Mushkudiani and Barry Schouten in Sociological Methods & Research
Footnotes
Acknowledgments
The authors thank the anonymous reviewers for their thoughtful and constructive feedback on earlier versions of the manuscript. Special appreciation is extended to one reviewer for recommending the simplification of several mathematical expressions, which significantly improved the clarity and accessibility of the text. An earlier version of this paper was presented at the 9th European Survey Research Association Conference and the 7th International Workshop on Advances in Adaptive and Responsive Survey Design in 2021.
Declaration of Conflicting Interests
The authors declared no potential conflicts of interest with respect to the research, authorship, and/or publication of this article.
Funding
The authors received no financial support for the research, authorship, and/or publication of this article.
Data and Code Availability Statement
Supplemental Material
Supplemental materials and Appendices to this article are available online.
Author Biographies
References
Supplementary Material
Please find the following supplemental material available below.
For Open Access articles published under a Creative Commons License, all supplemental material carries the same license as the article it is associated with.
For non-Open Access articles published, all supplemental material carries a non-exclusive license, and permission requests for re-use of supplemental material or any part of supplemental material shall be sent directly to the copyright owner as specified in the copyright notice associated with the article.