
Abstract
Although there is growing social science research examining how generative AI models can be effectively and systematically applied to text-based tasks, whether and how these models can be used to analyze images remain open questions. In this article, we introduce a framework for analyzing images with generative multimodal models, which consists of three core tasks: curation, discovery, and measurement and inference. We demonstrate this framework with an empirical application that uses OpenAI's GPT-4o model to analyze satellite and streetscape images (n = 1,101) to identify built environment features that contribute to contemporary residential segregation in U.S. cities. We find that when GPT-4o is provided with well-defined image labels, the model labels images with high validity compared to expert labels. We conclude with thoughts for other use cases and discuss how social scientists can work collaboratively to ensure that image analysis with generative multimodal models is rigorous, reproducible, ethical, and sustainable.
Keywords
Introduction
In March 2023, OpenAI publicly released GPT-4o (Achiam et al. 2023), a generative multimodal model that is capable of understanding not just text but also images. There is rapidly growing research on how generative large language models (LLMs) can be applied for text-based tasks in social science research (e.g., Argyle et al. 2023; Kim and Lee n.d.; Than et al. 2025). However, there has been, to date, only exploratory assessments of generative multimodal models and their applicability for image-based tasks in the social sciences (Bail 2024; Davidson 2024; Zhang 2023). As a result, it is currently unclear whether and how generative multimodal models can be used to accurately analyze images and in particular, whether these models can overcome longstanding technical challenges in computer vision that have limited large-scale image analysis (Buch et al. 2022; Fei-Fei et al. 2007), especially in the social sciences.
In this article, we begin to examine the opportunities and challenges of using generative multimodal models (MMs) for large-scale image analysis in social science research. We start by drawing on previous research in computer science and the social sciences to orient social scientists, who may have varying levels of familiarity with computer vision, to key developments and challenges in large-scale image analysis. We then introduce a framework that provides guidance for analyzing images with generative MMs, which extends and adapts an existing framework for computational text analysis (Grimmer, Roberts and Stewart 2022). We demonstrate this framework with an empirical application that uses OpenAI's GPT-4o model to analyze satellite and streetscape images (n = 1,101 images) from the Google Maps API and the Google Cloud Platform, with the aim of providing new insight into the role of the built environment in contributing to contemporary residential segregation in the United States. Overall, we find that when it comes to analyzing satellite and streetscape images, GPT-4o generates labels that are reasonably valid compared to expert-generated labels, though the model output is still not completely deterministic. We conclude with thoughts for other use cases as well as how researchers can ensure that large-scale image analysis in the generative AI era is rigorous, reproducible, ethical, and sustainable.
Prior Research on Large-Scale Image Analysis
In this section, we review previous research on large-scale image analysis. We begin by providing a brief overview of the technical innovations and challenges that organize computer vision research, and then we proceed to discuss implications for applications in social science research. Our goal in this section is to sufficiently contextualize why recent innovations in generative multimodal models present new opportunities for social scientists to engage in large-scale image analysis.
In the field of computer science, vision has been and continues to be one of the most challenging human abilities to computationally emulate (Buch et al. 2022; see also Moravec 1988; Thorpe et al. 1996; Fei-Fei et al. 2007). It has been technically difficult to mimic the embodied and contextual manner in which humans understand what they see (Buch et al. 2022). Moreover, even when computer scientists have been able to translate an aspect of human sight into a specific computational technique, they traditionally require significant computing resources in order to train models on images, which are exceedingly high-dimensional (Buch et al. 2022).
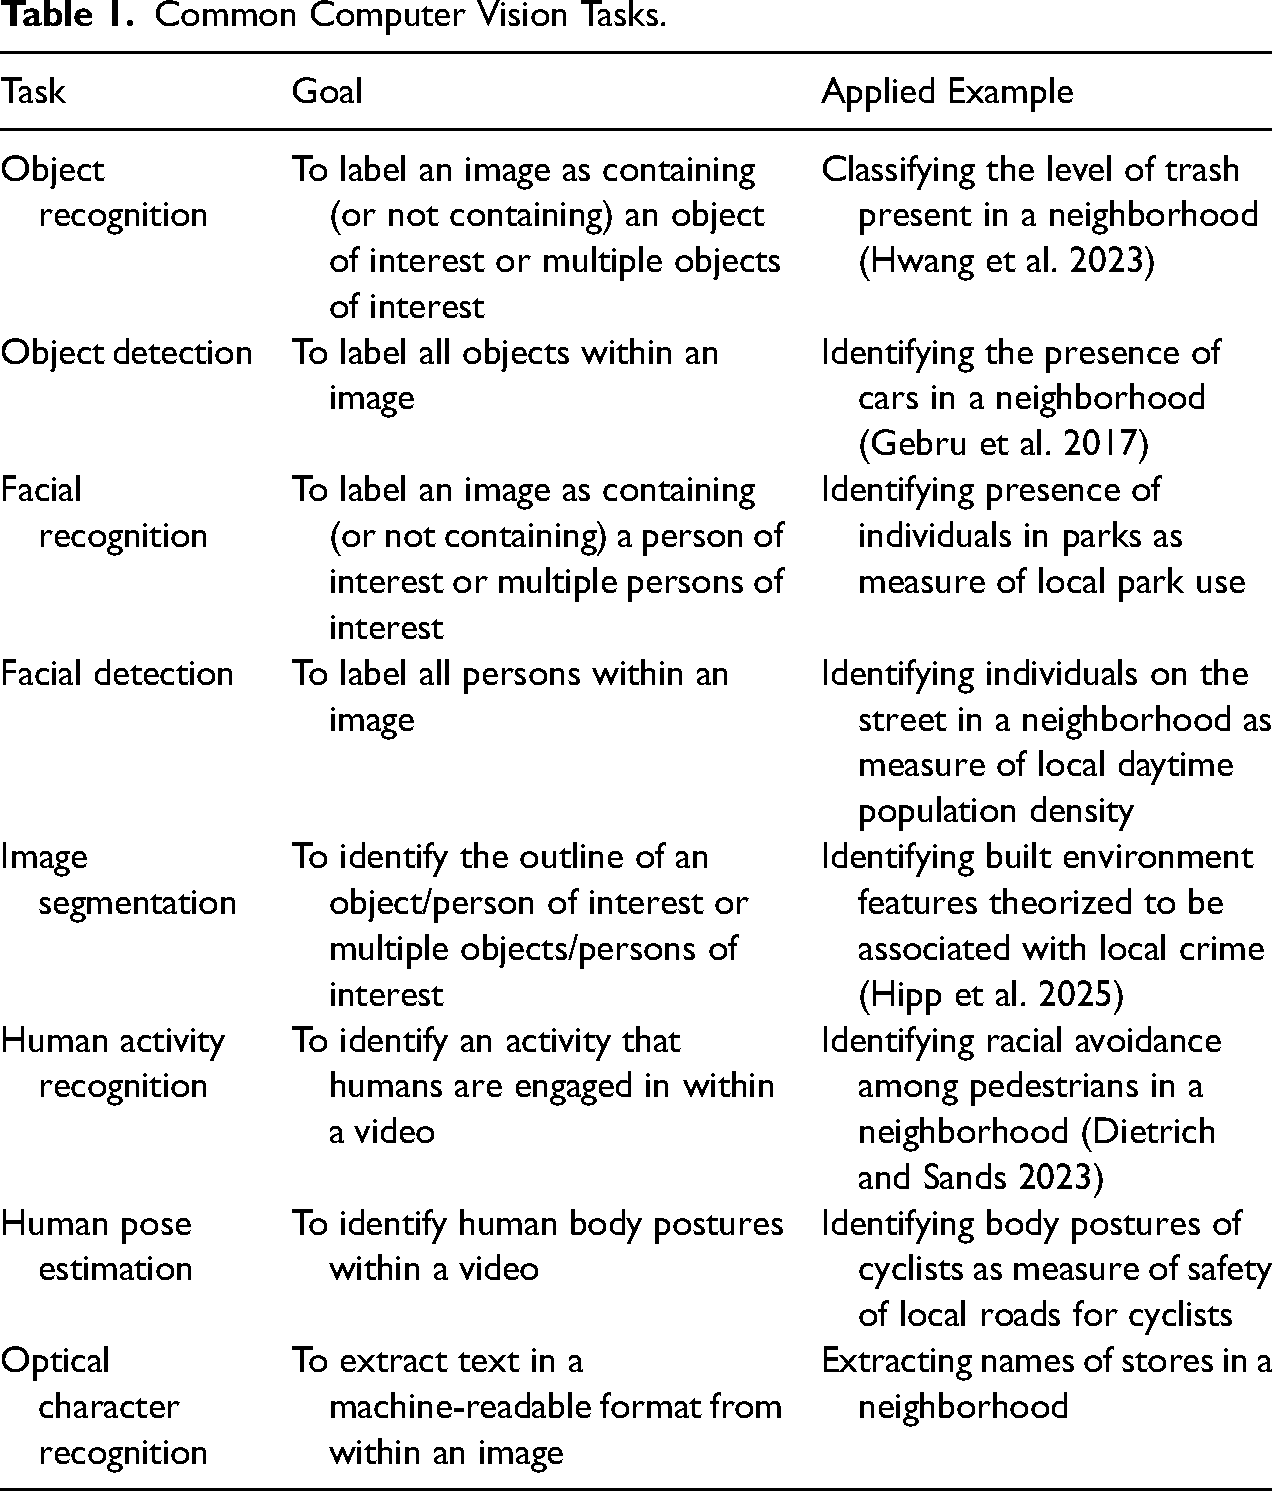
Research on computer vision has long focused on optimizing task-specific engineering, or training models to accurately, reliably, and efficiently carry out specific information extraction tasks. Table 1 summarizes the most common computer vision tasks to date (for reviews, see Buch et al. 2022; Nassauer and Legewie 2021; Schwemmer, Unger and Heiberger 2023), with examples of existing and potential applications in social science analyses of satellite and streetscape images. Social scientists often carry out multiple tasks in order to analyze a set of images; for example, researchers may want to first identify objects of interest within a neighborhood, such as cars, and then classify detected objects in order to predict neighborhood socioeconomic characteristics based on the types of cars that are present (Gebru et al. 2017).
Common Computer Vision Tasks.
In 2009, a team of computer scientists developed ImageNet (Deng et al. 2009), a hierarchical image database consisting of over three million manually labeled and high-quality images mapped to over 5,000 concepts. This was a significant development that, coupled with a contemporaneous increase in availability of graphics processing units (GPUs) for model training (e.g., Raina, Madhavan and Ng 2009), enabled computer vision researchers to shift from task-specific engineering to developing deep learning models (Buch et al. 2022; see also LeCun, Bengio and Hinton 2015; Voulodimos et al. 2018). Deep learning models differ from conventional machine learning models in how they read and learn images. While conventional machine learning models read and learn images by extracting and transforming features into a representation that has been carefully engineered by humans and therefore requires considerable dimension reduction, deep learning models can use raw images to “discover the representations needed for detection or classification” (LeCun, Bengio and Hinton 2015: 436). Because of their complex architecture, deep learning models can obtain robust and generalizable knowledge about images after pre-training, and can then be efficiently adapted to learn new image datasets through fine-tuning (LeCun, Bengio and Hinton 2015; Voulodimos et al. 2018).
There are several different types of deep learning vision models, with convolutional neural networks being used most commonly by social scientists. 1 Convolutional neural networks (CNNs) (Krizhevsky, Sutskever and Hinton 2012; LeCun et al. 1990; LeCun et al. 1998) are deep learning models that have a distinctive architecture that enables them to quickly and efficiently learn data containing multiple arrays, such as images, each of which may contain hundreds or thousands of pixels for three different matrices corresponding to the colors red, green, and blue (for reviews, see LeCun, Bengio and Hinton 2015; Torres and Cantú 2022; Webb Williams, Casas and Wilkerson 2020). CNNs, which have been available since the early 1990s, became more widely used for computer vision tasks starting in 2012 and have quickly become “the dominant approach for almost all recognition and detection tasks” over the past decade (LeCun, Bengio and Hinton 2015; Voulodimos et al. 2018).
CNNs have facilitated increased engagement in large-scale image analysis among social scientists in recent years, particularly among computational social scientists who leverage computational methods to pursue social science research questions (Edelmann et al. 2020; Lazer et al. 2009; Salganik 2017; see also Kesari et al. 2024). As Webb Williams, Casas and Wilkerson (2020) explain in their excellent introductory text on CNNs, the high predictive accuracy of pre-trained CNNs typically makes it unnecessary for social scientists to train a CNN from scratch and they can instead fine-tune a pre-trained CNN, many of which are available in open-source machine learning libraries such as Pytorch's torchvision (Marcel and Rodriguez 2010). Indeed, “[w]hereas the original algorithm may have been the product of many months of effort using millions of labeled examples, this fine-tuning or transfer learning can produce remarkably accurate results using a much smaller training set of images (as few as 100 in some cases)” (Webb Williams, Casas and Wilkerson 2020: 9, italics in original). Social scientists have used CNNs to study neighborhood change and inequality (Hwang and Naik 2023; Hwang et al. 2023; Kim et al. 2024), crime (Hipp et al. 2025), collective action (Zhang and Pan 2019), and election fraud (Cantú 2019), as well as used CNNs to develop new methodological techniques for analyzing large image (Zhang and Peng 2022) and video (Bernasco et al. 2023; Goldstein, Legewie and Shiffer-Sebba 2023) datasets. 2
Although pre-trained large computer vision models have substantially decreased the amount of manually labeled images, computing power, and training time that social scientists must invest in order to analyze images, these models have not been widely adopted. This is partly because even fine-tuning a pre-trained CNN requires a nontrivial amount of technical expertise. For example, in order to fine-tune a pre-trained CNN, researchers need to first experiment with hyperparameter values, such as the learning rate and the number of iterations and epochs, and then retrain model parameters—often with several different pre-trained models or the same pre-trained model with different numbers of layers (Webb Williams, Casas and Wilkerson 2020). Fine-tuning a pre-trained CNN also requires researchers to preprocess images, which includes resizing images and normalizing color intensities, as the performance of CNNs is contingent on how objects of interest are positioned and contrasted in images (Torres and Cantú 2022; Webb Williams, Casas and Wilkerson 2020). Moreover, fine-tuned CNNs still struggle to accurately and reliably classify images when the differences between classes are more subtle (e.g., distinguishing between diverse types of protests) or involve more complex reasoning (e.g., identifying evoked emotions) (Torres and Cantú 2022; Webb Williams, Casas and Wilkerson 2020).
Recently developed generative artificial intelligence models, also known as foundation models, offer new possibilities for large-scale image analysis in the social sciences. Foundation models are models that are “trained on broad data (generally using self-supervision at scale) that can be adapted (fine-tuned) to a wide range of downstream tasks” (Bommasani et al. 2022:3). While foundation models rely on deep learning, they differ from earlier deep learning models in that they are trained on substantially more data, can be programmed to understand non-technical input, and have generative capabilities (for an in-depth overview, see Bommasani et al. 2022; see also Jones 2023 for an accessible primer).
There are currently two types of foundation models. Generative large language models (LLMs) are one type of foundation model that can understand text input and generate text output, and they can also receive input in natural language via chatbot interfaces and prompts. One of the first generative LLMs made widely available was OpenAI's GPT-3 model (Brown et al. 2020), which was released in 2020 and available for access via ChatGPT in 2022. 3 There are now many generative LLMs available, including proprietary models, such as OpenAI's GPT-4 model (released in 2023), and open-source models, such as Meta's Llama 3 model (released in 2024).
Another type of foundation model is generative multimodal models (MMs). Generative MMs can interact with multiple modalities (e.g., text, image, audio), understanding input in one or more modalities and generating output in one modality. In this article, we focus on generative MMs that can understand text and image input and generate text output, though we note that there are a growing number of generative MMs with other capabilities. 4 Compared to generative LLMs, generative MMs are still “early-stage,” but computer scientists have obtained promising results thus far in their assessments of generative MMs and their ability to complete traditional computer vision tasks and more complex computer vision tasks involving generalizability—often matching or exceeding the performance of fully supervised models (Chen et al. 2020; He et al. 2019; Hénaff et al. 2021; Radford et al. 2021; Ramesh et al. 2021; see also Buch et al. 2022). These promising early results, along with strong commercial incentives to invest in continued development of these models, suggest that generative MMs may eventually “reduce dependence on explicit annotations,” which will not only make traditional computer vision tasks more efficient and more generalizable but also “lead to progress on essential cognitive skills (e.g., commonsense reasoning) which have proven difficult in the current, fully-supervised paradigm” (Buch et al. 2022: 29).
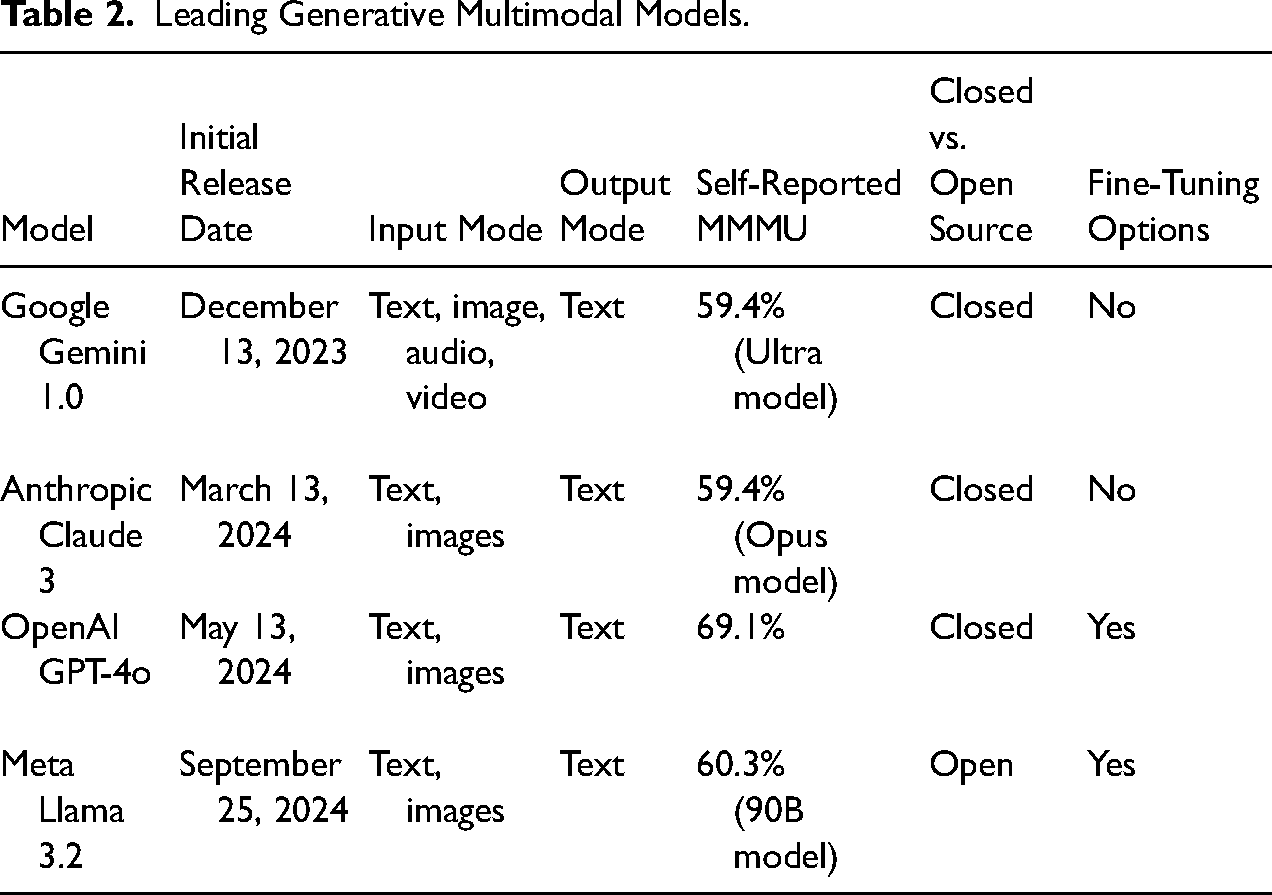
Compared to generative LLMs, there are fewer generative MMs, though more are likely to be available in the near future given growing investments in generative MM development. Table 2 summarizes four leading generative MMs: Google Gemini 1.0, Anthropic Claude 3, OpenAI GPT-4o, and Meta Llama 3.2. These models vary in terms of their architecture (specifically how many modalities they are designed to understand and how they understand modalities in relation to one another), whether they are closed or open-source, and whether they allow for fine-tuning. Each of these four models also comes in multiple versions that vary in parameter size. In terms of performance, generative MMs are often evaluated in computer science using MMMU (Yue et al. 2024), which is a benchmark that assesses the ability of generative MMs to correctly answer a series of multimodal college-level problems spanning multiple disciplines. Based on self-reported MMMU benchmarking, GPT-4o, which is based on GPT-4 (Achiam et al. 2023), currently performs best when it comes to multimodal question answering. 5
Leading Generative Multimodal Models.
While newly developed generative MMs appear promising, these models remain empirically untested in the social sciences. Although there is growing work in the social sciences to examine how generative LLMs can be used to analyze text data (e.g., Argyle et al. 2023; Kim and Lee n.d.; Than et al. 2025), there have been, to date, only exploratory assessments of generative MMs and their image analysis capabilities (Bail 2024; Davidson 2024; Zhang 2023). As a result, there are still many unanswered questions about generative MMs and their applicability for image analysis tasks in social science research.
Satellite and Streetscape Imagery as Social Science Data
Newly developed generative MMs have the potential to make large-scale image analysis much more efficient and accessible, but these models still need to be systematically tested for applications in the social sciences. We test one potential application: using generative MMs to analyze satellite and streetscape images to identify built environment features that contribute to social and spatial division in U.S. cities. This application focuses on an important and understudied social science topic for which images and generative MMs can potentially offer new insight: the role of the built environment in shaping contemporary residential segregation in the United States (see Archer 2020; Bayor 1988; Grannis 1998, 2005; Roberto 2018; Roberto and Korver-Glenn 2021; Korver-Glenn et al. 2024).
Satellite and streetscape imagery contain rich information about many topics that are central to the social sciences. For example, streetscape images from sources such as Google Streetview have been used in previous studies to examine neighborhood inequality and change (Hwang and Sampson 2014; Hwang and Naik 2023; Hwang et al. 2023; Kim et al. 2024), housing affordability and homelessness (Finnigan 2021; López Ochoa and Zhai 2024), social determinants of health (Nguyen et al. 2020), voting behavior (Gebru et al. 2017), and surveillance (Sheng, Yao and Goel 2021). To a lesser extent, satellite images have been used to investigate social science topics such as population estimation (Robinson, Hohman and Dilkina 2017) and climate change (Tellman et al. 2021). To date, social scientists have analyzed streetscape and satellite images using conventional machine learning models, which require task-specific training that is computationally-, cost-, and time-intensive, or convolutional neural networks, which often only require fine-tuning but still demand considerable technical expertise.
Generative MMs equipped with more robust and generalizable computer vision capabilities, therefore, present new opportunities for social scientists to use satellite and streetscape images as data. Although tech firms have generally not disclosed their training data for developing generative MMs (even for open-source models), it is likely that satellite and streetscape images are included in training data since they are a readily available type of large image data. 6 There are also strong commercial interests to train generative MMs to analyze satellite and streetscape imagery to advance lucrative applications such as self-driving cars (Buch et al. 2022). Because of these factors, satellite and streetscape imagery may be particularly amenable to analysis with generative MMs, compared to other types of images of interest to social scientists, such as images of protest activities shared on social media (e.g., Casas and Webb Williams 2018; Zhang and Pan 2019) and images of political leaders (e.g., Schwemmer et al. 2020).
In the following section, we introduce a framework for analyzing satellite and streetscape imagery with OpenAI's GPT-4o model, which is currently the best-performing generative MM among leading models based on multimodal question answering ability. Our framework extends and adapts a familiar framework for computational text analysis (Grimmer, Roberts and Stewart 2022) to provide social scientists with guidance for conducting computational image analysis, specifically with generative MMs.
A Social Science Framework for Image Analysis with Generative Multimodal Models
Social scientists increasingly recognize that although computational methods developed by computer scientists can be useful for studying social, political, and economic phenomena, their research goals differ in important ways from those of computer scientists and, therefore, distinct frameworks are needed to guide the use of computational methods in social science research (Bonikowski and Nelson 2022; Kesari et al. 2024; Salganik 2017). To date, one of the most widely used computational social science frameworks is Grimmer, Roberts and Stewart's (2022) “agnostic approach” to text analysis. The approach defines four core tasks in computational text analysis: selection and representation, discovery, measurement, and inference. These tasks are guided by an underlying assumption of modeling agnosticism—that because “there are no “true” values for us to target with text-as-data methods, or no one best model that can be used for all applications of a corpus,” researchers should identify the most useful organization of text data based on their research question and then validate their approach based on its ability to capture this organization (Grimmer, Roberts, Stewart 2022: 18). This agnostic approach to text analysis extends Krippendorff's (2019: 29, italics in original) foundational framework for content analysis, which posits that texts do not contain inherent meaning but instead must be interpreted by researchers to “have meanings [which are] relative to particular contexts, discourses, or purposes.”
We argue that although Grimmer, Roberts and Stewart's (2022) agnostic approach was designed for computational text analysis, it can be extended to provide a framework for conducting computational image analysis. Like text, images also do not contain inherent meaning but instead must be interpreted to have meanings that are necessarily context-specific. Arguably, images are more open to interpretation compared to text because they are comprised of more “latent” content and less “manifest” content (Krippendorff 2019); for example, while the building block of a text document (a word) may carry latent and manifest content, the building block of an image (a pixel) is entirely latent in content. As such, an agnostic approach, where researchers define a useful organization of data and then validate an approach based on its ability to obtain this organization, is perhaps even more relevant when analyzing images.
With some modifications, their four core tasks can also be used to organize computational image analysis. The need to first define research questions and gather relevant data, captured in the selection and representation task, also applies to any computational image analysis project. The discovery, measurement, and inference tasks are also applicable to any computational image analysis project, though the specific steps involved may differ depending on the type of computer vision method that is used. For example, the steps involved in fine-tuning a pre-trained deep learning vision model are distinct from the steps involved in using a generative MM. Although there is guidance for social scientists on measuring concepts of interest and making inferences with deep learning vision models, similar guidance does not currently exist for how to carry out such tasks with generative MMs.
Accordingly, we extend Grimmer, Roberts and Stewart's (2022) agnostic approach to provide a social science framework for computational image analysis, specifically with generative MMs. Our framework, which is visualized in Figure 1, consists of three core tasks: (1) curation, (2) discovery, and (3) measurement and inference. We introduce this framework using our empirical application, which uses OpenAI's GPT-4o model to analyze satellite and streetscape images.
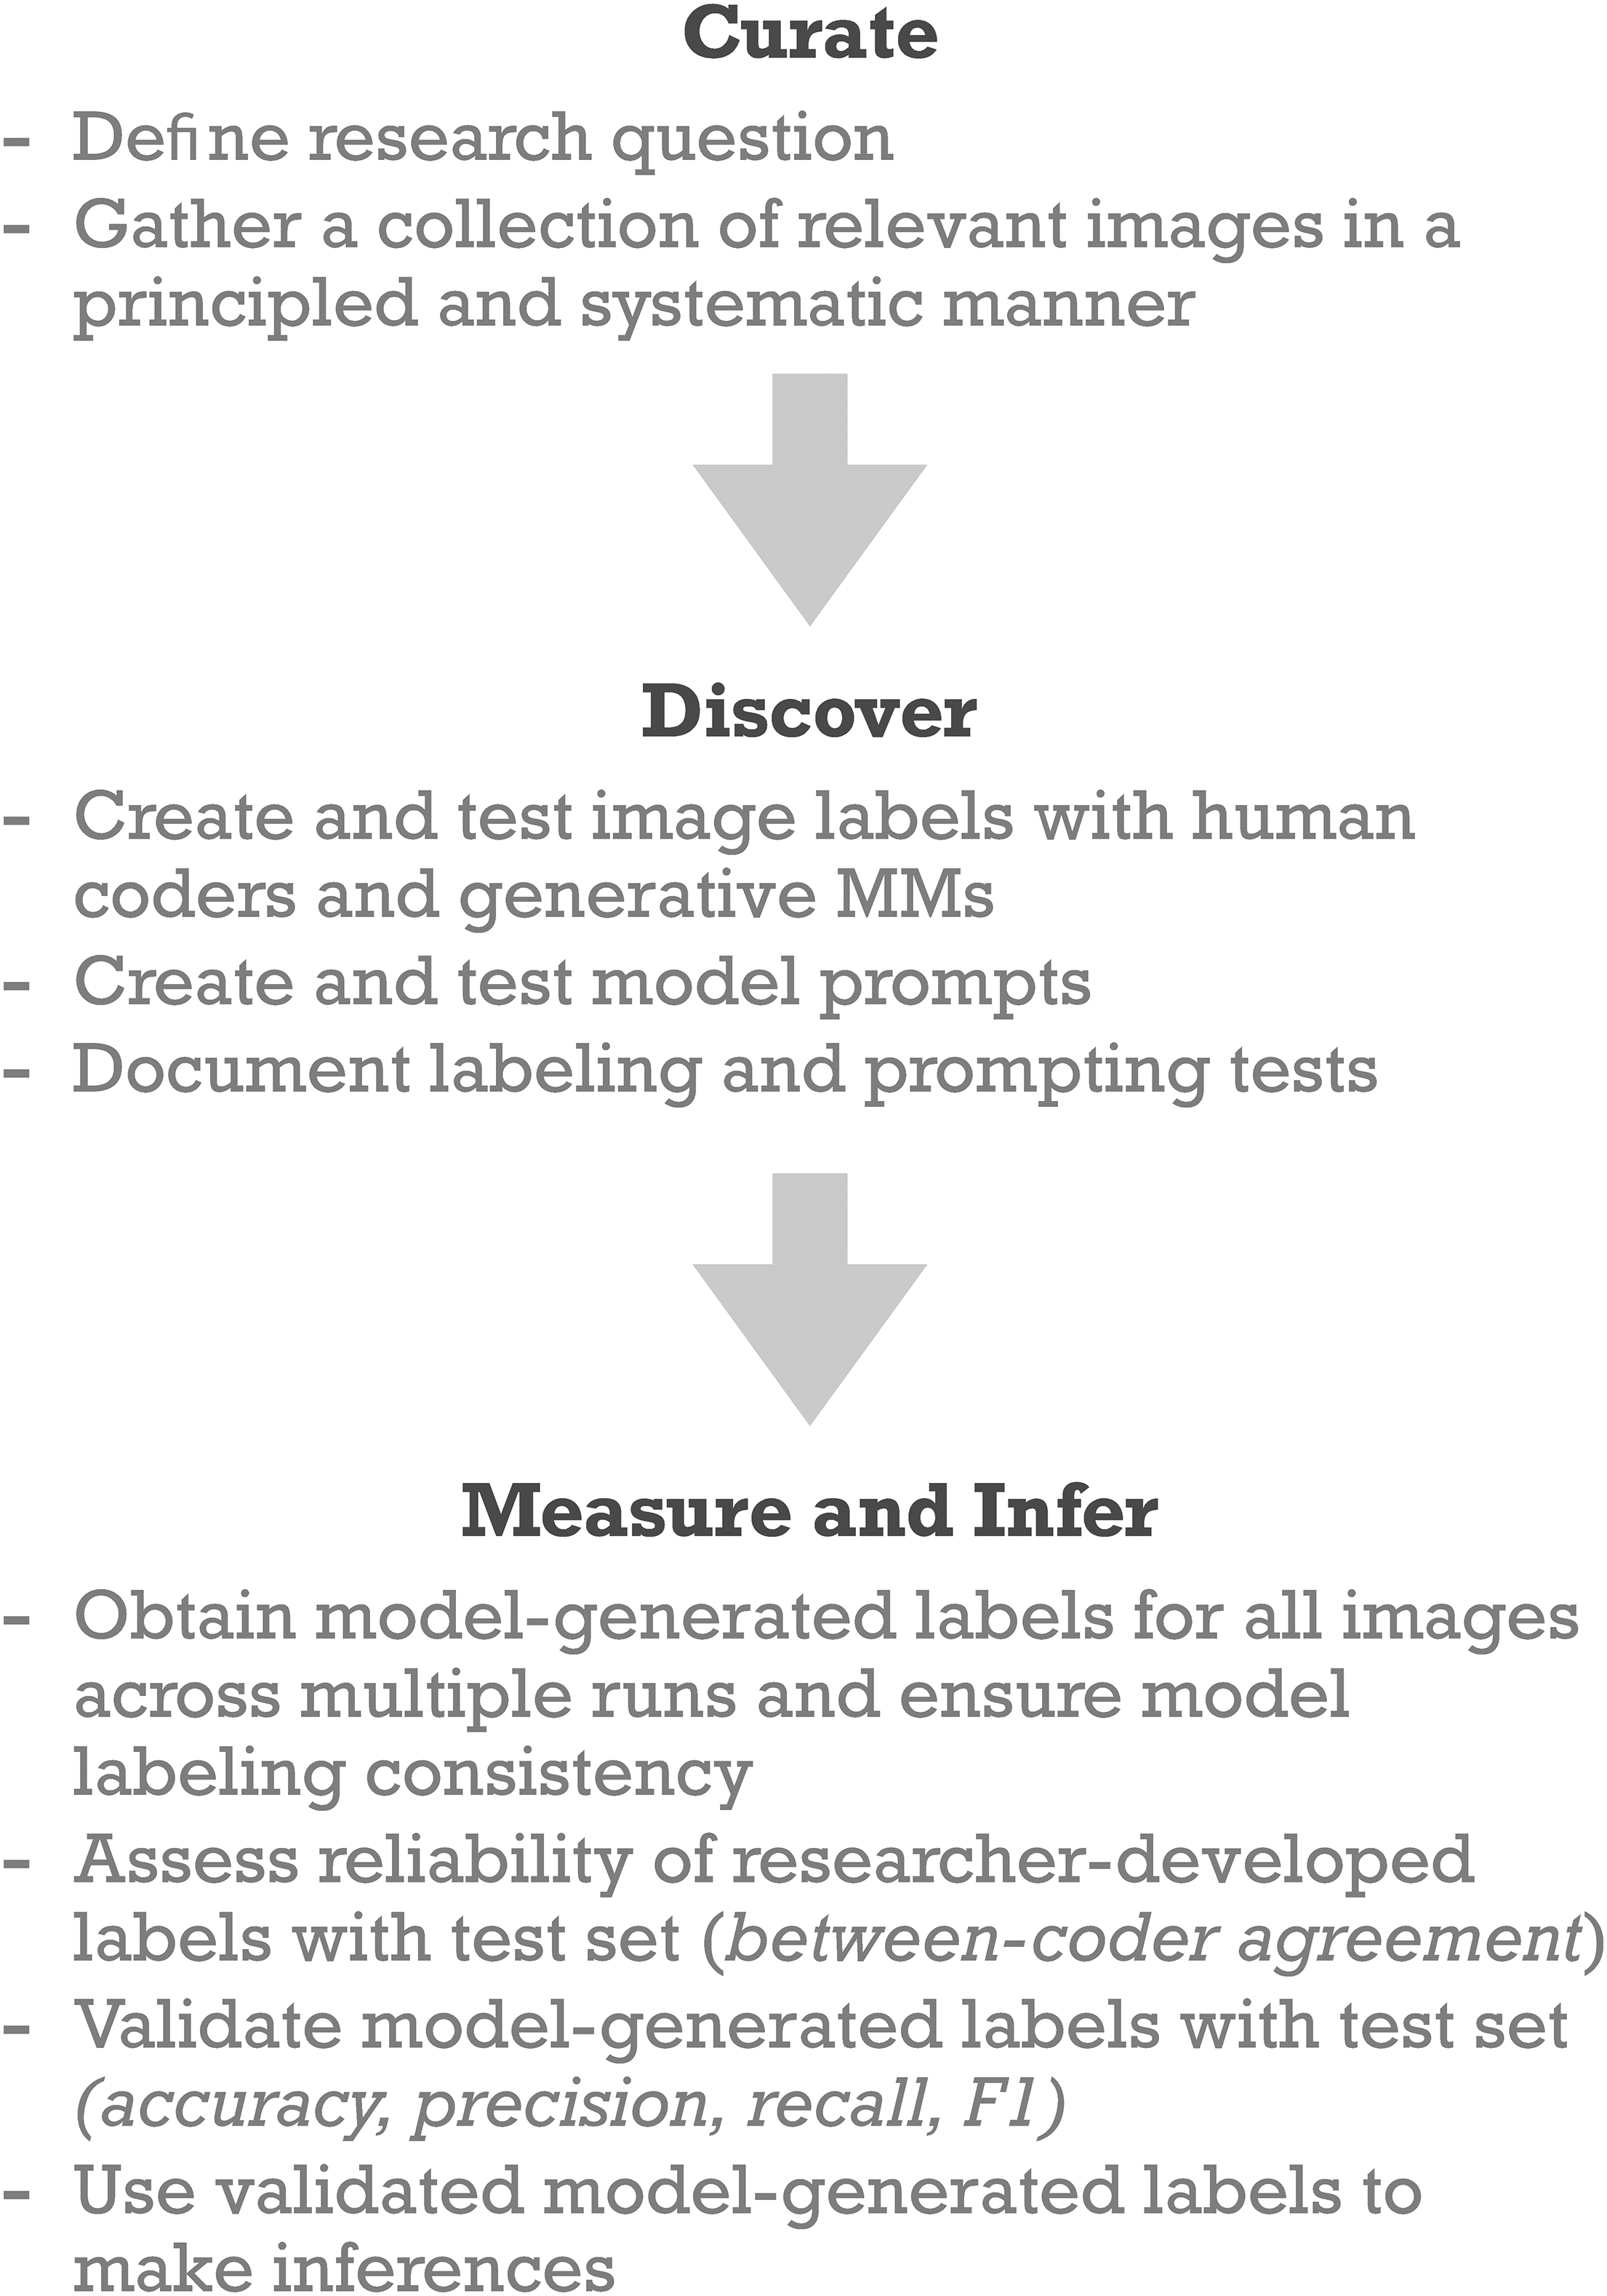
A social science framework for image analysis with generative multimodal models.
Curation
As with any research project, social scientists should begin a computational image analysis project by defining their research question and collecting relevant data. Given that image data are highly diverse and new sources of image data are increasingly available (for reviews, see Torres and Cantú 2022; Webb Williams, Casas and Wilkerson 2020), we offer some general guidance for collecting image data. In particular, we emphasize that social scientists should collect image data in a systematic and principled manner.
Images introduce unique considerations in terms of systematic data collection. Namely, we echo advice from previous research involving large-scale image analysis (Hwang and Naik 2023; Hwang et al. 2023; Webb Williams, Casas and Wilkerson 2020) that social scientists should ensure that their images are consistent in size, scale, and resolution. Application programming interfaces (APIs) can make image data collection more systematic (and perhaps also more reproducible), though images collected in this way should always be manually screened for legibility (e.g., blurriness, obstructed views) and errors. However, the ability of researchers to collect images in a systematic manner may be limited in certain cases, such as when researchers collect images from social media or archival sources. In these cases, researchers will want to carefully consider potential biases they are inheriting in their collections.
Images also raise new considerations for principled data collection. Here, we argue that Grimmer, Roberts and Stewart's (2022) principles for corpus construction can also be relevant for image collection curation. Within the context of collecting images, these principles recognize that: (1) a collection must be useful for answering the research question, (2) curating images implies ethical obligations, (3) there may be multiple ways to represent images, and (4) validation is necessary. In particular, the second principle takes on increased importance when working with image data. Although text data may present ethical concerns in terms of institutional representation and omission, racial and gender bias, and privacy and informed consent, these concerns are more acute when working with image data—especially images of humans—given well-documented and pervasive biases in large image datasets as well as their greater susceptibility to being re-identified and misused for harmful applications (Buolamwini 2023; Buolamwini and Gebru 2018).
For our empirical application, our research question is: what types of built environment features contribute to social and spatial division in U.S. neighborhoods? Based on this research question, we collected streetscape and satellite images that capture the built environment of socially and spatially divided sites located within U.S. cities. We curated our image dataset through three main steps. First, we selected five cities that vary in demographics (e.g., population size, racial composition) and spatial characteristics: Chicago, IL, Cincinnati, OH, Hartford, CT, Miami, FL, and Seattle, WA (see Table 3).
Summary of Sites.
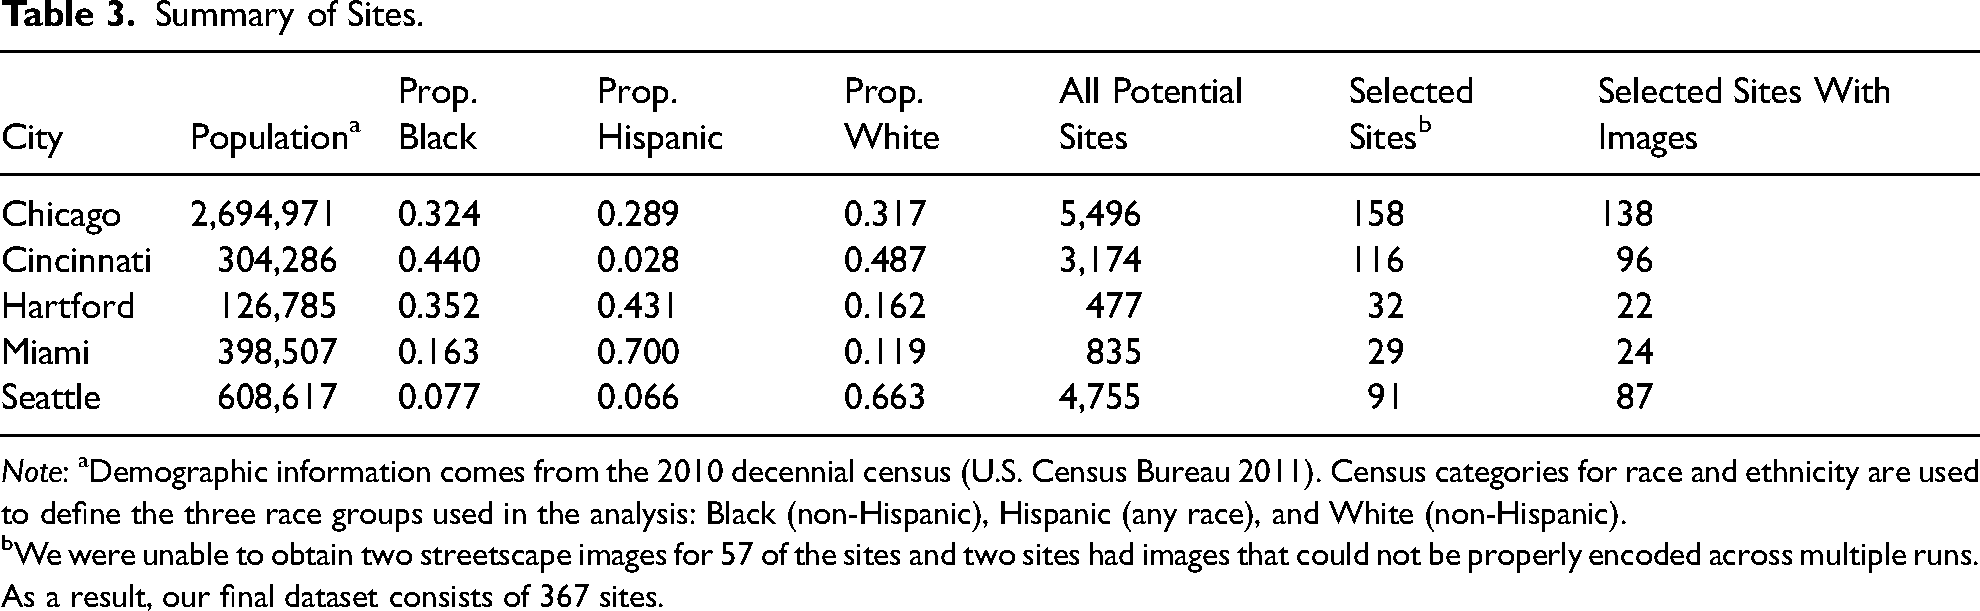
Note: aDemographic information comes from the 2010 decennial census (U.S. Census Bureau 2011). Census categories for race and ethnicity are used to define the three race groups used in the analysis: Black (non-Hispanic), Hispanic (any race), and White (non-Hispanic).
We were unable to obtain two streetscape images for 57 of the sites and two sites had images that could not be properly encoded across multiple runs. As a result, our final dataset consists of 367 sites.
Second, we used Roberto et al.'s (Forthcoming) counterfactual road networks (CRN) method along with population and geographic data from the 2010 decennial census (U.S. Census Bureau 2011, 2012) to identify sites in these cities that are divided spatially and socially. The CRN method first characterizes the existing road network using a variety of features, namely, the maximum straight-line distance (i.e., the maximum distance between two intersections directly connected by a road—using the language of graph theory, the intersections are the nodes and the road segments are the edges in the network), shadow angle threshold (i.e., the typical level of co-linearity between connected nodes), and neighbor angle threshold (i.e., the typical angles in connected v-shaped motifs). CRN uses these features, along with road classifications, to constrain the set of new edge “candidates” (i.e., road segments that are not currently in the network but could plausibly exist). After removing redundant edge candidates, CRN assesses the utility of each edge in terms of how much connectivity it contributes to the local network. Roberto et al. (Forthcoming) show that the unexpected disconnectivity in a city's road network due to these missing road segments is associated with greater differences in racial composition between spatially proximate areas and is associated with higher levels of segregation in the local areas of missing road segments and at the city level.
Using the CRN method, we derived a set of candidate edges, or counterfactual road segments, for each of the five cities. We selected a subset of these counterfactual road segments that are most likely to be associated with social and spatial division using two criteria: (1) potential to improve the connectivity of residential roads 7 and (2) connects areas with different racial compositions. 8 These counterfactual road segments—more specifically, the geographic coordinates of where these roads would be located within a city—serve as our sites of spatial and social division. Figure 2 shows a stylized example of a counterfactual road segment.
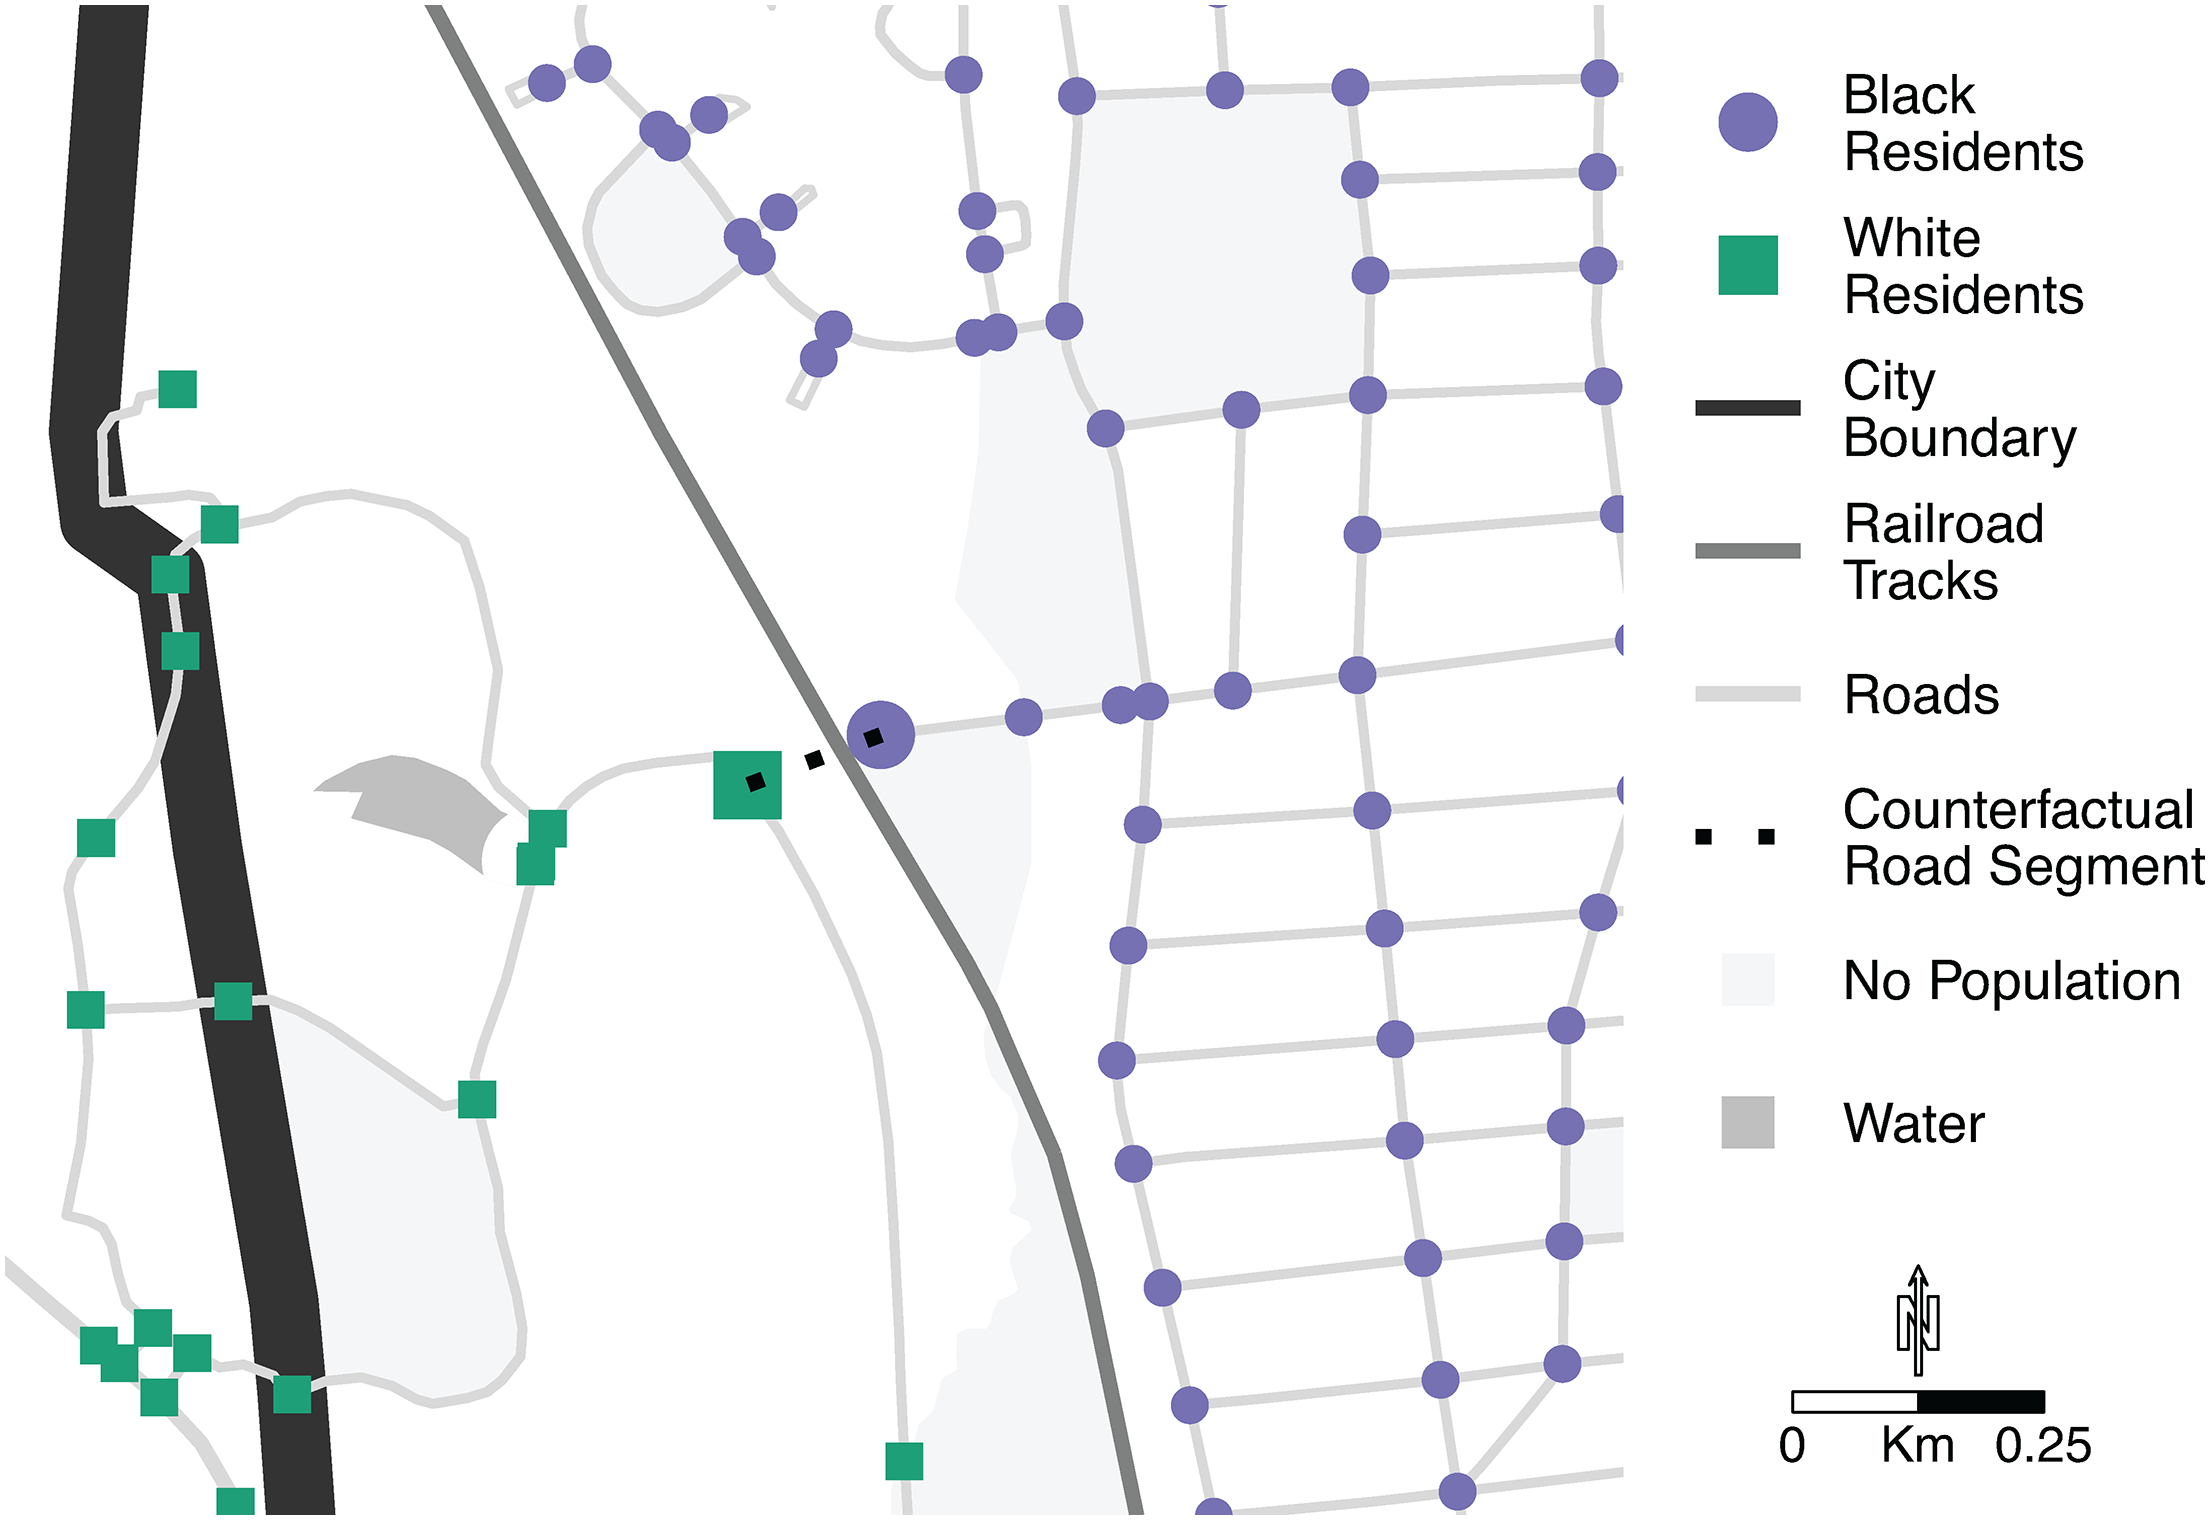
Stylized example of a counterfactual road segment.
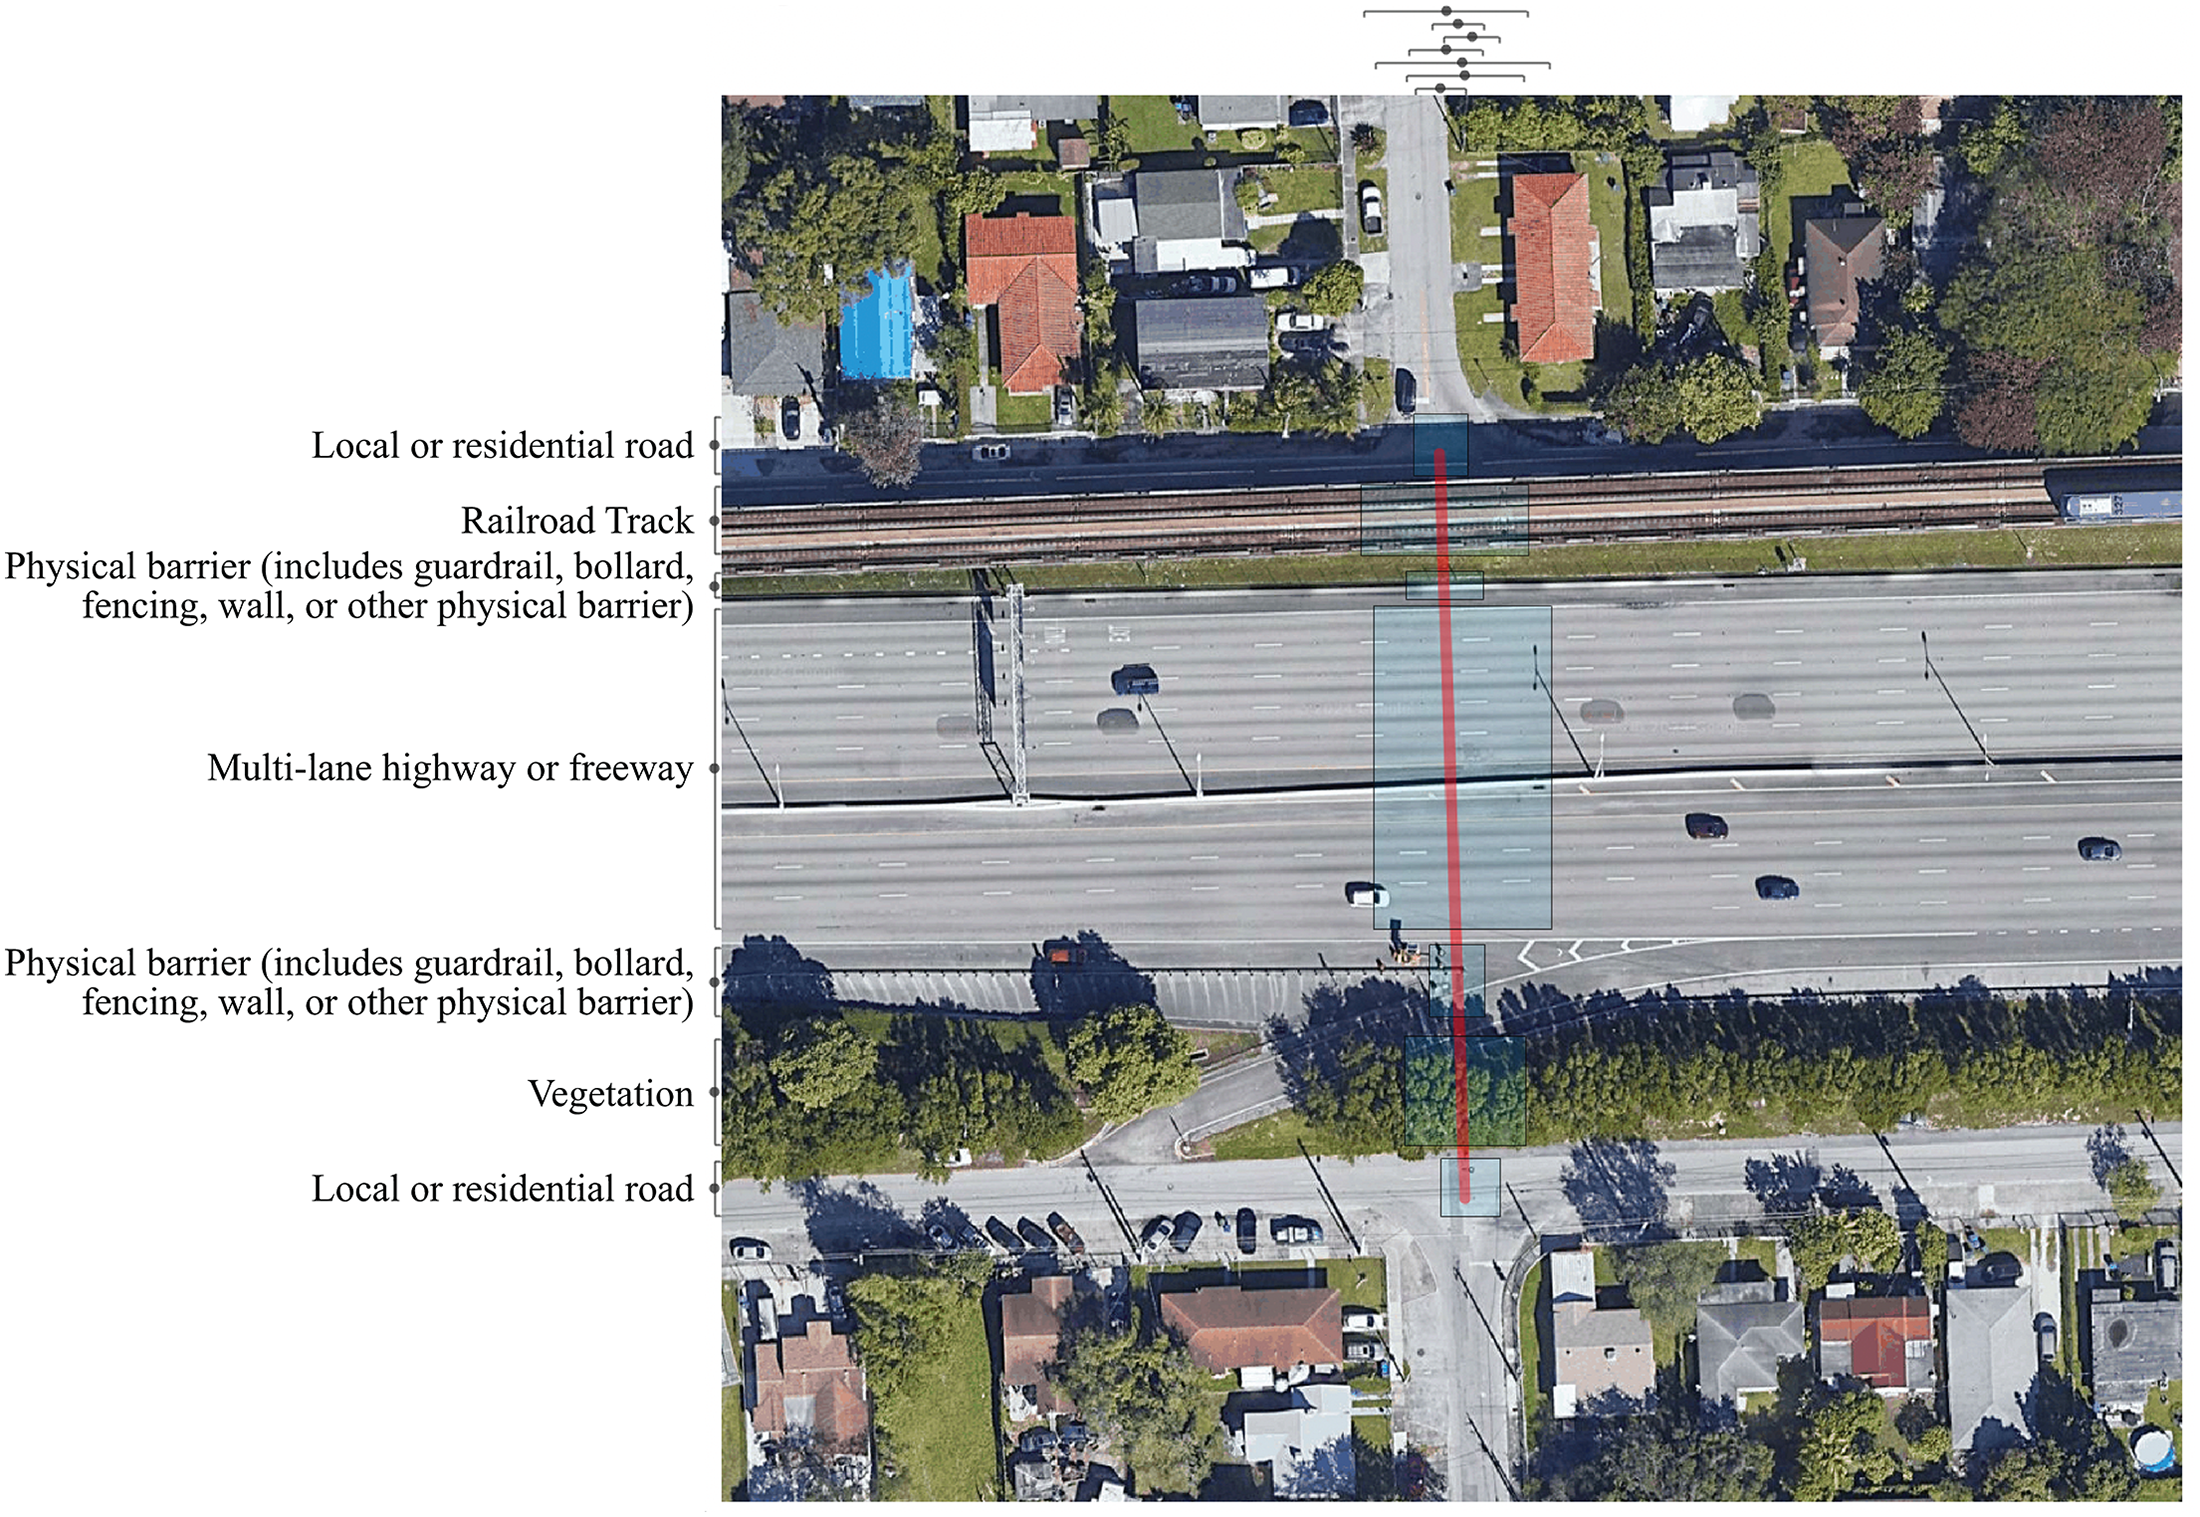
Third, using geographic coordinates for the sites of spatial and social division, we collected satellite and streetscape images in 2024 from the Google Maps API and the Google Cloud Platform (Google 2024a, 2024b). We collected images of built environments in two different visual representations (satellite and streetscape) because we hypothesize that satellite and streetscape images offer different insights about the relationship between the built environment and segregation; for example, whereas satellite images may show larger features that obstruct connectivity for residents, such as highways, streetscape images may show smaller features that may be similarly obstructive, such as fencing. For each site, we collected one satellite image centered on where the counterfactual road segment would be located and two streetscape images from the vantage point of each endpoint of the counterfactual road segment and looking toward the other endpoint. We added red lines to the satellite images to indicate where counterfactual road segments would be present. 9 Figure 3 shows the satellite and streetscape images for a single site in Chicago. Our final dataset (see Table 3) consists of 1,101 images from 367 sites that are consistent in size and image resolution (the maximum allowed by the APIs).
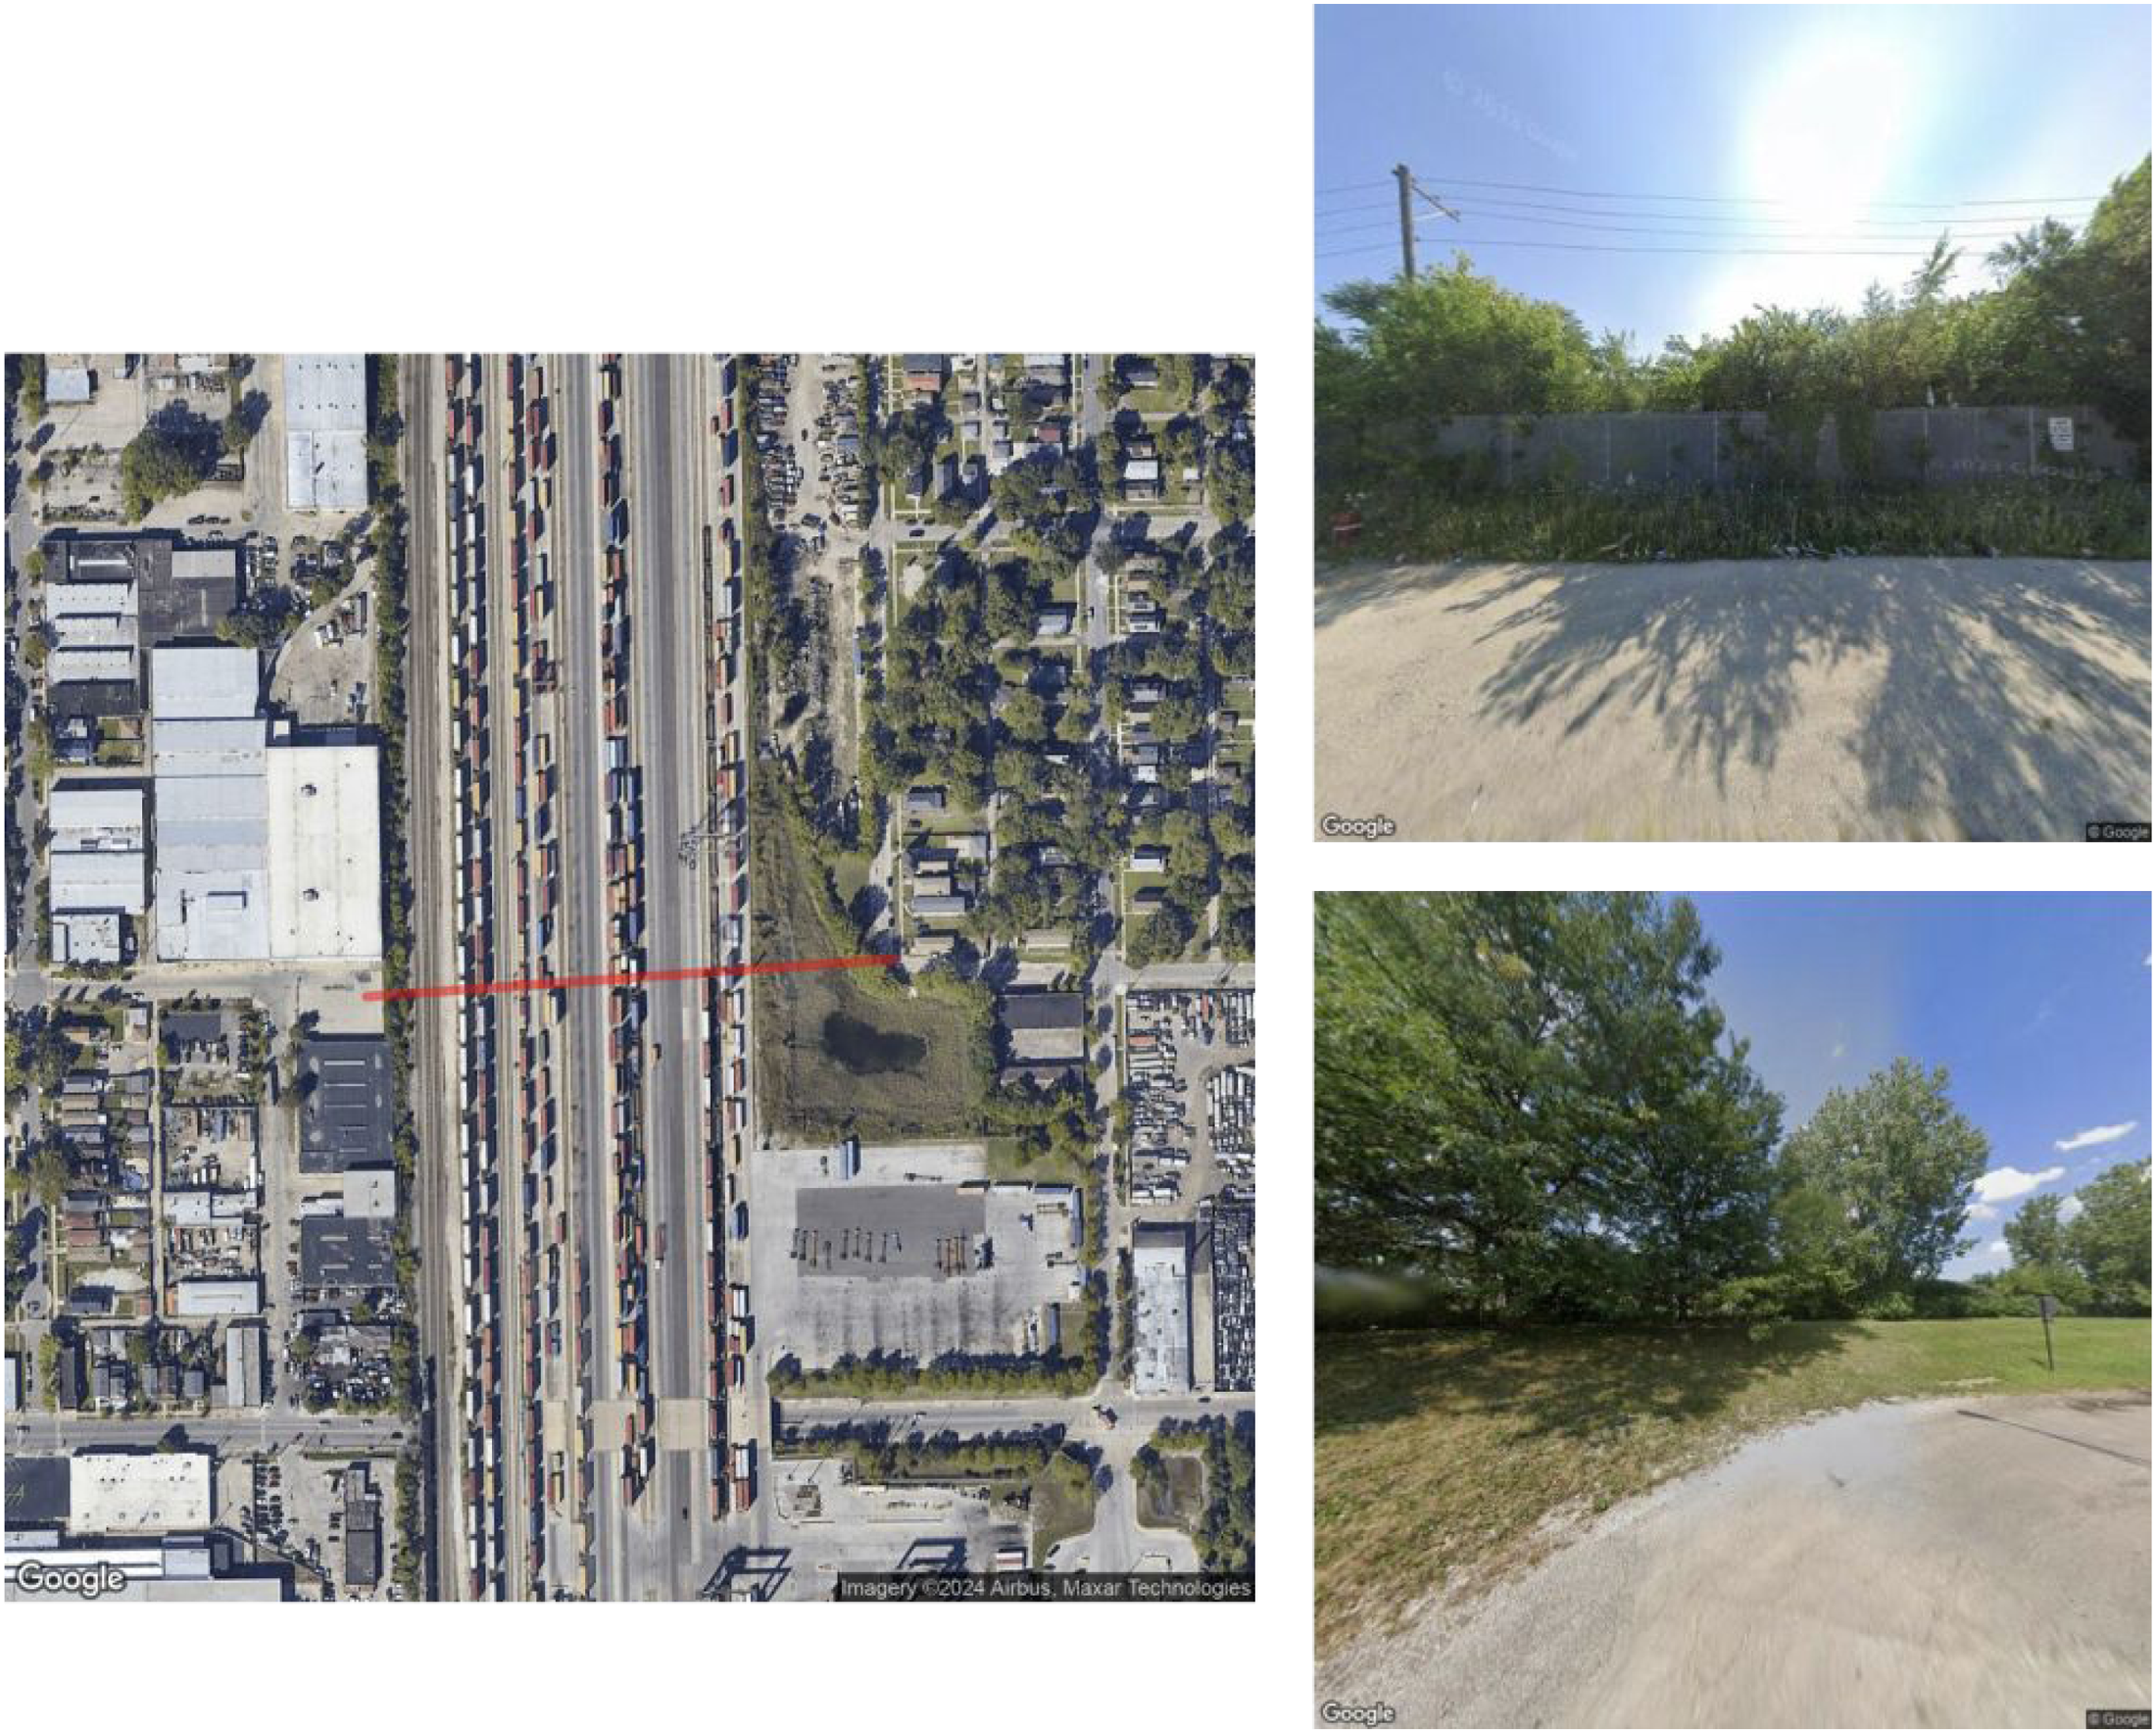
Example of satellite and streetscape images for a site in Chicago, IL.
Discovery
After curating a relevant image collection, social scientists should select a method for analyzing images and proceed to develop image labels and model prompts. This part of the computational image analysis framework focuses on operationalizing key concepts, which will require social scientists to “simplify the highly complex world that we live in to study one or two specific aspects of it” (Grimmer, Roberts and Stewart 2022: 16). With text analysis, researchers often operationalize concepts as specific words that capture specific topics or sentiments. With image analysis, researchers can operationalize concepts as specific objects, which may be present or absent, contain particular characteristics, vary in size or quantity, and/or appear with other objects. For example, Hwang and colleagues used the presence and amount of trash in neighborhoods to examine neighborhood conditions (Hwang and Naik 2023; Hwang et al. 2023), while Gebru et al. (2017) used the make, model, and year of cars to examine local voting behavior.
As we previously discussed, social scientists conducting computational image analysis projects currently have three main options for methods: (1) training a fully-supervised machine learning model, (2) fine-tuning a pre-trained CNN or other type of deep learning vision model, or (3) applying a generative MM. For social scientists interested in training a fully-supervised machine learning model or fine tuning a pre-trained deep learning vision model, there are several resources that provide excellent methodological guidance (e.g., Cantú 2019; Hwang et al. 2023; Schwemmer, Unger and Heiberger 2023; Torres and Cantú 2022; Webb Williams, Casas and Wilkerson 2020). For those interested in applying a generative MM, we outline two key sub-tasks—developing image labels and model prompts—and provide guidance for carrying out these sub-tasks.
The first sub-task is to create and test image labels with human coders and generative MMs. Social scientists should begin by developing a theory-driven list of labels that can be suitably applied to their image collection, drawing on labels used in previous research if available. Social scientists can then use generative MMs to identify additional labels. This inductive use of generative MMs may be particularly useful for computational image analysis projects focused on comprehensively identifying features related to an understudied topic. Social scientists should then review and select a final set of labels, which are tested by human coders and revised as needed.
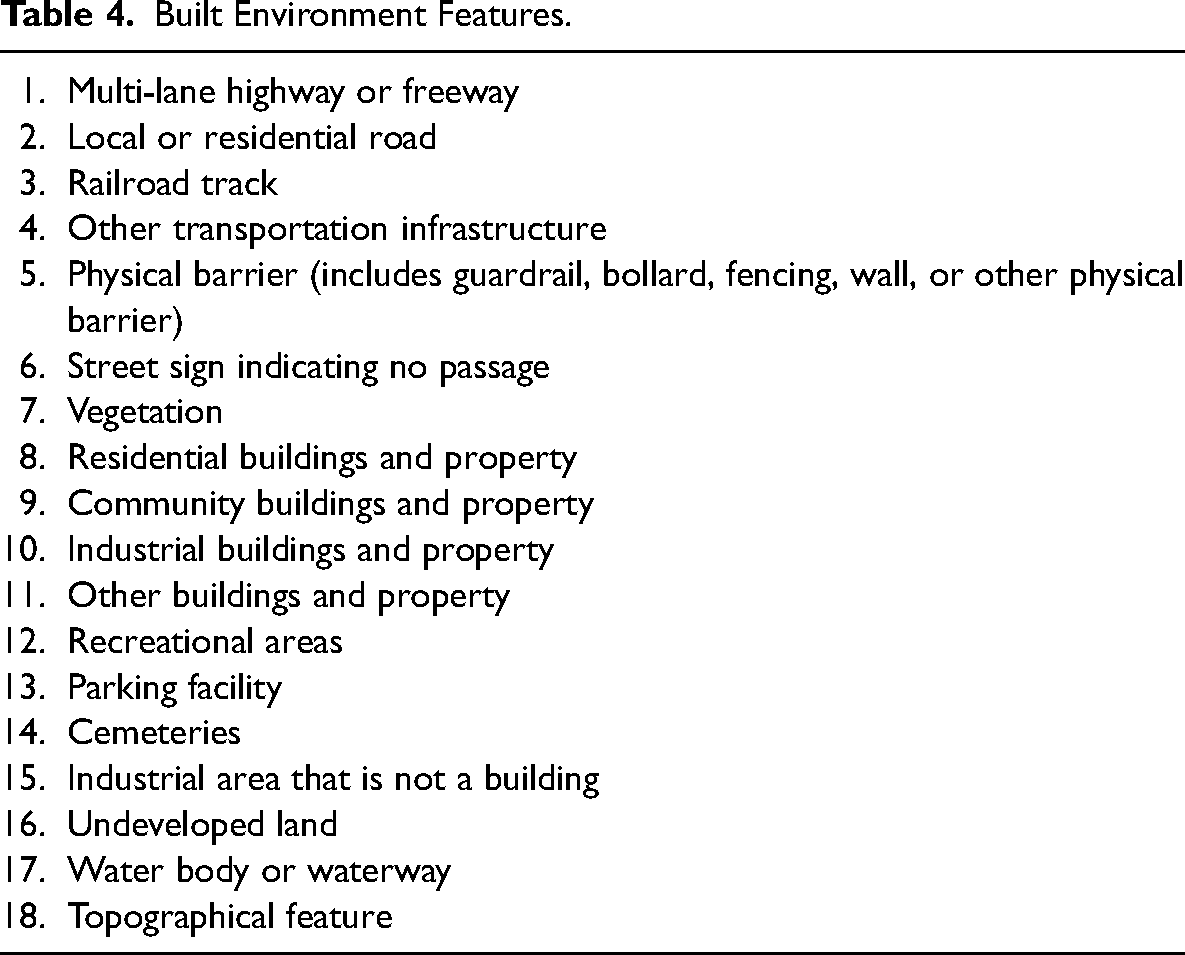
In our empirical application, we operationalized the built environment as a set of physical features. We identified 18 physical features (see Table 4) through a multi-step process that involved human coders and ChatGPT Plus. We first developed a preliminary list of 31 labels based on features identified in previous research as physical barriers in cities (e.g., multi-lane highway or freeway, railroad tracks) (Jackson 1985; Mohl 2008; Schindler 2015; Sugrue 2005) and features identified by one author's manual coding of a subset of satellite images from three cities. Then we compiled a preliminary list of labels generated by ChatGPT Plus 10 via an open-ended analysis of a subset of satellite images from three cities. We found that while there was considerable overlap between the manually generated labels and the ChatGPT Plus-generated labels, ChatGPT Plus generated some new labels for features we did not initially consider examining (e.g., parking facilities). 11 Note that we opted to use ChatGPT Plus to compile model-generated labels because there was limited information available about the GPT-4 series of multimodal models at the time of our analysis and we wanted to test image analysis capabilities with the chatbot first before purchasing access to the API. We would now encourage researchers to use API calls to test labels (if budgets and API rate limits allow) because they are easier to document and compare.
Built Environment Features.
We selected a set of labels from these two sets of preliminary labels and worked with five paid undergraduate, graduate, and postdoctoral researchers (hereafter “human coders”) to finalize this list of labels. Human coders were trained to use Dedoose (2024), which is a qualitative analysis software program that can be used to analyze images. To ensure consistency in coding, we first worked with the human coders to practice labeling a small number of satellite and streetscape images and then compared and discussed applied labels. After this practice, human coders proceeded to label all satellite and streetscape images in our reliability and validity test set (discussed in the next section). We revised the list of labels based on feedback from the human coders and re-coded images with updated labels as needed. The final list of labels from this manual labeling process serves as our list of labels for the study.
The second sub-task is to create and test model prompts. With generative LLMs, the natural language interface allows for “almost infinite variation in prompts,” with no clear way to determine a priori what the best prompt will be for a particular task and corpus (Than et al. 2025:4). As such, there is a rapidly growing body of research on prompt development for generative LLMs (e.g., Chae and Davidson 2024; Khattab et al. 2023; Sorensen et al. 2022; Than et al. 2025; White et al. 2023; Zhou et al. 2023; Ziems et al. 2024). Generative MMs also use natural language interfaces and therefore similarly offer a multitude of options for prompt design, but there is currently very limited guidance on how to develop effective prompts for generative MMs (for exception, see Wang et al. 2023).
To address this gap, we offer some general guidance about prompt development with generative MMs. Social scientists should begin by creating and testing prompts with different wording to ascertain their core prompt language—that is, the phrasing of their task that will generate optimal model output. Depending on the image collection and task, effective core prompt language may include some context about the images and tasks and/or a list of pre-defined labels. After social scientists have obtained their core prompt language, they should decide whether to use prompt parameters and capabilities, namely model personas and “few-shot” learning where examples of manually labeled images are provided to the model. Throughout this prompt development process, social scientists should document their tests so that they can report results to support learning and reproducibility.
For our empirical application, we began by testing different prompts with ChatGPT Plus that would allow us to computationally label satellite images of sites that we identified as being socially and spatially divided. That is, we first focused on identifying effective prompt language for the simplest version of our task (labeling a satellite image for each site) and then adapted and scaled the prompt language to carry out our full task (labeling one satellite image and two streetscape images for each site).
We performed some informal tests with satellite images of two different sites to first assess whether ChatGPT Plus can detect built environment features and visual markers in images. These tests were necessary because at the time of our analysis, ChatGPT Plus was newly released and there was limited information available about the image analysis capabilities of GPT-4 (the underlying model for ChatGPT Plus). Results from these tests indicated that ChatGPT Plus can recognize visual markers and does not need definitions of built environment features in order to detect them. 12
We then used a satellite image from one of the two sites to more systematically test six different prompts. The six prompts and their output are available in Appendix A in the online supplement. Through these tests, we learned that prompts perform better when they supply some context about image origins and they provide clear directions on what the model should and should not do. We ascertained the following prompt language:
This is a [image type] image from [city, state]. This image contains a [visual marker]. Identify built environment features that specifically overlap with the [visual marker] in this image. Do not include built environment features that do not overlap with the [visual marker].
Our core prompt language resulted in mostly satisfactory output, so we decided not to add a model persona to our prompt. Because the output was acceptable and because it was unclear at the time whether generative MMs were capable of image recall, we also decided to use the model in a “zero-shot” training format. However, we decided to include our list of labels (developed as part of the first sub-task) in our core prompt language in order to standardize output because we learned that ChatGPT Plus tends to use synonyms to describe the same type of feature (e.g., “residential buildings,” “residential houses,” “residential structures”). Appendix B in the online supplement provides examples of five satellite images and compares output that are generated for these images using prompts with and without pre-defined labels.
We then adapted the core prompt language to carry out our full task. Specifically, we added stepped instructions for analyzing three images for each site, in a manner mimicking how a human coder might approach this task. Our final prompt is provided below:
You will be provided with three images of the same location. The first image is a satellite image and the second and third images are street-level images. Follow these instructions in order: 1. For the satellite image, list one or more built environment features that specifically overlap with the red line in the center of the image only if the feature is in this list: [list of 18 pre-defined built environment feature labels] Do not list features that do not overlap with the red line. 2. For the street-level images, identify any features from the list that you did not identify in the satellite image, if there are any. Summarize unique features across the three images in one line of text with each feature separated by a comma. You do not need to provide summaries of each image. [set of images for a city, with one satellite image and two streetscape images for each site]
Again, we opted to use ChatGPT Plus to develop prompts because there was limited information available about GPT-4 at the time of our analysis, but we now recommend that researchers use API calls so that prompt development tests can be more readily documented and compared. To ascertain our core prompt language, we used two sites so that we could more easily compare ChatGPT Plus output from several different prompts, though we encourage researchers to use more development sites when working with API calls. These development sites were excluded from our reliability and validity test set, though we obtained nearly identical results when they were included (see Appendix E in the online supplement). We suspect that the results were almost exactly the same because our development image set and validity image set are very, very small compared to GPT-4o's training data, though additional research is needed to systematically examine whether separate subsets of images are needed for prompt development and validation when using generative MMs in a zero-shot format and to provide guidance on optimal development and validation data splits.
Measurement and Inference
Social scientists can then measure their concepts of interest once they are operationalized and use these measures to make inferences after they are validated. In the context of computational image analysis, this part of the framework focuses on prompting generative MMs to label a collection of images, validating model-generated image labels, and using validated labels to make inferences. For this article, we focus on providing general guidance for measurement tasks with generative MMs—that is, how to obtain and validate model-generated image labels. We leave for future research to consider how principles for making predictions and causal inferences with validated text labels (e.g., Grimmer, Stewart and Roberts 2022) can be adapted for image analysis, including how non-random error from generative multimodal models can be addressed to de-bias or minimize bias in downstream analyses, which we will return to later in our discussion about the limitations of GPT-4o for image analysis.
After developing image labels and model prompts, social scientists should use an appropriate generative MM to label their image collection. As more generative MMs become available, researchers may want to compare results using multiple models, particularly results from proprietary versus open-source models. Because generative AI models behave in non-deterministic ways, we strongly recommend that researchers conduct multiple model runs to ensure labeling consistency. Social scientists should then assess their model-generated labels for reliability and validity.
For our empirical application, we implemented our prompt using gpt-4o-2024-05-13, which was the latest version of GPT-4o at the time of our analysis. 13 We batched images of sites by city and implemented one API call per city, following previous research that finds that cities are visually distinct and city-specific analyses work best for deep learning vision analysis of streetscape images (Hwang and Naik 2023; Hwang et al. 2023). For all API calls, we set the temperature parameter to 0 to minimize output randomness and set a seed and recorded system fingerprints to support reproducibility of our work. Although it is currently unclear whether it is possible for generative AI models to produce completely deterministic output, we nonetheless recommend setting the temperature parameter to 0 to minimize output randomness as much as possible. We repeated each city-specific API call three times, resulting in three sets of model-generated image labels for each city. Our computing time and costs are available in Appendix C in the online supplement.
We obtained GPT-generated labels for all 367 sites (n = 1,101 satellite and streetscape images). To ensure consistency in model-generated labels, we measured the agreement between labels generated in three different model runs (or API calls). There was high agreement among pairwise model run comparisons for all sites, ranging from 94 percent to 98 percent (see Table 5). Pairwise agreement was similarly high for sites in the reliability and validity test set, ranging from 93 to 99 percent. Agreement measured using Cohen's κ and Krippendorff's α (Gamer et al. 2019; Hallgren 2012) was also high for all sites and the test set (see Table 5). 14 These results show that although GPT-4o does not behave in a completely deterministic manner, the model was able to generate highly consistent labels across multiple runs.
GPT Labeling Consistency.
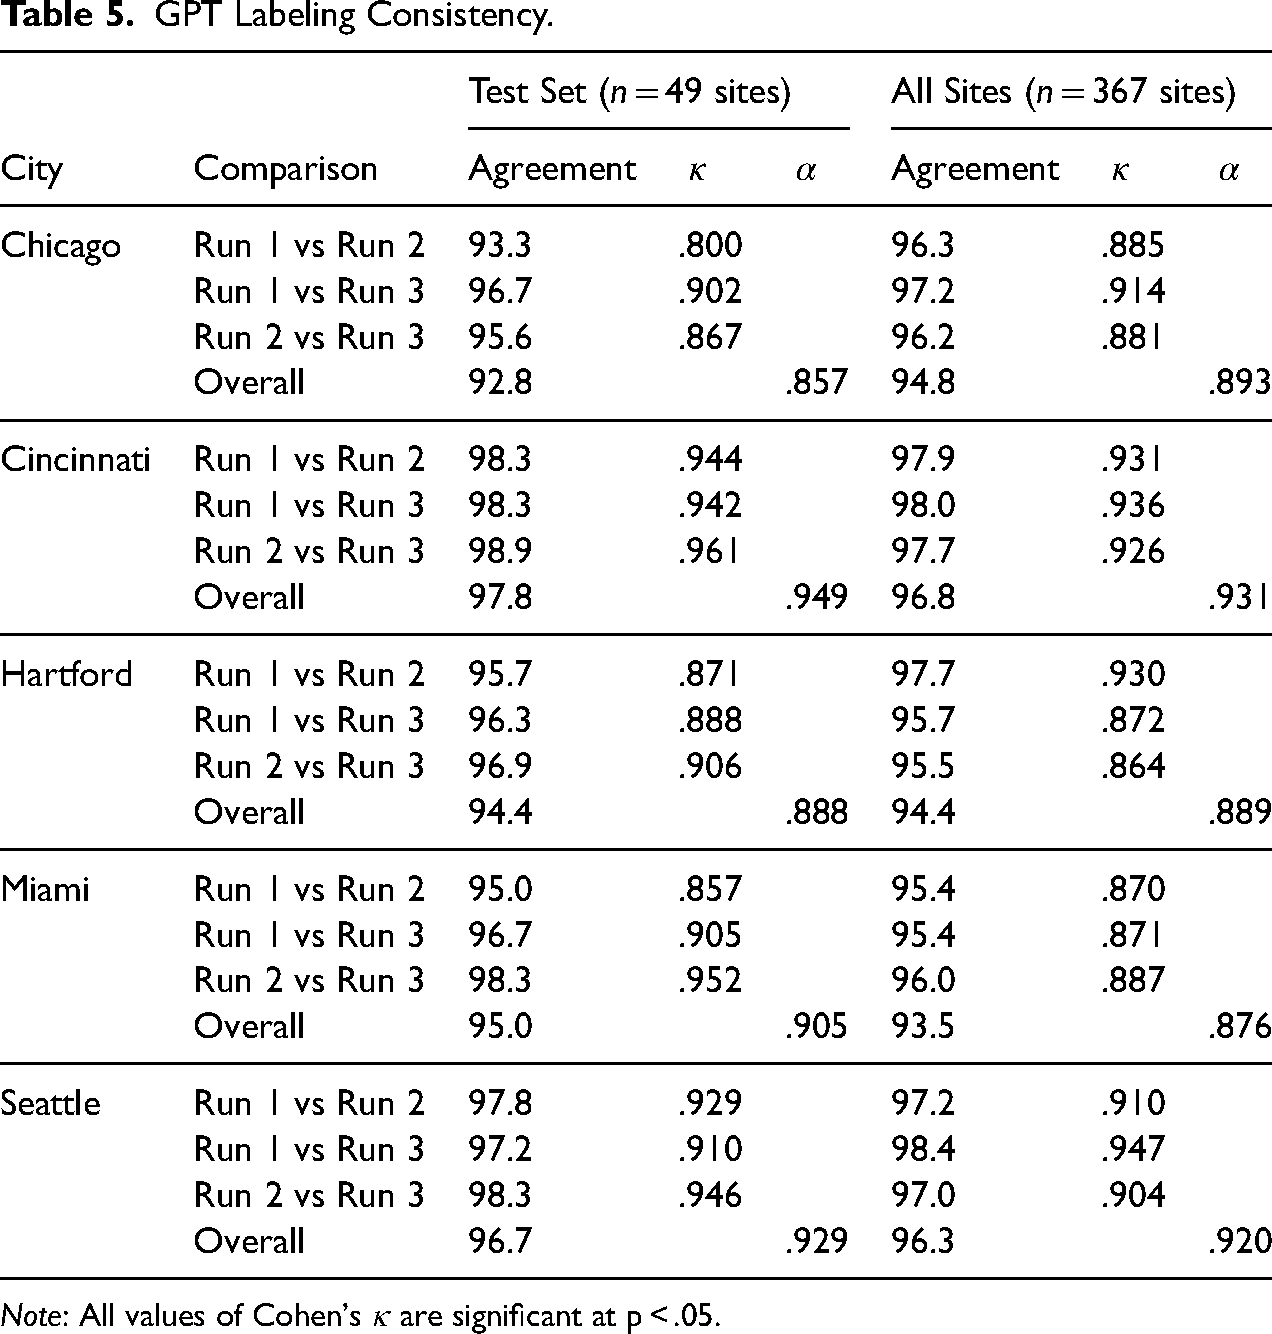
Note: All values of Cohen's κ are significant at p < .05.
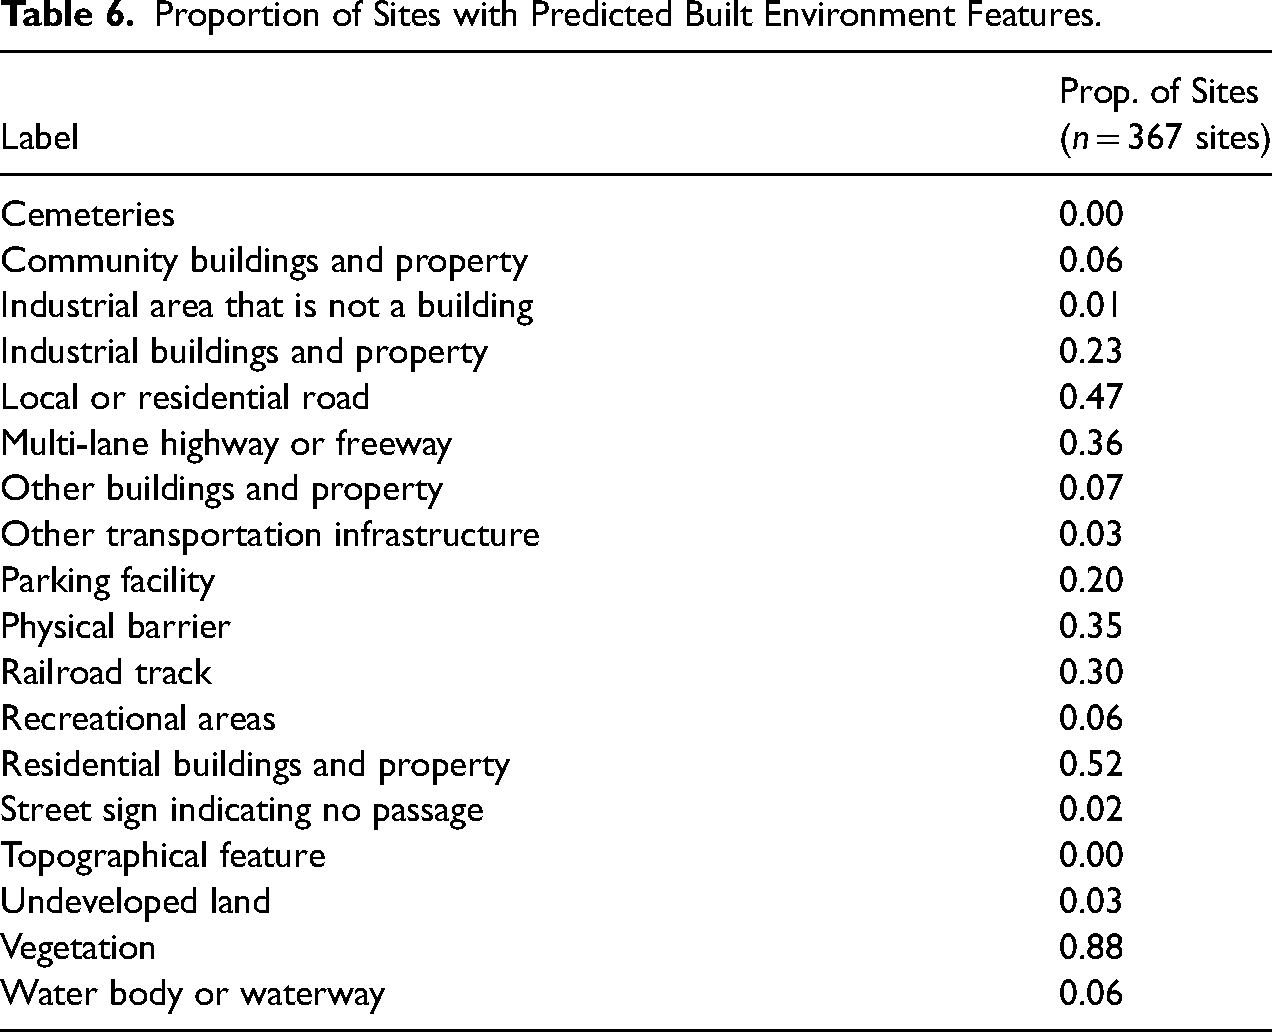
Table 6 shows the proportion of sites with predicted built environment features. Notably, some features that have been commonly studied in research on residential segregation (e.g., highways or freeways) are indeed present in our sites of social and spatial division, but they are not as prevalent as other features that are less well-known (e.g., local or residential roads, vegetation). In other words, our large-scale image analysis with GPT-4o highlighted built environment features that merit more attention among residential segregation researchers. We also conducted a separate analysis in which we prompted GPT-4o to label a small subset of satellite images without visual markers and then validated these labels, the results of which are available in Appendix D in the online supplement.
Proportion of Sites with Predicted Built Environment Features.
To assess GPT-generated labels, we selected a random subset of sites (49 sites total, nine for Hartford and 10 each for the other cities) 15 to serve as our reliability and validity test set (hereafter “test set”). All images from these sites were labeled by our team of human coders, with two coders assigned to each city so that all images for a city were labeled by the same set of coders to enable comparisons between coders. Figure 4 provides an example of an image labeled by human coders using Dedoose. In addition, one of the authors and a coder (who was not otherwise assigned to labeling tasks) labeled all images in the test set to provide a set of “expert labels.” The expert labels represent a close approximation of the ground truth of features that can be identified in the images.
Example of a manually labeled satellite image for a site in Miami, FL.
Reliability
To assess that our labels capture well-defined built environment features, we measured the agreement between human coders’ labels for each city. We first measured pairwise agreement as the percent of labels that match in presence (or absence) for each pair of coders. To account for the possibility of chance agreement, we also measured pairwise agreement using Cohen's κ (Gamer et al. 2019; Hallgren 2012). Cohen's κ is calculated as the ratio of what two coders agree on minus what we would expect them to agree on, and how much agreement is possible beyond chance: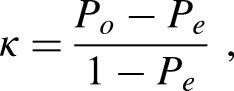
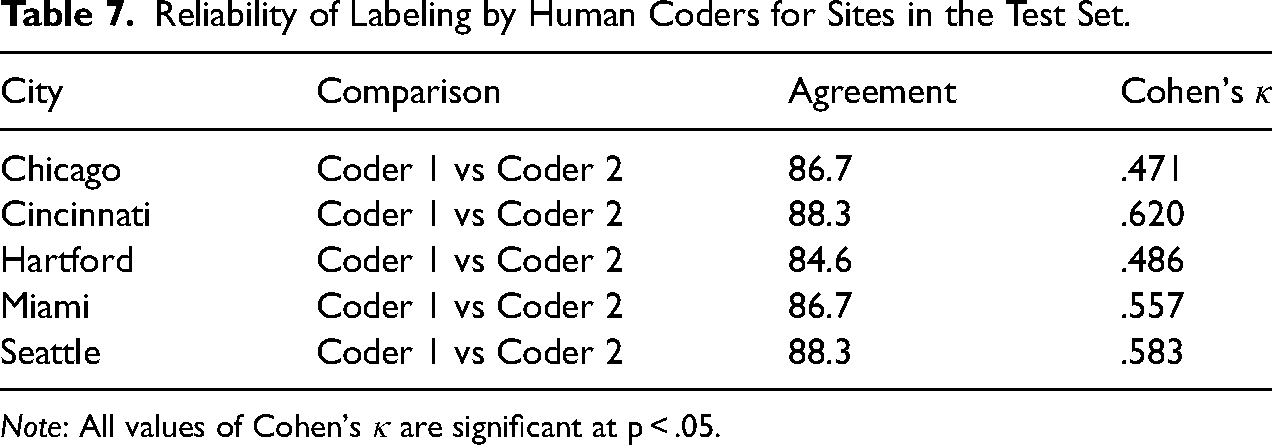
For sites in our test set, we found high agreement among pair comparisons for coders, ranging from 85 percent to 88 percent (see Table 7). Interrater reliability for pairs of coders was similarly high when measured using Cohen's κ, with values for coders ranging from .471 to .620, representing moderate to substantial agreement. These results show that our list of built environment feature labels is well-defined.
Reliability of Labeling by Human Coders for Sites in the Test Set.
Note: All values of Cohen's κ are significant at p < .05.
Validity
To assess the validity of our model-generated labels, we use labels that were generated by GPT in at least two out of three runs to serve as our model-generated labels and we use the expert-generated labels to serve as our gold-standard labels. Using GPT- and expert-generated labels for the 49 sites in our test set (n = 147 images), we calculated four metrics commonly used in computational analyses of text and images to measure validity: recall, precision, F1-score, and accuracy (see Grimmer, Stewart and Roberts 2022 for text analysis and Webb Williams, Casas and Wilkerson 2020 for image analysis). Accuracy is a global measure that summarizes the overall proportion of images or documents that are correctly labeled. Precision and recall are label-specific measures, where precision summarizes the proportion of images or documents that are correctly labeled among true and false positives and recall summarizes the proportion of images or documents that are correctly labeled among true positives and false negatives. F1-score is also a label-specific measure and captures the harmonic mean of precision and recall values, formally specified as
Overall, we obtained a high accuracy score (0.86). Our accuracy score is comparable to those obtained in previous studies that use computational methods to analyze streetscape imagery; for example, Hwang et al. (2023) obtained a cross-validated accuracy score of 87% when training a deep learning vision model to predict the presence of trash in Google Streetview images from three U.S. cities, while Naik et al. (2014) obtained an accuracy score of 78% when training a support vector model (SVM) to predict perceived safety in Google Streetview images in 21 U.S. cities. Although we are not able to provide a direct comparison of labeling accuracy for generative MMs and other computational methods for image analysis, our findings suggest that at least with streetscape images, researchers are likely to obtain the most accurate labels when using a fully trained or fine-tuned deep learning vision model, likely because these models are trained on diverse streetscape images and therefore possess robust knowledge about this specific type of image data. Yet, our findings also suggest that researchers may be able to obtain more accurate labels for streetscape images when using a generative MM in a zero-shot format compared to using a fully trained SVM, likely because SVMs have relatively less complex model architectures. In other words, researchers seeking to label streetscape images may be able obtain more accurate labels in a more efficient and cost-effective way by using generative MMs instead of traditional supervised ML models. Our finding is consistent with growing research in computer science showing that generative MMs can often match or exceed the performance of fully supervised models when for computer vision tasks (e.g., Buch et al. 2022).
However, accuracy is a very general measure of model performance and is less useful when evaluating the ability of models to classify imbalanced datasets. Table 8 shows the proportion of sites containing each built environment feature label based on our expert-generated labels. Table 8 shows that our test set is indeed imbalanced; four labels are present in at least 60% of sites (local or residential road, physical barrier, vegetation, other transportation infrastructure), nine labels are present in less than 20% of sites (community buildings and property, industrial areas, industrial buildings and property, multi-lane highway or freeway, topographic feature, waterbody or waterway, undeveloped land, recreational areas, street signs indicating no passage), and one label does not appear in any sites (cemeteries). Given our imbalanced test set, it is more useful to rely on our label-specific metrics, which do account for imbalances in data.
Proportion of Sites with Expert-Labeled Built Environment Features.
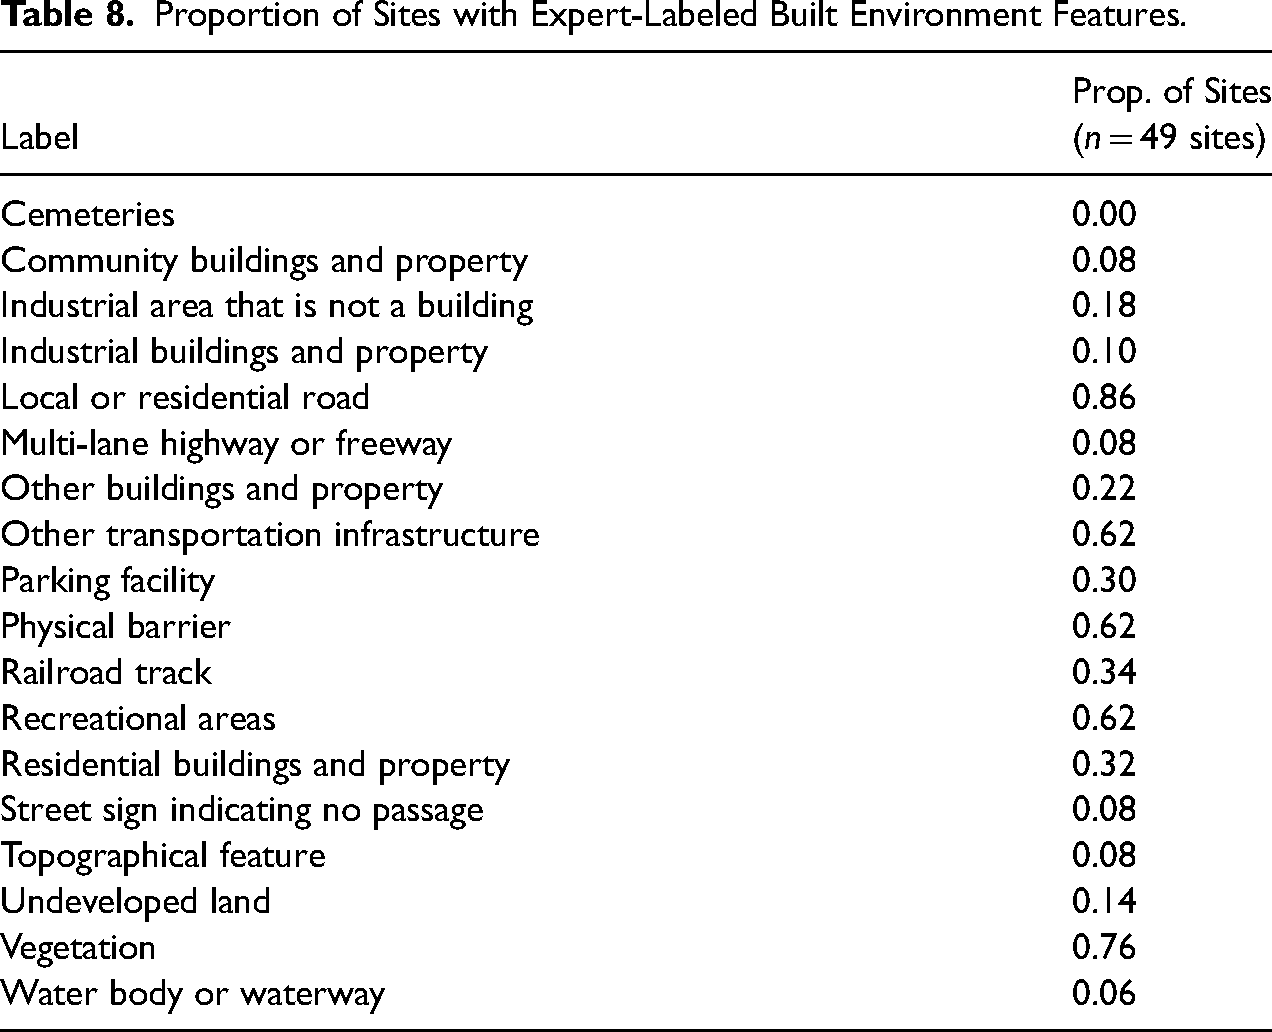
Table 9 presents precision, recall, and F1-scores for all labels. Average precision, recall, and F1-score for model-generated labels were 0.86, 0.60, and 0.66, respectively. Our precision and recall scores are generally comparable to those obtained in previous studies using deep learning vision models to analyze streetscape imagery, though our precision score is higher and our recall score is lower. Hwang et al. (2023) obtained average precision and recall scores of 74.3% and 87%, respectively, for a deep learning vision model trained for binary classification of Google Streetview images. Notably, whereas deep learning vision models used in previous studies performed better on recall compared to precision, GPT in our study performed better on precision compared to recall. This means that when GPT identified a built environment feature label, the labels tended to be correct, but GPT missed labels that were actually present in sites at a non-trivial rate.
Validity of GPT-Generated Labels Compared to Expert-Generated Labels.
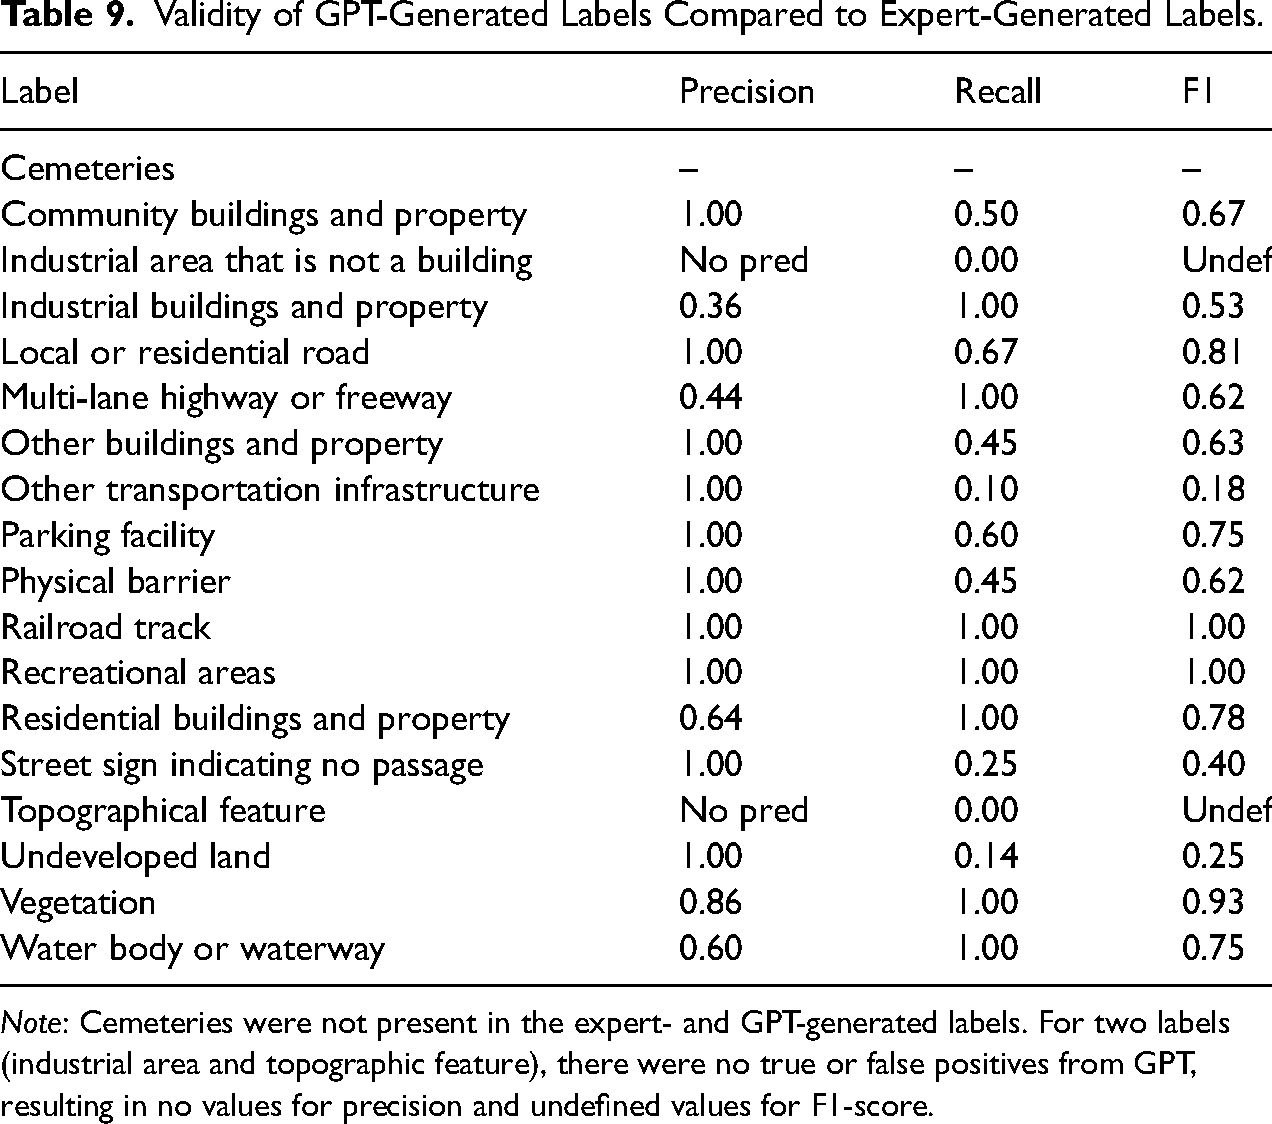
Note: Cemeteries were not present in the expert- and GPT-generated labels. For two labels (industrial area and topographic feature), there were no true or false positives from GPT, resulting in no values for precision and undefined values for F1-score.
For our purposes, the F1-score is the most relevant metric because we are interested in both avoiding false positives (GPT identifying a built environment feature that is not actually present in a site) and avoiding false negatives (GPT misses a built environment feature that is actually present in a site). The average F1-score is quite high (0.66) and the F1-scores for labels are generally high. F1-scores are 0.75 and higher for seven labels, some of which appear relatively rarely in the images (e.g., water body or waterway, multi-lane highway or freeway). The magnitude of these scores suggests that the training data for GPT-4o likely include satellite and streetscape images of cities. Three labels had exceedingly low F1-scores (other transportation infrastructure, undeveloped land, street sign indicating no passage), which we suspect is due to label ambiguity. Appendix F in the online supplement discusses potential reasons why these labels performed poorly compared to other labels.
Limitations of GPT-4o for Image Analysis
We encountered several limitations while using GPT-4o that we think are important to highlight. First, when identifying built environment features in satellite and streetscape images, GPT-4o simply lists features and cannot provide any information about the certainty of its labels. We suspect that this limitation would apply to other types of images as well as other generative MMs. This is a real disadvantage of using generative MMs to label images compared to using other computational methods that can provide probabilities of label certainty. We attempted to prompt GPT to provide estimates of label certainty, but this effort was unsuccessful. It is possible that generative MMs will be able to provide measures of label certainty in the future as models are trained to engage in more complex reasoning.
Second, GPT-4o cannot generate bounding boxes for predicted built environment features in satellite and streetscape images. Again, we suspect this limitation would apply to other types of images as well as other generative MMs. Bounding boxes for predicted labels, which other computational methods can provide, are useful in image analysis because they provide researchers with additional information for checking validity and refining labels. It seems entirely possible that generative MMs will be able to generate bounding boxes for analyzed images in the near future, given that there are already generative MMs that can output visual features (e.g., OpenAI DALL-E).
Third, at the time of our analysis, there was no fine-tuning capability available for GPT-4o. OpenAI has since added fine-tuning capability for GPT-4o, as of October 2024, though fine-tuning capability generally remains limited among leading generative MMs (see Table 2). The ability to fine-tune a generative MM is important for researchers, particularly those working with images that are unlikely to be included as part of a training dataset (e.g., non-digital images). Relatedly, it is currently difficult for researchers to determine whether they will need to fine-tune a generative MM until after they have conducted initial tests due to opacity about training datasets. Future research should examine how fine-tuning affects the performance of generative MMs in labeling different image datasets.
Fourth, our validity metrics show that while GPT-4o is quite accurate, the model exhibits non-random error. For example, GPT-4o was more successful at accurately detecting the presence (or absence) of specific built environment features, and this accuracy varied across cities. Although we did not explicitly test for this, it is also likely that GPT-4o's accuracy varied across neighborhoods within cities. This suggests that while GPT-4o may be trained to analyze satellite and streetscape imagery, it may be optimized to detect certain features (e.g., local or residential roads) over others (e.g., fences). There may also be variation in the extent of its training with images across a range of contexts and conditions, such as the extent of tree cover and roofing, amount of sunlight, and type of pavement, each of which may affect the visibility and the hue and brightness of images. Because of this non-random error, researchers who use image labels from GPT-4o and other generative MMs in downstream analyses will likely obtain biased results—even if the image labels are highly accurate.
For instance, a generative MM may be trained on image data for recreation fields that have well-maintained appearances—such as those with green grass, clearly marked boundary lines, and visible goals or equipment. If so, it may be better at recognizing recreation fields that conform to that standard and struggle to identify recreation fields that are less manicured: those with patchy grass or dirt, faded or missing boundary lines, or lacking visible equipment. This would introduce systematic bias, where recreational amenities in under-resourced neighborhoods may be undercounted or misclassified, not because they are absent, but because they do not match the aesthetic or structural conventions emphasized in the training data. A generative MM may recognize this space as undeveloped land rather than as a recreational area.
To make predictions and causal inferences with image labels from generative MMs, researchers must therefore address these models’ propensity for non-random error. This is particularly important because ignoring non-random prediction errors can lead to substantial bias, invalid confidence intervals, and inaccurate p-values when prediction errors are correlated with observed and unobserved variables in downstream analyses (Egami et al. 2024:2). A key challenge in assessing non-random error is that documentation for generative MMs, including open-source generative MMs, rarely includes information about training data. Fortunately, there are new methods for addressing this issue, such as Maranca et al.'s (2025) recent extension of design-based supervised learning (DSL) (Egami et al. 2024) to debias image labels for downstream analyses.
Lastly, although we did not encounter instances where GPT-4o applied racially and gender biased labels in our application, this is likely because of the specific type of images we analyzed (satellite and streetscape images) rather than evidence of the absence of model bias. Extensive research shows that computer vision techniques exhibit racial and gender biases (Buolamwini 2023; Buolamwini and Gebru 2018; Raji et al. 2020; Schwemmer et al. 2020), as do large language models (Bender et al. 2021). Future social science research that analyzes images with generative MMs should consistently and carefully document model biases and provide recommendations on how to address these biases.
Conclusion
The advent of generative AI models has introduced new possibilities and considerations for social science research, particularly for research involving text-based tasks. Until now, there has been limited work to systematically examine the potential utility of generative AI models, which are increasingly evolving to include multimodal functionality, for image-based tasks in social science research. In this article, we introduced a framework that provides guidance for computational analysis of images using generative MMs, which extends and adapts an existing framework for computational text analysis (Grimmer, Roberts and Stewart 2022). This framework consists of three core tasks: curation, discovery, and measurement and inference. We demonstrated this framework with an empirical application in which we use a newly developed generative MM, OpenAI's GPT-4o model, to analyze satellite and streetscape images to identify built environment features that contribute to contemporary residential segregation in U.S. cities.
Overall, we find that when it comes to analyzing satellite and streetscape images, GPT can generate labels that are reasonably valid compared to expert-generated labels. When provided with well-defined image labels (as measured by between-research assistant agreement), GPT is able to apply labels to images with high validity, with an accuracy score of 0.86 and average precision, recall, and F1 scores of 0.86, 0.60, and 0.66, respectively. Our accuracy, precision, and recall scores are comparable to those obtained in previous studies that use deep learning models and traditional machine learning models to classify streetscape imagery (Hwang et al. 2023; Naik et al. 2014). Although we are not able to make direct comparisons between labels generated by GPT and other computational image analysis methods, this is a promising finding regarding the ability of GPT to label satellite and streetscape imagery. In terms of specific labels, we find that GPT is able to accurately detect and classify many built environment features of interest to social scientists (e.g., residential buildings and property, local or residential roads), including features that are relatively rare, which suggests that satellite and streetscape imagery are likely included in GPT-4o's training data. Future research should examine why, as our analysis suggests, generative MMs appear to perform better in terms of precision instead of recall, compared to other computational methods for large-scale image analysis. Future research should also clarify aspects of image labels, as well as model prompts, that may not be ambiguous to humans but may be ambiguous to a generative MM, which is increasingly capable of understanding images and natural language but, as we observe, still faces limitations.
Our finding that GPT is not just capable of but is, in fact, quite adept at analyzing satellite and streetscape imagery in a zero-shot training format potentially suggests a new horizon for large-scale image analysis in social science research. Researchers have traditionally analyzed images with manual coding and, more recently, with fully supervised machine learning models and fine-tuned deep learning vision models—approaches that are time-consuming and resource-intensive and that often require substantial technical expertise. The results of our empirical application suggest that with generative MMs, researchers may be able to not only analyze more satellite and streetscape images, but also carry out this analysis with increased complexity, precision, and speed and decreased cost. This is a very promising, and perhaps even unprecedented, development for researchers who are interested in using satellite and streetscape imagery to shed light on topics that are central to the social sciences, such as neighborhood change and inequality, housing affordability and homelessness, and health disparities.
As generative MMs continue to evolve and improve, researchers will need to determine whether these models can be used for scientific purposes. In this article, we found that GPT can be used to systematically conduct large-scale analysis of satellite and streetscape imagery, but further work is needed to determine whether GPT and other generative MMs can analyze other types of images. Perhaps more important, we emphasize that researchers will also need to collaboratively determine when and how generative MMs should be used for image analysis. In particular, researchers should consider identifying use cases where image analysis with generative MMs may pose ethical challenges and develop and adopt practices to proactively address these challenges. For example, there is robust research in computer science cautioning against the use of computer vision to analyze images of humans due to well-documented racial and gender biases, as well as high risk of harmful real-world applications (e.g., Buolamwini 2023; Buolamwini and Gebru 2018; Raji et al. 2020). Another important consideration for researchers moving forward will be to determine whether there should be greater development of and investment in open-source generative MMs, given that currently, all leading generative MMs except for one (Llama 3.2) are proprietary and therefore not conducive to traditional quantitative social science paradigms regarding benchmarking and reproducibility (Bail 2024; Palmer, Smith and Spirling 2024; Spirling 2023; Than et al. 2025.; see also Law and McCall 2024). The rapid advancement of generative AI models—in terms of natural language processing ability and now computer vision ability—is indeed promising but will require researchers to organize apace to develop shared goals and practices to ensure that the future of large-scale image analysis is not only rigorous and reproducible but also ethical and sustainable.
Supplemental Material
sj-docx-1-smr-10.1177_00491241251339673 - Supplemental material for Generative Multimodal Models for Social Science: An Application with Satellite and Streetscape Imagery
Supplemental material, sj-docx-1-smr-10.1177_00491241251339673 for Generative Multimodal Models for Social Science: An Application with Satellite and Streetscape Imagery by Tina Law and Elizabeth Roberto in Sociological Methods & Research
Footnotes
Acknowledgements
We would like to thank Alyssa Boerst, Carolina Escobar, Brendan Frizzell, Jaleh Jalili, Caroline Wolski, and Belinda Zhu for their research assistance. We would also like to thank participants of the 2024 Generative Artificial Intelligence and Sociology Workshop at Yale University and the 2024 American Sociological Association Meeting and the anonymous reviewers for their feedback on earlier versions of this manuscript. In addition, this manuscript benefitted from helpful conversations with Nga Than, Joscha Legewie, and Taylor Brown. This research was supported in part by a Rice University BRIDGE Seed Grant.
Declaration of Conflicting Interests
The authors declared no potential conflicts of interest with respect to the research, authorship, and/or publication of this article.
Funding
The author(s) disclosed receipt of the following financial support for the research, authorship, and/or publication of this article: This research was supported in part by a Rice University BRIDGE Seed Grant.
Data Availability Statement
Sample coder and resources for implementing the methodological framework introduced in this article is available on Harvard Dataverse (![]() . We are unable to distribute the image data used in this article due to copyright, but these data are accessible to researchers through the Google Maps API and the Google Cloud Platform.
. We are unable to distribute the image data used in this article due to copyright, but these data are accessible to researchers through the Google Maps API and the Google Cloud Platform.
Supplemental Material
Supplemental material for this article is available online.
Notes
Author Biographies
References
Supplementary Material
Please find the following supplemental material available below.
For Open Access articles published under a Creative Commons License, all supplemental material carries the same license as the article it is associated with.
For non-Open Access articles published, all supplemental material carries a non-exclusive license, and permission requests for re-use of supplemental material or any part of supplemental material shall be sent directly to the copyright owner as specified in the copyright notice associated with the article.