
Abstract
Mixed-mode surveys are popular as they can save costs and maintain (or improve) response rates relative to single-mode surveys. Nevertheless, it is not yet clear how design decisions like survey mode or questionnaire length impact measurement quality. In this study, we compare measurement quality in an experiment of three distinct survey designs implemented in the German sample of the European Values Study: a single-mode face-to-face design, a mixed-mode mail/web design, and a shorter (matrix) questionnaire in the mixed-mode design. We compare measurement quality in different ways, including differences in distributions across several data quality indicators as well as equivalence testing over 140 items in 25 attitudinal scales. We find similar data quality across the survey designs, although the mixed-mode survey shows more item nonresponse compared to the single-mode survey. Using equivalence testing we find that most scales achieve metric equivalence and, to a lesser extent, scalar equivalence across the designs.
Introduction
Face-to-face and telephone surveys are currently being challenged by decreasing response rates (Beullens et al., 2018; Brick & Williams, 2013; de Leeuw et al., 2018) and a corresponding rise in costs due to intensified fieldwork efforts (Wolf et al., 2021). These forces have prompted many social surveys to consider moving away from traditional interviewer-administered single-mode designs to mixed-mode designs involving a combination of interviewer- and self-administered (e.g., web) modes, or solely self-administered using either paper-based mail or online modes. For example, longitudinal studies such as the Health and Retirement Study, the UK Household Longitudinal Study (Understanding Society), and the National Longitudinal Study of Adolescent to Adult Health (Add Health) have transitioned from fully face-to-face or telephone survey designs to mixed-mode designs involving online and/or mail-based data collection (Bianchi et al., 2017; Biemer et al., 2021; Cernat et al., 2016). Similarly, repeated cross-sectional and cross-national studies, such as the European Social Survey and the European Values Study (EVS) have recently experimented with online and mail-based data collection as an alternative to face-to-face data collection in some countries (Cernat & Revilla, 2020; Luijkx et al., 2020). Most recently, the COVID-19 pandemic has forced many surveys to switch from face-to-face data collection to telephone and self-administered modes (e.g., Gummer et al., 2020; Sakshaug et al., 2020).
Yet, while adopting mixed-mode designs with greater use of self-administration have been shown to be cost-effective (Bianchi et al., 2017; Kappelhof, 2015; Wagner et al., 2014), such a design change can have non-trivial effects on data quality. This is due to the fact that different interview modes have inherently different properties (e.g., level of interviewer presence and aural versus visual stimuli) that can influence respondents’ answers. These properties are particularly distinct between interviewer- and self-administered modes, and there is a broad literature showing that the same groups of respondents can provide different answers to the same items depending on which mode type is used (de Leeuw, 2005). The length of the questionnaire also has data quality implications, especially when a long questionnaire designed for interviewer-administration is applied via self-completion, which may lead to greater respondent burden and poorer data quality for questions positioned later in the questionnaire (Galesic & Bosnjak, 2009). Dropping questions or administering subsets of the questionnaire to different sets of respondents minimizes this risk (Raghunathan & Grizzle, 1995), but may result in a lack of measurement comparability with the full-length version. Thus, there is a need to understand the implications of these design decisions on data quality and data comparability.
Against this backdrop, it is important for practitioners to understand the measurement implications of changing from an interviewer-administered mode design with a long questionnaire to a self-administered mode design with a shorter questionnaire. In this article, we shed light on these issues by investigating differences in measurement quality in the German sample of the EVS. Sampled individuals of the general population were randomized to be interviewed using the traditional face-to-face mode design, a mixed-mode paper/web design, or a mixed-mode paper/web design with a shorter questionnaire implemented as part of a matrix sampling design. Using this experimental setup, it is possible to assess the extent to which measurement quality differs between the mode designs and questionnaire lengths. These comparisons will reveal potential tradeoffs of shifting to a self-administered mode design either as a supplement or as a replacement for traditional face-to-face data collection. The following research questions (RQ) are addressed:
RQ1. What is the impact of mode design and questionnaire length on point estimates and distributions of survey items? RQ2. To what extent does mode design and questionnaire length affect data quality indicators (e.g., item nonresponse, response style indicators)? RQ3. Does measurement equivalence hold for attitudinal scales measured under different mode designs and questionnaire lengths?
Previous Research
The choice of data collection mode(s) is a crucial decision for any survey as it affects how respondents receive and answer questions. Different modes have inherently distinct features that affect the presentation of the questions and influences the answers that respondents provide. Consequently, different modes can elicit different answers to the same questions posed to the same respondents (de Leeuw, 2005). These “measurement mode effects” can arise when some respondents are interviewed in one mode, while other respondents are interviewed in an alternative mode. Measurement mode effects are problematic as they can bias comparisons between respondents who are interviewed in different modes. Such effects can occur when comparing respondents in a mixed-mode survey or in cross-national settings where different countries administer the same questionnaire in different modes. Measurement mode effects tend to be more severe when mixing interviewer-administered (e.g., face-to-face and telephone) and self-administered (e.g., mail and web) modes, rather than mixing within them (Cernat et al., 2016; Klausch et al., 2013). These two mode types differ with respect to two key features which have been attributed to their potential for measurement mode effects: the communication channel (aural or visual) and the presence/absence of an interviewer. Below we describe each feature and its potential impact on measurement mode effects in turn.
The communication channel refers to whether the survey questions are presented visually or orally to respondents. Face-to-face and telephone are primarily aural modes as interviewers read the questions out loud and respondents process the information aurally. In contrast, mail and web are primarily visual modes as respondents read the questions and process the information using visual cues. There are some exceptions. For instance, face-to-face interviews are known to use showcards to supplement the oral presentation (Lynn et al., 2012) and web surveys may use audio components to supplement the visual presentation. Both communication channels are suggested to affect the cognitive process and memory capacity in different ways (Krosnick & Alwin, 1987; Schwarz et al., 1991). Because of this, different communication channels can lead to different response behaviors. For example, aural modes are often associated with recency effects, defined as the tendency to select the last spoken answer categories, which are most easily remembered compared to the earlier spoken answer categories (Smyth et al., 1987). Visual modes are usually associated with primacy effects, or the tendency to endorse the first answer categories, which is in line with the notion that respondents select the first acceptable answer category they see Krosnick & Alwin (1987). Though the empirical evidence on primacy and recency effects in different modes is inconsistent (de Leeuw, 2005). Other response behaviors, including the level of nondifferentiation (or straightlining) to attitudinal item batteries and the frequency of selecting extreme answers to rating scales, have also been shown to vary between self- and interviewer-administered modes more so than within them (Dillman et al., 2009; Kim et al., 2019).
Regarding the presence/absence of an interviewer, this mode feature can have a strong influence on the answers that respondents provide. Interviewers are a well-known source of variance inflation (or “interviewer effects”) in survey estimates (West & Blom, 2017), but they also have an important effect on social desirability bias. A consistent research finding is that interviewer-administered modes produce higher levels of socially desirable responding compared to self-administered modes (Cernat et al., 2016; Heerwegh, 2009; Kreuter et al., 2008; Tourangeau & Yan, 2007). However, interviewer presence may reduce the frequency of other suboptimal response behaviors, such as nondifferentiation and item nonresponse (Hope et al., 2014), by keeping respondents motivated and focused on the response task, which is more difficult to do in self-completion modes.
With respect to measurement mode effects in attitudinal items and Likert scales, Klausch et al. (2013) report higher category thresholds for attitudes about police and traffic in the Netherlands in face-to-face and telephone modes compared to mail and web modes, an indication of stronger socially desirable responding in the former modes. Heerwegh & Loosveldt (2011) report evidence of socially desirable responding among telephone responses in a crime victimization survey in Belgium, reflected in more favorable attitudes toward the police, compared to mail responses. Cernat et al. (2016) identified higher levels of depression reported online compared to telephone and face-to-face in the US Health and Retirement Study. Cernat & Revilla (2020) investigated differences in measurement quality between the face-to-face ESS round 8 and the CROss-National Online Survey (CRONOS) panel. They find higher item nonresponse and higher levels of primacy effects in the CRONOS panel, but similar levels of nondifferentiation with the ESS. Using equivalence testing they find that metric and scalar equivalence holds for four out of the five scales tested.
In addition to measurement mode effects, the length of the questionnaire can also have data quality implications when transitioning from interviewer-administration to self-completion. While it is common to use interviewer modes to administer long questionnaires to respondents, administering long questionnaires via self-completion is likely to require greater effort from the respondent. In the case of web surveys, researchers have suggested the ideal length should not exceed 20 min (Callegaro et al., 2015; Revilla & Ochoa, 2017). Extending the questionnaire beyond this length bears the risk that respondents will engage in undesirable response behaviors toward the end of the interview as fatigue accumulates and they lose focus and motivation to invest the necessary effort to provide high-quality answers. Galesic & Bosnjak (2009) found that items positioned later in the questionnaire of a web survey were answered more quickly, with shorter answers given to open-ended questions, less variability in answers given to grid questions, and slightly more item nonresponse, compared to the same items positioned earlier in the questionnaire. Peytchev & Peytcheva (2017) also found strong evidence of greater measurement error when items on diet and exercise appeared later in a web survey instrument. Similar findings have been reported in self-administered paper questionnaires (Herzog & Bachman, 1981; Sahlqvist et al., 2011).
One strategy to minimize respondent burden is to shorten the questionnaire by dropping items. However, this strategy may be undesirable from a research perspective or impossible for a country that is participating in a cross-national survey with a fixed questionnaire. An alternative strategy is to implement a split or matrix questionnaire design by partitioning the questionnaire into shorter modules and administering subsets of the modules to different respondents (Raghunathan & Grizzle, 1995). The items that are not answered by all respondents are then imputed to compensate for the data which are missing by design and produce a full rectangular dataset available for multivariate analyses – which is, however, difficult to achieve in general population survey datasets that include hundreds of variables. In an experimental evaluation of the matrix questionnaire design on measurement error reduction, Peytchev & Peytcheva (2017) found that the matrix design performed better than the full questionnaire design on several metrics (e.g., estimates of means, mean squared error, associations) that are susceptible to measurement error. Yet, additional research is needed to understand the effects of using a matrix questionnaire design on measurement quality in multi-item scales, where the measurement properties (e.g., context effects) can vary due to the different questionnaire structures.
In this study, we evaluate the measurement mode effects of shifting from an interviewer-administered (face-to-face) survey to a fully self-administered mixed-mode (web/mail) survey and from a long questionnaire to a matrix questionnaire design by comparing the quality of respondent answers in the German sample of the EVS. Motivated by the above literature, we investigate whether the shift in mode design and questionnaire length affects estimates of means, distributional properties, and indicators of data quality (e.g., item nonresponse, primacy, recency, middle answers, extreme response style, and straightlining) for 140 items and 25 scales measured in the general population. Additionally, we apply confirmatory factor analysis to test the assumption of measurement equivalence for the multi-item scales across the different mode designs and questionnaire lengths.
Data and Experiment
The EVS is a cross-national repeated cross-sectional survey research program examining public opinion on topics like the environment, national identity, perception of life, politics and society, religion and morale, and work. The EVS was first conducted in 1981 with subsequent cross-sectional surveys being fielded every nine years. In the most recent data collection, the EVS allowed participating countries to test the use of self-administered data collection modes; for more details, see Luijkx et al. (2020). In this study, we use the EVS data collected in Germany (EVS, 2017a, 2017b).
Data Collection Experiment in the EVS Germany
The EVS 2017/2018 in Germany featured an interviewer-administered face-to-face (computer-assisted personal interviewing; CAPI) survey and two additional self-administered mixed-mode (web and mail) surveys (Wolf et al., 2021). A probabilistic sample of people residing in Germany aged 18 or older at the time of fieldwork was drawn from population registers. For this purpose, a two-stage sampling design was used. In the first step, municipalities were selected, and primary sampling units were generated. In the second step, addresses for randomly selected persons within the primary sampling units were drawn from population registers. Each sampled unit had the same inclusion probability (i.e., the sample was self-weighting). To allow for an experimental comparison of the data collection modes, postal addresses from the drawn sample were randomly split into three experimental groups (the group sample sizes varied due to project requirements).
The first experimental group (drawn sample size = 5,338) consisted of the traditional face-to-face survey using the full EVS-questionnaire with an average length of 59 min necessary for completion. The fieldwork of the face-to-face survey was organized in two phases, to which the drawn sample was randomly allocated before the beginning of the fieldwork (phase one: N = 3,762 eligible addresses, phase two: N = 1,576 eligible addresses). In the first phase, a 10€ postpaid incentive was announced in the initial cover letter (N = 814 realized interviews). For the second phase (starting in January 2018), a 5€ prepaid incentive was used to increase survey participation in this group (N = 570 realized interviews). After an evaluation of the first phase, it was decided to offer a 20€ postpaid incentive to the remaining nonrespondents (N = 110 realized interviews).
The second group (drawn sample size = 1,913) consisted of a mixed-mode (web/mail) survey using the same full-length EVS questionnaire which – compared to the face-to-survey – yielded a comparable, but slightly shorter, average interview duration of 55 min (for the web interview). The third group (drawn sample size = 8,973) consisted of an additional mixed-mode (web/mail) survey using a matrix questionnaire design, implemented to reduce the overall response burden (Peytchev & Peytcheva, 2017; Raghunathan & Grizzle, 1995). The use of this matrix design reduced the average questionnaire length for the self-administered mixed-mode survey to 38 min (for the web interview).
The fieldwork of the face-to-face survey took place between October 2017 and April 2018. Participation in the face-to-face survey was comparatively low with an AAPOR response rate of 6 (The American Association for Public Opinion Research, 2016) of 28%, even though respondents were offered monetary incentives. The fieldwork of the mixed-mode matrix survey was conducted between November 2017 and March 2018 and was implemented in a responsive design with two phases (Gummer et al., 2021; Wolf et al., 2021). Here, the drawn sample was randomly allocated to the two phases. In a first phase, different incentive strategies (5€ prepaid and 10€ postpaid) and mode choice sequences (simultaneous and sequential) were experimentally implemented. Based on an evaluation of the phase one results, in January 2018 the second phase of the matrix survey started for which respondents were provided with a 5€ prepaid incentive in a concurrent mode choice sequence (i.e., offering both the mail questionnaire and the web questionnaire right from the beginning). The response rate of the matrix survey was 36.1%. On average, 73% of the respondents participated via mail mode (27% via web).
Encouraged by this outcome, it was decided to also field the full-length EVS-questionnaire (i.e., the second experimental group) in a self-administered mixed-mode survey with a 5€ prepaid incentive and concurrent mode choice sequence. The fieldwork period for the full mixed-mode survey was between September and November 2018 and resulted in a response rate of 35.3%. In this survey, 83% of the respondents participated via mail mode (17% via web).
Questionnaire Design
When designing the questionnaires for the data collection experiment, the general aim has been to make the questionnaires as comparable as possible while making the necessary mode-specific adaptions. 1 While the formulations of the questions and answer scales remained largely unchanged, question/interviewer instructions were sometimes reformulated to fit the self-administered context. As the EVS lacks complex filtering, question order was the same across designs. Yet, there are also several inherent differences in the modes such as “don’t know”-options or using grid questions (de Leeuw et al., 2018, pp. 82–83). The EVS experiment optimized the usability of the survey for each mode, so question batteries were presented/read out item-by-item in the face-to-face mode and for mobile devices, while grids were used in the mail mode and on large screens in the web mode.
The second major difference relates to the usage of “don’t know” answer categories. Following the best practice (in Germany), “don’t know” options were not mentioned by the interviewers and were not included in the show cards. Yet, “don’t know” was still introduced as a response alternative for the interviewers if respondents mentioned this option spontaneously. For the web and mail modes, explicit “don’t know” options were provided for most questions.
Attitudinal Scales
We analyzed 140 questions from 21 item batteries with three or more questions, covering all major topics of the EVS. Out of these 21 item batteries, we identified 25 scales through confirmatory factor analysis (see the section on equivalence testing), which we analyze throughout this study. We define a scale here as a group of items that measure the same latent concept. A short description of the scales and the years when they were introduced in the EVS is provided in Table 1. A longer description of the scales, including number of items, scale points, and the use of showcards are given in Table A1 of the online Appendix.
Description of Scales Used in the Analysis.
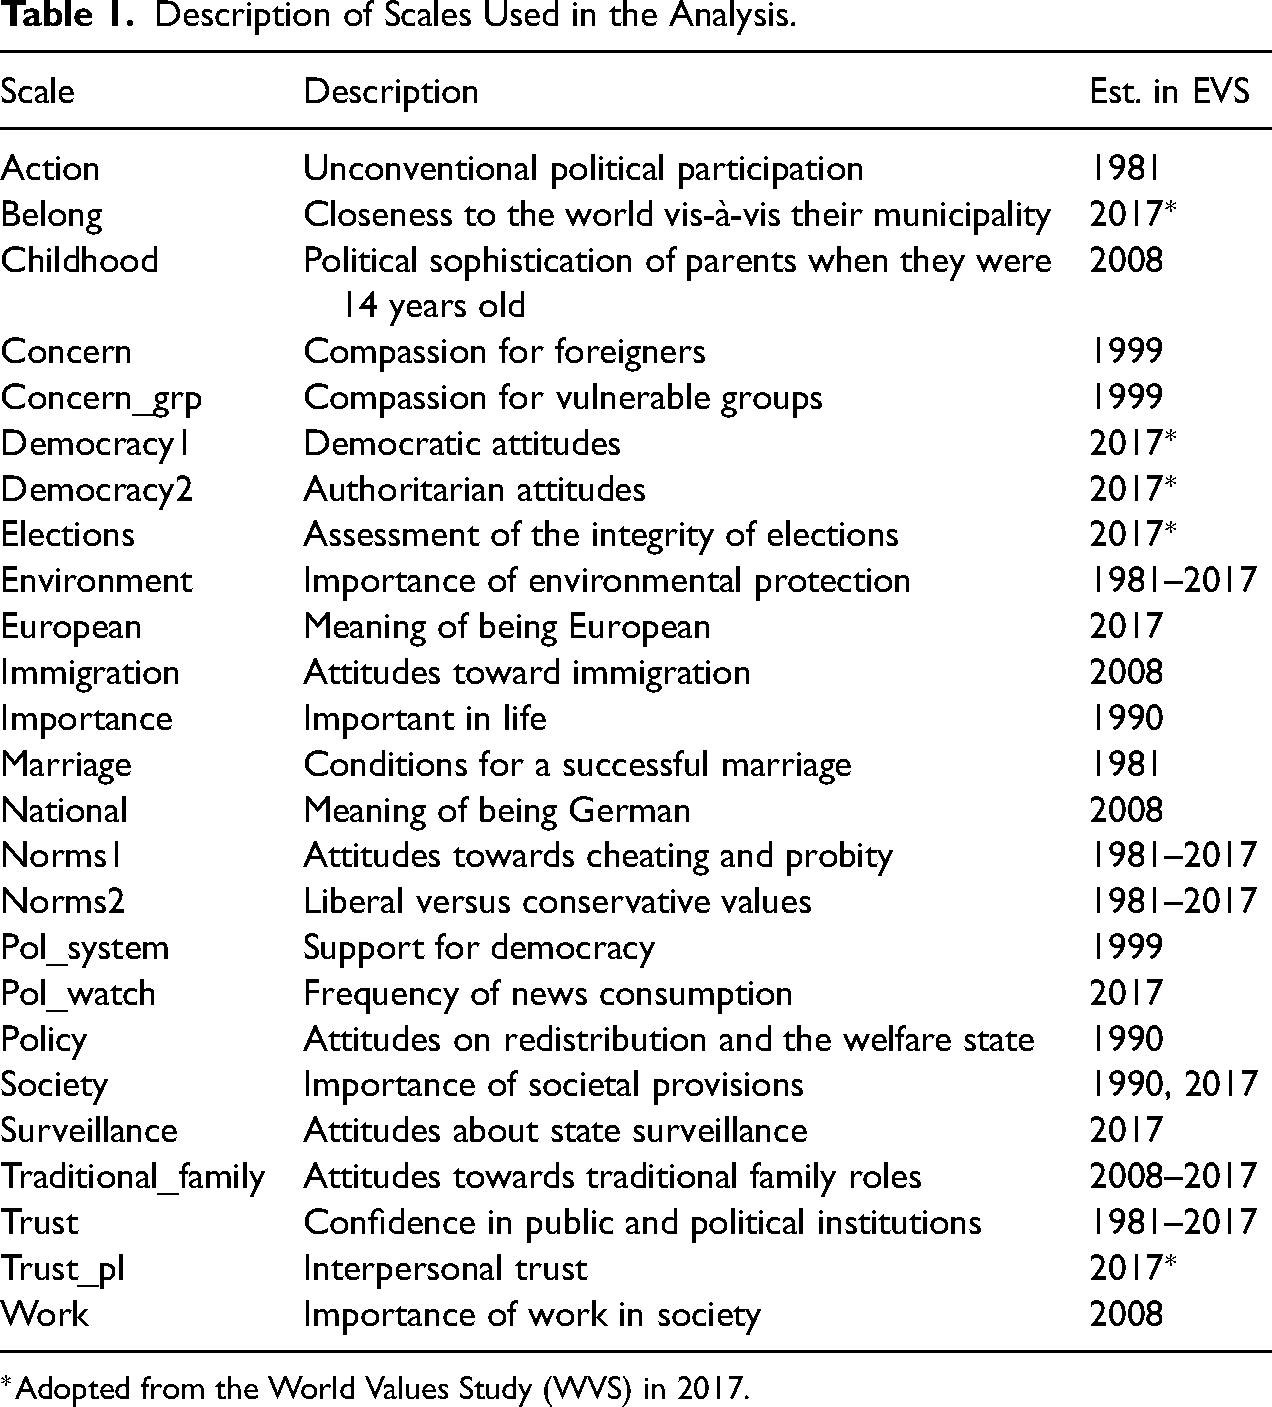
*Adopted from the World Values Study (WVS) in 2017.
Weighting for Selection
We use weights to account for possible differences between the face-to-face, mixed-mode full-length, and mixed-mode matrix samples due to selection. Iterative proportional fitting (Deming & Stephan, 1940) was used to adjust the distribution of the sample to the target population's distributions with respect to sex, age, education, household size, citizenship, and religion. Reference distributions for the target population were provided by the German Federal Statistical Office.
Methods
Data Quality Indicators
We computed several indicators to assess data quality in each sample – both at the item level and at the scale level. These indicators capture response behaviors that could be the result of not completing every step of the cognitive response process (Tourangeau et al., 2000) or due to respondents attempting to reduce their perceived response burden (Krosnick, 1991, 1999).
To measure item nonresponse, we calculated “don’t know” and “no answer” as the proportion of all eligible items for which respondents have chosen one of these residual categories. To measure response style, we estimated indicators for extreme response style, primacy, recency, mid-point response style, and straightlining. Primacy refers to the tendency to endorse the first answer categories, while recency is defined as the tendency to select the last spoken/shown answer categories. We define an extreme response style as the tendency to use the highest or lowest categories of a response scale – regardless of the content of the question (Van Vaerenbergh & Thomas, 2013), while a mid-point response style is defined as the tendency to select a middle alternative (Narayan & Krosnick, 1996). Straightlining refers to minimal differentiation between responses within item batteries (Roßmann et al., 2018). We employed a simple non-differentiation measure (Kim et al., 2019), which reflects the proportion of questions where only a single response category was chosen for all respective items, ranging from zero to one. Not every response style indicator could be estimated for each scale depending on the number of scale points (3, 4, 5, 10, 11; see Table A2 in the online Appendix).
Turning to the outcomes of the three data collection modes, we start our investigation by comparing the distribution of the question and the scales across experimental groups. For the calculation of the scales, we estimated average indices. For comparability, we rescaled all questions and scales to a range from 0 to 1. For the analysis, we compare mean values and standard deviations. We performed unpaired t-tests and applied Bonferroni corrections to counteract the problem of the large number of comparisons. If a difference reaches the p < 0.05 level we plot this as an additional information alongside the comparisons of means. In a similar manner, we performed variance-ratio tests for the quality of variances, also applying Bonferroni corrections. To gauge the effect size of mean differences we calculated Cohen's D for each question and scale and plotted the results in histograms.
Equivalence Testing
In addition to comparing data quality using the indicators mentioned above we also use equivalence testing to identify potential measurement differences across mode designs and questionnaire lengths. Measurement equivalence is useful for two main reasons: first, it can tell us whether we can validly compare results collected in different groups. This is especially useful when a traditional face-to-face survey is switching to a new design and comparisons over time are important. It is also useful when data are collected from different groups using different designs and comparisons or combinations of these data are needed (such as in cross-cultural research). Second, it can indicate differences in data quality and potential causes for these differences.
In order to carry out the equivalence testing we identified items that are part of rating scales with at least three items and that have ordinal response categories. We initially identified 144 items covering 14 topics. We then ran a series of confirmatory factor analysis (CFA) on groups of items that measure the same concept in order to evaluate their overall fit and ensure they can be used for further testing. In total eight items were excluded at this stage either because they had small loadings or correlations with the other items in the scale (belong/national identify: v168; parents: v270, v274; concern_grp: v219; national: v190; importance: v1, v5, v6). Thus, in the final CFA models, we were left with 132 items divided into 25 scales. The full list of items and the scales they belong to are presented in Table A1 of the online Appendix, while the scales and their overall model fits can be seen in Table 2.
Fit Statistics for the Scales Analyzed Based on a Simple Confirmatory Factor Analysis Using the Entire Sample.
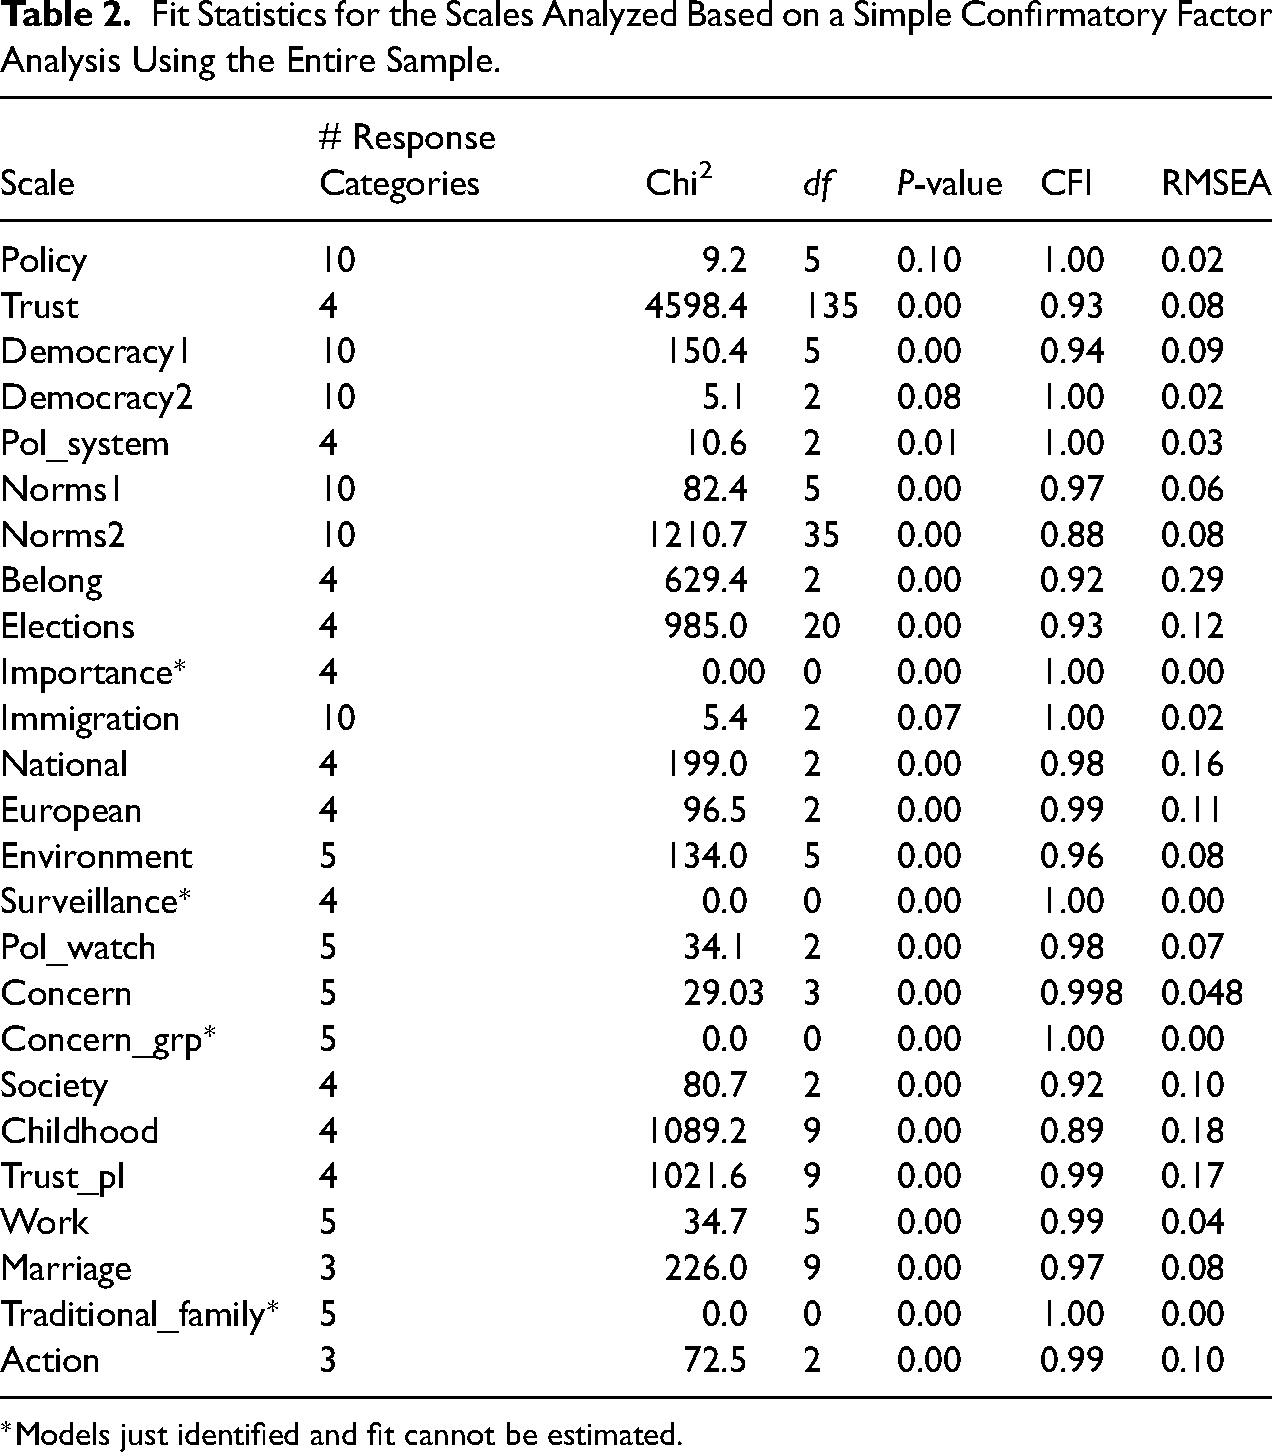
*Models just identified and fit cannot be estimated.
In order to test whether the measurement of these concepts is equivalent across groups (single-mode vs. mixed-mode and mixed-mode long vs. mixed-mode matrix), we compare a series of three multi-group CFA models with increasing restrictions (Baumgartner & Steenkamp, 2006; Davidov et al., 2014):
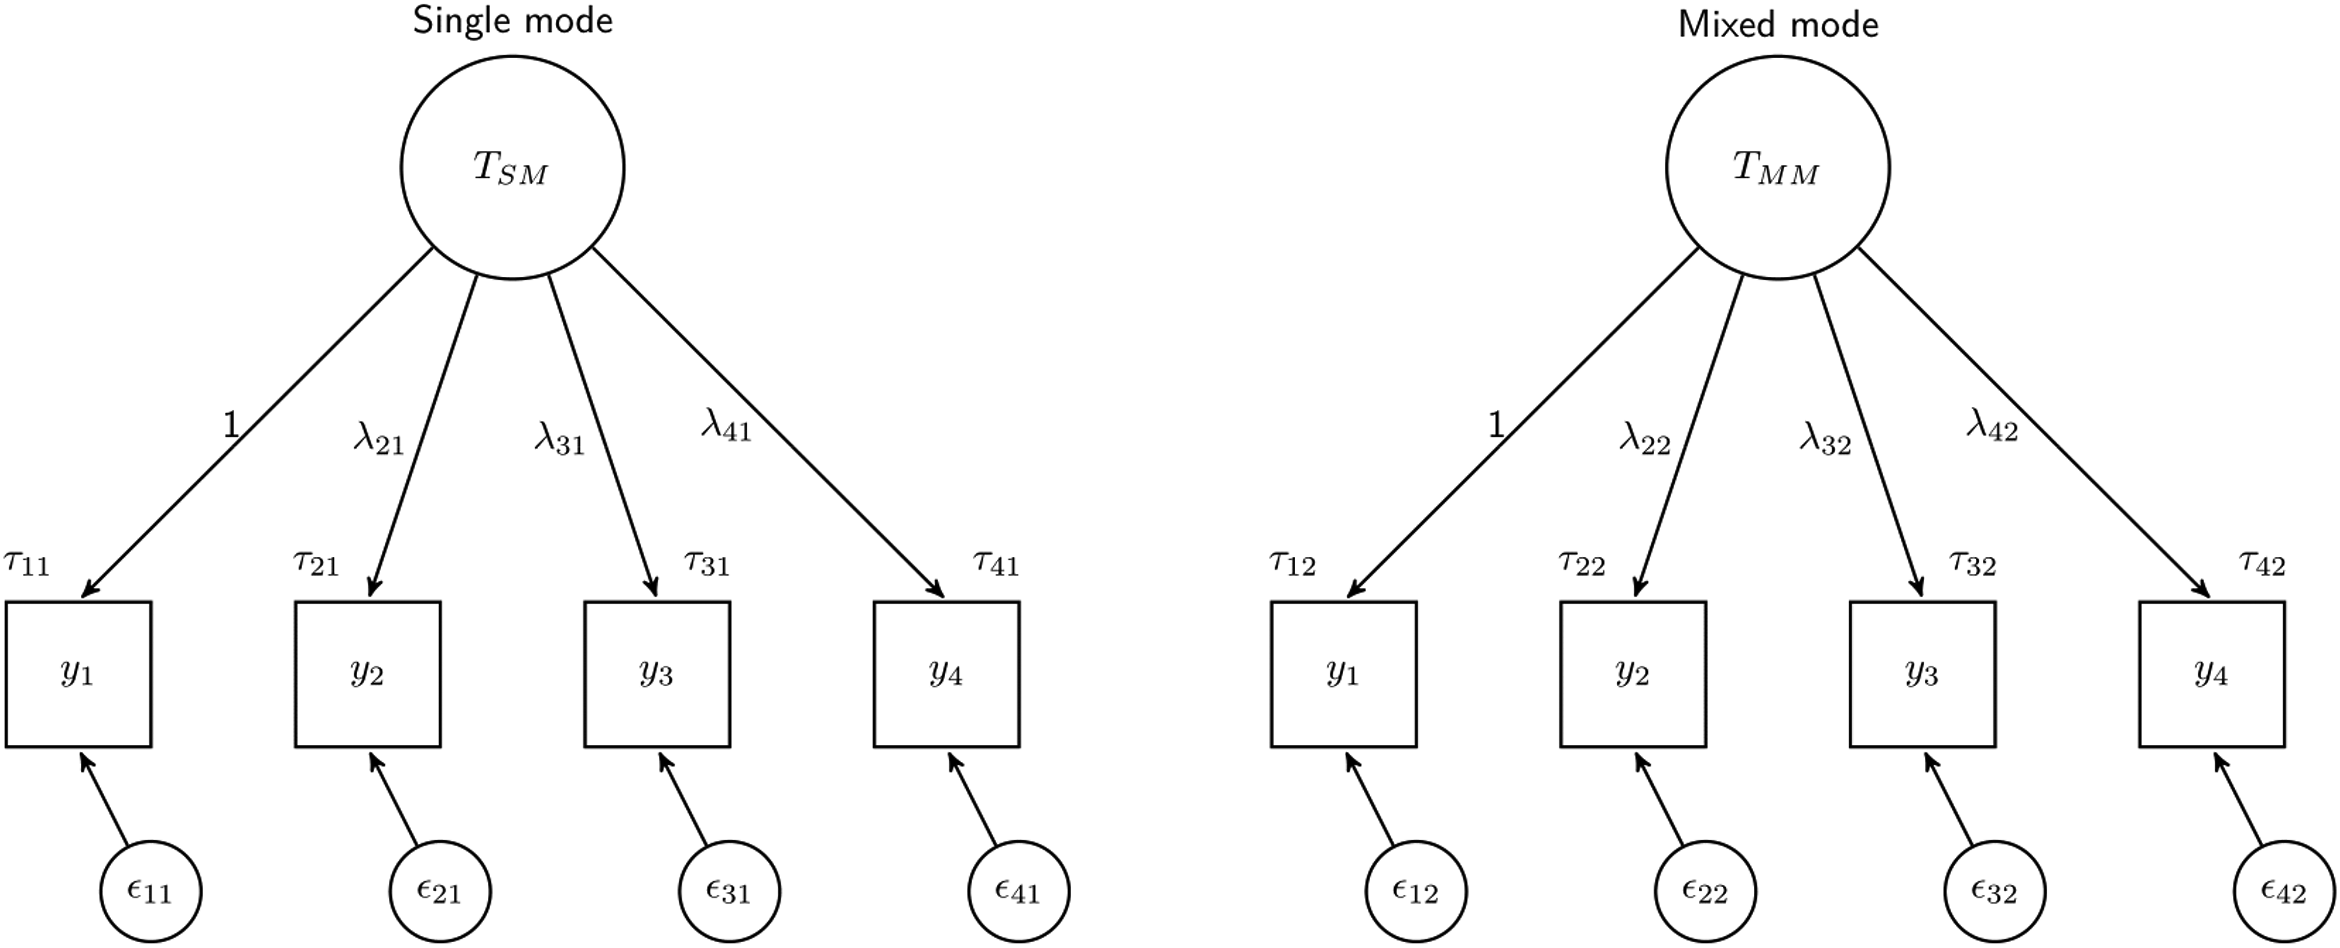
Visual representation of equivalence testing across two groups (single-mode vs. mixed-mode). The configural model is represented where the factor structure is the same but the coefficients are allowed to be different across groups. The large circle represents the overall concept or latent variable, the squares are the observed variables, and the small circles are the residuals. λ denotes the loadings or regression coefficients of the relationship between the latent and observed variables, while τ denotes the intercept/thresholds of these relationships.
The metric and the scalar models give information about different types of measurement error. The metric model refers to the covariance between the questions and the latent variable. In general, a higher loading (λ in Figure 1) highlights a stronger relationship with the latent variable and can be an indication of higher reliability (Bollen, 1989). As a result, lack of metric equivalence could indicate differences in reliability across groups. The scalar model, on the other hand, can be informative regarding systematic shifts in the responses, as it tests if the conditional average of each question is the same across groups. If scalar equivalence is not met it can indicate that the averages of the questions across groups (even after controlling for the scores on the latent variable) are different. This could be caused by systematic response styles like social desirability, acquiescence, and primacy or recency.
When equivalence is not found (metric and scalar models fit worse than the less restrictive model) it is also possible to investigate partial equivalence (Byrne et al., 1989). This implies running a series of models to find which variables can be consistently measured across groups. If at least two variables are found to be equivalent it might still be possible to compare the means and the variances of the latent variables (Byrne et al., 1989).
For all scales, we run simple CFA models for equivalence testing with one latent variable explaining the observed variables (similar to Figure 1). We treat variables with five or more categories as continuous and those with less than five as categorical. All analyses are weighted (see description of selection weights above). For the continuous variables, we use maximum likelihood robust (MLR) estimation while for the categorical ones we use the Weighted Least Squares Means and Variance adjusted estimator with Theta parametrization. We fix the means of the latent variables to 0 to aid estimation and the loading of the first variable to 1.
One model had issues during equivalence testing. For the “traditional family” scale MLR with weights leads to estimation issues, so we use ML with no weights instead. Thus, in total, we investigate 150 models (25 scales * 6 models; 3 models for single- vs. mixed-mode and 3 models for mixed-mode long vs. mixed-mode matrix) for equivalence testing. To compare model fit we use the cut-off value of 0.01 for the change in the comparative fit index (ΔCFI) to define a model as lacking equivalence (Chen, 2007). The data were cleaned in Stata and R, with the data quality indicators created in Stata and the equivalence testing performed in Mplus.
Results
Comparison of Means and Distributions
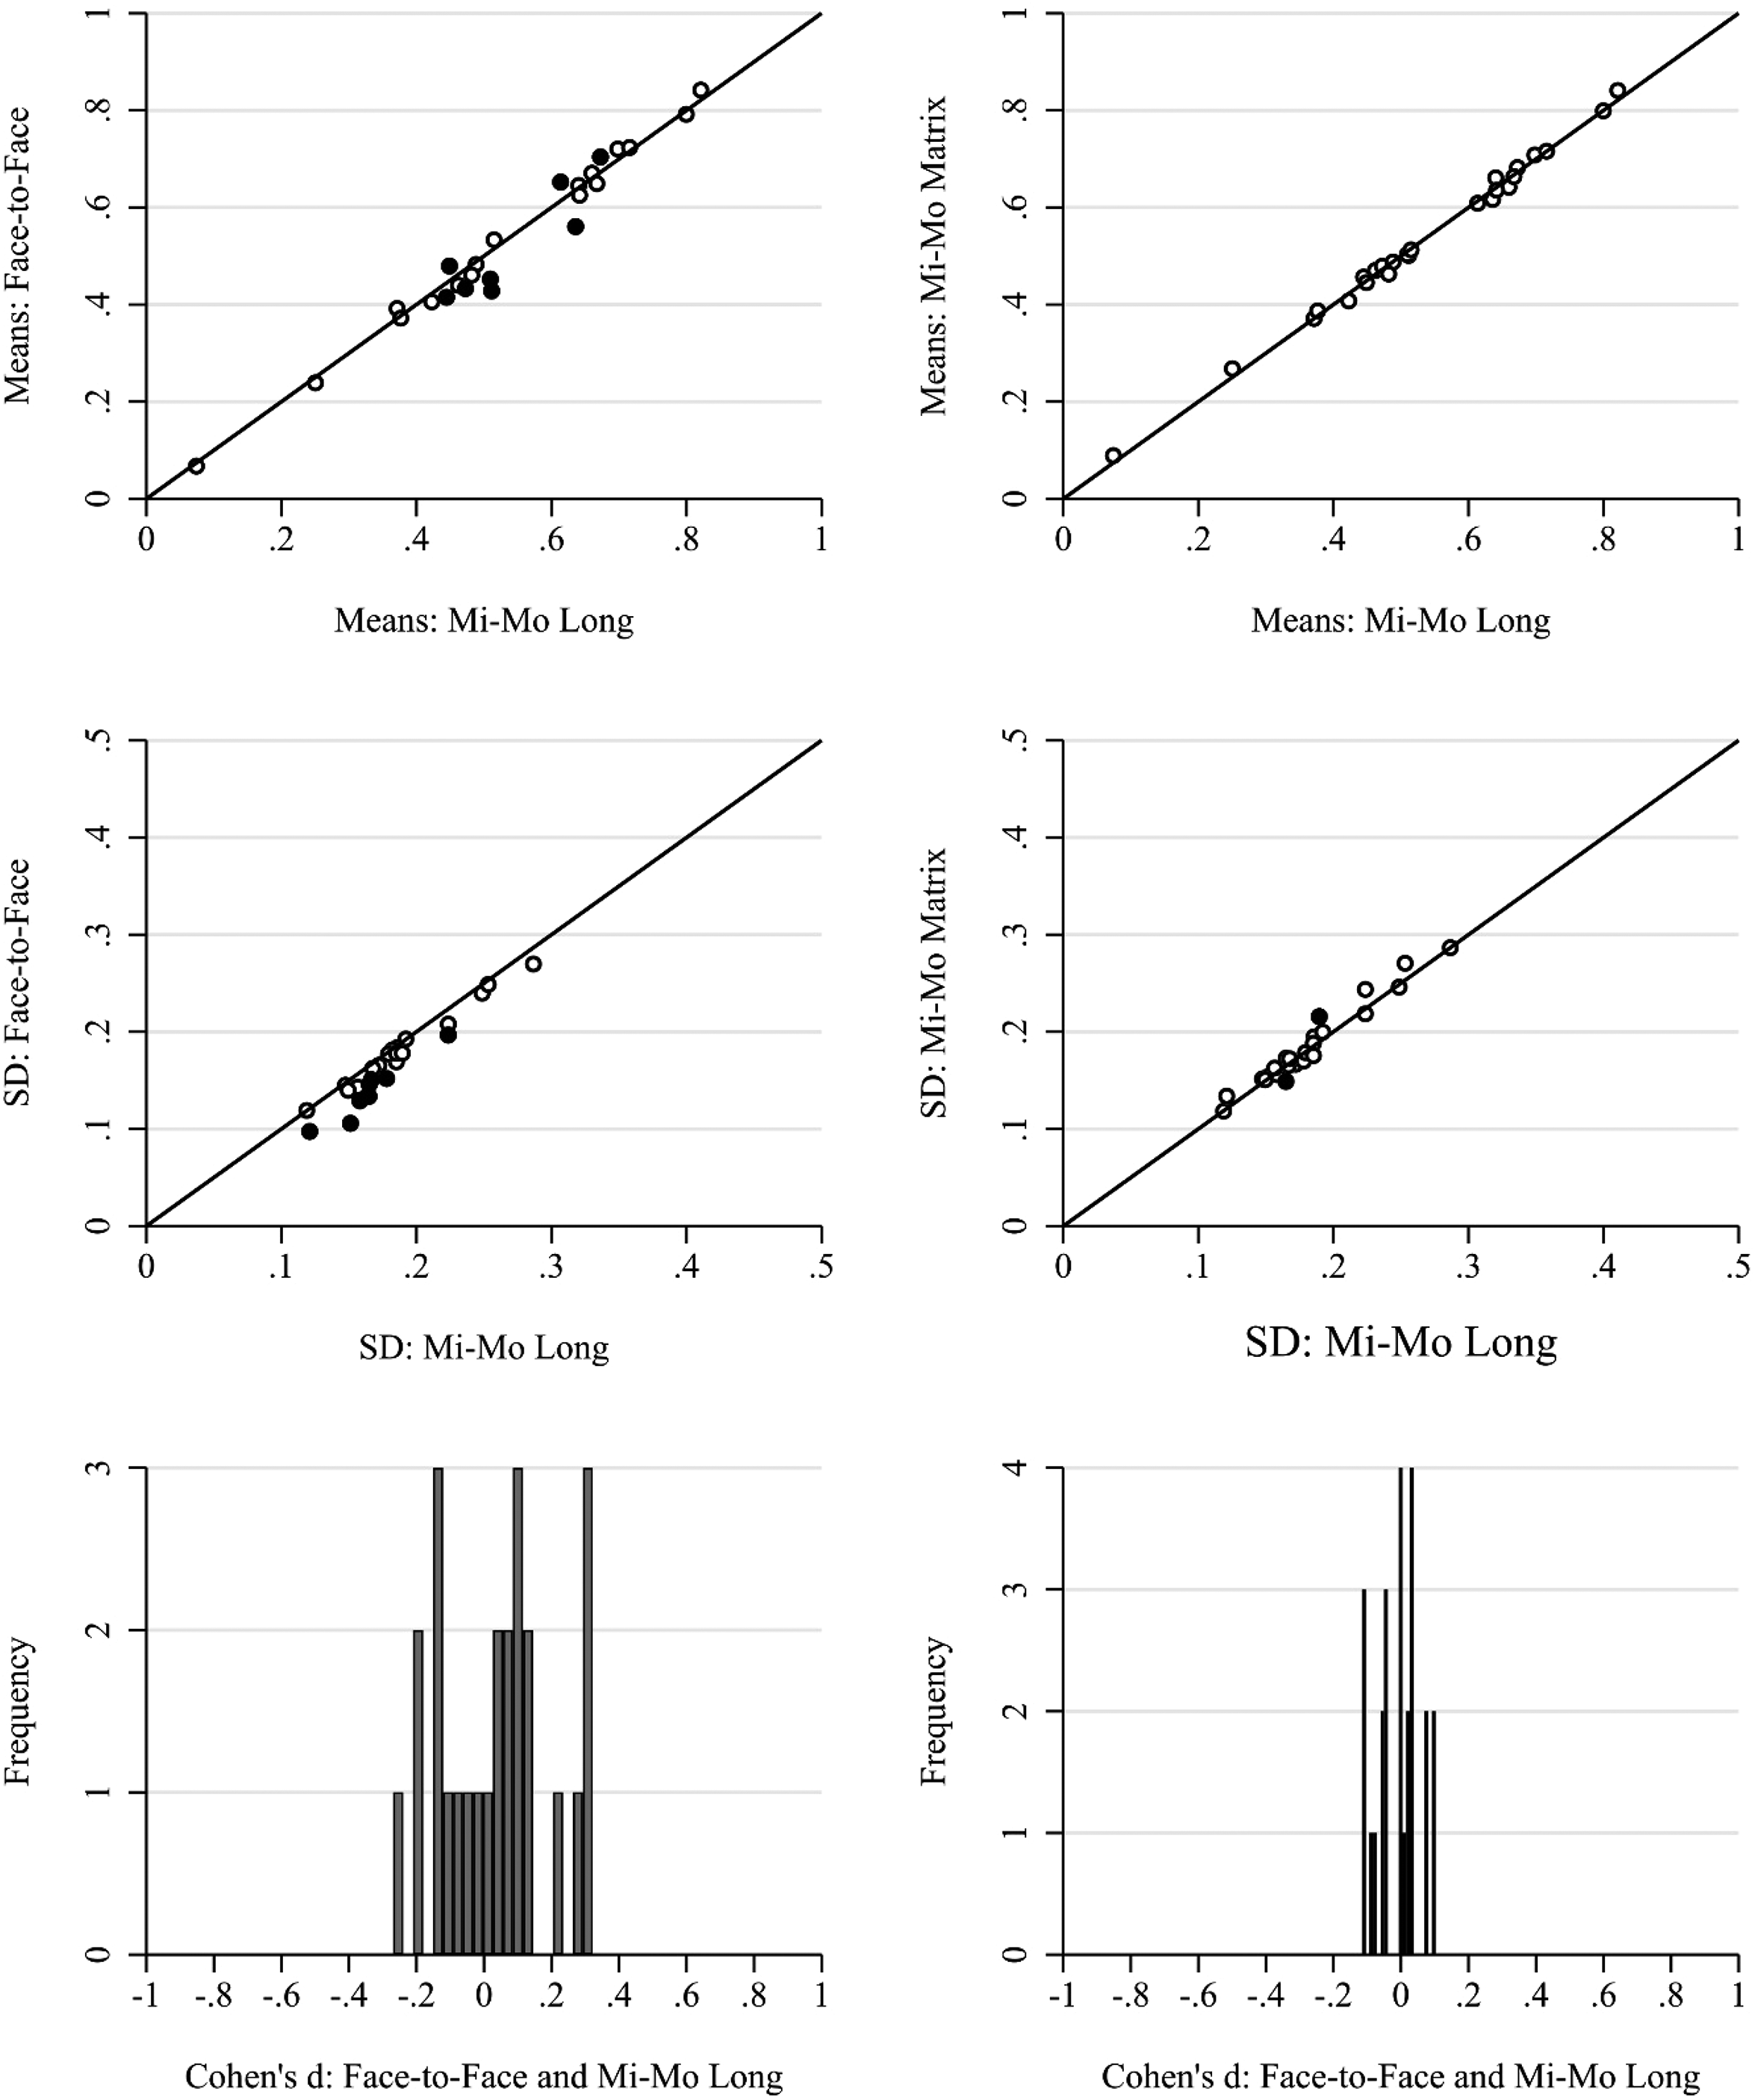
We start by investigating differences in the estimated means and standard deviations of all 140 items initially used in the CFA models (RQ1), excluding only the scale religion for reasons of consistency with the following analysis. The first row in Figure 2 shows scatterplots of the standardized means for single versus mixed-mode and mixed-mode long versus mixed-mode matrix (short) designs (for proportion estimates, see Table A3 in the online Appendix). We observe some significant differences especially in the single- versus mixed-mode comparison. This is confirmed in the histogram of Cohen's d (third row in Figure 2). Here we see that while many of the differences are in the + /− 0.2 range (indicating small effects) there is a group of variables that have larger averages in face-to-face compared to the mixed-mode (mail/web) design and have moderate effect sizes between 0.2 and 0.6. This seems to be much less the case when comparing the mixed-mode data by questionnaire length.
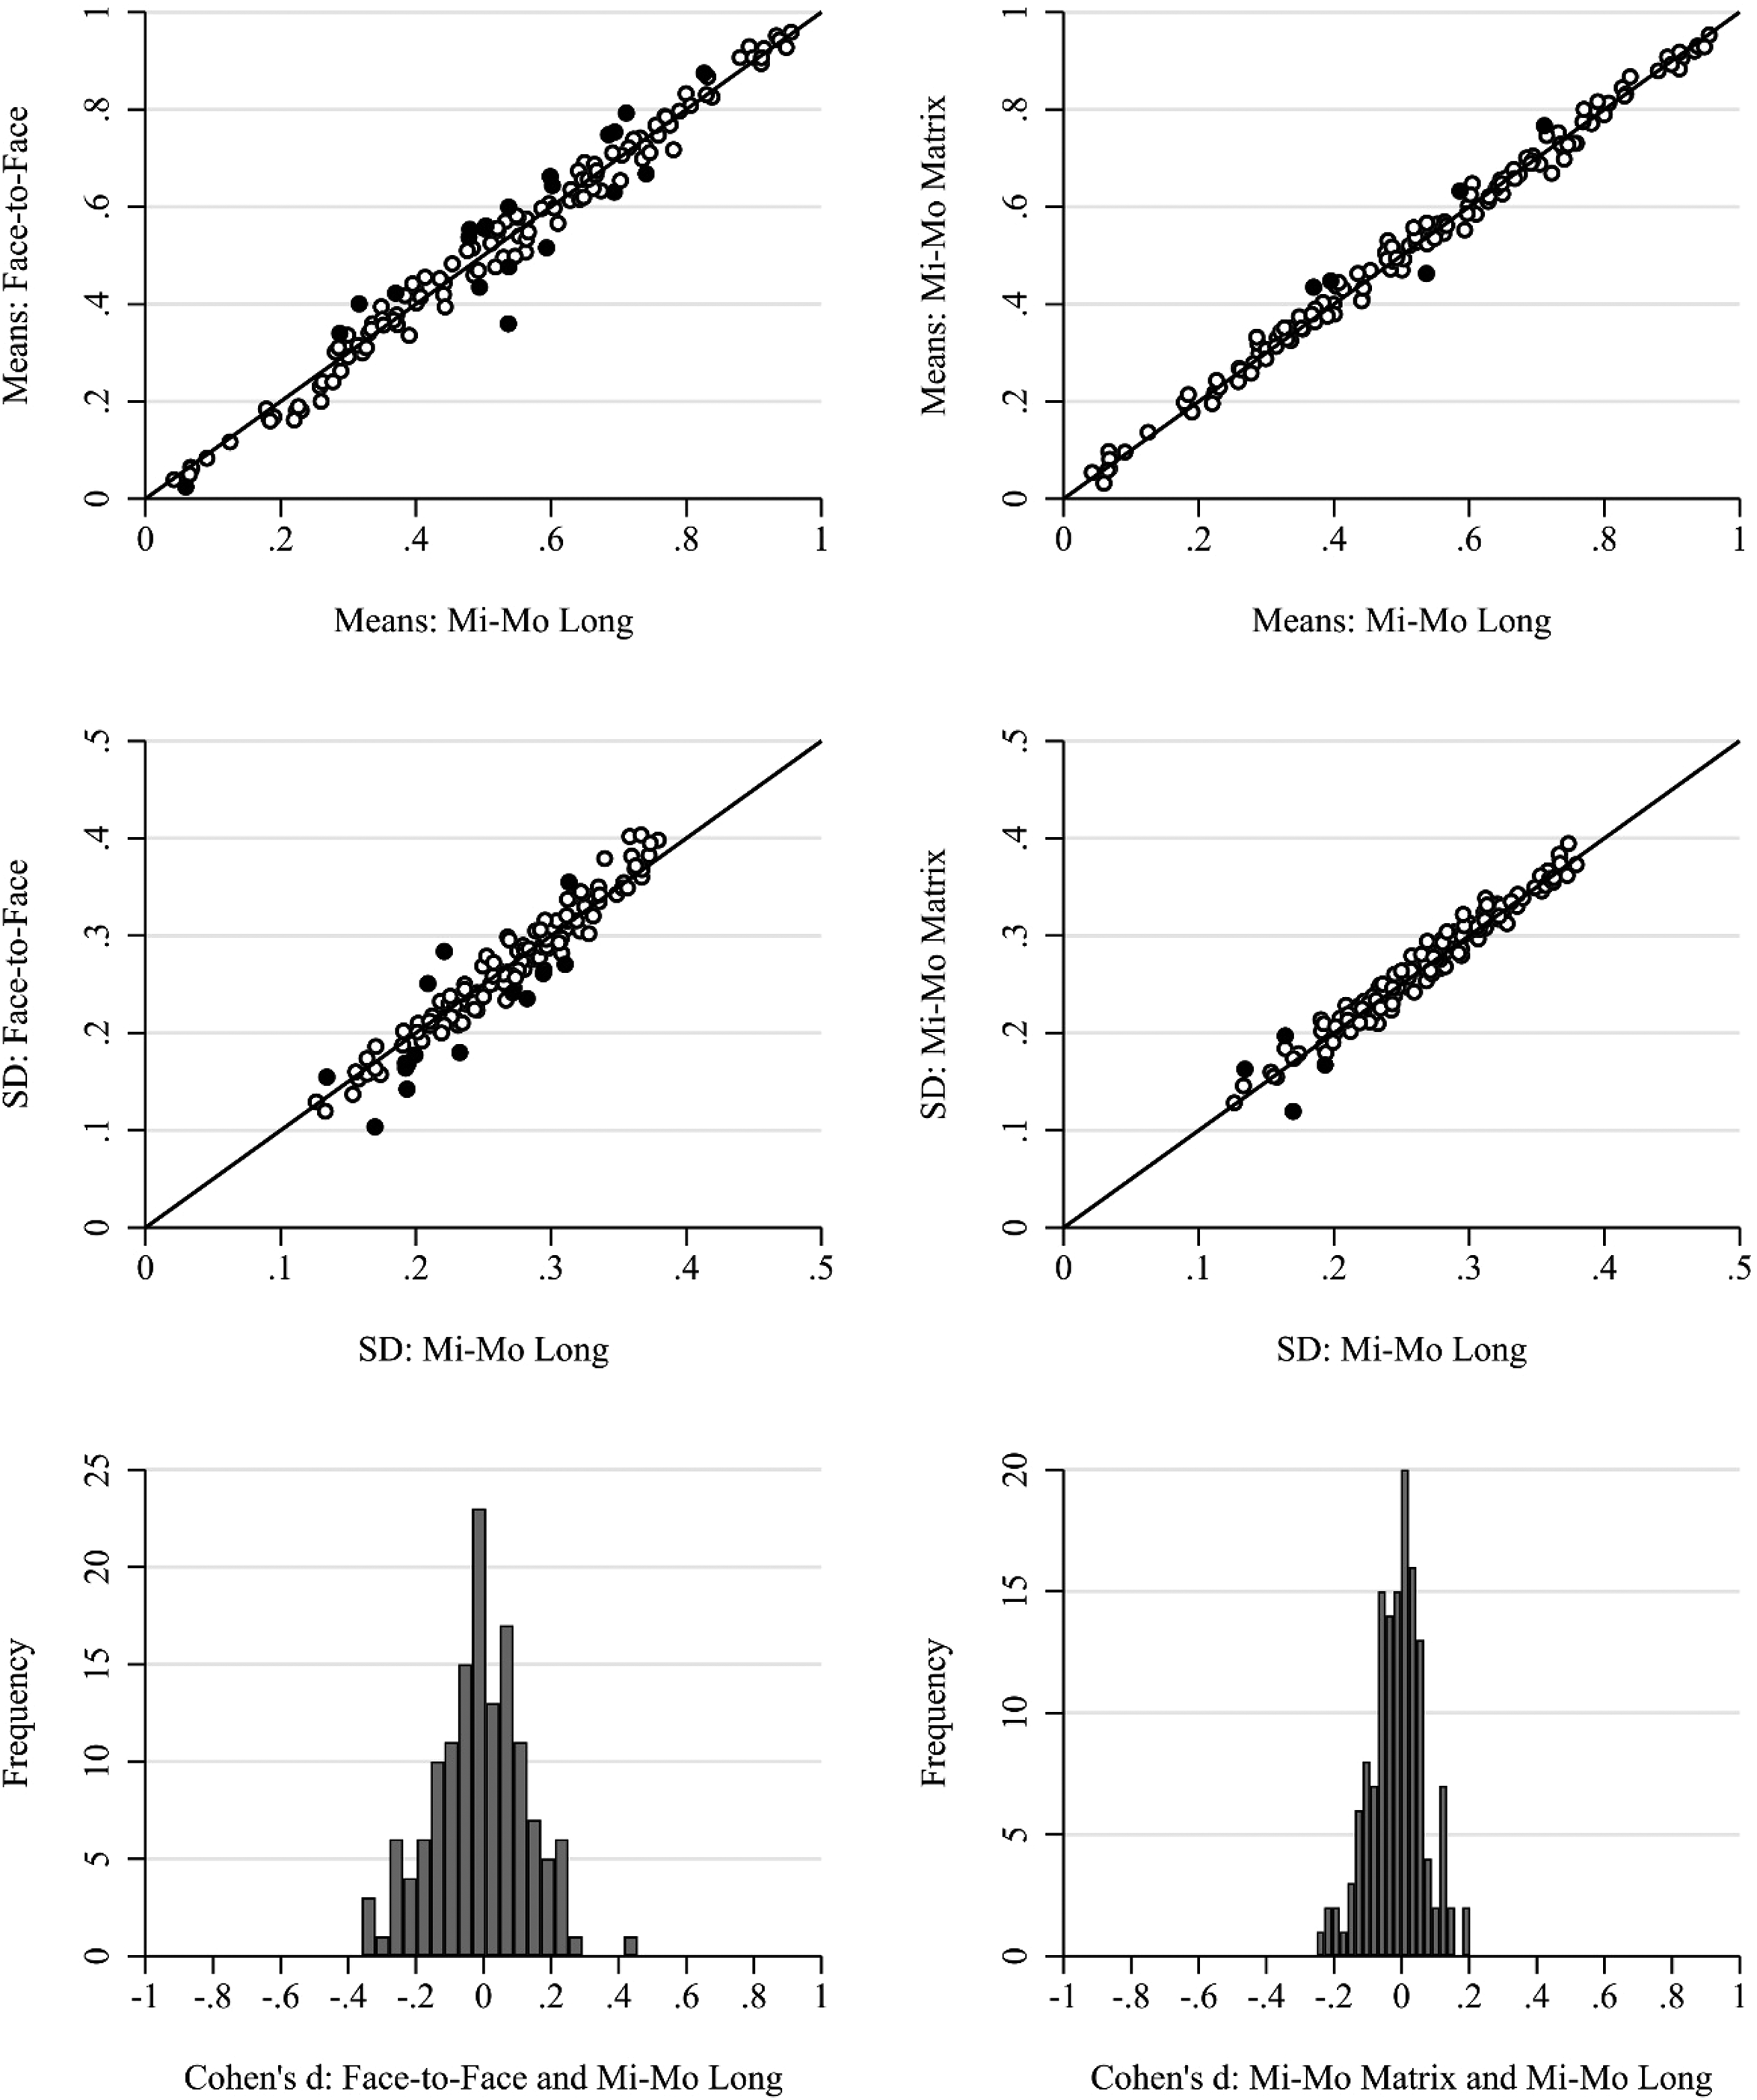
Item level scatterplots for means and standard deviations by survey design: face-to-face single mode, mixed-mode long, and mixed-mode matrix (short). Filled points are statistically significantly different after Bonferroni correction. Bottom row: histogram of Cohen's d for differences between groups. The diagonal lines are used to gauge whether values are higher or lower in one group or another.
The comparison of standard deviations (second row in Figure 2) shows fewer significant differences although a few variables seem to have significantly higher standard deviations in the mixed-mode design compared to the face-to-face one. Again, the differences are less pronounced between the mixed-mode long and the mixed-mode matrix surveys. The same patterns emerge when we replicate the analysis at the scale level for all 25 scales in Figure 3. There are some significant differences between the face-to-face mode and the mixed-mode long survey and only few differences between the mixed-mode long and the mixed-mode matrix (short) survey.
Scale level scatterplots for means and standard deviations by survey design: face-to-face single mode, mixed-mode long, and mixed-mode matrix (short). Filled points are statistically significantly different after Bonferroni correction. Bottom row: histogram of Cohen's d for differences between groups.
After an inspection of the six items with effect sizes larger/smaller than + /−0.20 (Cohen's d), we conclude that there is no discernible pattern for the differences between the mixed-mode long and the mixed-mode matrix survey (see Table A4 in the online Appendix). On the other hand, a pattern emerges when qualitatively inspecting the 23 items with moderate effect sizes between the face-to-face mode and the mixed-mode long (see Table A5 in the online Appendix). For example, the single item with the largest effect size of 0.46 is on how often respondents would follow news on social media, with respondents from the mixed-mode long having a higher social media news diet, on average – which appears plausible. Possibly related, respondents in the mixed-mode long are on average a little bit more skeptical about the integrity of elections in Germany. Conversely, respondents in the face-to-face mode tend to show somewhat higher levels of social and political trust, while also placing more emphasis on their national identity.
We also compare the means and standard deviations for the different survey designs by question topic and scale type (Table A4 in the online Appendix), and find some indications of differences. Topics such as national identity, politics and society, and religion and morale, and four-point scales have more differences in the single- versus mixed-mode comparison, but not for the mixed-mode long versus mixed-mode matrix comparison. However, we need to be careful when interpreting these findings because of the relatively small sample size at the item level and the clustering within scales.
Comparison of Data Quality Indicators
We next estimate multiple data quality indicators (RQ2). Figure 4 shows the average of each data quality indicator as well as the confidence interval based on all the items separately by the three groups of interest: face-to-face, mixed-mode long, and mixed-mode matrix. Starting with item nonresponse, we see that the rate is significantly higher in the mixed-mode designs (long and short) compared to the face-to-face design (i.e., confidence intervals do not overlap). This is true both for the “no answer” and “don’t know” responses. The difference between the mixed-mode long and mixed-mode matrix designs is not significant for the “no answer” response. The “don’t know” responses appear to be less frequent in the mixed-mode matrix survey than in the mixed-mode long survey. For the other data quality indicators (primacy, recency, middle answer, and extreme response style), there are only small differences between the face-to-face, mixed-mode long, and mixed-mode matrix surveys. While there appear to be slightly higher levels of recency for the interviewer-administered survey than for the self-administered mixed-mode survey, the picture is reverted for the use of middle answers with lower levels for the face-to-face survey and somewhat higher levels for the mixed-mode surveys.
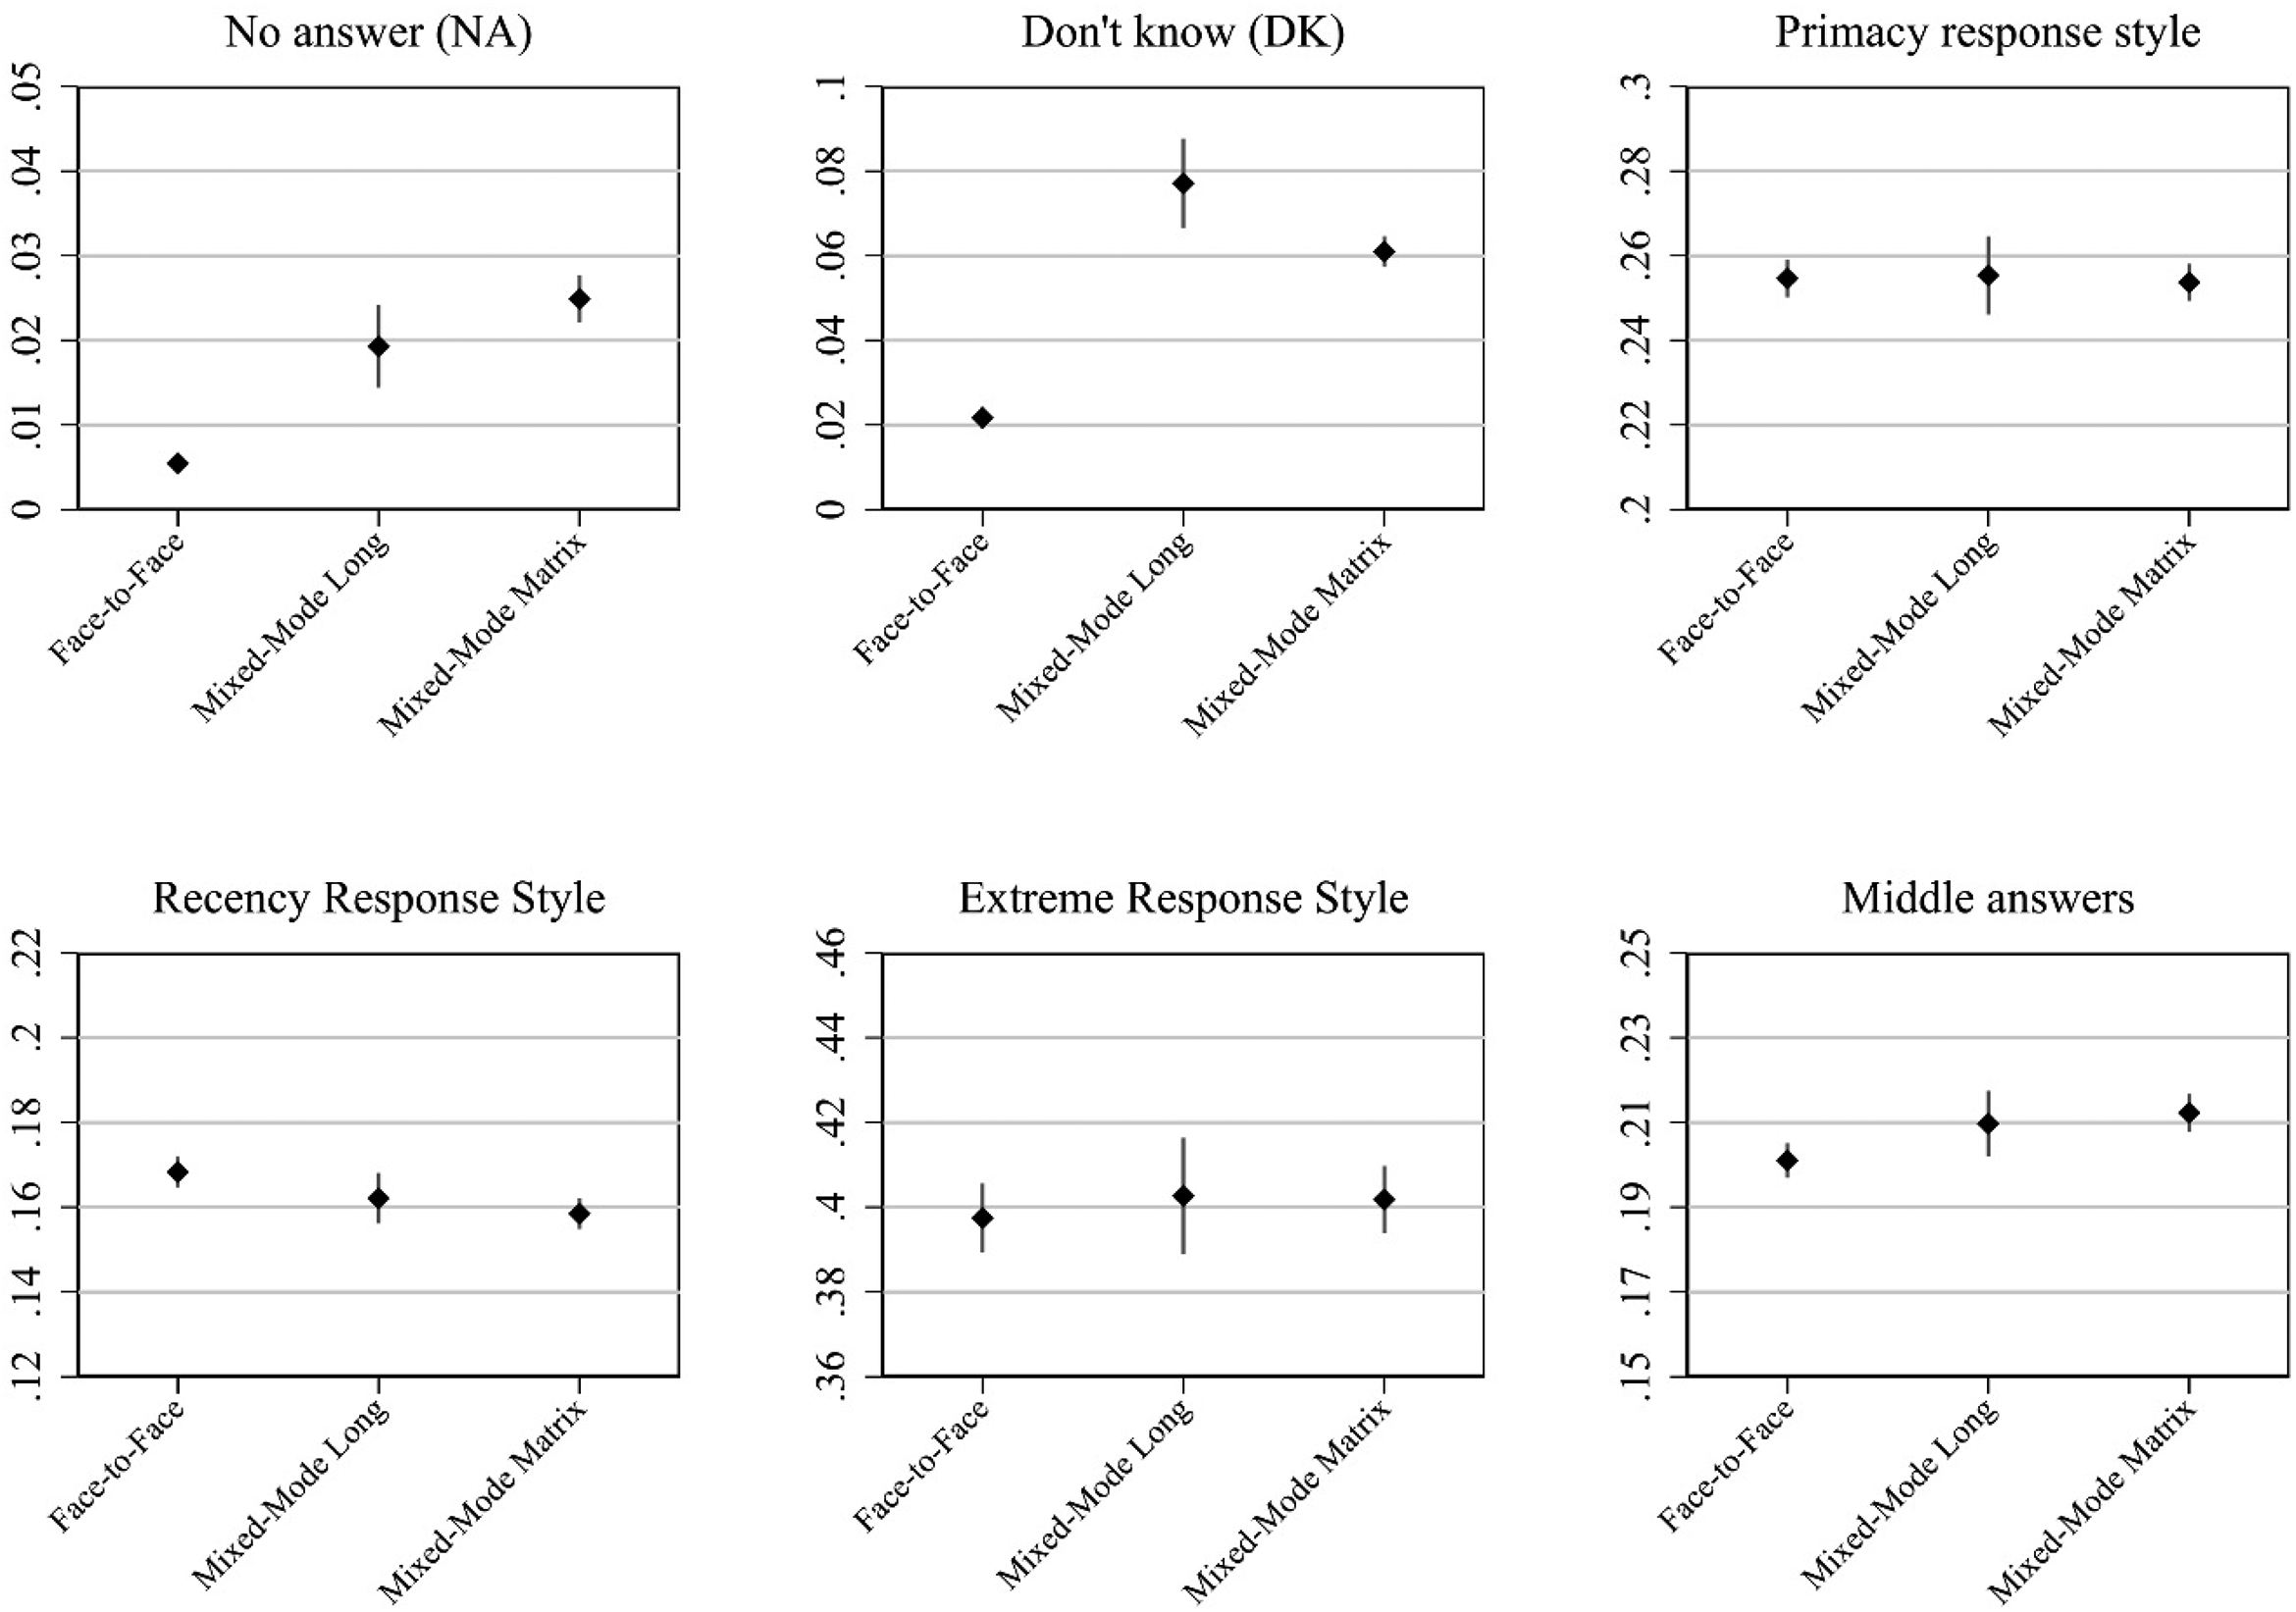
Item level average quality indicators with 95%-confidence intervals by group: face-to-face single mode, mixed-mode long, and mixed-mode matrix (short).
We next estimated quality indicators for the 25 scales. Figure 5 mirrors the analysis performed in Figure 4, but also adds an indicator for straightlining, which can only be computed at the scale level. Results are very similar to those presented in Figure 4: item nonresponse is significantly more frequent in both mixed-mode designs than in the face-to-face mode, and the mixed-mode matrix shows a smaller extent of “don’t know” responses than the mixed-mode long. For the remaining data quality indicators differences between the surveys are small, although the face-to-face mode appears to perform slightly better than both mixed-mode designs with respect to straightlining and middle response style, while the mixed-mode surveys perform slightly better with respect to recency.
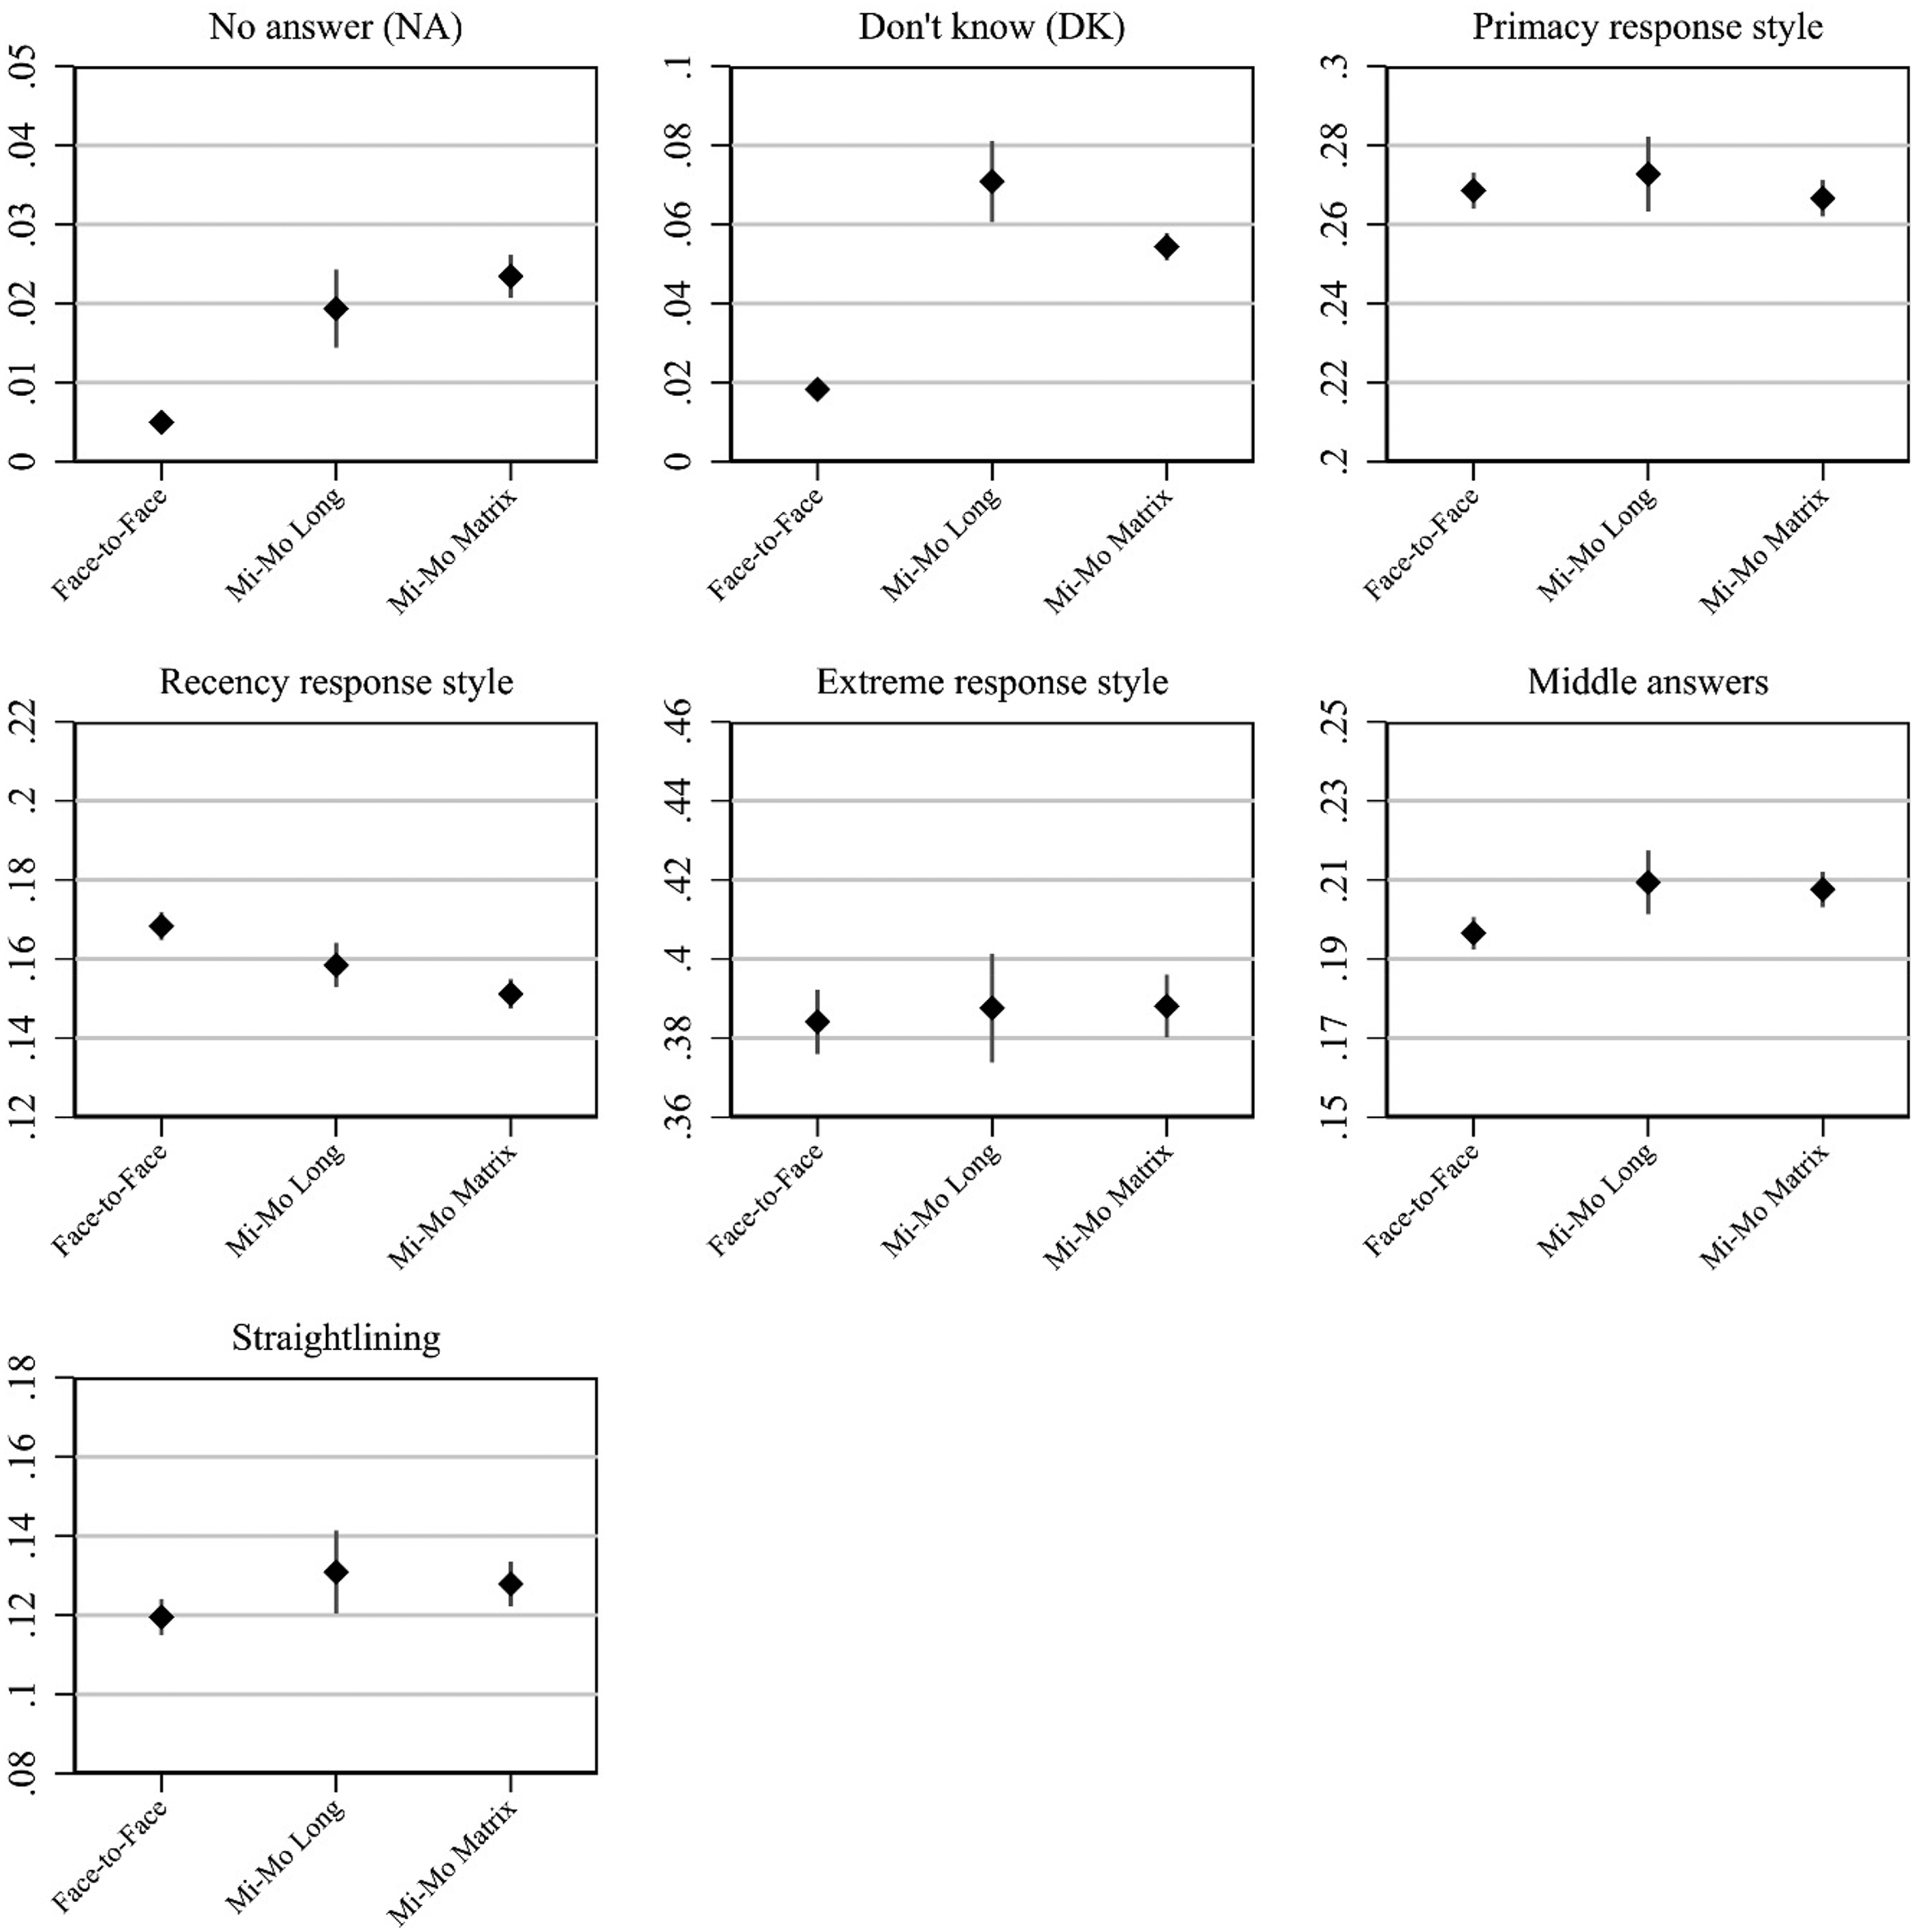
Scale level average quality indicators with 95%-confidence intervals by group: face-to-face single mode, mixed-mode long, and mixed-mode matrix (short).
Lastly, Figure 6 shows the data quality indicators separately for each scale. When turning to this lower level of aggregation we see the results of the previous analysis reconfirmed: the mixed-mode designs consistently show greater proportions of “no answer” and “don’t know” responses across all scales. These proportions also vary between the scales and the magnitude of the difference is quite large for several scales. Yet, these differences in item nonresponse seem to be only weakly related to differences in the scale averages (top-left row). Again, we find no indication of a difference in extreme response style between the surveys (bottom-left row). Finally, the mode designs seem to be only weakly and inconsistently related to the use of middle answers, primacy, recency, and straightlining; thus, the results remain consistent between the analyses presented in Figures 5 and 6.
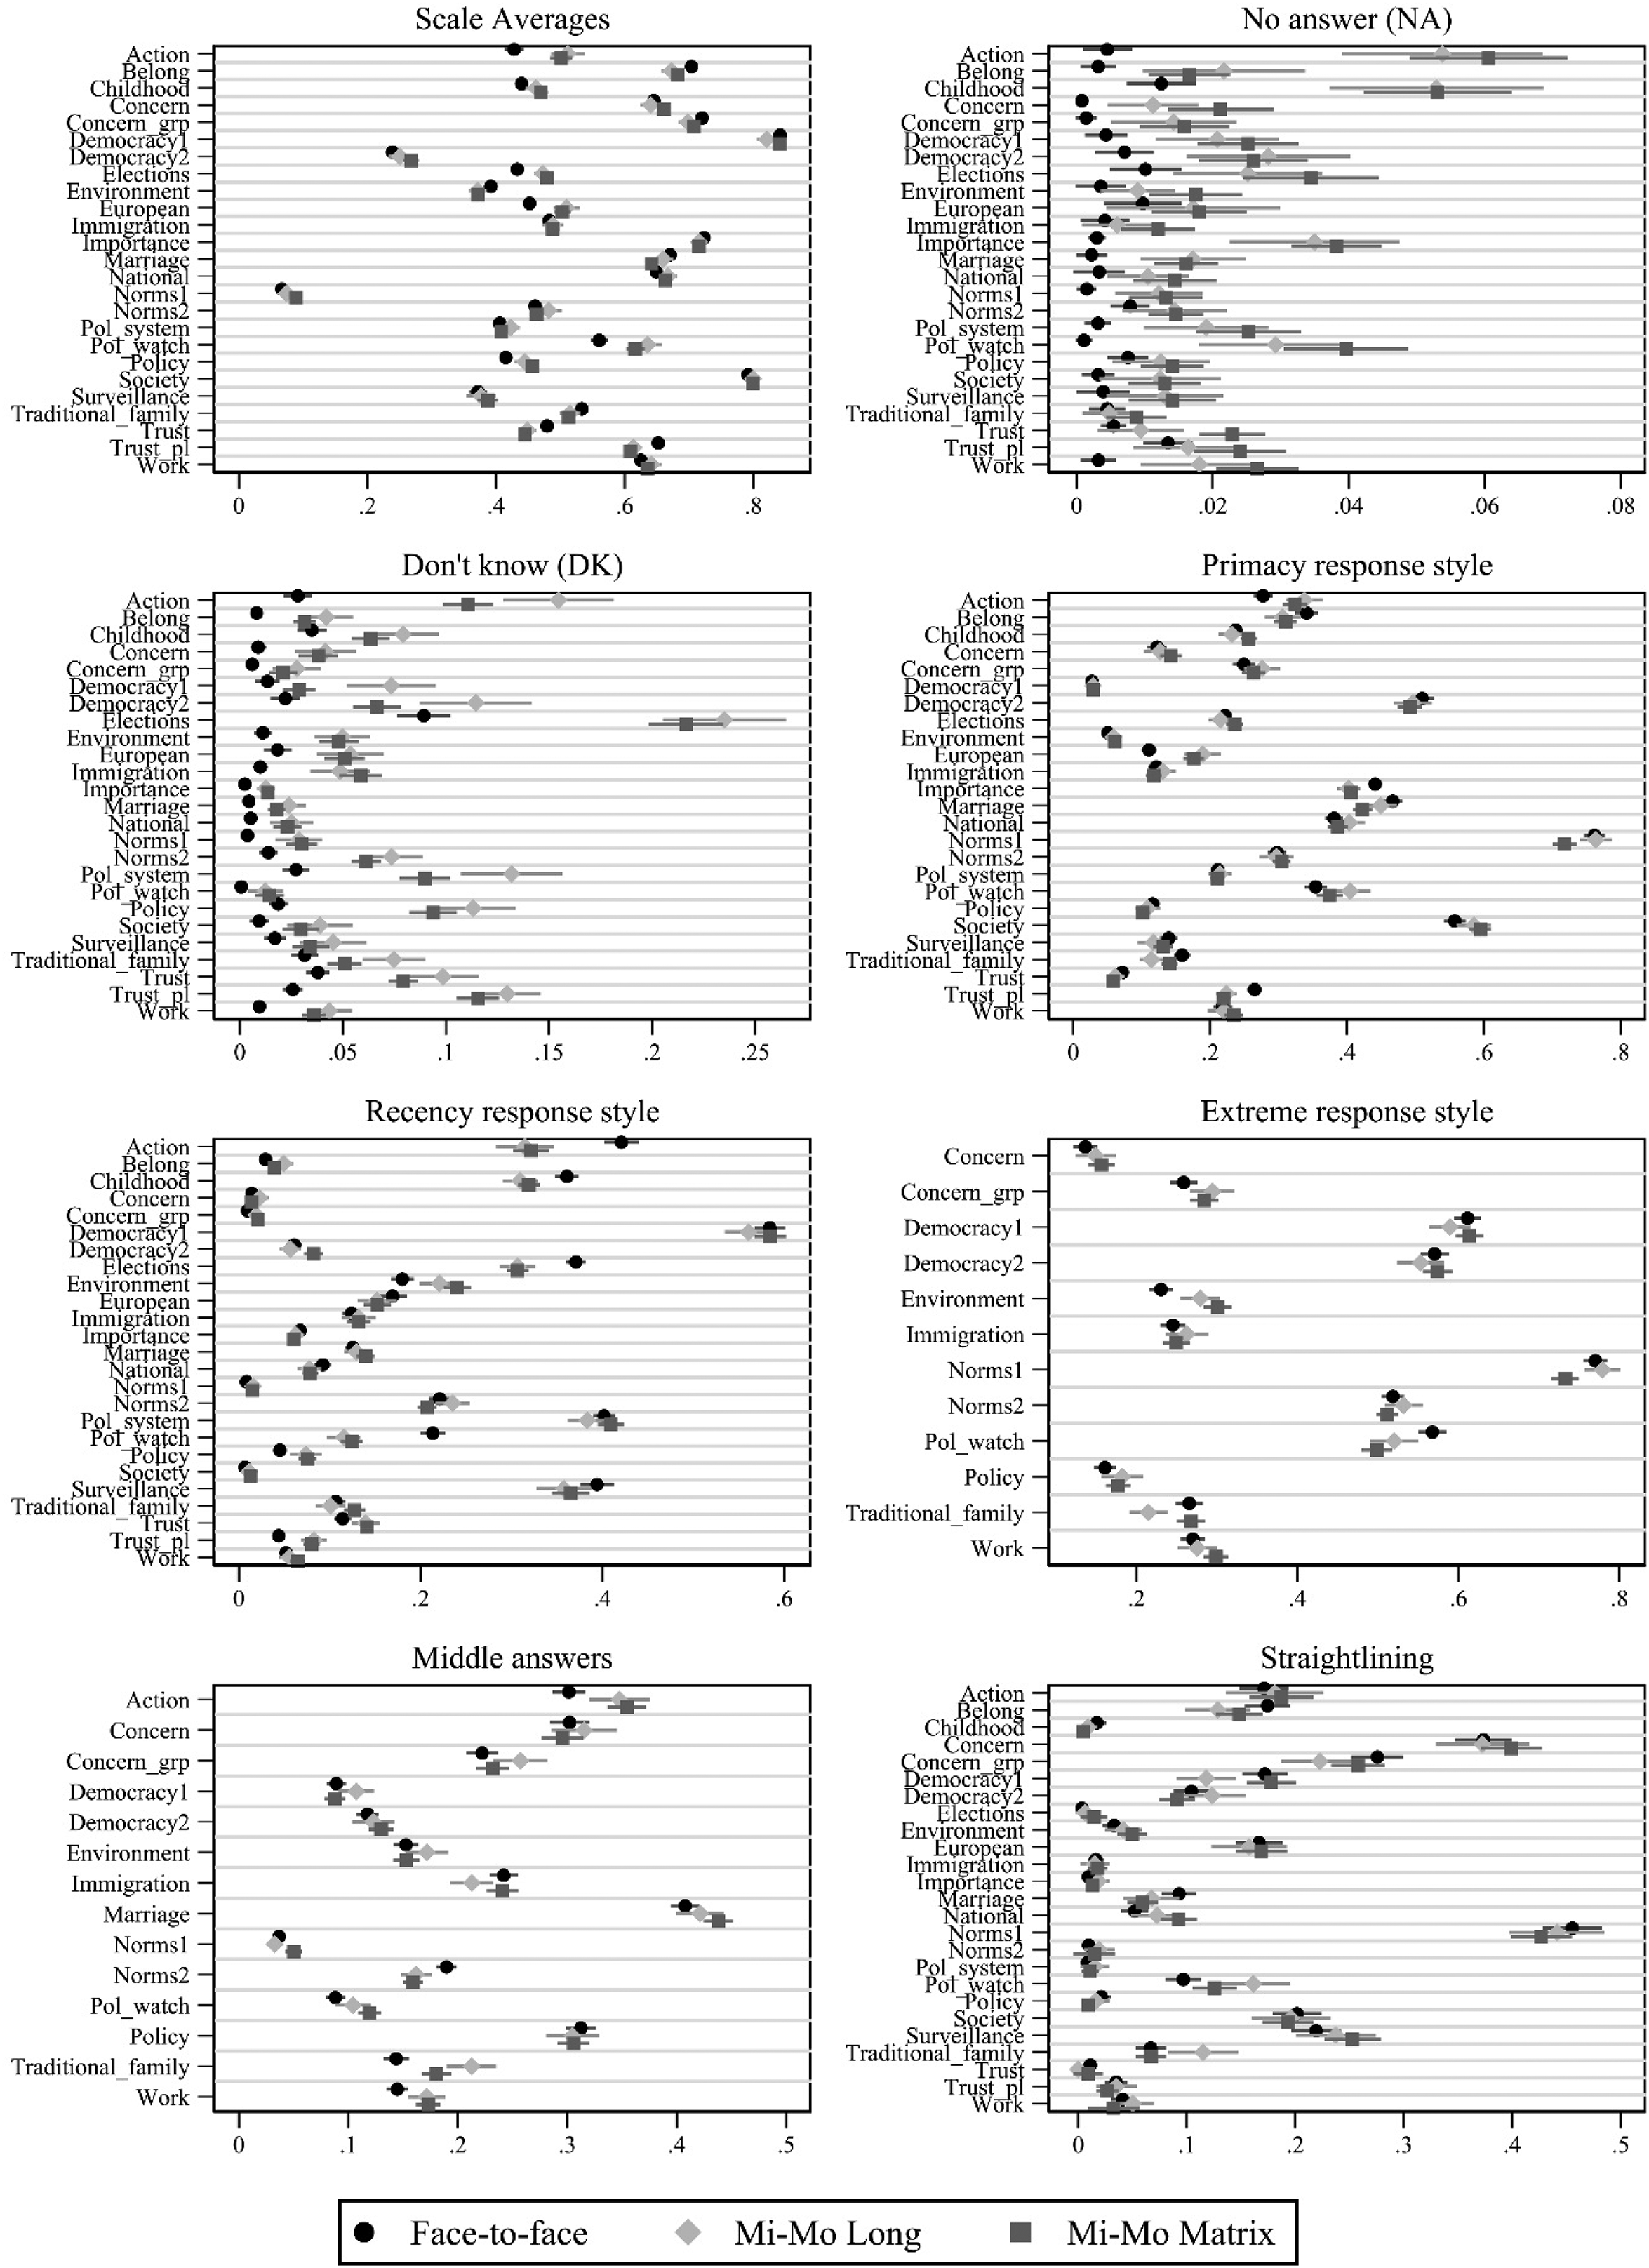
Scale level quality indicators with 95%-confidence intervals by group: face-to-face single mode, mixed-mode long, and mixed-mode matrix (short).
Equivalence Testing: Mode Design Comparison
We next investigate whether the 25 scales identified have comparable measurement models (i.e., measurement equivalence) across face-to-face and mixed-mode designs and mixed-mode long and mixed-mode matrix designs (RQ3). We start by testing whether the three levels of measurement equivalence (configural, metric, and scalar) hold across the single-mode face-to-face survey and the mixed-mode mail/web survey, for each of the 25 scales. Measurement equivalence is assessed by inspecting differences in the CFI values between models. Full details of the model fit statistics are provided in the online supplementary materials. The models for one of the scales (“importance”) did not converge when analyzing it using the multi-group approach. The following results will refer to the remaining 24 scales.
Out of 24 scales analyzed the vast majority (21 out of 24) achieve metric equivalence based on our criterion (see Table 3, “metric” column). This suggests that valid comparisons of unstandardized relationships between the interviewer- and self-administered mode groups can be obtained for most scales. An alternative interpretation of equal loadings is that reliabilities are similar across the groups (Bollen, 1989).
Equivalence Testing Conclusions Based on CFI Differences – Mode Design Comparison. Problematic Items Are Denoted in Parentheses.
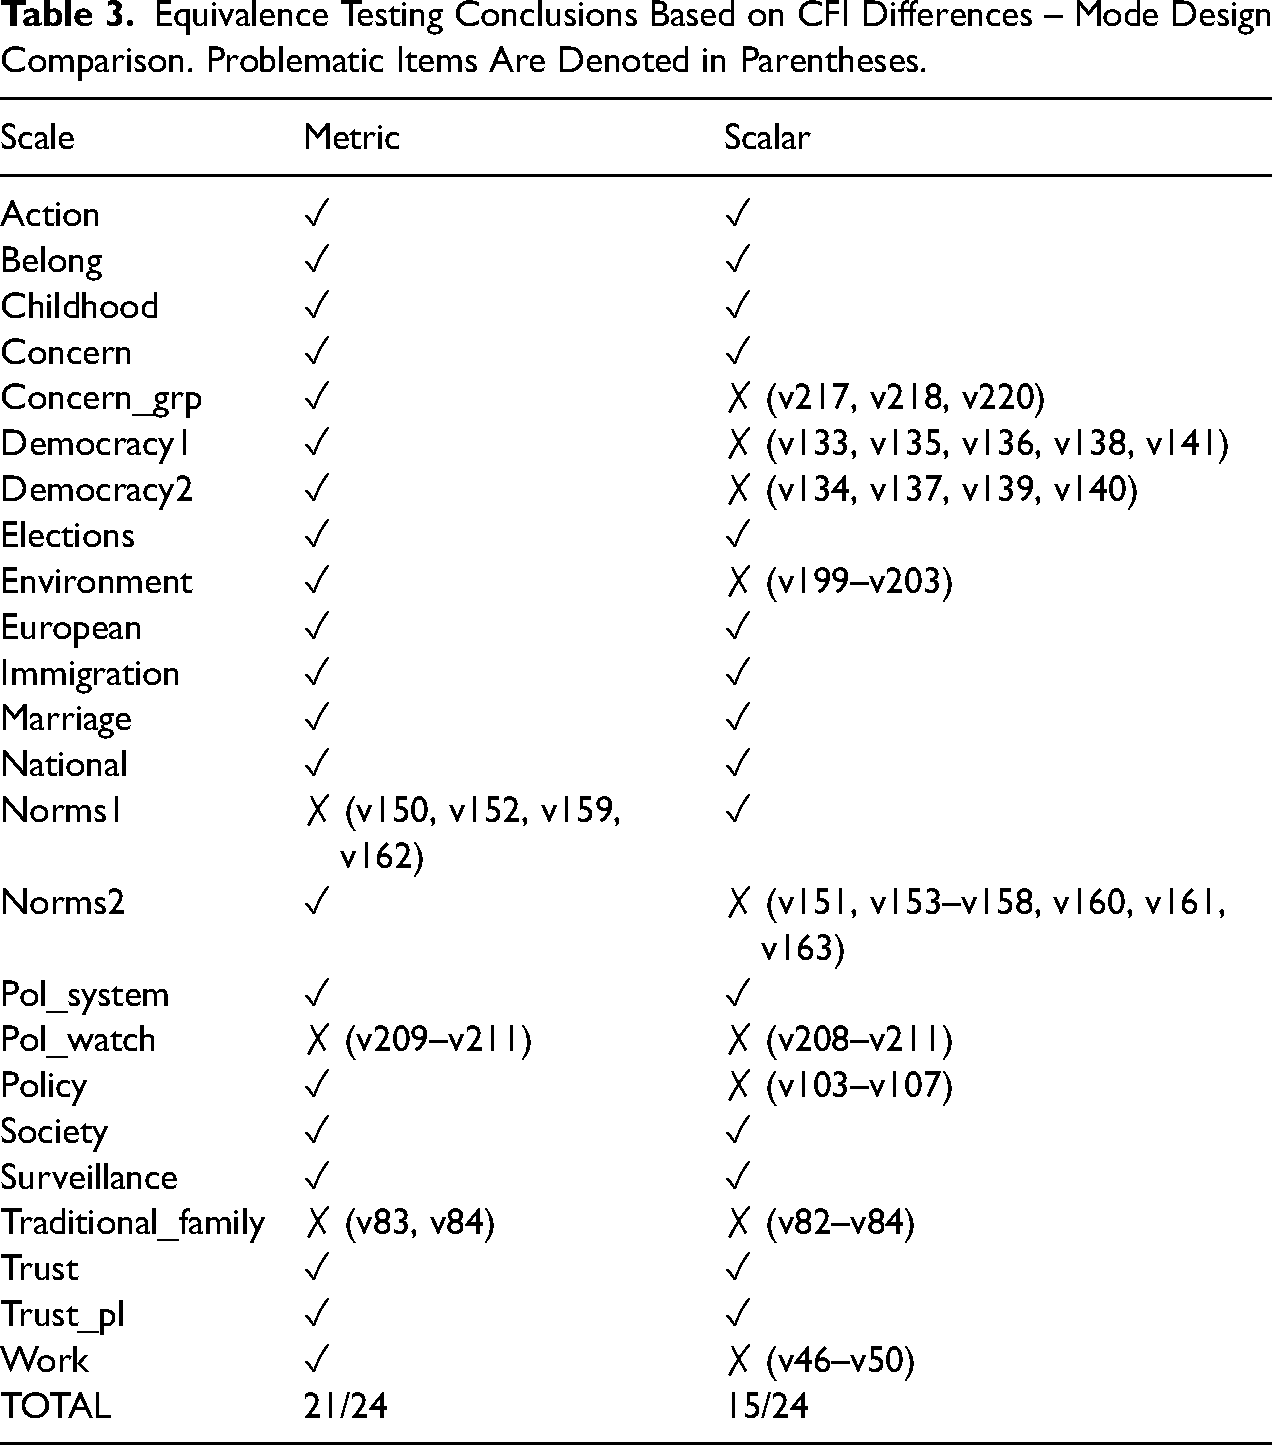
The three scales that do not reach metric equivalence are Norms1, Pol_watch, and Traditional_family. For Norms1, the largest difference appears for the loadings of items v152 (if it is justified: “Cheating on tax if you have the chance”) where the loading is larger in the mixed-mode design and v162 (if police violence is justified) where the reverse is true. For Pol_watch, the loading for v211 (how often you follow politics on social media) has a much smaller loading in the mixed-mode compared to the single-mode design (0.40 vs. 0.07). Similarly, the loadings are less strong in the mixed-mode data compared to the face-to-face data for v83 (“It is a duty towards society to have children”) and v84 (“Adult children have the duty to provide long-term care for their parents”). This leads to a mixed result for these scales although overall the loadings are generally stronger in the face-to-face compared to the mixed-mode design, indicating slightly higher reliability in the interviewer-administered mode for these items.
Scalar equivalence is also achieved for the majority (15 out of 24) of the scales (see Table 3, “scalar” column), indicating that it is valid to compare the latent means between mode designs. Out of the nine scalar non-equivalent scales, two of them overlap with the metric non-equivalent scales: Pol_watch and Traditional_family. These two scales are particularly problematic as they have different loadings and different intercepts and therefore are not measured in the same way across the mode designs. The other scalar non-equivalent scales include Concern_grp, both democracy scales, environment, Norms2, Policy, and Work. We dissect some of the causes of scalar non-equivalence in these scales below.
Scalar equivalence is essential for ensuring that averages of the latent variables are comparable across groups. Additionally, differences in intercepts/thresholds can be informative as they may be caused by systematic biases such as social desirability or acquiescence. The differences found in the nine scales that are not scalar equivalent show mixed patterns, with larger intercept/threshold values in both mode design groups for particular items. For example, for items v136 (“it's essential for democracy for people to receive state aid” where larger numbers mean more essential) and v211 (“how often you follow politics on social media” where larger numbers mean less often) the intercepts are larger in the mixed-mode design. In contrast, for items v156 (“Euthansia can be justified” where larger numbers mean can be justified) and v154 (“Abortion can be justified” where larger numbers mean can be justified) the conditional mean is larger in the face-to-face single-mode design. At this point we can only speculate regarding possible causes for such differences, such as social desirability, leading to systematic shifts in the observed averages of these variables. What is clear is that systematic differences in the intercepts can happen across mode designs.
Equivalence Testing: Questionnaire Length Comparison
Next, we test for measurement equivalence across the long- and short-questionnaire groups used in the mixed-mode (web/mail) surveys. The same model evaluation criterion (i.e., change in CFI values) is used. Full model details can be found in the online supplementary materials.
Metric equivalence is achieved for all but two scales (policy and traditional_family) (see Table 4, “metric” column). Again, this means that one can be relatively assured that unstandardized relationships can be validly compared between both long- and short-questionnaire versions. The full-length questionnaire version shows stronger loadings for items v83 (“It is a duty towards society to have children”), v84 (“Adult children have the duty to provide long-term care for their parents”), v107 (“Private ownership of business and industry should be increased”), and v105 (“Competition is good”), while the shorter questionnaire version has stronger loadings for item v106 (“Incomes should be made more equal”). As mentioned above, this indicates that for some items the full-length questionnaire has higher reliability compared to the shorter length version, although this difference appears only for a small proportion of items.
Equivalence Testing Conclusions Based on CFI Differences – Questionnaire Length Comparison. Problematic Items Are Denoted in Parentheses.
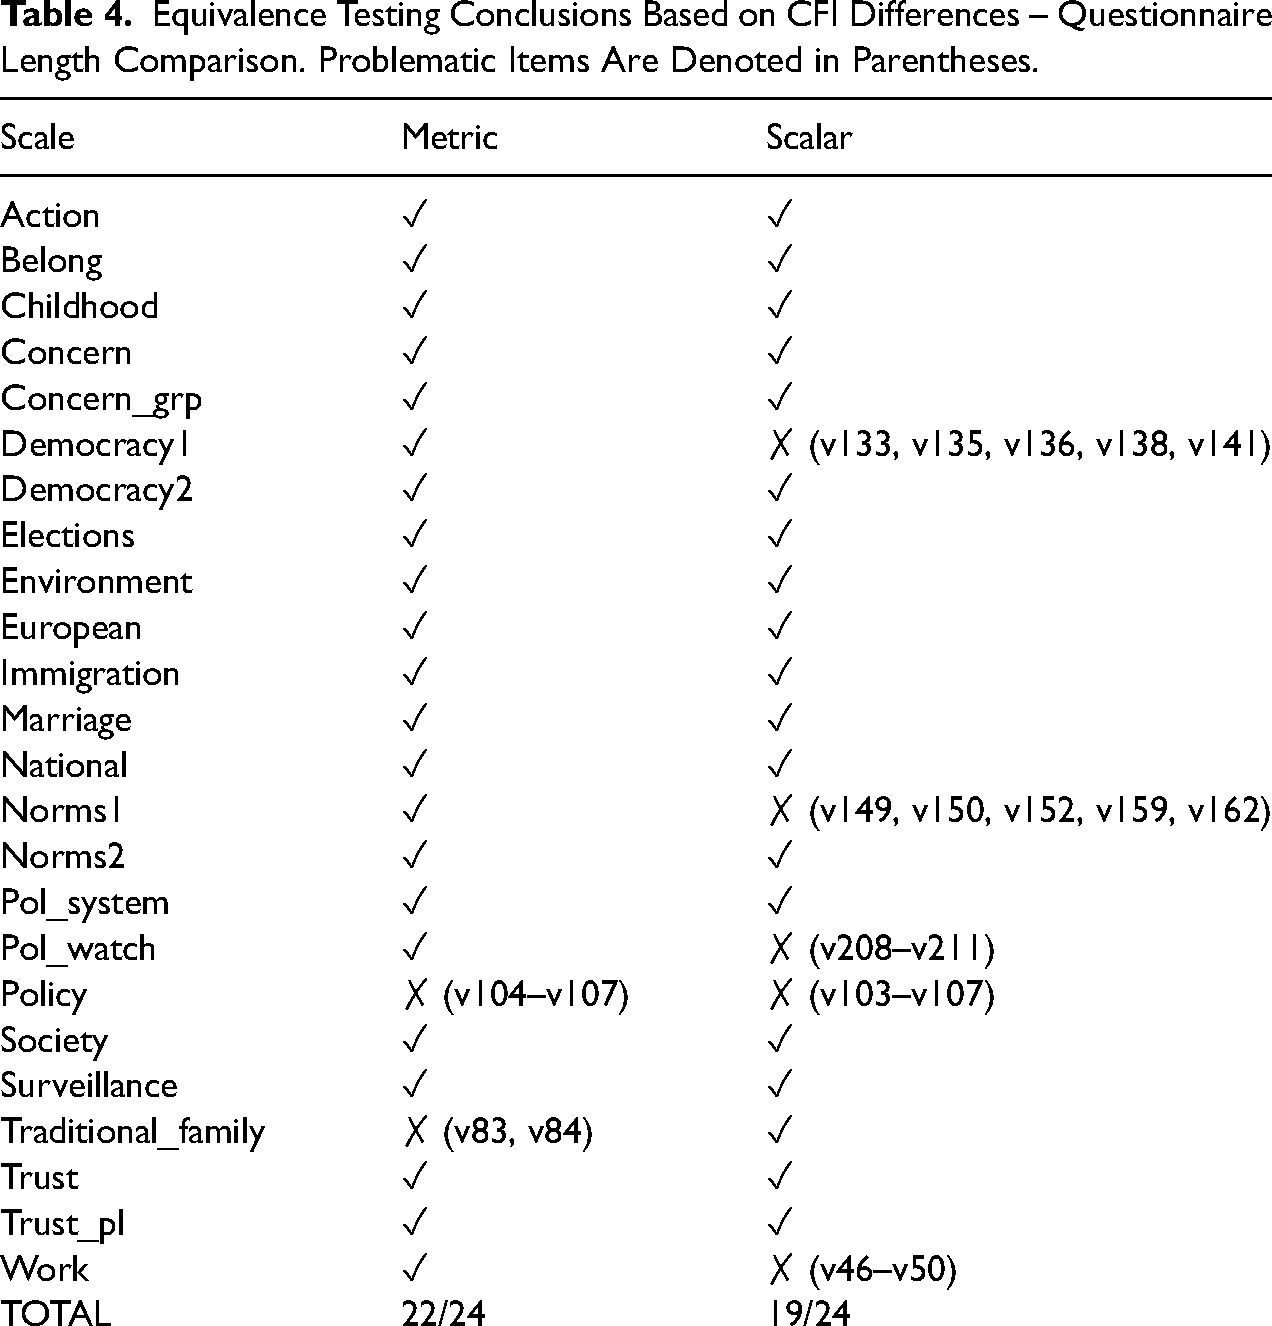
Scalar equivalence is established for all but five scales (see Table 4, “Scalar” column), supporting the possibility of making valid comparisons of latent means between different questionnaire lengths. Among the non-equivalent scales, policy, also lacks metric equivalence, suggesting that this scale cannot be measured in the same way in both long- and short-questionnaire forms. The other scalar non-equivalent scales include Democracy1, Norms1, Pol_watch, and work.
Looking at the largest differences in the intercepts for these non-equivalent scales we find that items v136 (“it's essential for democracy for people to receive state aid” where larger numbers mean essential), v104 (“People who are unemployed should have the right to refuse a job they do not want” where larger numbers mean more support for statement), v211 (“how often you follow politics on social media” where larger numbers mean less often), v133 (“Governments tax the rich and subsidize the poor” where higher numbers mean essential for democracy), v149 (“Claiming state benefits which you are not entitled to” where higher numbers mean always justified), and v138 (“Civil rights protect people from state oppression” where higher numbers mean essential for democracy) have higher intercepts in the shorter questionnaire compared to the longer one. Once again, a number of different types of systematic biases could lead to these patterns such as social desirability or recency effects.
Discussion
In this study, we investigated two important aspects of modern survey data collection: differences in measurement quality between a single-mode face-to-face design and a fully self-administered mixed-mode (mail/web) design, and differences in measurement quality between a long and short questionnaire implemented in a self-administered mixed-mode (mail/web) design. Overall, we found small differences in the distributions of variables across these different designs (RQ1), although we observed larger differences in estimated means and lower variation for items measured in the single-mode face-to-face design compared to the mixed-mode (mail/web) designs. We also observed more item missing data in the mixed-mode designs compared to the single-mode design but few systematic differences in data quality at the item level (RQ2). Moreover, there were only few differences at the item level when comparing the mixed-mode surveys with the different questionnaire lengths.
We next investigated measurement equivalence (RQ3), or the degree to which the different survey designs have the same measurement model, in 24 attitudinal scales (covering 129 items). When comparing mode designs, we found that 21 out of 24 scales achieve metric equivalence and 15 out of 24 achieve scalar equivalence. When comparing questionnaire lengths, we found that 22 out of 24 scales reach metric equivalence and 19 out of 24 reach scalar equivalence. Thus, the majority of scales allow for the comparison of means and variances of latent variables across the different survey designs.
We believe these findings carry a positive message that implies relatively similar data quality and comparable data between face-to-face and mail/web mode designs and between long and short self-completion questionnaire versions. In this context, we view the implementation of a different mode design, namely shifting from an interviewer-administered design to a self-administered one, to be more problematic than shifting from a longer to a shorter questionnaire length. This is largely consistent with previous literature showing larger differences in measurement quality between interviewer and self-administered modes (Cernat et al., 2016; Klausch et al., 2013).
There were some indications that a single-mode face-to-face design has slightly higher reliabilities than a self-administered mixed-mode design, and that a full-length self-completion questionnaire has higher reliabilities compared to a matrix questionnaire for some items. We also found that systematic differences in the conditional means are often present. One can only speculate on their potential causes and implications for data analysis. This is a topic for future research. That being said, the differences between the two mode designs are relatively small, which may also be due to the extensive use of showcards in the face-to-face mode.
We point out some limitations of this study. Namely, we examined the EVS data for a single country. Examining the measurement quality of cross-national comparisons under different modes and questionnaire designs is a worthwhile topic for future research. Furthermore, alternative approaches to testing measurement equivalence and data quality could be considered. In the present study, we found differences in response rates between the surveys with the face-to-face survey having the lowest response rate. For a more detailed description of differences in sample composition between the designs, we refer to the study by Wolf et al. (2021). Based on our research questions, we focused on analyses of differences in measurement and utilized weighting to control for selective participation. However, future research could go one step further and try to feature both the measurement and the nonresponse simultaneously. Similarly, the weighting correction could be extended to take into account complex sample designs. Further, the EVS data did not include all the possible design options, for example, a short face-to-face survey, although we do believe the utility and prevalence of such a design would be limited in practice. Finally, we have also implemented incentive experiments (5€ prepaid vs. 10€ postpaid) in the EVS-Germany and further research could explore measurement implications between different monetary incentive types (conditional vs. unconditional) as existing research usually compares the use of incentives against no incentive.
Nonetheless, the present study undertook a comprehensive analysis of more than 100 items from more than 20 scales in one of the largest international surveys used in the social sciences. Furthermore, the study investigated data quality in a number of different ways: comparing distributional properties at the item and scale level, comparing various data quality indicators at the item and scale level, and measurement equivalence testing. Moreover, comparing both the mode design and questionnaire length brings important insights for survey practice. Often, shifting from single-mode or interviewer-administered data collection to self-completion, especially web-based, necessitates further adaptations that can be important. For example, web and mobile data collection may have questionnaire length or interview duration constraints that can impact how the survey is adapted. As such, the switch from a long face-to-face survey to a shorter web survey seems to be especially prevalent. Our findings can help survey practitioners to assess which design alterations are likely to result in more measurement differences compared to the previous design and which aspects of data quality may be affected.
Future research should aim to replicate our findings in other countries, other questionnaires, and other survey designs. Of special interest would be to understand the extent of the measurement differences between short and long questionnaires and to investigate potential causes for such differences. Also of interest for data users would be to study the kinds of biases they should expect if measurement equivalence (metric and/or scalar) does not hold across survey designs. This is especially relevant for longitudinal surveys (panel or repeated cross-sectional studies) that switch from face-to-face to self-completion or surveys where different population groups are interviewed using different mode designs (e.g., different countries in cross-cultural research).
Supplemental Material
sj-docx-1-smr-10.1177_00491241221140139 - Supplemental material for The Impact of Survey Mode Design and Questionnaire Length on Measurement Quality
Supplemental material, sj-docx-1-smr-10.1177_00491241221140139 for The Impact of Survey Mode Design and Questionnaire Length on Measurement Quality by Alexandru Cernat, Joseph Sakshaug, Pablo Christmann and Tobias Gummer in Sociological Methods & Research
Supplemental Material
sj-xlsx-2-smr-10.1177_00491241221140139 - Supplemental material for The Impact of Survey Mode Design and Questionnaire Length on Measurement Quality
Supplemental material, sj-xlsx-2-smr-10.1177_00491241221140139 for The Impact of Survey Mode Design and Questionnaire Length on Measurement Quality by Alexandru Cernat, Joseph Sakshaug, Pablo Christmann and Tobias Gummer in Sociological Methods & Research
Footnotes
Author's Note
The replication code for this paper can be found online at: ![]() . The data is publicly available through the GESIS data archive: ZA7500_v3-0-0 (https://doi.org/10.4232/1.13899) and ZA7502_v1-0-0 (https://doi.org/10.4232/1.13092) (the full citation can be found in the references). Joseph Sakshaug, Statistical Methods Research Department, Institute for Employment Research, Nuremberg, Germany, Department of Statistics, Ludwig Maximilian University of Munich, Munich, Germany.
. The data is publicly available through the GESIS data archive: ZA7500_v3-0-0 (https://doi.org/10.4232/1.13899) and ZA7502_v1-0-0 (https://doi.org/10.4232/1.13092) (the full citation can be found in the references). Joseph Sakshaug, Statistical Methods Research Department, Institute for Employment Research, Nuremberg, Germany, Department of Statistics, Ludwig Maximilian University of Munich, Munich, Germany.
Declaration of Conflicting Interests
The author(s) declared no potential conflicts of interest with respect to the research, authorship, and/or publication of this article.
Funding
The author(s) received no financial support for the research, authorship, and/or publication of this article.
Supplemental Material
Supplemental material for this article is available online.
Notes
Author Biographies
References
Supplementary Material
Please find the following supplemental material available below.
For Open Access articles published under a Creative Commons License, all supplemental material carries the same license as the article it is associated with.
For non-Open Access articles published, all supplemental material carries a non-exclusive license, and permission requests for re-use of supplemental material or any part of supplemental material shall be sent directly to the copyright owner as specified in the copyright notice associated with the article.