
Abstract
Social scientists increasingly use video data, but large-scale analysis of its content is often constrained by scarce manual coding resources. Upscaling may be possible with the application of automated coding procedures, which are being developed in the field of computer vision. Here, we introduce computer vision to social scientists, review the state-of-the-art in relevant subfields, and provide a working example of how computer vision can be applied in empirical sociological work. Our application involves defining a ground truth by human coders, developing an algorithm for automated coding, testing the performance of the algorithm against the ground truth, and running the algorithm on a large-scale dataset of CCTV images. The working example concerns monitoring social distancing behavior in public space over more than a year of the COVID-19 pandemic. Finally, we discuss prospects for the use of computer vision in empirical social science research and address technical and ethical challenges.
Introduction
Video data analysis promises to enrich the methodological toolbox of the social sciences (Nassauer and Legewie 2021), adding to traditional methods that offer a more coarse-grained picture of human behavior and interaction —including interviews (Jerolmack and Khan 2014; Small and Cook 2021) and on-site observations (Morrison, Lee, Gruenewald et al. 2016). On-site observation limits the data transparency and reproducibility of findings (Nassauer and Legewie 2021:141). In addition, some behavior is difficult, if not impossible, to record in a reliable manner when only having a single chance to observe it (Philpot, Liebst, Møller et al. 2019). This especially applies to interactions between multiple individuals. Further, retrospective interviews are not ideal for studying situational dynamics, in particular, because respondents have imperfect memories and cannot always recall details of the situations they are interviewed about (Nassauer and Legewie 2021:141).
What recorded video data brings to the stage is the ability to overcome the limitations of the human visual and cognitive system in processing high volumes of information at high speed. Recorded video data allows us to playback video data at any speed and conduct observations by as many observers as needed until measures are intersubjectively reliable.
A practical limitation is that watching, interpreting, and coding video data is time-intensive and error-prone for humans. With limited resources, large-scale analysis of video data is often not feasible. Automated coding of video data may provide a solution. Recent developments in computer vision have brought automated coding of video data within reach of the social sciences. Computer vision is well-suited to contribute to the analysis of nonverbal and physical aspects of social life, including how social action manifests itself in behavioral displays (Goffman 1971), the co-present numbers and densities of the interacting participants (Turner 2010:57ff), and their organization in time and space (Kendon 1990:209ff).
Computer vision technology holds potential for upscaling the empirical analysis of video data because the efficiency of automated coding allows much larger and more generalizable samples than currently feasible (Lindegaard and Bernasco 2018:177; Nassauer and Legewie 2021:150 − 51). For example, the computer vision algorithm developed in the current study automatically coded a total of 66,175 still frames sampled from video recordings. Because the human coders used 2.2 min on average to code a single still frame, the algorithm's coding made up for 2,446 h (i.e., 303 workdays of 8 h) of human coding time.
Thus, computer vision adds volume and speed to the processing of video data, facilitating larger samples and thus opportunities to better quantify phenomena and determine generalizable relationships between them. The combination of video data and computer vision technologies may, therefore, solve the trade-off between the behavioral micro-details acquired by human video observation and the practical sample size restrictions that are inherent to this method.
The current paper aims to familiarize social scientists with computer vision and to inspire them to adopt it in their own work. In section 2, we outline what computer vision entails, which techniques have been developed to enable automatic recognition of humans and of human behaviors, and for which type of research questions sociologists could use this method. In section 3, we offer a working example of the application of computer vision for studying social distancing in public space during the COVID-19 pandemic, and provide an overview of the steps necessary to develop an algorithm on a set of videos. In section 4, we elaborate on potential future applications of this algorithm, as well as on the challenges and limitations that social scientists should consider before adopting computer vision in their own work.
Computer Vision in Social Science
This section starts with a brief introduction to computer vision. It subsequently addresses the role that human assessment plays in evaluating the performance of computer algorithms and reviews the recent literature on two areas of research in computer vision: social signal processing and group and crowd analysis. Finally, we provide examples of studies that have addressed sociologically relevant questions with the aid of computer vision.
Computer Vision
Computer vision is a field of scientific inquiry that aims to develop techniques for computers to automate tasks that the human visual system can do. These tasks include processing, analyzing, and understanding digital images, or sequences of digital images (videos). The objective is to make computers perform the visual tasks as good as humans, not necessarily to make computers do it in the same way humans do.
A digital image consists of a matrix of picture elements (pixels), each of which is characterized by a color or a shade of grey. Typically, these are photographs, and thus two-dimensional projections of the three-dimensional world. Videos are sequences of images. When these are presented at a rate of more than 12 images per second, humans can no longer distinguish the individual images in the sequence. This gives the impression of an uninterrupted stream of visual information, possibly including smooth movement.
Image classification and object detection are the most common applications of computer vision. Image classification is the task of determining, from a set of predefined alternatives, which label best describes an image (e.g., whether the image shows a street light or a traffic light). Object detection is the task of determining which objects are visible in an image (e.g., a traffic light, a motorcycle, and a human being), and marking wherein the image they are located (e.g., by defining lines around their boundaries).
Most of the visual tasks in computer vision are easy for humans but have proven very difficult for computers. An everyday example is the CAPTCHA 1 , a visual puzzle that some websites use to identify the user as a human. Some of these puzzles require the user to locate common objects like traffic lights or motorcycles in an image. Most humans solve these visual puzzles in seconds, but computers do not. However, the promise of computer vision is that once computers do become successful at a task, they can perform it at great speed and low cost.
Computer vision is a subfield a machine learning, a method of analysis that automates model building with very little human intervention or instruction. It is common to distinguish between supervised learning (where the computer learns from examples constructed by humans) and unsupervised learning (in which the computer automatically creates clusters in data or reduces the dimensionality of the data).
The main computational technique that has spurred recent development in computer vision is deep learning (LeCun, Bengio and Hinton 2015). It is a class of algorithms that rely on computing systems called neural networks to detect patterns in data. When a neural network is provided with a large number of example images that have been classified by humans, it is able to determine common patterns in those examples and to use this ‘knowledge’ to independently classify future unclassified images. 2
Examples of practical areas where computer vision is applied are medical diagnosis (e.g., detecting malignant tumors, see Shia and Chen 2021), surveillance (e.g., by face recognition, see Harikrishnan, Sudarsan, Sadashiv et al. 2019), and self-driving cars (e.g., detecting the presence of pedestrians in traffic situations, see Hasan, Liao, Li et al. 2020). Our example application in the present paper uses a customized computer vision algorithm for pedestrian detection.
Human Annotation
To evaluate and improve algorithms, we need feedback on how well they perform their tasks. Deep learning techniques in particular need large numbers of annotated images to train their neural networks in all stages of development, including the initial training of the model. Feedback requires a ground truth to serve as a performance benchmark. To know whether a computer performs this task correctly, a human coder—performing the same task as the algorithm—provides the ground truth. The act of a human viewing and coding images is called annotation. Without annotated images there is no way to evaluate the performance of computer vision algorithms. Because human annotators can make errors, interrater reliability assessment of human annotation is required to verify that annotation error margins are small.
An annotation tool is a piece of software that allows human coders to identify and mark locations and properties of the image objects that need to be detected and classified. Because different tasks require different kinds of annotations, there are many different annotation tools tailored to specific tasks. Some annotation tools are freely available online (Dutta and Zisserman 2019; Forsyth and Ponce 2012: 513 − 517).
Annotation tools typically provide four main functions. First, they present the visual material to be coded to the human annotator, one at a time. This may include options like zooming in, and moving the viewing window across the image horizontally or vertically. For video clips, it may also include options for rewinding, repeating, and setting the speed (i.e., slow-motion). Second, they allow the human annotator to mark the location of objects. Locations of objects are typically identified using bounding boxes. A bounding box is the smallest rectangle that completely includes the detected object. Third, labels or ‘tags’ can be attached to identified objects to record their observed properties. For example, if the task is to read vehicle number plates, the tag would contain the number on the plate. Finally, the annotations are stored so that they can be used to evaluate the performance of the computer algorithm.
Computer vision scientists and practitioners train and evaluate their algorithms on benchmark datasets of images annotated by humans. Many benchmark datasets relevant for detecting persons have recently been created in the context of software development for autonomous driving, where quick and reliable automated detection of pedestrians and other traffic participants is crucial to prevent collisions (Cao, Pang, Xie et al. 2021; Hasan et al. 2020). Benchmark datasets typically contain the original images and their annotations: the validated characteristics of successfully detected objects, including at least their bounding boxes and possibly also additional attributes.
Performance Evaluation
As explained in the previous section, to assess the performance of a computer vision algorithm, its outcomes are quantitatively compared to the ground truth as defined by human coders in annotated datasets. Depending on the vision task at hand, various performance measures can be used. For binary classification (e.g., to decide whether there is a person visible anywhere in an image), performance can be measured with simple statistics like precision and recall. If the task is more complex, such as in object detection (e.g., to find in an image all persons and their locations), the performance assessment will have to weigh the amount of inaccuracy in localization as well. Common performance assessment statistics in these situations include the log-average miss rate, average precision, and the Jaccard index (Cao et al., 2021).
Advances in Human Behavior Recognition
Within the rapidly developing field of computer vision, we distinguish two research lines that hold particular promise for social science research: social signal processing (Burgoon, Magnenat-Thalmann, Pantic et al. 2017; Vinciarelli, Pantic and Bourlard 2009) and the recognition of persons, groups, and crowds (Murino, Cristani, Shah et al. 2017b; Zitouni, Sluzek and Bhaskar 2019).
Social signal processing
Social signal processing concerns the use of computer vision techniques for the extraction of emotional and behavioral cues in individuals, dyads, and small groups based on the analysis of gestures, body posture, gaze direction, and facial expressions. This research generally applies video recordings from eye-level cameras collected in controlled environments. Thus, it relies on recordings with good illumination, relatively stable camera angles and zoom-levels, subjects in frontal view, few occlusions (no objects or other subjects blocking the view), and audio recordings accompanying the visual information.
Many studies of social signal processing focus on automatic emotion recognition from facial expressions (for overviews, see Canedo and Neves 2019, Martinez 2019) or body postures (for overviews, see Kleinsmith and Bianchi-Berthouze 2013; Stephens-Fripp, Naghdy, Stirling et al. 2017). Advancements have been made to distinguish between spontaneous and posed (deliberately produced) behaviors (Bartlett, Littlewort, Frank et al. 2014; Valstar, Gunes and Pantic 2007; Yang, Hossain, Gedeon et al. 2020) and to detect deception (Bruer, Zanette, Ding et al. 2020; Tran, Sen, Haut et al. 2020; Zanette, Gao, Brunet et al. 2016).
Although the majority of the studies examined individual-based emotion detection, the emotion analysis of groups has gained interest in recent years (see overview by Veltmeijer, Gerritsen and Hindriks 2021). Other efforts to assess social relationships have focused on interactional traits such as warmth and dominance (Black, Katsamanis, Baucom et al. 2013; Hung, Jayagopi, Yeo et al. 2007; Jayagopi, Hung, Yeo et al. 2009; Sanchez-Cortes, Aran, Mast et al. 2012; Zhang, Luo, Loy et al. 2018) or on role categorizations such as the distinction between kinship, friendship, romantic, and professional relationships on still images (Li, Wong, Zhao et al. 2020; Sun, Schiele and Fritz 2017) and on video clips (Lv, Liu, Zhou et al. 2018).
Finally, projects have started to enable the (semi-)automatic measurement of social cohesion within small groups based on non-verbal social cues, such as gaze, head nods, laughter and turn taking (Hung and Gatica-Perez 2010; Kantharaju, Langlet, Barange et al. 2020; Walocha, Maman, Chetouani et al. 2020).
Recognition of persons, groups, and crowds
In computer vision, ‘group and crowd analysis’ concerns the detection of persons and groups within crowds, and of the tracking of the velocity, direction, and other movements of persons, groups, and crowds. This research line uses real-life video recordings from cameras at elevated viewpoints, such as surveillance cameras attached to upper levels of buildings or to unmanned aerial vehicles (i.e., drones) and satellite cameras.
Within this line of work, the detection and tracking of persons still represents one of the core challenges (Hasan et al. 2020; Murino, Cristani, Shah et al. 2017a). A related challenge is pose estimation, which involves locating the individual joints of the human body (right elbow, left wrist, etc.) in images containing multiple persons (Cao, Hidalgo, Simon et al. 2019). At the same time, the field has started to explore new venues of research such as the identification of small groups within crowds (Vascon and Bazzani 2017) based on the proximity between individuals, similarities in trajectory patterns (Ge, Collins and Ruback 2012; Hu, Zhang, Song et al. 2021), mutual poses (Tran, Bedagkar-Gala, Kakadiaris et al. 2013) and the various formations groups can take, as indicated by members’ head and body orientation. For example, while moving in a crowd, group members can walk side by side or in a V-shaped pattern, depending on the density in the crowd (Moussaïd, Perozo, Garnier et al. 2010). Groups that stand still in conversation can display side-by-side, face-to-face, L-shaped, and circular formations (Setti, Russell, Bassetti et al. 2015).
Building on this knowledge, scholars have also been able to automatically distinguish leaders from followers within such small groups, based on their physical centrality and their influence on the physical dynamics within the groups (Solera, Calderara and Cucchiara 2017; Yu, Lim, Patwardhan et al. 2009).
At the crowd level (for overviews, see Grant and Flynn 2017; Varghese and Thampi 2018), researchers have worked at ways to automatically assess, for example, the density of the crowd (Almagbile 2019; Rodriguez, Sivic and Laptev 2017), the level of excitement in the crowd (Baig, Barakova, Marcenaro et al. 2014; Conigliaro, Rota, Setti et al. 2015; Varghese and Thampi 2018), and the presence of anomalies in the crowd (for overviews, see Nayak, Pati and Das 2021; Sodemann, Ross and Borghetti 2012; Tripathi, Jalal and Agrawal 2018). Removing crowd size limitations of prior methods, Cruz and González-Villa (2021) proposed a method to estimate crowd sizes on high-resolution images from gigapixel cameras, in which images typically contain many thousands of individuals.
Two related areas of inquiry are activity recognition, in which human actions are automatically recognized and classified (for literature reviews, see Herath, Harandi and Porikli 2017; Sigurdsson, Russakovsky and Gupta 2017) and event recognition, which aims at recognizing and classifying events, including social events (for a literature review, see Tzelepis, Ma, Mezaris et al. 2016). Based on sudden temporal and spatial motion changes, it is possible to detect instances of violence (Chang, Krahnstoever, Lim et al. 2010; Mohammadi, Galoogahi, Perina et al. 2017; Roman and Chávez 2020; Tripathi et al. 2018), panic-driven events (Haque and Murshed 2010), and snatch theft (Roy and Mohan C 2018) and various other specific criminal actions (Sultani, Chen and Shah 2018).
Promises for Sociology
Despite their potential, few scholars have applied computer vision techniques to theory-driven sociological research. Most studies appear to focus on practical applications rather than on the advancement of sociological theory. Without sketching pipe dreams, we discuss five potential research areas that could be addressed with the aid of currently available computer vision techniques.
First, computer vision enables the large-scale examination of the link between social structural categories (e.g., assumed gender, age, ethnicity) and behavior in public space. For example, based on video footage Stipancic, Zangenehpour, Miranda-Moreno et al. (2016) found that male-presenting cyclists were less likely than female-presenting cyclists to be involved in near-crash events with vehicles. Zhang, Chen and Li (2020) analyzed the contents of geo-tagged social media photos and found differences between Asian, American, and European tourists in their preference for architecture, natural scenes, plants, food, and entertainment. Dietrich and Sands (2021) analyzed traffic camera footage of pedestrian behavior to examine inter-group racial avoidance. Obviously, the hazards of non-inclusive categorization as well as possible errors in assigning category-membership that plague human observers, also applies to algorithms.
Second, computer vision could aid in the identification of groups and their informal leaders based on recorded informal behavior. For example, recordings from a high school canteen during lunch break or a prison courtyard could be used for this purpose (Yu et al. 2009). Sociologists currently rely heavily on questionnaires to obtain sociometric information (for recent meta-analyses on social network studies, see Gallupe, McLevey and Brown 2019, Ivaniushina and Titkova 2021), and computer vision might provide a useful addition (or even alternative) to this method.
Third, computer vision techniques could be used to characterize outdoor behavior patterns in neighborhood research. Such techniques have already been used in neighborhood research to map land use and other physical neighborhood conditions, often relying on Google Street View or satellite imagery (Khorsidi, Carter, Mohler et al., 2021; Naik, Kominers, Raskar et al., 2017). Such work could be expanded with observations of objects (such as cars, Gebru, Krause, Wang et al. 2017) and pedestrians at those locations, which could add information about demographics and socioeconomic status. Also, advancements are being made in ‘emotional computing,’ which uses facial expression-based emotion detection on geo-tagged user-generated content to assess trends in emotions at specific locations (Huang, Fei, Kwan et al. 2020; Liu, Yuan and Zhang 2020). This is promising for research on the link between people's surroundings and their feelings of safety or well-being.
Fourth, the automatic detection of nonverbal behavior in dyadic or group interactions has been applied in experimental set-ups with fixed cameras to distinguish liars from non-liars among children (Bruer et al. 2020) and to predict the success of learning in student-teacher dyadic interactions (Won, Bailenson and Janssen 2014), the outcome of salary negotiations (Li, Curhan and Hoque 2018), and the effectiveness of social skills training (Chen, Chang, Tian et al. 2015).
Fifth and finally, the automatic detection of anomalies within crowd behavior could aid sociological research by identifying rare but interesting events from large amounts of video footage, to select for further (manual) examination. This would (Jerolmack and Khan 2014) allow researchers to seek out footage of, for example, violent events, panic-driven behavior, and crime (Sultani et al. 2018).
The sociological research areas and questions to which computer vision may contribute have existed for decades, and each of the studies mentioned in this section could also have been conducted without a camera or a computer vision algorithm. What the camera brings to the sociological toolbox is the opportunity to measure people, behavior, and interactions reliably and objectively without having to rely completely on verbal accounts from surveys or interviews (Jerolmack and Khan 2014). This is important because verbal accounts are not always in line with recorded details of interactions. What computer vision brings to the table is the ability to scale up the empirical analysis because the efficiency of automated coding allows much larger and more generalizable samples than would be possible in the absence of computer vision (Lindegaard and Bernasco 2018:177; Nassauer and Legewie 2021:150 − 51). A specific instance of the ability to scale up is the automated detection of rare situations of specific substantive interest (e.g., human conflict incidents, traffic accidents), where computer vision techniques allow preprocessing large video collections to find, classify and select video fragments, and thereby greatly reduce the need for manual inspection. Computer vision can also be used to protect the privacy of depicted individuals by modifying their physical attributes on the target image without modifying the essential elements of the behavior that is of substantive interest (Klomp, van Rijn, Wijnhoven et al. 2021). This application of computer vision may also serve researchers who do not utilize other computer vision techniques, but who are interested in protecting the privacy of people depicted on images.
To put the promises of computer vision for sociological research into practice, it is important to provide concrete examples of how computer vision methods can be used to address sociological research problems, and in particular, which steps are needed to upscale data collection and analysis while maintaining appropriate controls on data quality. Our contribution provides such a working example.
Working Example on Social Distancing
The present section describes the development and application of a computer vision algorithm. The purpose of the algorithm is to help describe public compliance with social distancing directives over the course of the COVID-19 pandemic. After introducing the substantive research question, we describe how ground truth was established with the help of human coders, how the algorithm was developed and applied, and how the results were used to plot trends in social distancing over time.
Research Problem
Social distancing has been a critical measure to mitigate the spread of viral infections, including the COVID-19 virus (World Health Organization 2009). Across the globe, authorities have urged citizens to adapt their lifestyles and to keep a physical distance from other people. Although fear of infection may offer a strong incentive to comply with such directives, compliance is still difficult to maintain because it requires constant awareness and coordination and because it goes against common rituals in everyday practices in many societies (Hall 1966:131 − 63; Sorokowska, Sorokowski, Hilpert et al. 2017).
Whether people are willing and able to adapt their spatial and social behavior to new situations to support a collective good, and which factors affect the extent to which they do, are important questions of broader significance than the current pandemic (Collins 2020). For example, researchers have linked such compliance to cultural differences in strictness of adherence to social norms, finding that ‘cultural tightness’ can be an evolutionary advantage because it helps groups to cooperate faster when under threat (Gelfand et al., 2021). Social distancing behavior also reflects people's attitudes towards others and can, therefore, be used to assess interpersonal relationships (Hall, 1966: 113 − 130) and responses to out-group members (Bogardus 1933; Dietrich and Sands 2021).
From a practical standpoint, authorities need information on social distancing compliance to inform their policy decisions because the effectiveness of social distancing directives in reducing the spread of viruses depends on the cooperation of the public (Bauch and Galvani 2013). There is, however, little reliable systematic evidence on whether people keep a distance from others during epidemics.
In the current study, we develop and test an algorithm for automatically detecting the presence of humans and their compliance with social distancing rules from CCTV video recordings. We focus on the extent to which people keep a 1.5-meter distance from others in public space. The 1.5-meter threshold is advised in The Netherlands, where our study takes place. The few studies that have also studied social distancing behavior using video data (Pouw, Toschi, van Schadewijk et al. 2020; Rahim, Maqbool and Rana 2021; Zuo, Gao, Kurkcu et al. 2021) focus primarily on the required computer science techniques, and do not speak to a social science audience. The aim of the present study was to measure and monitor, over the course of the pandemic, the level of compliance to social distancing directives in urban public space. In doing so, we aim to contribute to the literature on social distancing (Hall, 1966) as well as to the public health literature on non-pharmaceutical measures in epidemics (Fong, Gao, Wong et al. 2020; World Health Organization 2009).
Process Overview
Because computer vision has only recently emerged in social science research, there are usually no out-of-the-box computer vision algorithms available that can be applied immediately to help answer substantive research questions. Instead, the algorithms must be developed from scratch, or existing algorithms must be adapted. Even if successful algorithms are available, they have been trained on specific datasets, and would still need to be validated on a sample of the empirical data that inform the research question at hand.
In our application of computer vision for measuring social distancing compliance, we distinguished three stages. These stages are summarized in Figure 1. Each stage consists of a series of smaller steps that are described in the following sections.
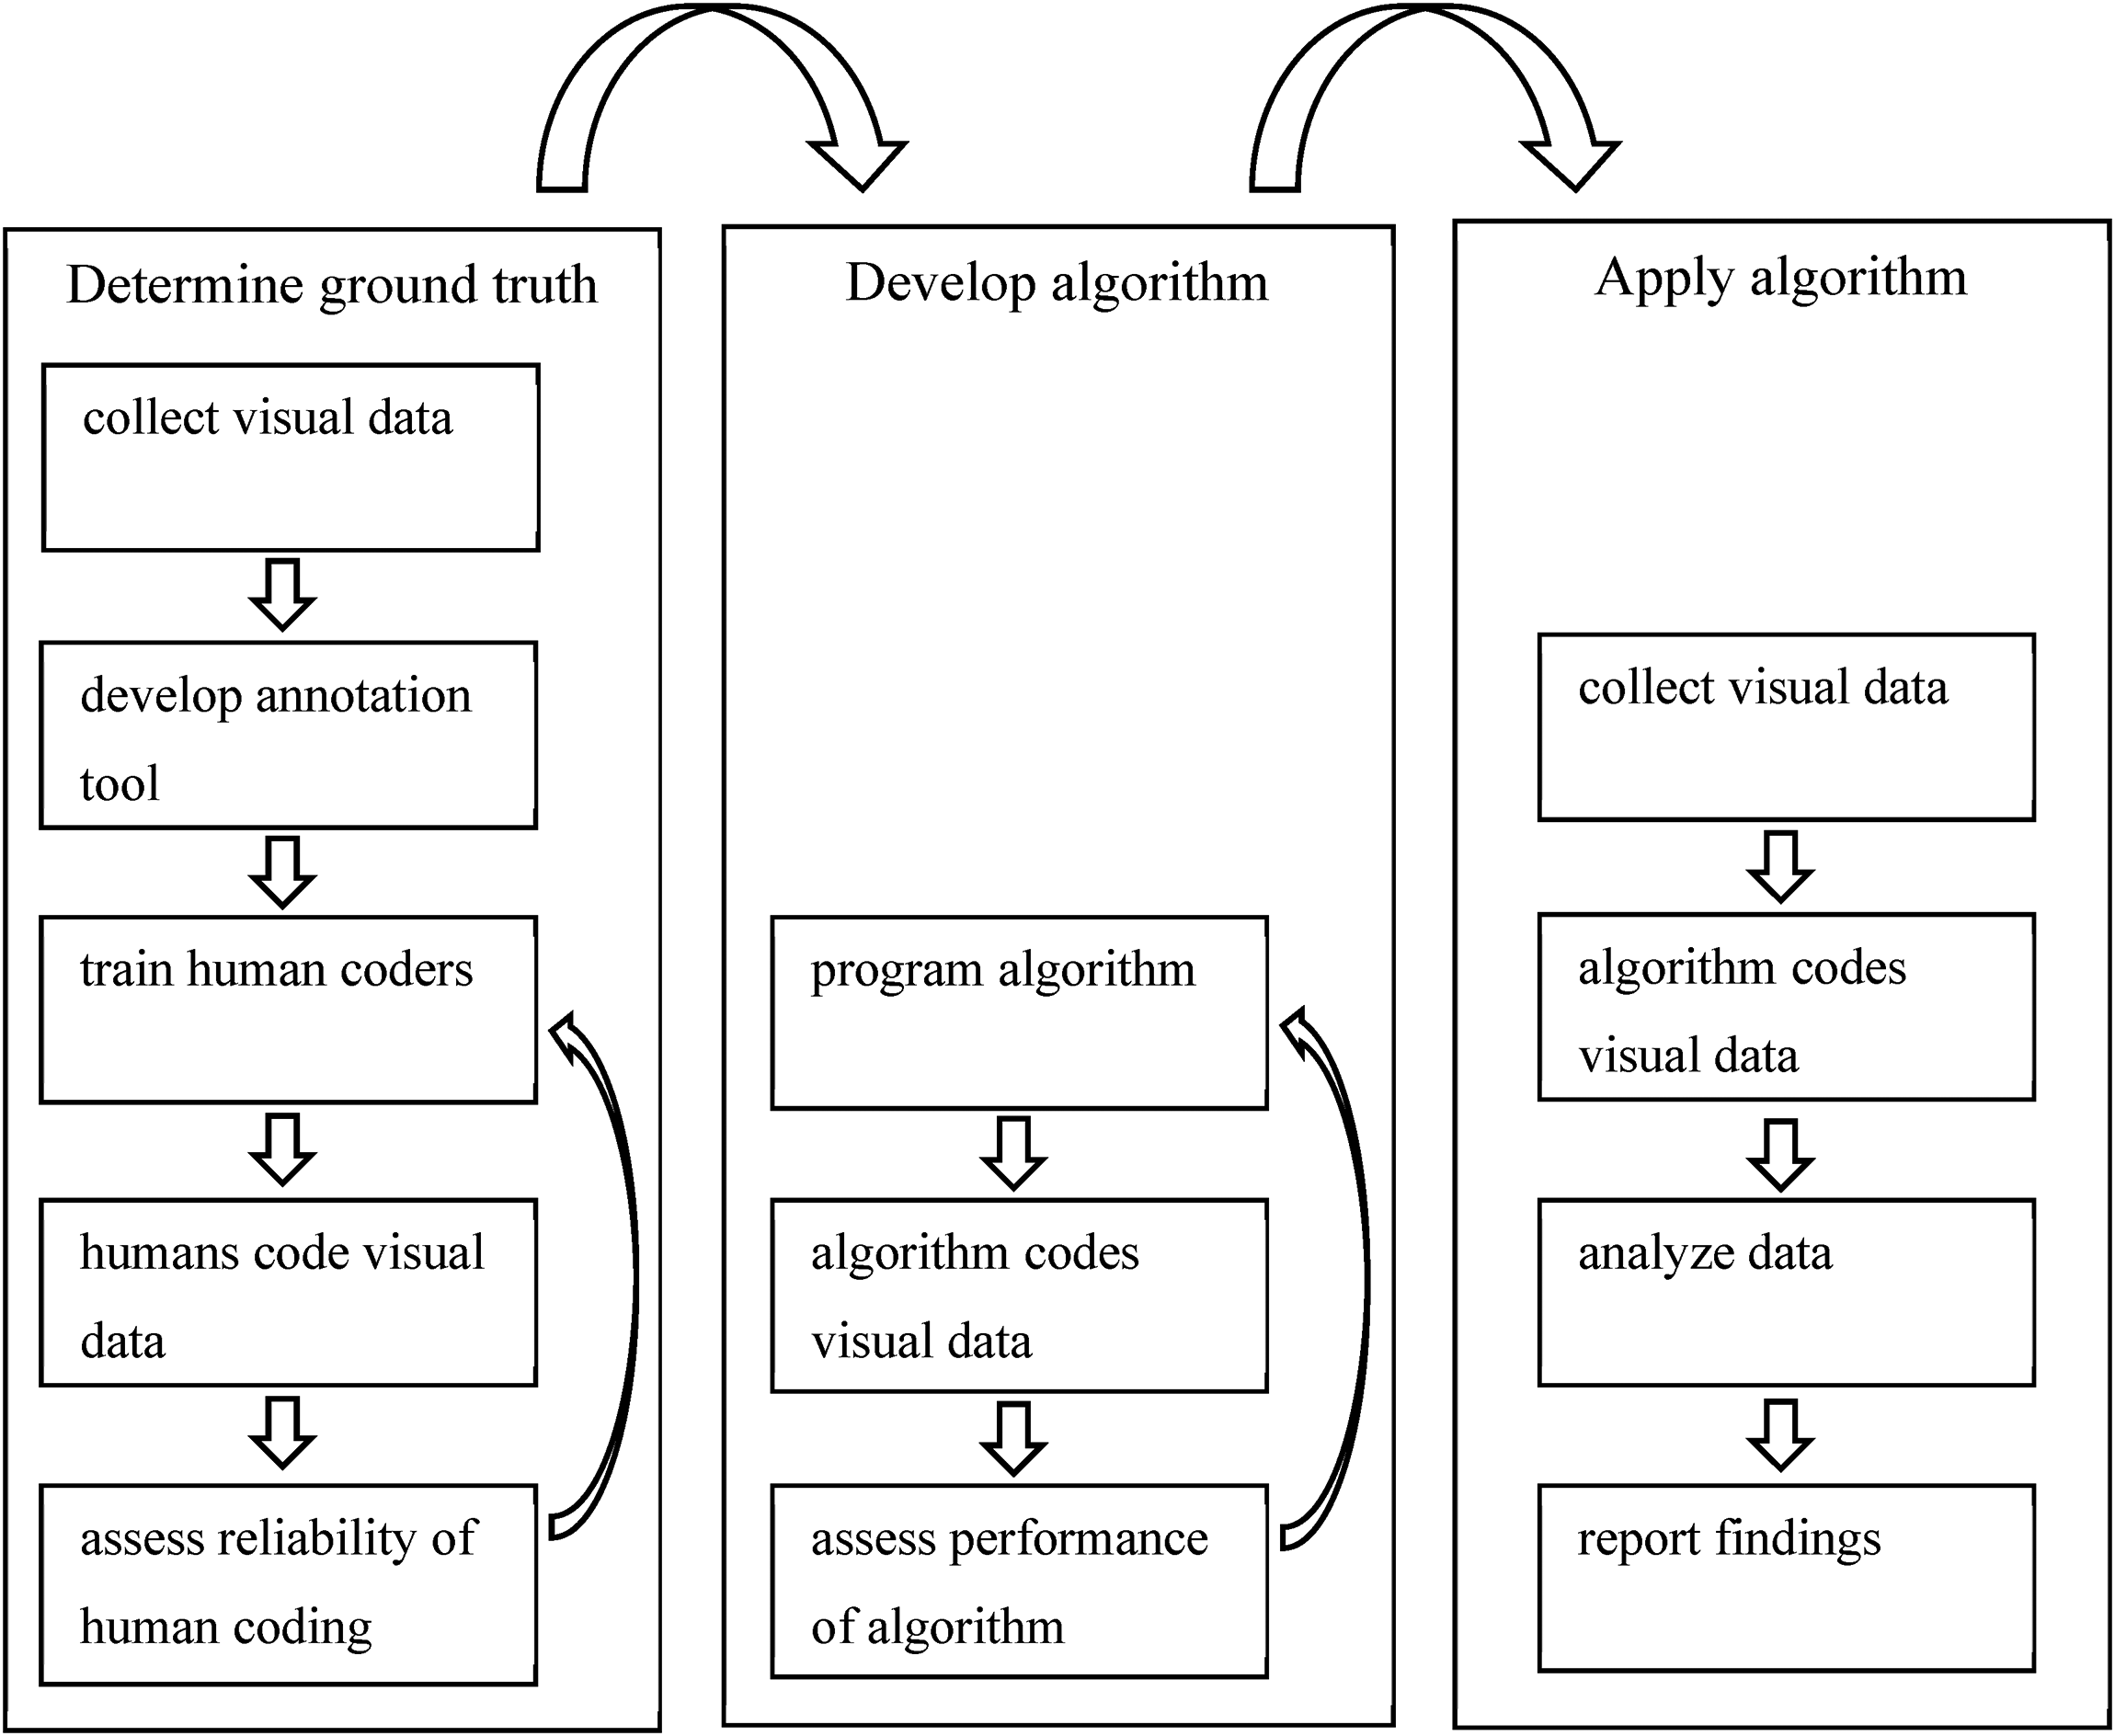
Schematic overview of the process.
Determine Ground Truth
To assess whether a computer vision algorithm does what it is supposed to do, we need a ground truth that functions as a benchmark. Because the algorithm is to replace a human observation task, human observation is the benchmark against which we evaluate the performance of algorithms.
Collection of video data
Data for the development of the algorithm were sampled from 1,059 recordings, captured by 53 municipal surveillance cameras in Amsterdam, the Netherlands. These recordings were collected over the course of 7 weeks during the COVID-19 outbreak, from April 9 to May 24, 2020. This period was chosen because the corresponding video recordings were available at the time. The recordings are provided by the municipality of Amsterdam (the owner of the recordings), and were collected with the help of the Amsterdam Police Department (where the recordings are processed). The surveillance cameras are located in areas where the municipality deems supervision necessary. They are relatively crowded areas, both in the city center and in more peripheral neighborhoods, characterized by concentrations of retail businesses and public transportation hubs. Recordings were available between 9 AM and 8 PM on Thursdays, Saturdays, and Sundays. Securing, storing, and converting a complete seven-day coverage would require more human and computer resources than the police could offer. Further, based on prior work on time use (e.g., Wikström, Oberwittler, Treiber et al. 2012), the three days were selected under the expectation that both days of the weekend and a weekday would allow a representative sample.
The video surveillance system stores recordings in a proprietary format (G64X) to prevent image tampering. To allow further processing, all recordings were first converted to the more common non-proprietary MP4 format using a tool (Genetec Player) provided by Genetec. 3
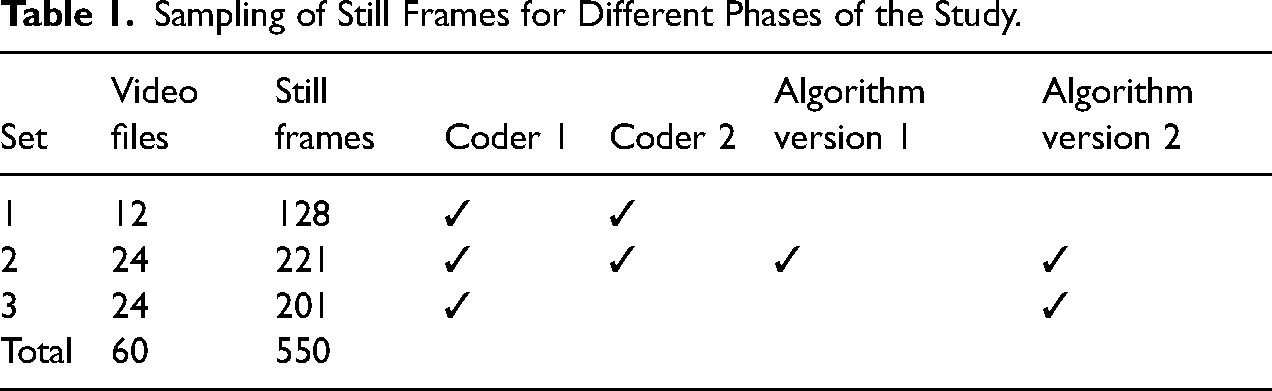
For both the determination of ground truth and the algorithm performance evaluation, we randomly sampled 60 recordings from the total collection of 1059 recordings. As the purpose of the research did not require that we measured the presence of people and social distancing per second or per minute, we sampled and extracted still frames from the 60 video recordings at full hours between 9 AM and 8 PM. The sample size of 60 was based on the expectation that it would yield 500–600 still frames. Because it was estimated that 100 still frames would be sufficient to determine inter-coder reliability, this sample of 60 recordings would allow for at least four iterations of improving inter-coder reliability should that be necessary.
For transparency, and to acknowledge and emphasize that trial and error were involved in setting up the research, we note that in an initial setup that was later discarded, we (1) used a single coder and thus did not code inter-coder reliability, (2) included an additional measure of ‘group formation’ in addition to ‘social distancing violation’, (3) instructed the human coder and the algorithm to count numbers of people, social distancing violations and group formation during a 5 min interval every full hour, and (4) did not use an annotation tool (coders and algorithm exported numbers into a spreadsheet). The difficulty of defining clear and workable observation rules for the coder and the simultaneous realization that inter-rater reliability was to be tested, as well as disappointingly low outcomes of the performance tests, made us redesign the procedures.
Because due to technical issues not all recordings contained information about all 12 h between 9AM and 8 PM, the sample of 60 recordings included 550 still frames in total. A practical advantage of sampling still frames from video recordings is that the coding of still frames is much less time-consuming than the coding of a video stream (an argument that is obviously more salient for human coding than for automated coding). Table 1 shows the subdivision into three subsets. As explained below, the purpose of the subdivision is to separate data used for training from data used for testing.
Sampling of Still Frames for Different Phases of the Study.
Annotation tool
To facilitate and safeguard the reproducibility of the human coding process, an annotation tool was developed. The tool presented the human coder with a still frame on the screen. The coder was instructed to indicate each human being observed on the screen by marking their head with a red dot. Further, if the coder observed two or more people who were within 1.5-meter proximity of each other, they were marked with a yellow line between the red dots. After marking all visible human beings and all 1.5-meter distance violations, the coder moved on to the next still frame and repeated the process. The marked people, the distance links between them, and their location on the screen were automatically saved for each still frame. An example screen is presented in Figure 2.
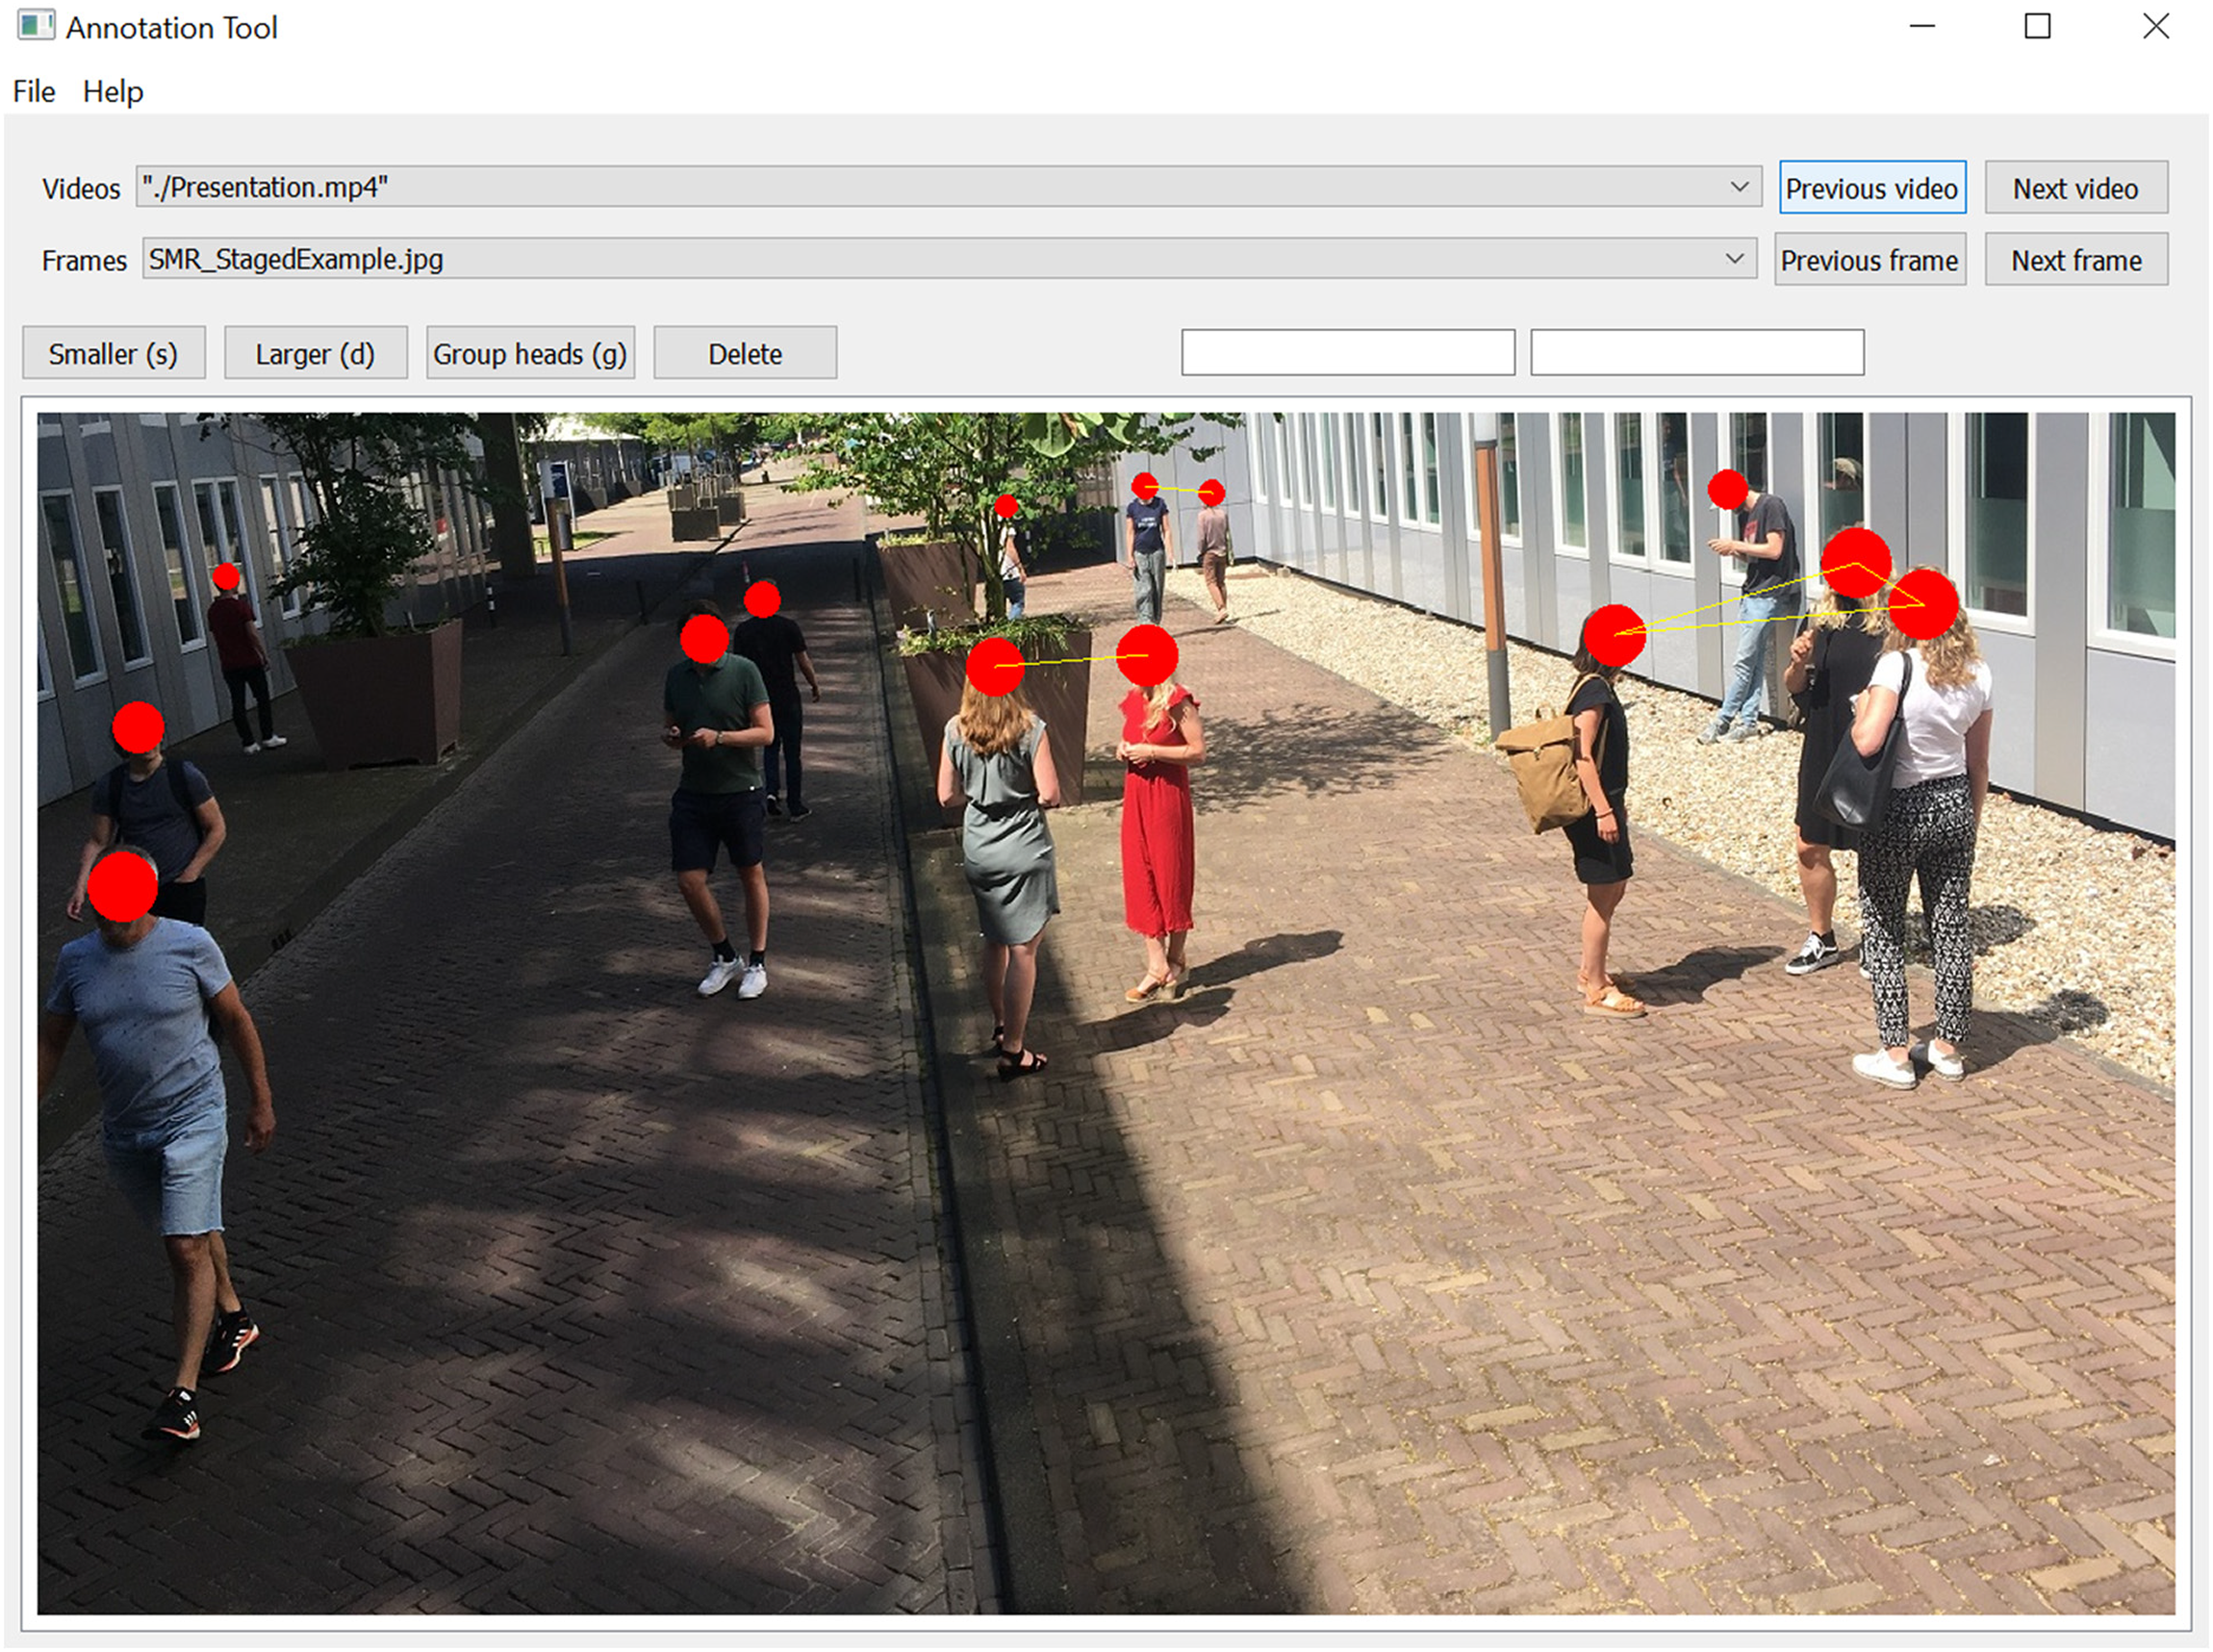
Annotation tool interface. This is a staged scene. All depicted individuals provided written consent for this image to be used for the present purpose. Privacy regulations and data access agreements do not allow sharing recorded CCTV footage.
Outcome measures
The visual task of both the human coders and the computer vision algorithm was to detect all instances of humans, to locate each of them in the image and to assess whether pairs of humans were at less than 1.5-meter from each other. We used two simple outcome measures to assess performance, both for the human coding and the algorithm. They are the number of people present and the number of social distancing violations. Using only counts and ignoring locations does not mean that recording locations of persons and violations is redundant. During training and development, recorded locations can help to detect the sources of any potential discrepancies amongst human coders or between human codings and automated codings.
Training human coders
To determine a ground truth, two human coders were trained to independently assess the still frames with the annotation tool. Both coders received a 3-day training in which they were instructed on how to use the annotation tool for identifying and marking people and 1.5-meter distance violations. During this training, the human coders first practiced the coding of several frames together. Then, they coded several frames independently and extensively discussed the discrepancies. In total, 128 still frames were coded during the training phase (Set 1 in Table 1). Most of the discrepancies occurred when one or both of the coders experienced difficulty with distinguishing humans from stationary objects, such as trash-bins or mannequins. To solve this, the coders were allowed to look at different still frames obtained from the same video, to determine if an object was stationary (i.e., whether it moved between still frames). To assess whether two people were 1.5 meter apart, the coders were provided with examples of reference objects often visible on the still frames and their respective sizes (e.g., bikes, tiles on the street, sidewalk signs, benches, markings of a pedestrian crossing). The coding instructions were finalized after the training and applied in the next phase. The finalized coding instructions are provided in Supplemental Material 1.
Inter-coder reliability
To determine whether the human coding was sufficiently reliable to serve as a ground truth for the algorithm evaluation, a subset of the still frames (Set 2 in Table 1, N = 221 frames) was double-coded by having the two human coders assess them independently. 4
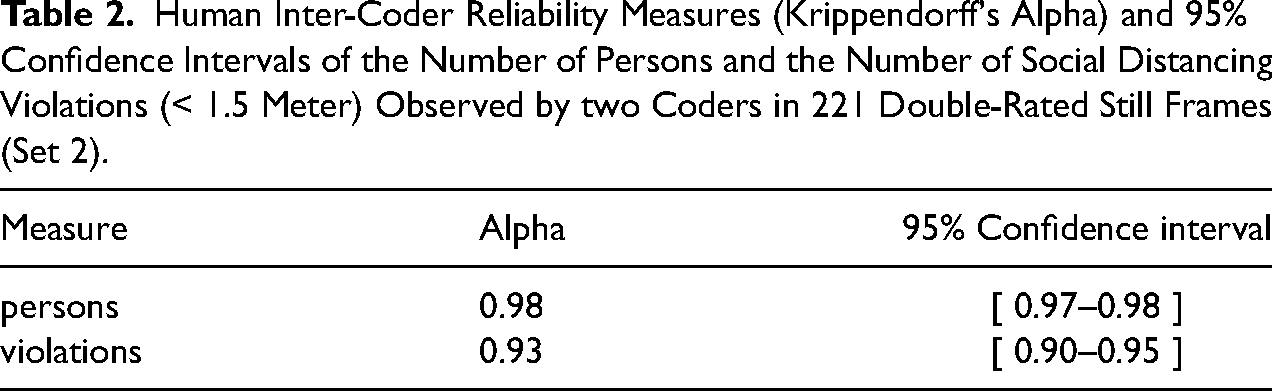
Inter-coder reliability was calculated for both the number of people and the number of social distancing violations (< 1.5-meter proximity) that coders observed in the still frames. Both variables were treated as interval-level variables, for which inter-rater reliability can be determined with Krippendorff's alpha (Krippendorff, 2004; 2011). Krippendorff's alpha has a theoretical range between −1 (perfect disagreement between coders) and 1 (perfect agreement between coders), with 0 indicating the absence of any relation between the observations of the coders. The decision on a minimally acceptable level of alpha depends on the costs of drawing invalid conclusions. Krippendorff (2004:241) recommends to only rely on variables with alpha reliabilities above .80, and to consider only variables with alpha between .67 and .80 for drawing tentative conclusions.
Table 2 reports the Krippendorff's alpha estimates and their 95% confidence intervals for the coding. The alpha's reflect almost perfect agreement between the two coders for both the person counts (.98) and the violation counts (.93) and are well above the threshold of .80 recommended by Krippendorff (2004:241). This even holds for the lower boundaries of their 95% confidence intervals (.97 and .90, respectively).
Human Inter-Coder Reliability Measures (Krippendorff's Alpha) and 95% Confidence Intervals of the Number of Persons and the Number of Social Distancing Violations (< 1.5 Meter) Observed by two Coders in 221 Double-Rated Still Frames (Set 2).
Based on these results, we concluded that the human coding was sufficiently reliable to serve as ground truth for the evaluation of the algorithm. Consequently, the still frames in Set 3 were only coded by one of the coders (see Table 1).
Development of the Algorithm
The task for the algorithm was the same as the task for the human coders and thus twofold: to detect all persons in the still frame and to identify all instances where two people were closer to each other than 1.5 meter. The first task, identifying persons, is the main element of existing algorithms for ‘pedestrian detection.’ These algorithms aim to identify pedestrians in traffic situations. Their current development is targeted towards the realization of self-driving vehicles, which must be able to identify objects in traffic and react adequately to them. Therefore, rather than reinvent the wheel, we decided to use an existing algorithm for pedestrian detection and extend it with a capacity to estimate distances between detected pedestrians.
Programming the detector
In the field of pedestrian detection, there are many different algorithms, and also many different annotated datasets that provide a ground truth for performance testing. The algorithm that was used in the present study builds on the Pedestron algorithm (Hasan et al., 2020), which is a deep learning algorithm that has been developed specifically for pedestrian detection and that performs well on multiple popular annotated datasets for pedestrian detection. We compared several instances of the Pedestron algorithm trained on different datasets, and decided to apply the version that was used in the Pedestrian Detection track of the WIDER Face and Person Challenge 2019 (an open competition between algorithms), as it provided the best results on the public datasets used in this challenge and on our test dataset.
Because the Pedestron algorithm only detects people, but not the distances between them, it had to be extended. Estimating a three-dimensional distance from a two-dimensional projection is not trivial. To assess the distance between two people, we estimated a linear regression model. This model was based on two simplifying assumptions. First, based on population statistics, we assumed that all persons are 1.70 meter tall. Second, we assumed that there is a linear relationship between the y-coordinate of the position of a person in a still frame and the size of that person depicted in the image. In other words, people closer to the camera appear larger in the image than people further away from the camera.
With information about the size of the detected persons from a large number of still frames (taking into account the different cameras, camera view angles, camera view directions, and camera zoom levels), we estimated a linear model that gave the relationship between the y-coordinate in an image and the height of a person. The model was calculated with the still frames (Set 2) plus, for each of these still frames, additional frames from the same video with 1.2 s interval. This linear model provided an estimate of the distance between two detected persons who are located perpendicular to the camera view (panel A in Figure 3). It is more difficult to determine the distance between persons in the direction of the camera view (panel B in Figure 3) because the underlying mathematical problem is underdetermined; there are more unknowns than there are data. 5
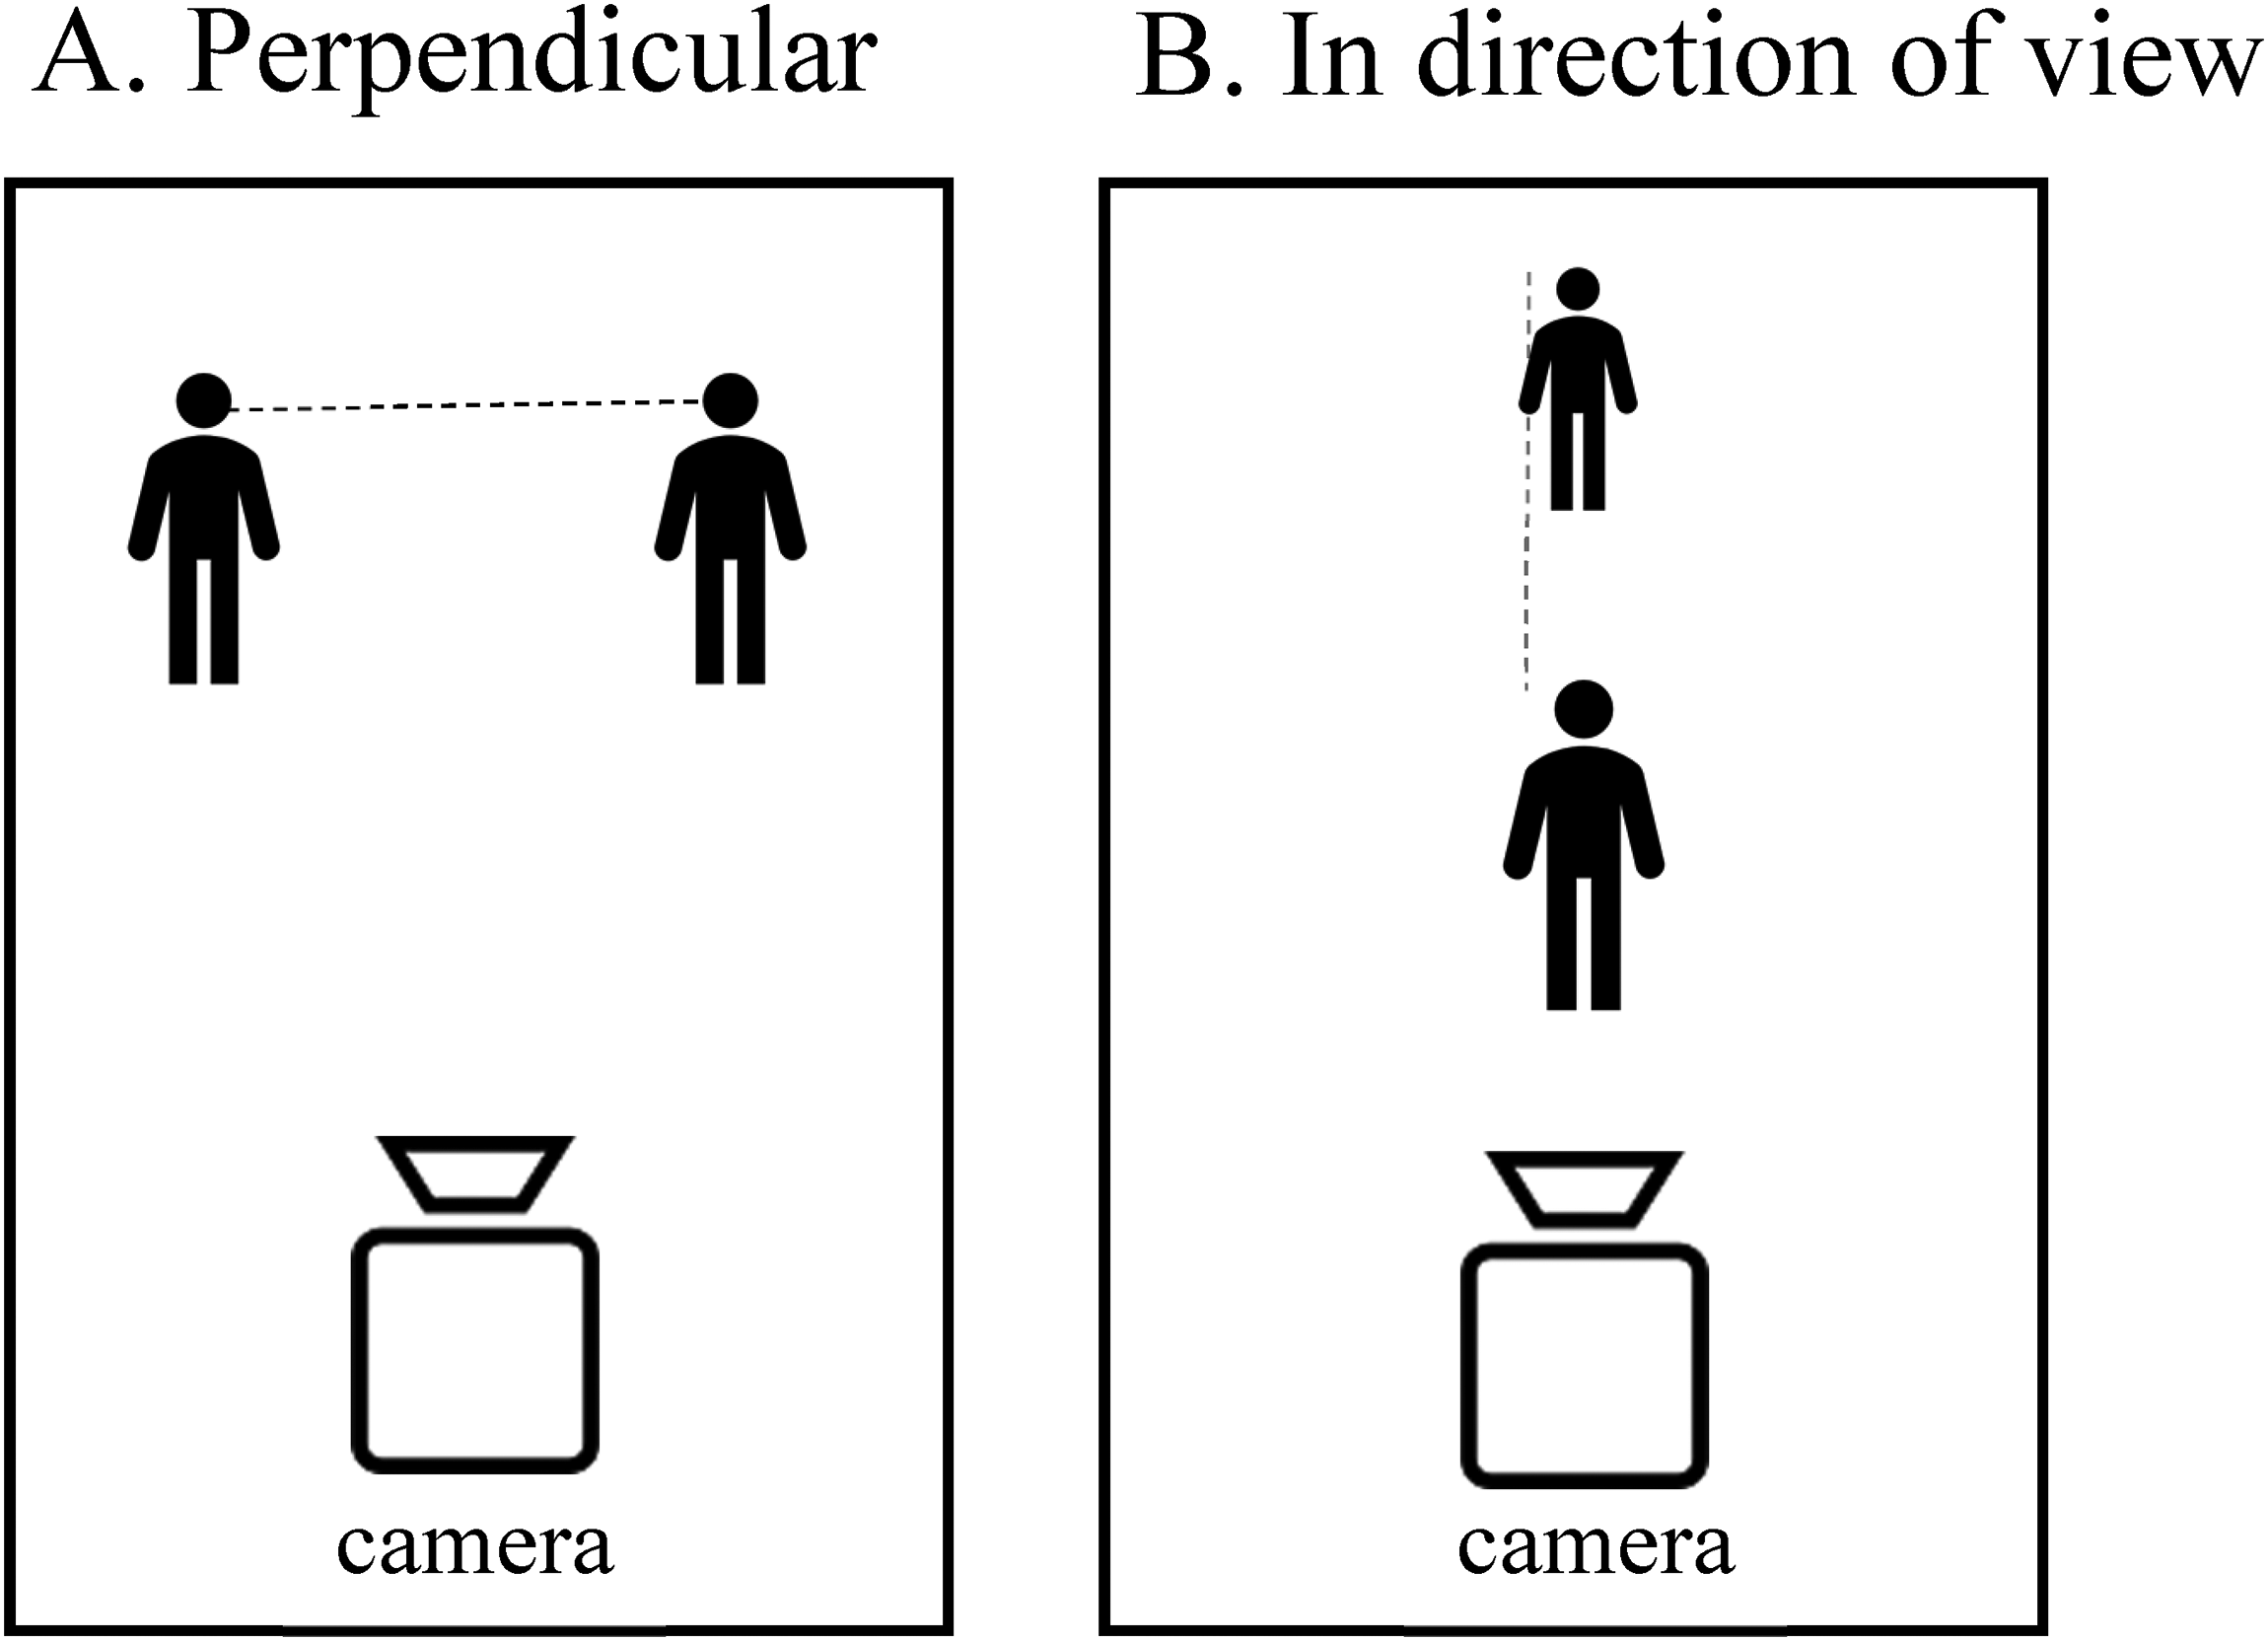
(A) distance between detected persons perpendicular to the camera view; (B) distance between detected persons in the direction of the camera view.
Once estimates are determined for translating horizontal and vertical pixel counts to real-world distances, Pythagoras’ theorem can be used to estimate the distance between two people in the most common situation, in which they are located neither completely perpendicular to the camera (beside each other), nor completely in the direction of the camera view (in front of and behind each other).
To optimize the estimation of this distance, we experimented with linear scaling based on the detected height of a person and the knowledge that the cameras were usually a couple of meters above the ground and looking down on people at an angle. The two scaling parameters that relate distance perpendicular to the camera view on the one hand and the distance in the direction of the camera view on the other hand, were refined by the programmer after manual inspection of still frames that were coded by the algorithm. The estimation of these two parameters is a one-off action that applies to the complete dataset, and not to every individual camera. It underlines that our algorithm cannot be used out-of-the-box for any situation involving distance measures between people: using it in other domains (e.g., with indoor footage from schools, hospitals, or other public places, or with footage from body-worn cameras) would likely require adjustments of these parameters.
Assess algorithm performance
Because the ultimate visual task in our application is not to locate all people in a still frame but merely to count them (and similarly to count the number of distancing violations in the frame), we assessed the performance of the algorithm by relating the number of people and the number of social distancing violations detected by the algorithm with the number of people and violations detected by the human coders. In other words,we evaluate total numbers detected and ignore any potential differences between algorithm and human coders with respect to where precisely in the still frame people were detected.
To assess performance, we used the Krippendorff's alpha, the same metric that we used to determine inter-coder reliability between the human coders. An advantage of using this metric, not only for the inter-coder reliability but also for the algorithm performance, is that the metric can also be interpreted as a measure of human-algorithm reliability, and that we can use the same criterion for sufficient performance as we would use for human coders, i.e., the alpha threshold of .80 as recommended by Krippendorff (2004:241). The first version of the algorithm was evaluated using Set 2, with the assessments of the first coder used as ground truth. The second version of the algorithm was evaluated using both Set 2 (the results of which were input to the improvement) and Set 3 (which had not been used before, and was also coded by the first coder). The additional test on Set 3 was to make sure that the adaption made to the first version did not lead to overfitting, a situation in which an algorithm is tailored to perform high on a specific dataset but fails to generalize this high performance to other datasets.
Table 3 summarizes the quantitative results in terms of Krippendorff's alpha. According to the top row in the table, which refers to the numbers of people observed, the first version of the algorithm already performed above expectations. The estimated value of alpha is .85, and even the lower boundary of the confidence interval is as high as .79. Although generalizability to other domains and datasets is never guaranteed, this result is hardly surprising because the algorithm was built on the already successful Pedestron algorithm. Because of the acceptable performance, we decided that the person detection element of the algorithm was not in need of further improvement. As a consequence, the second version of the algorithm was characterized by exactly the same alpha and confidence interval on Set 2 of the data, and by virtually the same alpha (and approximately the same confidence interval) on Set 3 of the data. The increased width of the confidence interval is the result of Set 3 being smaller (N = 201 still frames) than Set 2 (N = 221 still frames).
Inter-Coder Reliability Measures (Krippendorff's Alpha) and 95% Confidence Intervals Between one Human Coder and Three Versions of the Algorithm. The Measures are Based on 221 Still Frames (Set 2) and 201 Still Frames (Set 3).
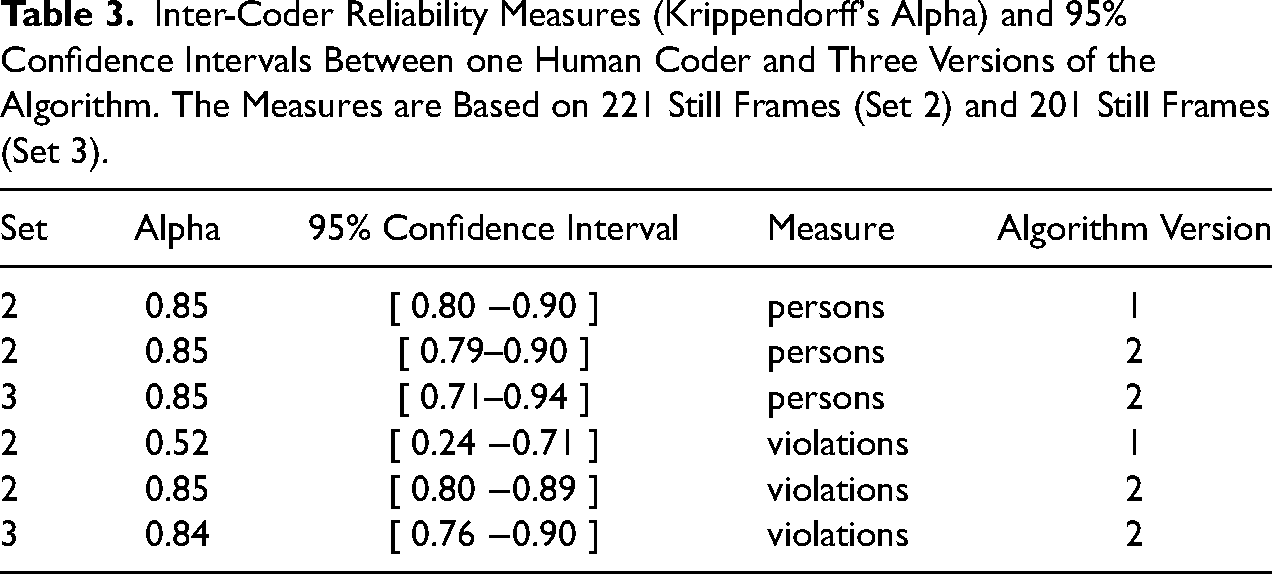
We next address the results in the lower panel of Table 3, which summarizes the outcomes for the number of social distancing violations observed (i.e., < 1.5-meter proximity count). The performance of the first version of the algorithm for detecting violations was much weaker than it was for detecting persons, as the estimated alpha was only .52, with the lower boundary of the confidence interval at .24.
To improve the algorithm, the estimation of distance in the direction of the camera view was refined as discussed above and, additionally, the threshold for detecting distance violations was adjusted to be less conservative in the detection of social distancing violations. The second version of the algorithm was applied on the same benchmark data (Set 2).
The fifth row in Table 3 shows that, as a result of the adaptation, the Krippendorff's alpha raises to .85, which is excellent and approximately equal to the value for the person counts. 6 The improved version of the algorithm, the second version, was subsequently applied to a fresh set of observations (Set 3, N = 205 still frames). With this dataset, we confirmed a high agreement between the algorithm and the human coder in detecting social distancing violations, as expressed by the Krippendorff's alpha of .84, and presented in Table 3.
The results presented here are based on footage that was recorded in daylight. With a different sample of the footage (in the context of an evaluation of a curfew measure implemented, for details see Liebst, Appelman, Bernasco et al. 2021a), we also assessed the performance of the algorithm for detecting persons from footage recorded in darkness. The ‘darkness’ sample included all 420 still frames taken from 55 cameras in Amsterdam on Thursdays and Saturdays at 8 PM and at 9 PM in the period from November 12th to November 28th, 2020. Sunset was between 4:51PM (on November 12th) and 4:32PM (on November 28th). The results were indicative of high performance of the algorithm during darkness: The Krippendorff's alpha was .90 (95% confidence interval .88–.93) for the comparison of the ratings by one human coder and version 2 of the algorithm. (The Krippendorff's alpha was .96 [95% confidence interval .95–.97] for the comparison of the ratings by the two human coders.)
Application of the Algorithm
After establishing that the algorithm performed satisfactorily, we applied it to measure social distancing compliance over the course of the pandemic. Here, we present estimates of both measures for just over a full year, from Thursday March 5, 2020 to Saturday March 27, 2021.
Data collection
From the Thursday and Saturday video recordings of 57 CCTV cameras in Amsterdam, still frames were extracted at every full hour from 9 AM to 8 PM. This scheme produced a total of 66,175 still frames that are automatically coded with the computer vision algorithm, counting both the numbers of persons present on the still frames and the detected number of distance violations.
In a perfect world, the observation scheme would produce 55 weeks × 2 days × 12 h × 57 cameras = 95,760 still frames. For various technical and organizational limitations, a nontrivial proportion of these observations (31 percent) could not be processed and analyzed. First, for organizational reasons 7 no recordings had been stored during 5 weeks in the Summer (July 23 to August 29, 2020), which amounts to 5 weeks × 2 days × 12 h × 57 cameras = 6,840 still frames. Our estimates of social distancing compliance, therefore, contain a gap during this period. Second, during the first months of recording (March-May 2020) the video conversion procedure (from the proprietary G64X format to the open-source MP4 format) involved unrecoverable errors, which resulted in the MP4 video files being truncated at some random point in time between 9 AM to 8 PM. Third, throughout the full period, for technical reasons, some observations were missing because the camera did not function on that particular day. While the first cause of missing observations has not been solved (so that the data contain a 5-week gap), the second and third causes were addressed by using a multiple imputation strategy that is described in the next section.
Multiple imputation strategy
The observations that are missing due to the three identified causes comprise 31% of the sample frame. The probability of a data frame to be missing is strongly and systematically related to the time of day (it increases over time from 9:00 to 8:00), and appears also related to the camera from which it was recorded and the date on which it was recorded, with a relatively large probability of missingness between March and June 2020 (and with certainty in the five-week summer gap). These relations are visualized in Figure S1 in Supplemental Material 4. Taking this into consideration, the missing values are imputed using multiple imputation (Rubin 1987). Multiple imputation replaces the dataset with a set of dataset copies, where in each copy the missing values have been replaced by alternative values that are sampled from a distribution, preserving uncertainty in the data. The multiple imputation procedure was implemented using the mice package (van Buuren 2018) for the R statistical software (R Development Core Team 2012) after extended simulation tests using subsets of data. These tests and the setup of the multiple imputation procedure are described in Supplemental Material 4.
Findings
Figure 4 presents the observed development of the number of people on the street and the number of social distancing violations in Amsterdam over the course of the pandemic. The vertical axis represents the average observed number of people present per still frame, and the observed number of violations of the 1.5-meter directive per still frame. Each data point represents 1,368 still frames (57 cameras, 2 days per week and 12 h per day). There are notable fluctuations throughout the study period, in both the number of people on the street and the number of distance violations.
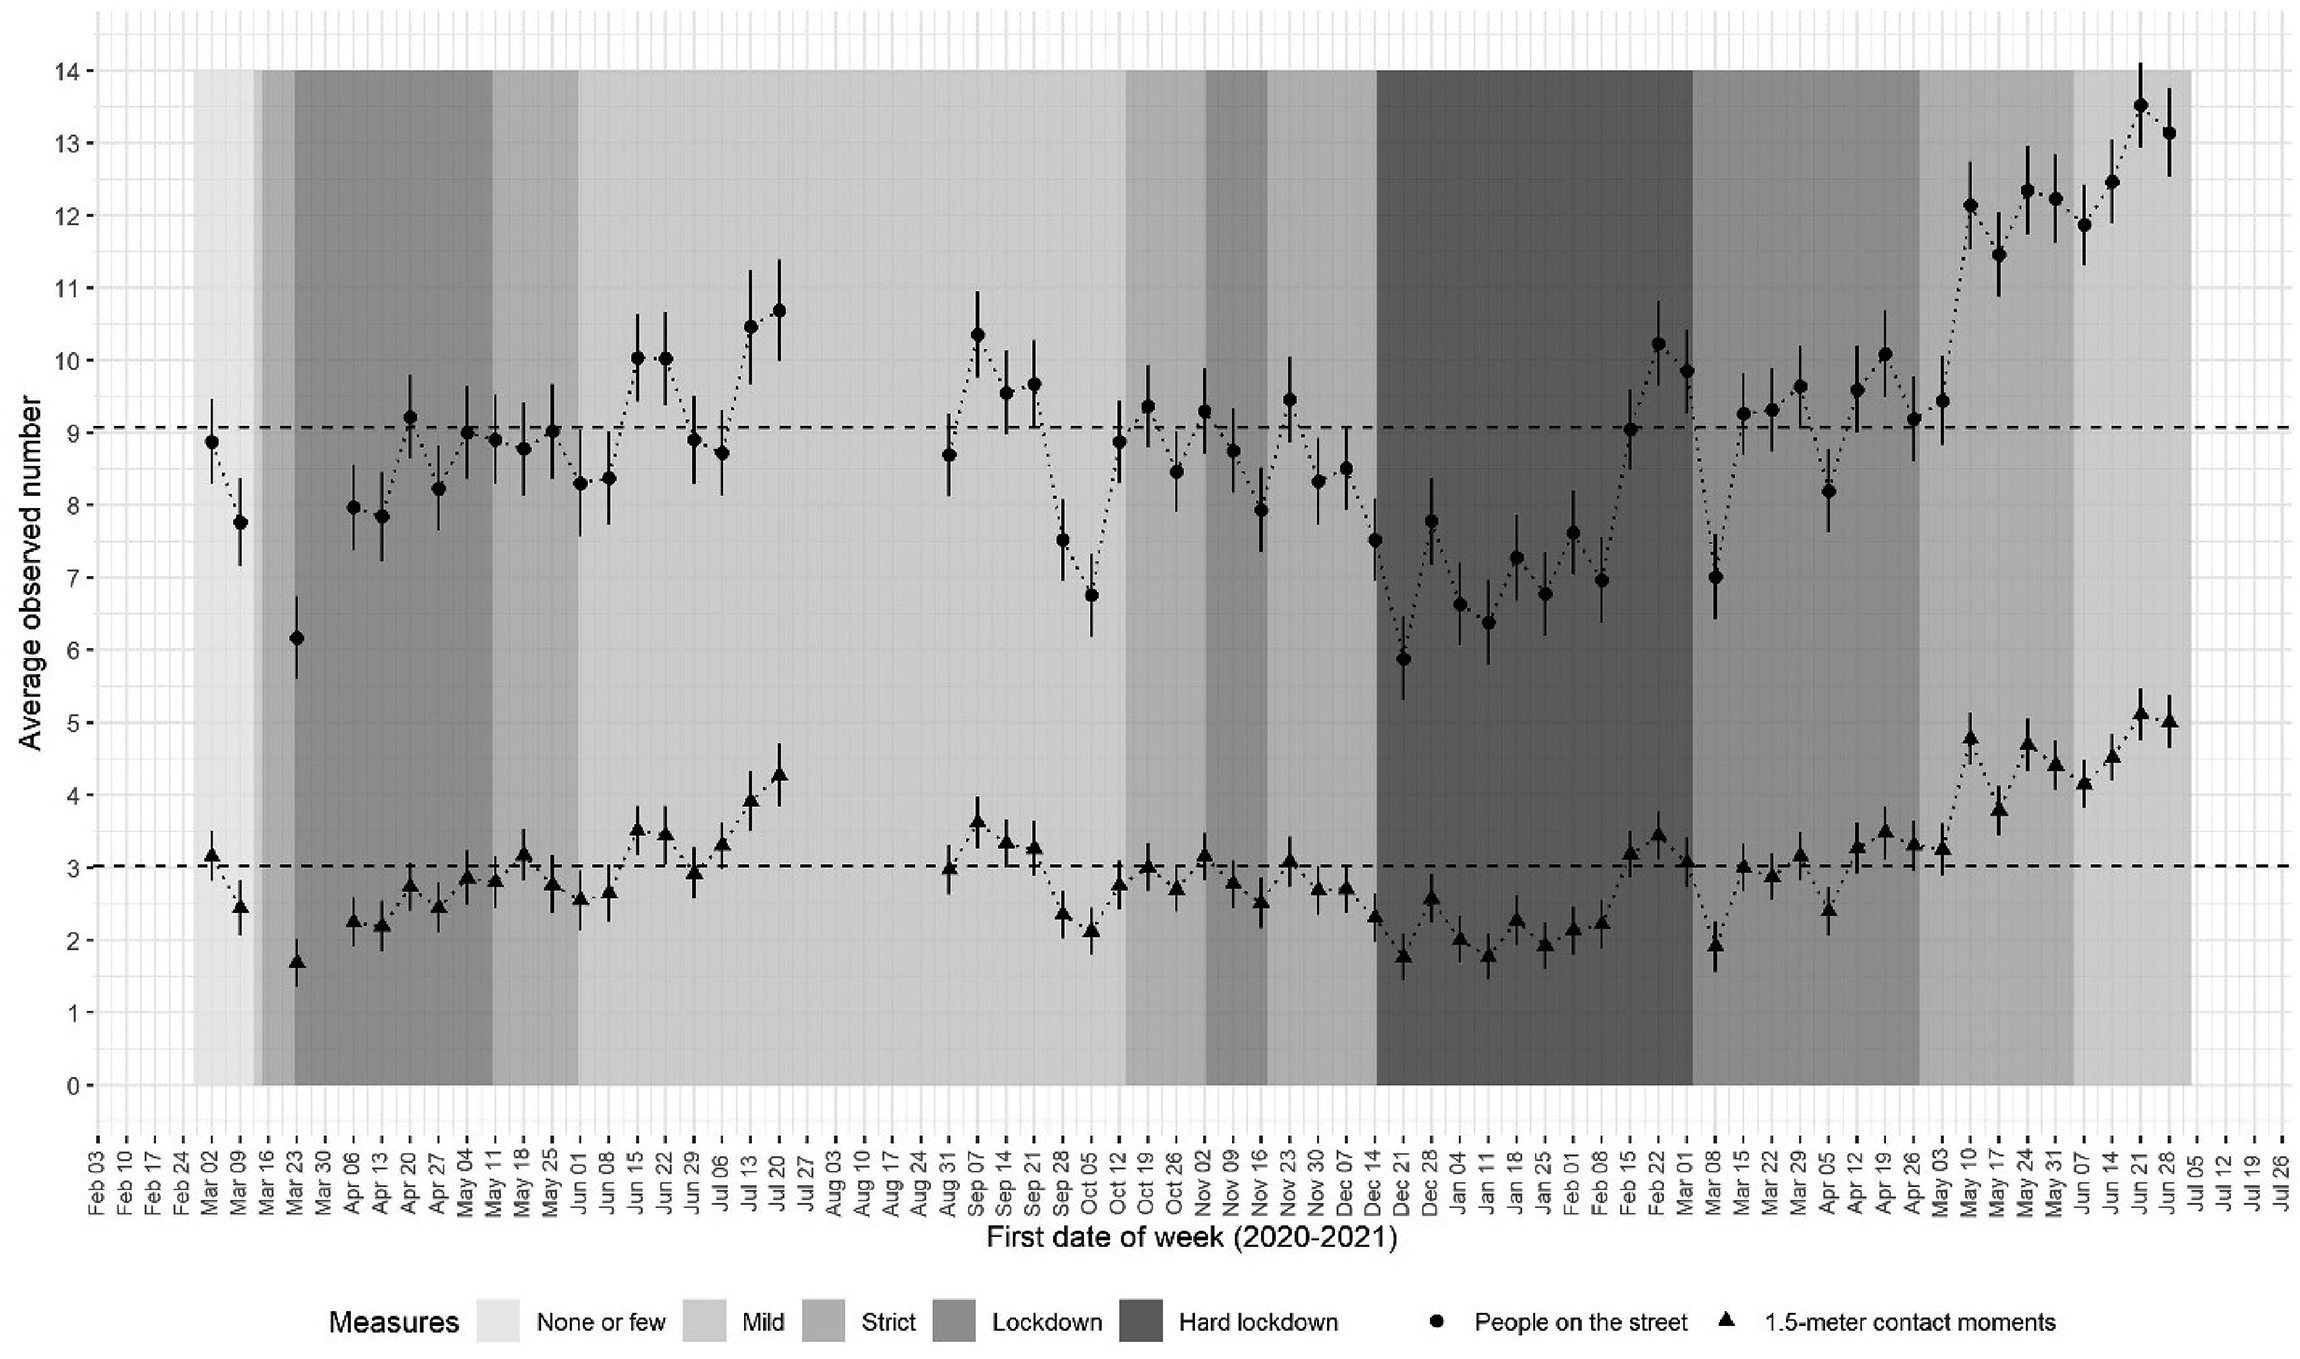
Development of number of persons in the street and number of violations of the 1.5 m rule during the COVID-19 pandemic. Point estimates (dots) and 95% confidence intervals (vertical bands).
Based on visual inspection, the number of people and the number of 1.5-meter distance violations appear to fluctuate in synchrony. This observation is confirmed by the correlation between persons and violations, which is .82, and still is .79 after correction for temporal autocorrelation and the inclusion of fixed effects for cameras. 8 Although these are observational data that do not necessarily imply a causal relationship, they may signal that it is increasingly difficult to keep a 1.5-meter distance as crowds become larger in number, which could support crowd-control policies to reduce activity peaks and allow people to keep a distance, and might discourage strategies that make moral appeals to keep a distance from others. A more comprehensive analysis of this association in the current data is described by Liebst, Bernasco, Ejbye-Ernst et al. (2021b).
To contextualize the fluctuations in numbers of people on the street, we constructed a timeline indicating the strictness of the implemented COVID-19 social distancing measures during different periods. The strictness of these measures is represented by the background grey tones in Figure 4. We distinguish between five levels: ‘none or very few measures’ (e.g., request to not shake hands), ‘mild measures’ (mandatory closing times for bars, limitations to the allowed number of visitors indoors), ‘strict measures’ (certain sectors of the economy closed down, limitations to sports events), ‘lockdown’ (schools closed, flow locations closed), and ‘hard lockdown’ (all non-essential shops closed).
The first noticeable drop in the number of people on the street and the number of distance violations in Figure 4 is in the weeks prior to March 23, 2020, which coincides with the first announcements of social distancing directives by the Dutch government, which concerned general directives (e.g., avoid shaking hands, work from home). The 1.5-meter distance directive was only introduced on March 15 and not sanctioned until March 23, suggesting that people started to avoid busy places already before the directives were officially implemented. This is in line with recent findings that show that during the pandemic, some behavioral changes preceded formal implementation (Allcott, Boxell, Conway et al. 2020; Chetty, Friedman, Hendren et al. 2020). They speak to the important role of voluntary action in reducing viral transmission rates (Brezinski, Deiana, Kecht et al. 2020), at least during the first stages of a pandemic.
After this initial drop, the activity level slowly increases over the following weeks until it reaches an average of 8.5 people per still frame at the end of the lockdown (the week of May 11, 2020). It remains quite high until a second drop in October, which is potentially related to a national holiday period.
A third noticeable drop appears in the week of December 14, 2020, a week after the so-called hard lockdown was enforced by the government. After this drop, the crowding and contact levels increased slowly over the following weeks. However, at the end of February, there is a sudden increase, followed by a drop after two weeks. It seems plausible that temperature fluctuations play a role in these trends, as low temperatures may deter outdoor activity (average temperature in February 2021 was 4 degrees Celsius).
Comparison with cell phone-based activity level measures
At the time of writing, the computer vision algorithm is still being used to monitor outdoor activity levels and distances between people, to regularly inform the municipality of Amsterdam about compliance with social distancing directives in public space (Bernasco, Liebst, van der Veen et al. 2021). They are also used in ongoing research addressing social distancing behavior during the COVID-19 pandemic, including a study on the effects of a night curfew (Liebst et al. 2021a).
To measure outdoor activity levels, location data of mobile phones provide an alternative source of information. These measures are unobtrusive and their massive availability might make them equally valid, or more valid, than CCTV footage, which is limited to the locations and times of operation of CCTV cameras. 9 Mobile phone location data have been used extensively in research to measure the physical presence of people in time and place (e.g., in relation to crime, Hanaoka 2016; Long, Liu, Xu et al. 2021). Like video data, they are saddled with ethical issues.
To assess the external validity of our CCTV-based computer vision measures, we compared our weekly average measure of persons per still frame with the weekly average data from Google's COVID-19 Community Mobility Reports of the city of Amsterdam. The COVID-19 Community Mobility Reports are indices provided by Google that summarize trends in activity levels in terms of visits to and amount of time spent in six different categories of places: retail and recreation, groceries and pharmacies, parks, transit stations, workplaces, and residential areas. For most countries, they are available at country, region, and city level, including the city of Amsterdam. The mobility data are based on locations of mobile phone users, as determined by the location services in Android-based phones of users who have location tracking active on their phones. The data do not contain absolute numbers of unique visitors, but percentage changes relative to a baseline day, which is the median value from the 5-week period January 3 – February 6, 2020. Since the start of the COVID-19 pandemic, these data have been provided by Google and been used widely to measure aggregated trends in mobility (e.g., Nivette, Zahnow, Aguilar et al. 2021).
To compare activity level measures between our CCTV-based data with the COVID-19 Community Mobility Reports, we selected from the latter the same dates that were available in our data (Thursdays and Saturdays in the study period), aggregated them to weekly measures, and correlated them with the weekly measures of our CCTV-based measures that were shown in Figure 4. In addition to the correlation with retail and recreation (.60), groceries and pharmacies (.70), transit stations (.55), parks (.74) and workplaces (.49), we constructed an aggregate mobility measure that was the mean of these five place categories, which correlates .77 with the CCTV-based measure. The residential category was not included in the mobility measure because presence in residential areas is typically indoors and static, and is not an indicator of mobility and outdoor activity. Figure S5 in the Supplemental Materials shows scatterplots relating the weekly phone-based mobility measures with the CCTV-based measures. The visualization supports the overall good fit of the CCTV-based measures with the measures based on phone network data, in particular with the combined mobility measure (in the upper left panel). If the two outliers near the top (which represent the first two weeks of March 2020) are discarded, the correlation even increases to .86. We should not expect a perfect correlation because of limitations in both sources: camera locations are not random but determined on the basis of need for surveillance, and mobile phone data sample only users who have activated location services on their mobile phones, and these data are not limited to outdoors activity because they also include individuals who are indoors.
Looking Forward
In the preceding sections, we introduced computer vision to social scientists, we reviewed the extant literature on social signal processing and the recognition of persons, groups, and crowds, provided examples of studies that applied computer vision to address questions relevant to social scientists, and we gave a step-by-step example of how computer vision can be used to upscale empirical analysis of video data. In this concluding section, we attempt to look forward by discussing possible additional applications of our distancing model to sociologically relevant research questions, and by highlighting technical and ethical challenges of this methodology.
Contribution to Sociological Scholarship
What exactly is the added value of measuring the behavioral displays of social distancing with a computer vision tool, rather than using a more traditional micro-sociological tool such as systematic on-site observations, as in the case of Collins (2020)? What is striking about Collins’ study is that despite its apparent ambition, it offers few direct observations on whether people managed to keep the mandated metric distance between them when co-present in more or less crowded settings. Instead, Collins focused on capturing social distancing indirectly via counts of mask-wearing and related greeting practices. Probably, this reflects how interpersonal social distancing behavior is difficult, if not impossible, to record in a reliable manner when only having a single chance to observe it on-site (Philpot et al. 2019). This contrasts mask-wearing behavior, which is easier to record because it is less interactional, static, and does not involve an interpersonal metric dimension.
The playback function of recorded video data enables researchers to overcome such limitations of the human visual and cognitive systems and to process high volumes of data at high speed. The function of computer vision is to completely bypass the human coding process once we have ascertained that its performance is at least as good as human performance under optimal conditions (i.e., on recorded images by multiple coders, with rewinding and speed). This facilitates opportunities to better quantify phenomena and determine generalizable relationships between them. For example, it would enable large-scale data collection for cross-cultural comparisons, and link social distancing behaviors during the pandemic to measures of cultural adherence to social norms (Gelfand, Jackson, Pan et al. 2021), collectivism (Hofstede 1980), authoritarianism (Gabennesch 1972), and preferred interpersonal distance (Gokmen, Turen, Erdem et al. 2020).
Aside from its application to COVID-19 related research, algorithms could be used to examine individual and cultural differences in distancing behavior. In his proxemic theory, Hall (1966:113 − 30) distinguished four categories of interpersonal distance that each reflected a different type of relationship between individuals: public distance among strangers, social distance maintained in formal interactions, personal distance among friends and relatives, and intimate distance among close friends, relatives, and romantic partners. He also theorized that the preferred degree of distance in interactions with others would depend on characteristics of the individual, the dyad, and the broader social environment. Indeed, empirical work confirms that there are individual and dyadic differences with respect to age (Gérin-Lajoie, Richards and McFadyen 2006) and gender (Ozdemir 2008), as well as cross-national differences in people's preferences for personal space (Sorokowska et al. 2017). However, with some exceptions, most work in this area relies on small samples or projective measures of distancing. Video analysis in combination with computer vision methods would enable the large-scale observational assessment of this topic.
Relatedly, computer vision could be used to examine in-group and out-group dynamics in distancing behavior. In an example of such work, Dietrich and Sands (2021) combined experimental and observational techniques to examine racial avoidance and found that pedestrians, particularly phenotypical non-black pedestrians, maintain relatively more distance from African American confederates than from non-Hispanic white confederates in public encounters on the sidewalks of New York City
Finally, algorithms such as the one developed in this study could be used to examine the context-dependency of distancing behavior. Structural features such as community disorder, racial composition, and crime rates have often been linked to feelings of safety and corresponding adjustments in self-protective behaviors (Hale 1996; Liska, Lawrence and Sanchirico 1982). Computer vision has great potential for the large-scale examination of whether the distancing behavior of pedestrians varies across areas characterized by, for example, different types of land use, signs of physical and social disorder, and signs of territoriality.
Challenges and Limitations
The exciting prospects of computer vision should be considered alongside the various challenges that still remain. It should be acknowledged that video data analysis, and by implication the adoption of computer vision technology in it, holds the promise to advance only parts of sociological inquiry. The subjectively meaningful dimension of social interactions is arguably not the strong side of a visually based analysis (Geertz 1973; though for a counterargument, see Katz 1999), and computer vision techniques should thus not be seen as alternatives but as additions to the existing methodological toolbox of sociologists.
Despite the rapid development of camera technology, video recordings are not perfect. The accuracy of the detected events varies with camera angles, quality of the footage (e.g., number of pixels), illumination, and, for outdoor recordings, weather conditions (e.g., rain, snow). Efforts in the realm of social signal processing are even more sensitive to noise, occlusion, and other restrictions to the video quality than efforts toward group and crowd analysis. For example, to enable facial expression analysis, subjects need to be faced directly toward the camera, which is why this field is still heavily dependent on recordings obtained under lab-like conditions (Martinez 2019). Therefore, many advancements within social signal processing still have restricted real-world applicability.
Further, the communication of emotions may vary across cultures, individuals, and situations, which limits the generalizability of studies that infer affective states from facial movements and body postures (Barrett, Adolphs, Marsella et al. 2019; Kleinsmith and Bianchi-Berthouze 2013).
For the recognition of groups and crowds, the detection and tracking of people remain challenging, especially in crowded scenes and in imagery with cluttered backgrounds: people might be indistinguishable from objects, or they might block the view on other individuals. Also, the dynamic nature of people's movements makes it difficult to estimate their future positions; people often change their speed to avoid collision with obstacles or other people in or out of view.
The detection of crowd abnormalities is challenging due to the context-dependent nature of such abnormalities (Wang and Loy 2017). For example, a person walking in the opposite direction of the crowd is a normal event in a shopping street, but can be considered an anomaly in a protest march. Because of this problem, many models on crowd analysis are scene-specific and would need to be retrained with new data to fit a different scene. Efforts are underway to enable scene-independent crowd analyses (Shao, Change Loy and Wang 2014; Yang, Cao, Wang et al. 2018), which would widen the application possibilities.
More generally, there is a lack of adequate training samples, synthetic as well as in-the-wild, which limits the generalization of the developed algorithms. But even if training samples would be abundant, our advice to social scientists using computer vision would be to always create at least a small training set, have it annotated by human coders, and verify that the results of an automated ready-to-run algorithm align well with the human coding.
In addition to technical limitations, there are ethical considerations that challenge the use of images featuring human faces or human bodies for research purposes. In their review of ethical issues in research of online video sources, Legewie and Nassauer (2018) distinguish five relevant ethical criteria: informed consent, privacy, transparency, harm minimization, and unique opportunities. Informed consent requires that the individuals depicted on the images must agree with being recorded, with the recordings being stored and used for research, and that this agreement must be based on clear information on all aspects of the research that are potentially relevant to them. Privacy requires that images of an individual and other personal information collected do not become publicly available or accessible to people they were not intended to be shared with. Transparency applies to the consumer side of research. In line with the open science movement's goals, it requires that the purposes, methods, and data are freely accessible to the scientific community and the public (Nosek, Alter, Banks et al. 2015). Minimizing potential harm means that study subjects, here the individuals who are caught on camera, should not suffer harm or disadvantage as a result of the study. Unique opportunity refers to the potential of the study to create scientifically useful knowledge that could not be generated in other ways, or to solve an important practical issue that could not be solved in other ways. These five criteria may be in conflict with each other, for example, when transparency requires accessibility of the images, but privacy and minimizing potential harm require constraints on access, or when informed consent is at odds with the unique opportunity of collecting information on unobtrusive natural human behavior.
Legewie and Nassauer (2018) discuss these five criteria with respect to the use of video recordings that have been shared on online public platforms such as YouTube (e.g., Nassauer 2018), but most of the issues they raise also apply to the use of CCTV data from public places. Even if the public is informed about the presence of CCTV cameras, it is generally not possible to obtain their informed consent about the use of their images for scientific research or for any other activity beyond the public surveillance function of the CCTV cameras. The importance of informed consent may hinge on whether the video data are being recorded in public or in private places. Specifically, the Code of Ethics of the American Sociological Association (2018) states that scholars using video data need not obtain informed consent if the observed activities—as in the case of the current working example— “involve naturalistic observations in public places where confidentiality is not expected and it is not anticipated that the recording will be used in a manner that could cause personal identification or harm” (section 11.5). It should be emphasized, however, that although privacy is an important value globally, expected levels of privacy and privacy regulations differ across cultures (Altman 1977). For example, this is reflected in the 2018 implementation of the European General Data Protection Regulation (GDPR), a European Union-wide legal framework that restricts what organizations can do with personal data, which is stricter and more overarching than existing regulations in the United States (Nicola and Pollicino 2020). Thus, even though the method outlined in this study complies with privacy regulations and ethical principles in some contexts (e.g., the Netherlands, Europe), the evaluation criteria may vary across contexts. This warrants judicial and ethical attention of researchers who would want to apply this method in their own work. Computer vision as a field thrives by the existence of image databases that are public and shared amongst researchers to verify, replicate, and improve each other's work. The nature and intended use of such public databases may preclude the informed consent and privacy protection of the depicted individuals. In the field of pedestrian detection, for example, there exist dozens of annotated datasets that contain many hours of video recorded by cameras mounted on cars driving in urban traffic, each dataset containing thousands of unique individuals who have likely not been aware of being recorded and certainly did not give their explicit permission. Without suggesting that this practice should be accepted and followed by social scientists, the example illustrates once more that ethical judgments are not absolute but depend on context and may vary across scientific disciplines. In the field of computer vision, privacy and informed consent appear to be more easily sacrificed for transparency than in the social sciences. Characteristically for the social sciences, a condition for the ethical approval of the current study is that only the anonymized coded data, not the visual data, may be shared publicly.
In regard to privacy, video data are difficult to make anonymous because the faces and bodies of the depicted individuals are linked to their identities. Making them unrecognizable (e.g., by blurring their heads or upper bodies) may interfere with the aims of the research, for example, if the aim is face recognition. Our own research may not have been feasible with such an anonymization technique because even though our detection algorithm does not identify faces, its effectiveness still depends on the ability to identify a human head. Although recent evidence suggests that some anonymization methods hardly degrade the performance of computer vision (Klomp et al. 2021), the examination of such anonymized video data is still relatively unexplored territory. Therefore, considerations of privacy currently still often imply that video data in which individuals are identifiable must be processed in secure analytics labs, and that sharing of data is problematic (see Legewie and Nassauer 2018, for a more extensive discussion). In order to improve both transparency and anonymity, we recommend that more research be conducted on how images of humans can be anonymized without compromising their usefulness, both in practical applications and in scientific research.
The use of publicly available recordings from online video platforms like YouTube (Nassauer 2018) does not solve these ethical issues (Legewie and Nassauer 2018), and may sometimes aggravate them because the conditions under which these recordings were made are not documented and cannot be verified.
Minimizing potential harm to individuals who have been recorded on camera is another ethically motivated criterion for researchers using video data. Even if most images are automatically processed and not actively watched by humans, it is inevitable that at some point during the research, images are watched and annotated by human observers. There is always a non-negligible probability that these observers come to observe relatives, friends, or acquaintances in compromising situations (e.g., their neighbor visiting a pawn shop, their child skipping class, or their spouse meeting an apparent lover), which implies that the research may harm those who are caught on camera. This risk could be reduced by matching observers to footage of locations that are far away from their residential and work areas.
A further and more general ethical concern is the possibility that the techniques used in computer vision may cause harm because they reproduce bias against groups in the population (e.g., by gender, age, or ethnicity) without the reasons of this bias being easily detectable because they have become hard-wired in algorithms. Algorithm performance is ultimately judged against a ground truth defined by humans, and if human coders have biases, these biases become part of the annotated data on which algorithms are trained. This potential ethical challenge does not exclusively apply to computer vision but has been identified as a risk of artificial intelligence and machine learning more generally, both in scholarly accounts (Gebru 2020) and popular non-fiction accounts (O’Neil 2016). A telling computer vision example is the study on facial recognition by Buolamwini and Gebru (2018). The authors demonstrated that two datasets for benchmarking facial recognition software were overwhelmingly composed of lighter-skinned subjects. They introduced a new dataset that was balanced by gender and skin type, and using this dataset showed that three commonly used existing gender classification systems showed substantial disparities in the accuracy of classifying darker females, lighter females, darker males, and lighter males. Similar biases could also easily arise in other subareas of computer vision, including the pedestrian detection and social distance monitoring algorithms discussed in the present study, and be acted on in their application to crowd control and surveillance. Social scientists and other adopters of computer vision technology should remain aware that computer vision algorithms may contain biases and thereby jeopardize the validity of their findings, and should carry responsibility for transparency and accountability of their methods, whether or not they themselves are directly involved in the technical development of computer vision tools.
The Marriage of Social Science and Computer Vision
An important conclusion of this study is that collaboration between social science and computer vision is not just feasible but can become symbiotic if social scientists clearly recognize the strengths and limitations of computer vision. In particular, social scientists should understand that computer vision is not an industry producing finished tools and solutions. It is a quickly developing scientific discipline that is driven by the same knowledge cycles and paradigm shifts other sciences go through. Social scientists should be prepared to take part in the development of these solutions. They should have patience but also contribute to posing the right questions and to solving challenges. What social scientists bring to the table is the ability to formulate challenging questions motivated by social theory. However, it should also be mentioned that, besides interdisciplinary collaboration and depending on the application, data availability, resources, and programming skills, there are also other options available to social scientists for engaging with computer vision, options that do not necessarily involve technical know-how (for a brief overview of these options, see Nassauer and Legewie 2022: chapter 8). We would like to emphasize that social scientists do not need a degree in computer vision to use it in their research. In fact, it may be more efficient to collaborate with computer vision researchers than try to become one of them.
Access and approval
Access to the video recordings was provided under the condition that the data would be securely stored, viewed, and analyzed within offline lab facilities situated at a scientific institution, not be publicly shared, and that the identity of the persons visible on the recordings would be protected at any time. The project has been approved by the Netherlands Public Prosecution Service (PaG/BJZ/49986), and by the Ethics Review Board of the Faculty of Social and Behavioral Science at the University of Amsterdam (2021-AISSR-14225).
Supplementary materials
The following supplemental materials have been made available at osf.io/yw67g: (1) the source code of the annotation tool (Python code), (2) all human-coded and algorithm-coded still frame data, but not the still frames themselves, (3) the COVID-19 Community Mobility data selection for Amsterdam used in the analysis, and (4) the source code of all data analysis reported in this article (R code).
Supplemental Material
sj-docx-1-smr-10.1177_00491241221099554 - Supplemental material for Promise Into Practice: Application of Computer Vision in Empirical Research on Social Distancing
Supplemental material, sj-docx-1-smr-10.1177_00491241221099554 for Promise Into Practice: Application of Computer Vision in Empirical Research on Social Distancing by Wim Bernasco, Evelien M. Hoeben, Dennis Koelma, Lasse Suonperä Liebst, Josephine Thomas, Joska Appelman, Cees G. M. Snoek and Marie Rosenkrantz Lindegaard in Sociological Methods & Research
Footnotes
Acknowledgments
The authors thank Kiki Bijleveld at the NSCR for assistance in processing and coding video data, and Maikel van Scheppingen, Makki el Jouhri and Tineke Gortworst-Michels at the Amsterdam Police Department for assistance in securing video data.
Author Contributions
Conceptualization – Overaching Idea: WB, MRL, LSL. Conceptualization – Article Narrative: WB, EH. Data Curation: JA, WB, DK, JT. Formal Analysis: WB, DK. Funding Acquisition: WB, EH, LSL, MRL (principal investigator), CS. Investigation: JA, WB, EH, DK, JT. Methodology: WB. Project Administration: JA, MRL. Resources: MRL, CS. Software: WB, DK. Supervision: WB, MRL, CS. Validation: JA, WB, DK. Visualization: WB, EH. Writing – Original Draft Preparation: WB, EH. Writing – Review & Editing: JA, WB, EH, LSL, MRL, DK, CS, JT. Writing – Revision: JA, WB, EH, LSL, CS.
Declaration of Conflicting Interests
The author(s) disclosed receipt of the following financial support for the research, authorship, and/or publication of this article: ZonMW no. 10430022010017 ('Towards evidence-based social distancing policy').
Funding
he author(s) disclosed receipt of the following financial support for the research, authorship, and/or publication of this article: ZonMW no. 10430022010017 (‘Towards evidence-based social distancing policy’).
ORCID iDs
Supplemental Material
Supplemental material for this article is available online.
Notes
Author Biographies
References
Supplementary Material
Please find the following supplemental material available below.
For Open Access articles published under a Creative Commons License, all supplemental material carries the same license as the article it is associated with.
For non-Open Access articles published, all supplemental material carries a non-exclusive license, and permission requests for re-use of supplemental material or any part of supplemental material shall be sent directly to the copyright owner as specified in the copyright notice associated with the article.