
Abstract
Indirect questioning techniques such as the randomized response technique aim to control social desirability bias in surveys of sensitive topics. To improve upon previous indirect questioning techniques, we propose the new Cheating Detection Triangular Model. Similar to the Cheating Detection Model, it includes a mechanism for detecting instruction non-adherence, and similar to the Triangular Model, it uses simplified instructions to improve respondents’ understanding of the procedure. Based on a comparison with the known prevalence of a sensitive attribute serving as external criterion, we report the first individual-level validation of the Cheating Detection Model, the Triangular Model and the Cheating Detection Triangular Model. Moreover, the sensitivity and specificity of all models was assessed, as well as the respondents’ subjective evaluation of all questioning technique formats. Based on our results, the Cheating Detection Triangular Model appears to be the best choice among the investigated indirect questioning techniques.
Estimating the prevalence of sensitive attitudes and behaviors such as xenophobia, drug use, doping, or tax evasion is of high societal relevance. However, self-reports on such sensitive topics often lack validity because respondents fear negative consequences when answering honestly. Instead of providing accurate answers, some respondents choose to present themselves in a more socially acceptable light by under-reporting socially undesirable and over-reporting socially desirable attributes (Krumpal 2013; Paulhus 1991; Phillips and Clancy 1972; Tourangeau and Yan 2007).
The randomized response technique (RRT; Warner 1965) was developed as an attempt to minimize the influence of social desirability bias by guaranteeing the confidentiality of individual responses. In the original RRT, respondents are presented with two opposing sensitive statements A and B (e.g. Statement A: “I have taken cocaine” and Statement B: “I have never taken cocaine”). Instead of answering to any of these statements directly, respondents are instructed to use an external randomization device (e.g. a die) that determines the statement they have to respond to with either “true” or “false.” The randomization outcome is known only to the respondent and is kept secret from the interviewer. Therefore, the interviewer does not know which statement was answered by any individual respondent, and therefore cannot tell whether a given respondent is a carrier of the sensitive attribute. However, prevalence estimates for the sensitive attribute can be computed on the sample level based on the known distribution of the randomization outcomes. Various variants of the RRT have been proposed and are reviewed in Chaudhuri (2011) and Chaudhuri and Christofides (2013).
Meta-analyses have shown that prevalence estimates obtained via RRTs are more valid than estimates obtained via a conventional direct question (Lensvelt-Mulders et al. 2005). However, while RRT estimates were usually closer to the true value, they still often underestimated the prevalence of sensitive attributes with known prevalence (Lensvelt-Mulders et al. 2005; Wolter and Preisendörfer 2013). In some studies, RRTs even yielded prevalence estimates for socially undesirable attributes below those obtained with a conventional direct question and therefore presumably less valid (Holbrook and Krosnick 2010; John et al. 2018). One possible explanation for such inconsistent findings is that some respondents do not follow the instructions (Holbrook and Krosnick 2010; Krumpal 2012), perhaps because they fail to understand the questioning format, do not trust the randomization procedure, are fearful of being falsely associated with the sensitive attribute, or lack the motivation to comply with the somewhat complex instructions, which might result in unsystematic, random answer behavior (Edgell, Himmelfarb, and Duchan 1982; John et al. 2018; Krumpal 2012; Landsheer, van der Heijden, and van Gils 1999; Schnapp 2019).
Two main approaches have been proposed to address the problem of instruction non-adherence in RRTs. The first approach aims to make instruction non-adherence detectable. Examples of this approach include the Cheating Detection Model (CDM; Clark and Desharnais 1998) and the Stochastic Lie Detector (Moshagen, Musch, and Erdfelder 2012). The second approach aims to overcome instruction non-adherence by providing simplified instructions to increase understanding and perceived confidentiality among respondents. The Triangular Model (TRM) and the Crosswise Model (CWM; Yu et al. 2008) are examples of this second approach.
The Cheating Detection Model
The CDM (Clark and Desharnais 1998) is an extension of a forced choice variant of the RRT (Dawes and Moore 1980). In the CDM, all respondents are presented with the sensitive statement (e.g. “I have taken cocaine”). Based on the outcome of a randomization procedure with a known distribution (e.g., the respondent’s month of birth), respondents are requested either with probability p to simply answer “true” regardless of their true status with respect to the sensitive attribute, or to answer honestly with probability 1 − p. Since the distribution of the randomization outcomes is known, prevalence estimates for the sensitive attribute can be determined on the sample level when using the CDM. The status of individuals responding “true” remains confidential because depending on their month of birth, both carriers and non-carriers of the sensitive attribute may be asked to provide a “true” response. However, a “false” response can only stem from non-carriers of the sensitive attribute, thus providing a “safe” answer option that respondents can choose to unambiguously deny being a carrier of the sensitive attribute. The CDM accounts for the possibility that some respondents will make use of this option instead of following the instructions. To this end, the CDM identifies three non-overlapping groups of respondents: honest carriers of the sensitive attribute (π), honest non-carriers of the sensitive attribute (β), and respondents who do not adhere to the instructions, but instead choose the self-protective response alternative (γ). Within the CDM, the true status of these non-adherent respondents remains unknown. It is therefore possible that none, some, or all of the respondents not adhering to the instructions are carriers of the sensitive attribute. Hence, only a lower (π) and an upper (π + γ) bound for the prevalence of the sensitive attribute can be determined.
Since a randomized response model is non-identifiable if the number of its parameters exceeds the number of the available answer categories, the CDM has to be applied to two non-overlapping samples with different randomization probabilities p1 and p2 to make the model identifiable and obtain estimates for π, β, and γ (Clark and Desharnais 1998). A graphical representation of the CDM for the group with randomization probability p1 is provided in Figure 1; for the second group, parameter p1 is simply replaced with p2.
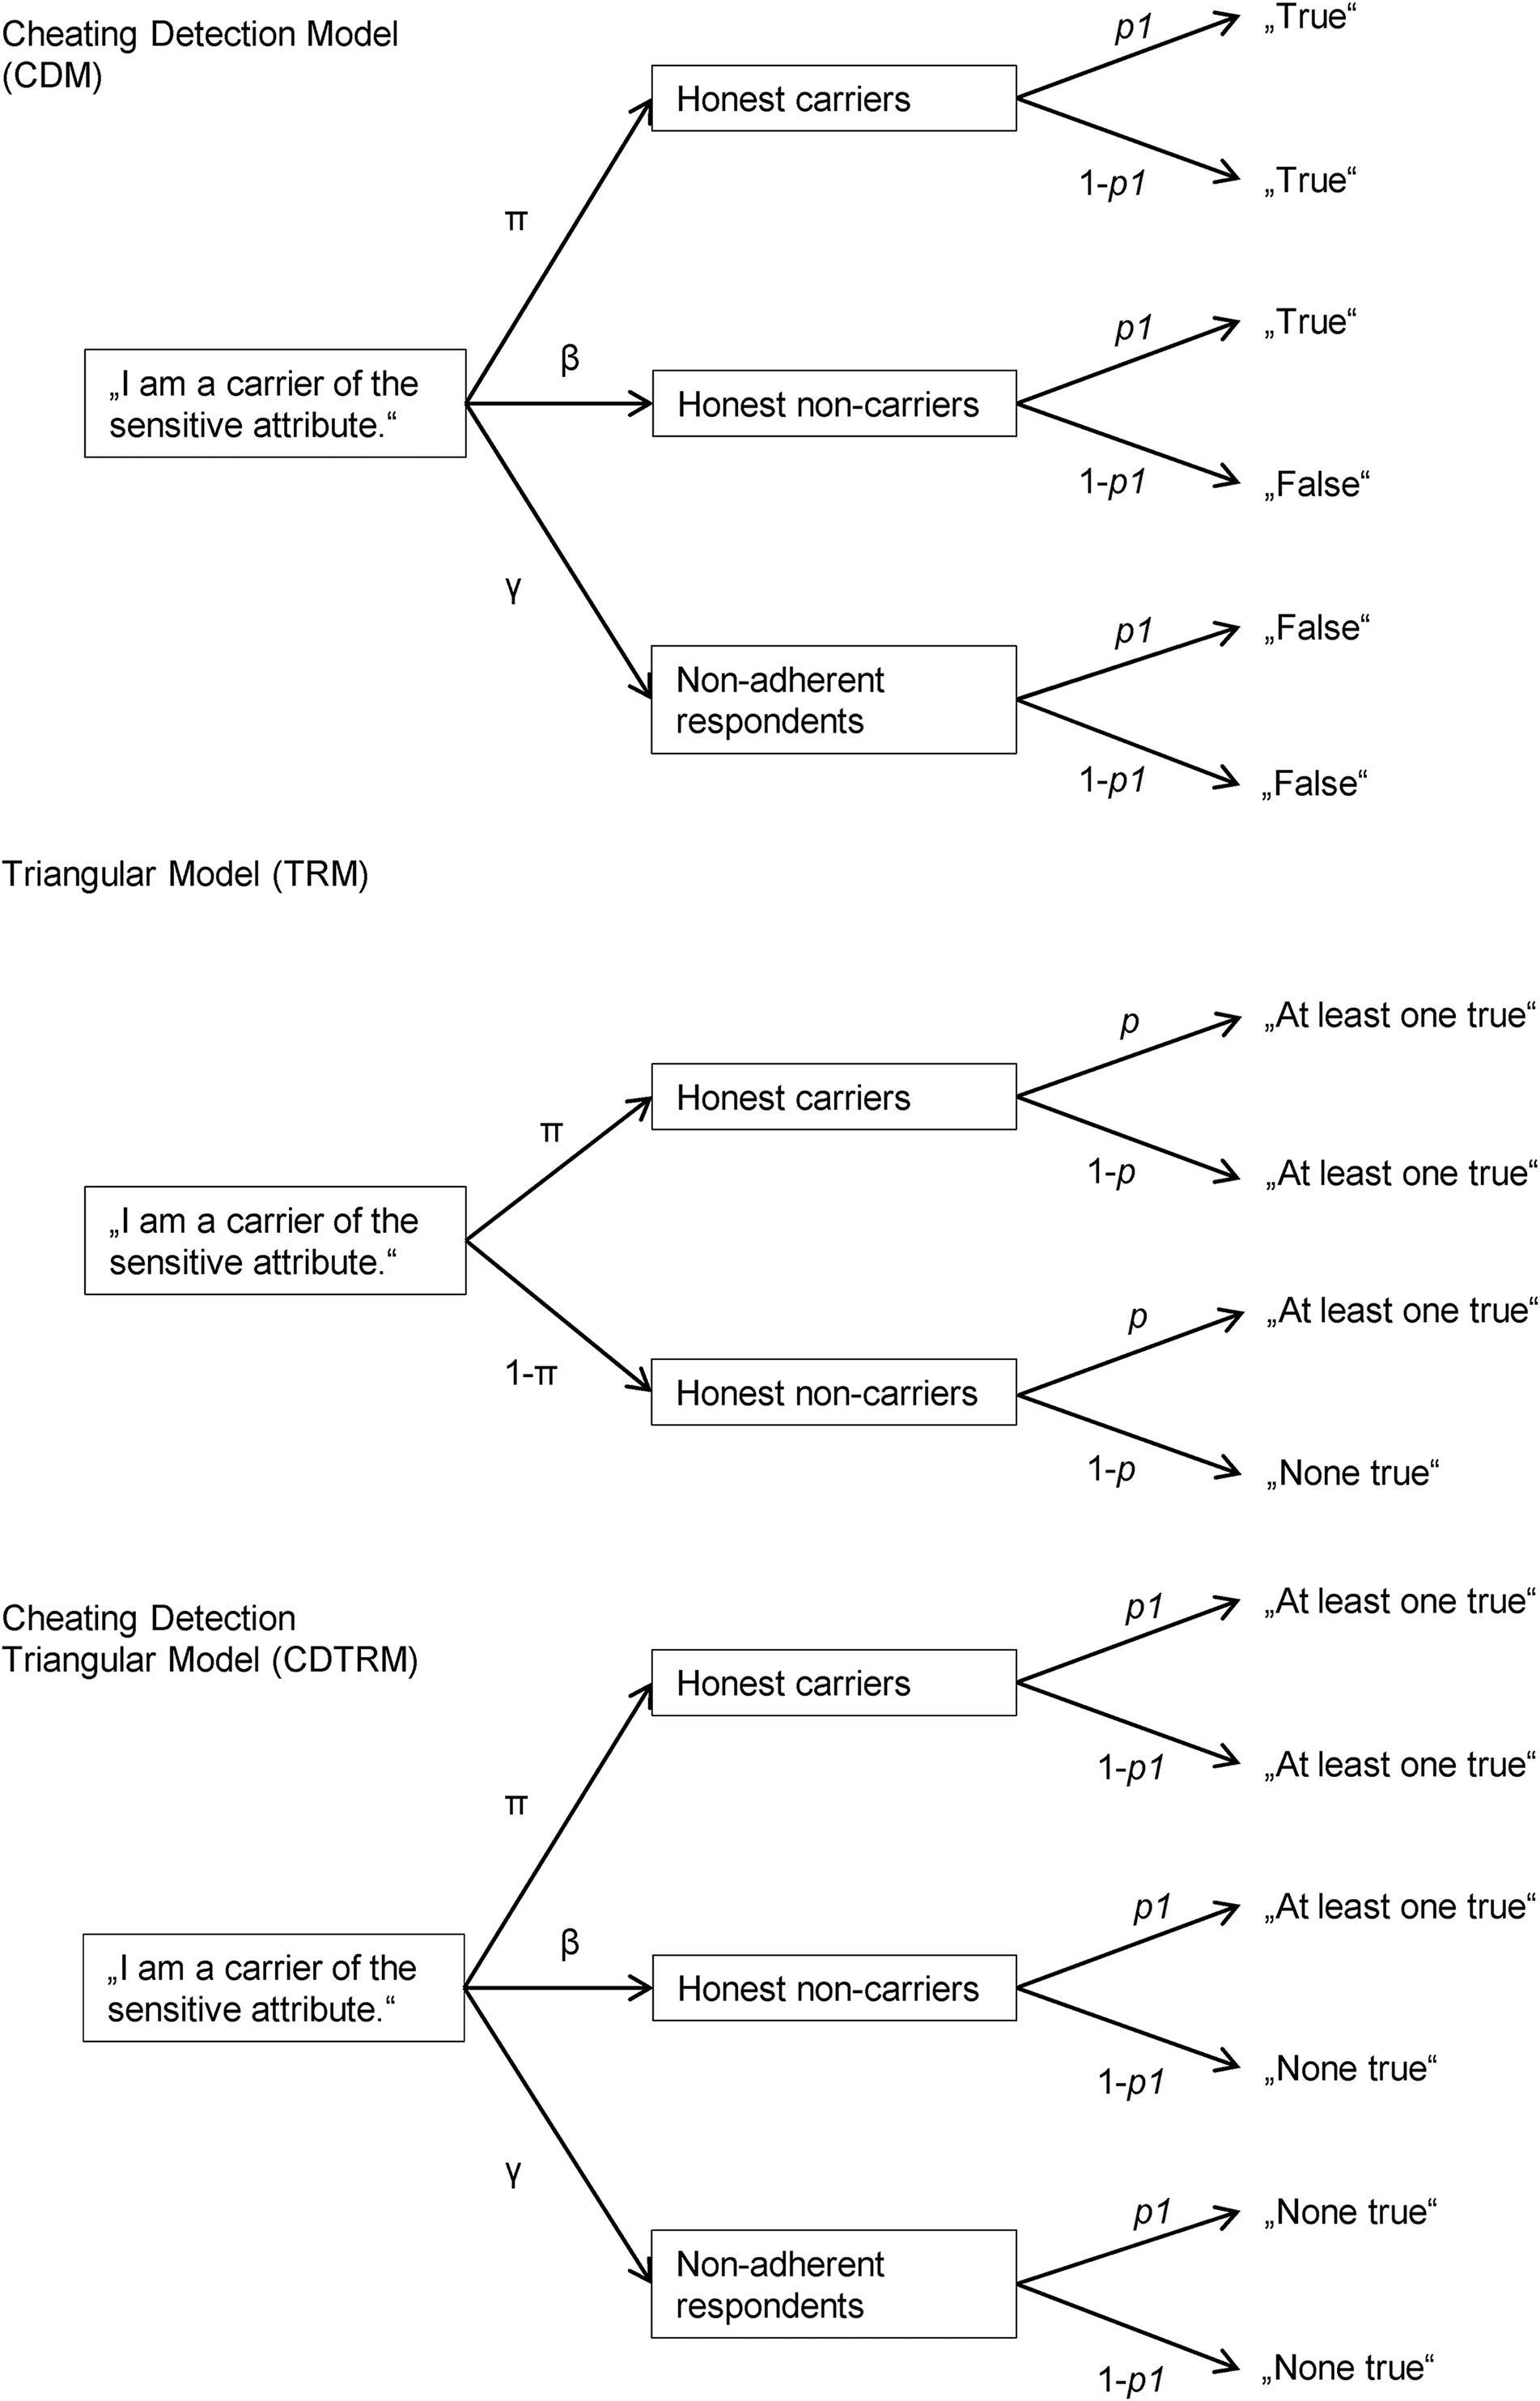
Tree models of the Cheating Detection Model (CDM) for the group with randomization probability p1, the Triangular Model (TRM), and the Cheating Detection Triangular Model (CDTRM) for the group with randomization probability p1. In the CDM, respondents are instructed to answer “yes” irrespective of their true status with probability p1, and to answer honestly with probability 1 − p1. In the (CD)TRM, respondents are asked to provide a joint answer to a sensitive statement with unknown prevalence π and a non-sensitive statement with known randomization probability p1. For the second group in both the CDM and the CDTRM, parameter p1 is simply replaced with p2.
In applied settings, the CDM has been used to investigate the prevalence of phenomena such as doping (Frenger, Pitsch, and Emrich 2016; Pitsch and Emrich 2011; Pitsch, Emrich, and Klein 2007; Schröter et al. 2016). To validate the CDM, several studies have compared the prevalence estimates obtained with the CDM to prevalence estimates obtained with a conventional direct question (DQ). Significantly higher prevalence estimates for socially undesirable attributes or significantly lower prevalence estimates for socially desirable attributes were interpreted as more valid and less distorted by social desirability bias. Employing this so-called “weak” validation criterion, the CDM was found to be superior to DQ for investigating sensitive attributes such as tax evasion (Musch, Bröder, and Klauer 2001), insufficient dental hygiene (Moshagen et al. 2010), cooperation in the prisoner dilemma game (Moshagen, Hilbig, and Musch 2011), medication non-adherence (Ostapczuk, Musch, and Moshagen 2011), opposition to granting asylum to civil war refugees, and prejudice against gay people (Moshagen and Musch 2012). Other studies, however, did not detect significant differences between prevalence estimates obtained via the CDM and DQ for sensitive attributes such as academic dishonesty (Ostapczuk, Moshagen et al. 2009a), xenophobia (Ostapczuk, Musch, and Moshagen 2009b), negative attitudes toward people with disabilities (Ostapczuk and Musch 2011), and the use of renewable energy (Moshagen and Musch 2012). An alternative explanation for some of these negative results might be that the topic under investigation was not considered sensitive enough in the respective samples (e.g. Moshagen and Musch 2012). In such cases, prevalence estimates are not expected to be biased by socially desirable responding and should therefore not differ between different questioning techniques. Moreover, a recent study comparing several indirect questioning techniques found CDM questions to be less comprehensible than conventional direct questions (Hoffmann et al. 2017).
Importantly, ‘weak’ validation studies cannot determine whether prevalence estimates accurately reflect the true prevalence of sensitive attributes because under- or overestimates can never be identified as such without knowing the ground truth (cf. Umesh and Peterson 1991). Strong validation studies in which the prevalence of a sensitive attribute is known can provide better evidence regarding the validity of indirect questioning techniques (Moshagen et al. 2014; Umesh and Peterson 1991). Even more conclusive evidence can be obtained by conducting strong validation studies in which individual-level data with respect to the sensitive attribute are collected, because they make it possible to determine false positive and false negative rates and thus sensitivity and specificity (Höglinger and Diekmann 2017; Höglinger and Jann 2018; Umesh and Peterson 1991). However, no strong validation study has yet been conducted for the CDM.
The CDM does not make any assumptions about whether respondents who disregard the instructions are carriers or non-carriers of the sensitive attribute, and to the best of our knowledge, no study has ever tried to empirically determine the true status of non-adherent respondents. However, substantial rates of instruction non-adherence (γ) have been found in most studies applying the CDM. The CDM provides a lower bound of π for the prevalence of the sensitive attribute (assuming that no non-adherent respondent is a carrier) and an upper bound of π + γ (assuming that all non-adherent respondents are carriers). Therefore, high proportions of non-adherent respondents lead to uninformatively large ranges between the lower and upper bounds for the prevalence of the sensitive attribute. In a study of lifetime medication non-adherence among patients of medical practices, the proportion of non-adherent respondents was found to be as high as 47.1% (Ostapczuk et al. 2011), and in a study on physical doping in sports, non-adherent respondents accounted for up to 60% of the sample (Schröter et al. 2016). This resulted in very large ranges between the lower bound of 32.7% and the upper bound of 79.8% for the prevalence of medication non-adherence (Ostapczuk et al. 2011), and between the lower bound of 11.9% and the upper bound of 76.8% for the prevalence of illegal physical doping (Schröter et al. 2016). Arguably, these very broad intervals are of limited practical use. Hence, it is important to collect more information regarding the true status of non-adherent respondents. For this reason, we decided to conduct the first strong validation of the CDM based on individual-level data to assess the true status of non-adherent respondents for the first time in a given sample. The proportion of carriers among non-adherent respondents observed in the present study might not be generalizable to other samples or sensitive attributes; however, it enables us to test whether all non-adherent respondents are generally carriers or non-carriers or whether non-adherent respondents can also be a mixture of carriers and non-carriers.
The Triangular Model
As an alternative to models enabling the detection of instruction non-adherence, so-called nonrandomized response techniques (NRRTs; Yu et al. 2008) such as the TRM (Yu et al. 2008) have been developed. These techniques provide simplified instructions to increase respondents’ understanding and perceived confidentiality, and thereby try to minimize or eliminate instruction non-adherence. In the TRM, respondents are presented with two statements—a sensitive statement A with unknown prevalence π (e.g. ‘I have taken cocaine’) and a non-sensitive statement B with known prevalence p that is used for randomization (e.g. ‘I was born in November or December’; p = .158 according to official birth statistics, Pötzsch 2012). Respondents are asked to indicate whether “at least one of the statements is true (no matter which one)” or “none of the statements is true.” A graphical depiction of the TRM is given in the middle of Figure 1. Similar to the CDM, one of the answer options in the TRM can be considered self-protective, as it explicitly excludes being a carrier of the sensitive attribute (‘none of the statements is true’). In contrast to the CDM, however, the original TRM does not include a parameter estimating the proportion of non-adherent respondents in the sample. Instead, it assumes that despite the presence of a “safe” answer option, all respondents adhere to the instructions. The existence of a self-protective response option in the TRM along with the lack of a cheating detection mechanism may be responsible for some of the rather unsatisfactory results obtained with the TRM. Three weak validation studies found that the TRM provided prevalence estimates for sensitive attributes that were not higher, and therefore presumably not more valid, than estimates obtained via DQ (Hoffmann, Meisters, and Musch 2020; Erdmann 2019; Jerke and Krumpal 2013). However, the prevalence of a non-sensitive control attribute could accurately be recovered using the TRM (Hoffmann et al. 2020). Moreover, a strong validation study evaluating the TRM based on individual-level data has not yet been conducted. The present study attempted to close this gap.
The Cheating Detection Triangular Model
Ideally, an indirect questioning technique should both maximize the proportion of respondents who fully understand the instructions, and detect all respondents who do not follow them. However, no such model is currently available. We therefore propose the new CDTRM, which combines the strengths of its two predecessor models, the simplified instructions of the TRM and a CDM-like mechanism for detecting non-adherent respondents.
In the CDTRM, respondents receive the exact same instructions and answer options as in the TRM. However, like in the CDM—and in contrast to the original TRM—we assume that the sample can be divided into a proportion of honest carriers of the sensitive attribute (π), a proportion of honest non-carriers (β), and a proportion of respondents who completely ignore the instructions and always choose the self-protective alternative (γ). Just like the CDM, the CDTRM is based on collecting two independent samples with different randomization probabilities p1 (e.g. p1 = .158) and p2 (e.g. p2 = .842) to accommodate the additional parameter and make the model identifiable. A similar approach of splitting the sample into two groups was recently proposed by Heck, Hoffmann, and Moshagen (2018) regarding the CWM. A graphical depiction of the CDTRM for the first group with randomization probability p1 is given in Figure 1; like in the CDM, parameter p1 is simply replaced with p2 for the second group.
Aims of the Study
In the present study, we wanted to conduct the first strong validations of (a) the Cheating Detection Model (CDM), which offers a mechanism to detect the proportion of non-adherent respondents; (b) the Triangular Model (TRM), which seeks to minimize instruction non-adherence through simplified instructions; and (c) the newly proposed Cheating Detection Triangular Model (CDTRM) that combines the strengths of the two approaches by providing both simplified instructions and a mechanism to detect instruction non-adherence. We wanted to compare all three questioning techniques with each other and to a direct questioning control condition. Using an experimentally induced sensitive attribute allowed us not only to compare the known prevalence of the sensitive attribute with the prevalence estimates of the competing models, but also to compute the questioning techniques’ sensitivity and specificity based on individual-level data. We expected the indirect questioning techniques (CDM, TRM, and CDTRM) to provide more valid prevalence estimates than a conventional DQ. We further expected the newly proposed CDTRM to provide more valid prevalence estimates than both the CDM and the TRM, since only the CDTRM combines the unique strengths of both of these approaches. Finally, the current study investigated for the first time whether in the current sample non-adherent respondents in the CDM and the CDTRM were carriers of the sensitive attribute, non-carriers, or a mixture of both.
MATERIALS and METHOD
Participants
Respondents were recruited via a German commercial online panel provider. As a prerequisite for participation and to rule out language difficulties as a potential explanation for an insufficient understanding of the questions, respondents had to be at least 18 years old and had to indicate German as their native language. These criteria were met by 3308 respondents. Of these, 521 dropped out before answering the sensitive question (15.75% of the initial sample). The dropout rate differed significantly across the three questioning technique conditions, DQ: 0.36%, CDM: 19.74%, (CD)TRM: 18.02%, χ²(2) = 121.90, p < .001, Cramer’s V = 0.19. In a pairwise comparison, dropout rates did not differ significantly between the CDM and (CD)TRM conditions, indicating that the dropout rate was generally lower in the direct than in the two indirect questioning conditions, χ²(1) = 1.32, p = .250, Cramer’s V = 0.02.
The final sample consisted of the 2787 respondents (57.73% female) who answered the sensitive question. There were 558 respondents in the DQ condition, 554 respondents in the CDM condition with randomization probability p1, 556 respondents in the CDM condition with randomization probability p2, 563 respondents in the (CD)TRM condition with randomization probability p1, and 556 respondents in the (CD)TRM condition with randomization probability p2. The survey was carried out in accordance with the revised Declaration of Helsinki (World Medical Association 2013) and the ethical guidelines of the German Society for Psychology (Berufsverband Deutscher Psychologinnen und Psychologen and Deutsche Gesellschaft für Psychologie 2016).
A priori power considerations based on Ulrich et al. (2012) indicated that a four-digit sample size would ensure sufficient statistical power (1-ß ≥ .80) for the planned prevalence comparisons and that twice as many respondents had to be allocated to the indirect questioning conditions compared to the DQ condition to compensate for the generally lower efficiency of indirect questioning techniques (Moshagen et al. 2012; Ulrich et al. 2012). Post-hoc power analyses confirmed that our sample size was sufficient to achieve high statistical power (1 − ß > .99) for comparisons of the prevalence estimates obtained via DQ, CDM, CDTRM and the respective true prevalences. The distribution of gender, age group and educational achievement in the final sample did not significantly differ across questioning technique conditions (see Table 1).
Demographics by Questioning Technique.
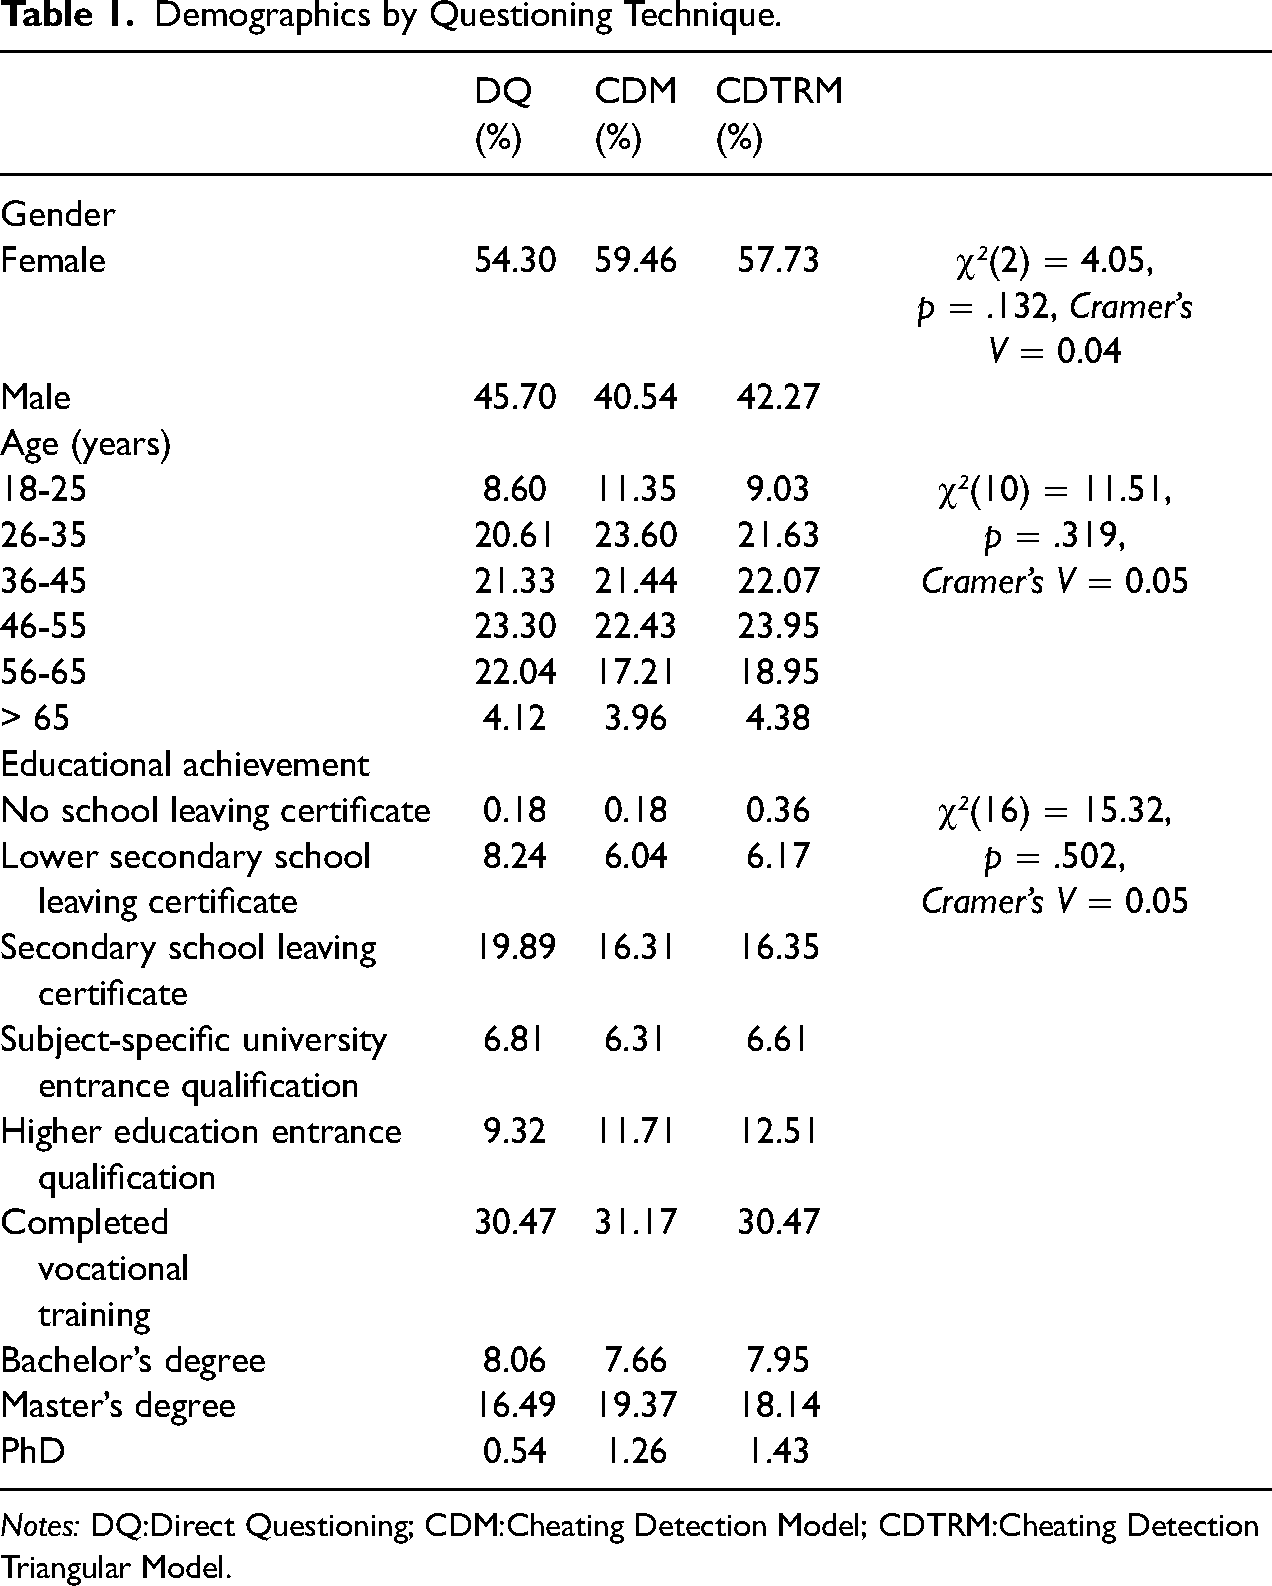
Notes: DQ:Direct Questioning; CDM:Cheating Detection Model; CDTRM:Cheating Detection Triangular Model.
Anagram Cheating Task
To conduct a strong validation, we experimentally induced a sensitive attribute with known prevalence using the anagram paradigm established by Hoffmann et al. (2015). In this paradigm, respondents are first asked to solve some anagrams in private and are then given an opportunity to over-report on their performance. To this end, we showed the respondents three scrambled words in sequential order, and asked them to solve these anagrams within 20 s each. Rather than typing in the solutions, we asked respondents to simply solve the anagrams in their head. Twenty seconds after the presentation of each word, the next anagram was presented. The first two anagrams were very easy and were solved by 99% of the participants in a pilot study (Hoffmann et al. 2015); the third anagram, however, was extremely difficult and solved by only 1% of the pilot study participants. After the third anagram, the solutions to all three anagrams were presented. Respondents were then given an opportunity to over-report on their performance when answering the following question: “Did you solve all three anagrams in the available time?” The two answer options read: “No, I solved less than three anagrams” and “Yes, I solved all three anagrams.” An incentive to over-report was provided by announcing that only respondents who had solved all three anagrams would be allowed to participate in a lottery at the end of the survey. The identity of the over-reporters was protected because the respondents did not report their anagram solutions. However, because the pilot study had shown that only 1% of respondents could actually solve all three anagrams (cf. Hoffmann et al. 2015), respondents claiming to have solved all anagrams were considered over-reporters. This allowed us to conduct a strong validation based on individual-level data, going beyond previous investigations employing the CDM and the TRM.
Sensitive Question
The sensitive statement was formulated identically in all questioning technique conditions and read: “On the anagram task, I claimed that I had solved more anagrams than I had actually solved.”
Direct questioning
In the DQ condition, respondents were asked to evaluate the sensitive statement by selecting “true” or “false.”
Cheating detection model
In the CDM condition with randomization probability p1, respondents were asked to answer “true” if they were born in November or December, irrespective of whether they had actually over-reported on the anagram task, or to answer the question honestly if they were born between January and October. The probability of being directed to answer “true” due to being born in November or December was p1 = .158 according to official birth statistics (Pötzsch 2012). In the second CDM condition, these instructions were reversed and a different randomization probability p2 = 1 − p1 = .842 was employed. Thus, respondents were instructed to answer “true” irrespective of their status with respect to the sensitive attribute if they were born between January and October, and to respond honestly if they were born in November or December. We chose these particular randomization probabilities since values of p1 and p2 being as different as possible have been shown to maximize the statistical power to detect cheating in the CDM, but extremely small values of p eliminate confidentiality and should therefore be avoided. Extremely high values of p (approximating p = 1) maximize confidentiality; however, they also eliminate the randomization process, thereby counteracting the very purpose of indirect questioning techniques. Values between .70 and .85 (or .15 and .30, respectively) have therefore been identified as optimal for RRT models (Soeken and McReady 1982), and RRT models with two-group designs have also successfully employed these or similar randomization probabilities (Hoffmann and Musch 2016; Meisters, Hoffmann, and Musch 2020b; Ostapczuk, Moshagen et al. 2009a; Ostapczuk et al. 2011).
Cheating detection triangular model
In the (CD)TRM conditions, respondents received the instructions for the Triangular Model. We presented them with a sensitive statement and a non-sensitive statement with known prevalence pi (“I was born in November or December”, p1 = .158, or “I was born between January and October”, p2 = .842; Pötzsch 2012). The answer options read: “None of the statements is true” versus “At least one of the statements (no matter which one) is true” and were presented in fixed order.
Comprehension questions in the CDM and CDTRM conditions
In both indirect questioning conditions (CDM and CDTRM), respondents were given detailed instructions on the respective model and had to answer four comprehension questions to ensure that they had properly understood the procedure (cf. Meisters, Hoffmann, and Musch 2020a). These questions covered all four possible cases of carrying versus not carrying the sensitive and the non-sensitive attributes and were presented in fixed order. For example, the first comprehension question read “Assuming you were born in February, and assuming you had not exaggerated your report on the number of anagrams solved: Which answer would you have to give?” The response options were identical to those provided in the respective model, and were presented in random order. For each of the comprehension questions, respondents received feedback on their performance. Comprehension questions that had been answered incorrectly were presented again up to a maximum of three times (including the first presentation).
Self-reported response behavior and subjective evaluation of the questioning technique
At the end of the questionnaire, respondents were asked to evaluate their subjective perception of the sensitive question and provide information on their response behavior by indicating their agreement with nine statements on a 7-point Likert scale ranging from 1 (strongly disagree) to 7 (strongly agree). The nine statements are listed in Appendix D of the electronic supplement and included questions referring to the subjectively perceived comprehensibility and privacy protection afforded by the sensitive question, as well as a question asking whether respondents had given random responses.
Procedure
After accessing the online questionnaire, respondents were asked to read a short introduction, provide informed consent, and answer some demographic questions regarding their age, gender, and level of educational achievement. The subsequent pages contained an explanation of the anagram task and an opportunity to work on two example anagrams to familiarize oneself with the task. Before starting the main anagram task, respondents were informed that they would be given an opportunity to participate in a lottery of 100€, 50€ and 30€ if they were able to solve all three anagrams within the allotted time. After the anagram task, respondents had the opportunity to over-report on their performance.
Employing one of the three questioning technique formats (DQ, CDM, (CD)TRM), they were then asked whether they had over-reported on the anagram task. Respondents in the CDM and (CD)TRM conditions received detailed instructions on the questioning technique prior to this question, and had to answer the four comprehension questions first to measure whether they had understood the procedure (cf. Meisters et al. 2020a). After answering the sensitive question, respondents were asked to provide information on their subjective experience and their response behavior. At the end of the survey, all respondents were given the opportunity to participate in the lottery, and were debriefed and thanked for their participation. Contrary to the initial announcement, participation in the lottery was not limited to respondents who had over-reported on the anagram task to not discriminate against honest respondents.
Statistical Analyses
To obtain and compare parameter estimates, we established multinomial processing tree (MPT) models (Batchelder 1998, Batchelder and Riefer 1999) for all questioning techniques as detailed in, for example, Moshagen et al. (2011), Moshagen et al. (2012), and Ostapczuk et al. (2011). In all models, parameter π represents the unknown prevalence of the sensitive attribute. Additional parameters in the CDM and CDTRM reflect the unknown proportions of non-carriers of the sensitive attribute (β) and respondents not adhering to the instructions (γ = 1 − π −β). In both the CDM and the CDTRM, the status of non-adherent respondents with respect to the sensitive attribute is assumed to be unknown. Therefore, parameter π in these models represents only a lower bound for the prevalence of the sensitive attribute (assuming that all non-adherent respondents are non-carriers); the upper bound is given by π + γ (assuming that all non-adherent respondents are in fact carriers). The parameters p1 and p2 denote the known prevalence of the non-sensitive attribute used for randomization.
On the basis of the empirically observed answer frequencies, parameter estimates were derived using the expectation-maximization algorithm (Dempster, Laird, and Rubin 1977, Hu and Batchelder 1994) as implemented in the software multiTree (Moshagen 2010). The asymptotically χ2-distributed log-likelihood statistic G² was used to assess model fit. For parameter comparisons, the model fit of a restricted model setting the parameters either equal or equal to a constant was compared to the model fit of a baseline model in which the parameters were estimated freely. Significant changes in model fit (ΔG²) indicated that the restricted model had a worse fit than the baseline model, suggesting that the respective parameter restriction was inadmissible.
To obtain prevalence estimates based on the CDTRM, the TRM instructions were applied to two groups with different randomization probabilities p1 and p2. Thus, as a by-product of employing the CDTRM, we also employed two TRM conditions that differed regarding their randomization probability, unlike traditional TRM applications. Comparing the resulting two estimates allowed us to conduct the first empirical test of an assumption inherent to the TRM that TRM prevalence estimates are unaffected by randomization probability. No such test had previously been conducted because the original TRM (Yu et al. 2008) requires only one group of respondents. Therefore, it was not possible to detect a potential unwanted influence of randomization probability on the prevalence estimates in previous studies employing the TRM. If prevalence estimates differed as a function of randomization probability, this would contradict a central assumption underlying the TRM. Such a finding would call into question the applicability of the TRM and suggest that the obtained prevalence estimates are not trustworthy (cf. Heck et al. 2018).
Sensitivity and specificity of the models
To determine the sensitivity and specificity of the models, individual-level data regarding the respondents’ status with respect to the sensitive attribute are required. Given that the probability of solving the third anagram in the anagram task was very low (1%, cf. Hoffmann et al. 2015), respondents who claimed to have solved all three anagrams were classified as over-reporters and thus as carriers of the sensitive attribute. Accordingly, respondents who admitted that they had solved fewer than three anagrams were classified as non-carriers. This classification allowed us to compute separate prevalence estimates for carriers and non-carriers, respectively. The sensitivity of a questioning technique is defined as the proportion of carriers who are identified as such. In the DQ and TRM conditions, model sensitivity could therefore be determined by estimating the prevalence π among known carriers of the sensitive attribute. In the CDM and CDTRM conditions, π (assuming that no non-adherent respondent is a carrier) and π + γ (assuming that all non-adherent respondents are carriers) provide a lower and upper bound for the share of respondents identified as carriers, respectively. Thus, in the CDM and CDTRM conditions, a lower and upper bound for sensitivity can be obtained by estimating π and π + γ for known carriers of the sensitive attribute.
The specificity of a questioning technique is defined as the proportion of non-carriers who are identified as such. In the DQ and TRM conditions, model specificity could therefore be determined by estimating 1 − π among known non-carriers of the sensitive attribute. In the CDM and CDTRM, a lower and upper bound for the share of respondents identified as non-carriers can be calculated as β ( = 1 − π − γ; assuming that all non-adherent respondents are actually carriers) and β + γ ( = 1 − π; assuming that all non-adherent respondents are actually non-carriers). Thus, in the CDM and CDTRM conditions, a lower and upper bound for specificity can be obtained by estimating β and β + γ among non-carriers.
Proportion of carriers among non-adherent respondents
We only knew whether respondents were carriers or non-carriers of the sensitive attribute, but did not know their month of birth on an individual level. To assess the share of carriers among non-adherent respondents (γ) in the CDM and CDTRM, it was therefore necessary to extend the original MPT models by generating separate branches for carriers and non-carriers of the sensitive attribute. The parameter c_g (carriers gamma) in these extended models reflects the proportion of carriers among non-adherent respondents. The resulting extended models had one degree of freedom each; their model fit could therefore be tested.
The multiTree equations for all models and the empirically observed answer frequencies—both for the overall sample and separately for carriers and non-carriers—are provided in Appendices A and B in the electronic supplement. The raw data for the sensitive questions and the subjective evaluation of the questioning techniques as well as the SPSS code for the main analyses are available on the Open Science Framework (OSF; https://osf.io/tnmxg/).
RESULTS
Parameter Estimates, Sensitivity, and Specificity
Estimates of the prevalence, sensitivity, and specificity along with their standard errors are given in Table 2. Prevalence estimates are also shown in Figure 2. Comparisons of the prevalence estimates calculated using the competing questioning techniques can be found in Table 3. Table 4 provides comparisons of the techniques’ sensitivity and specificity.
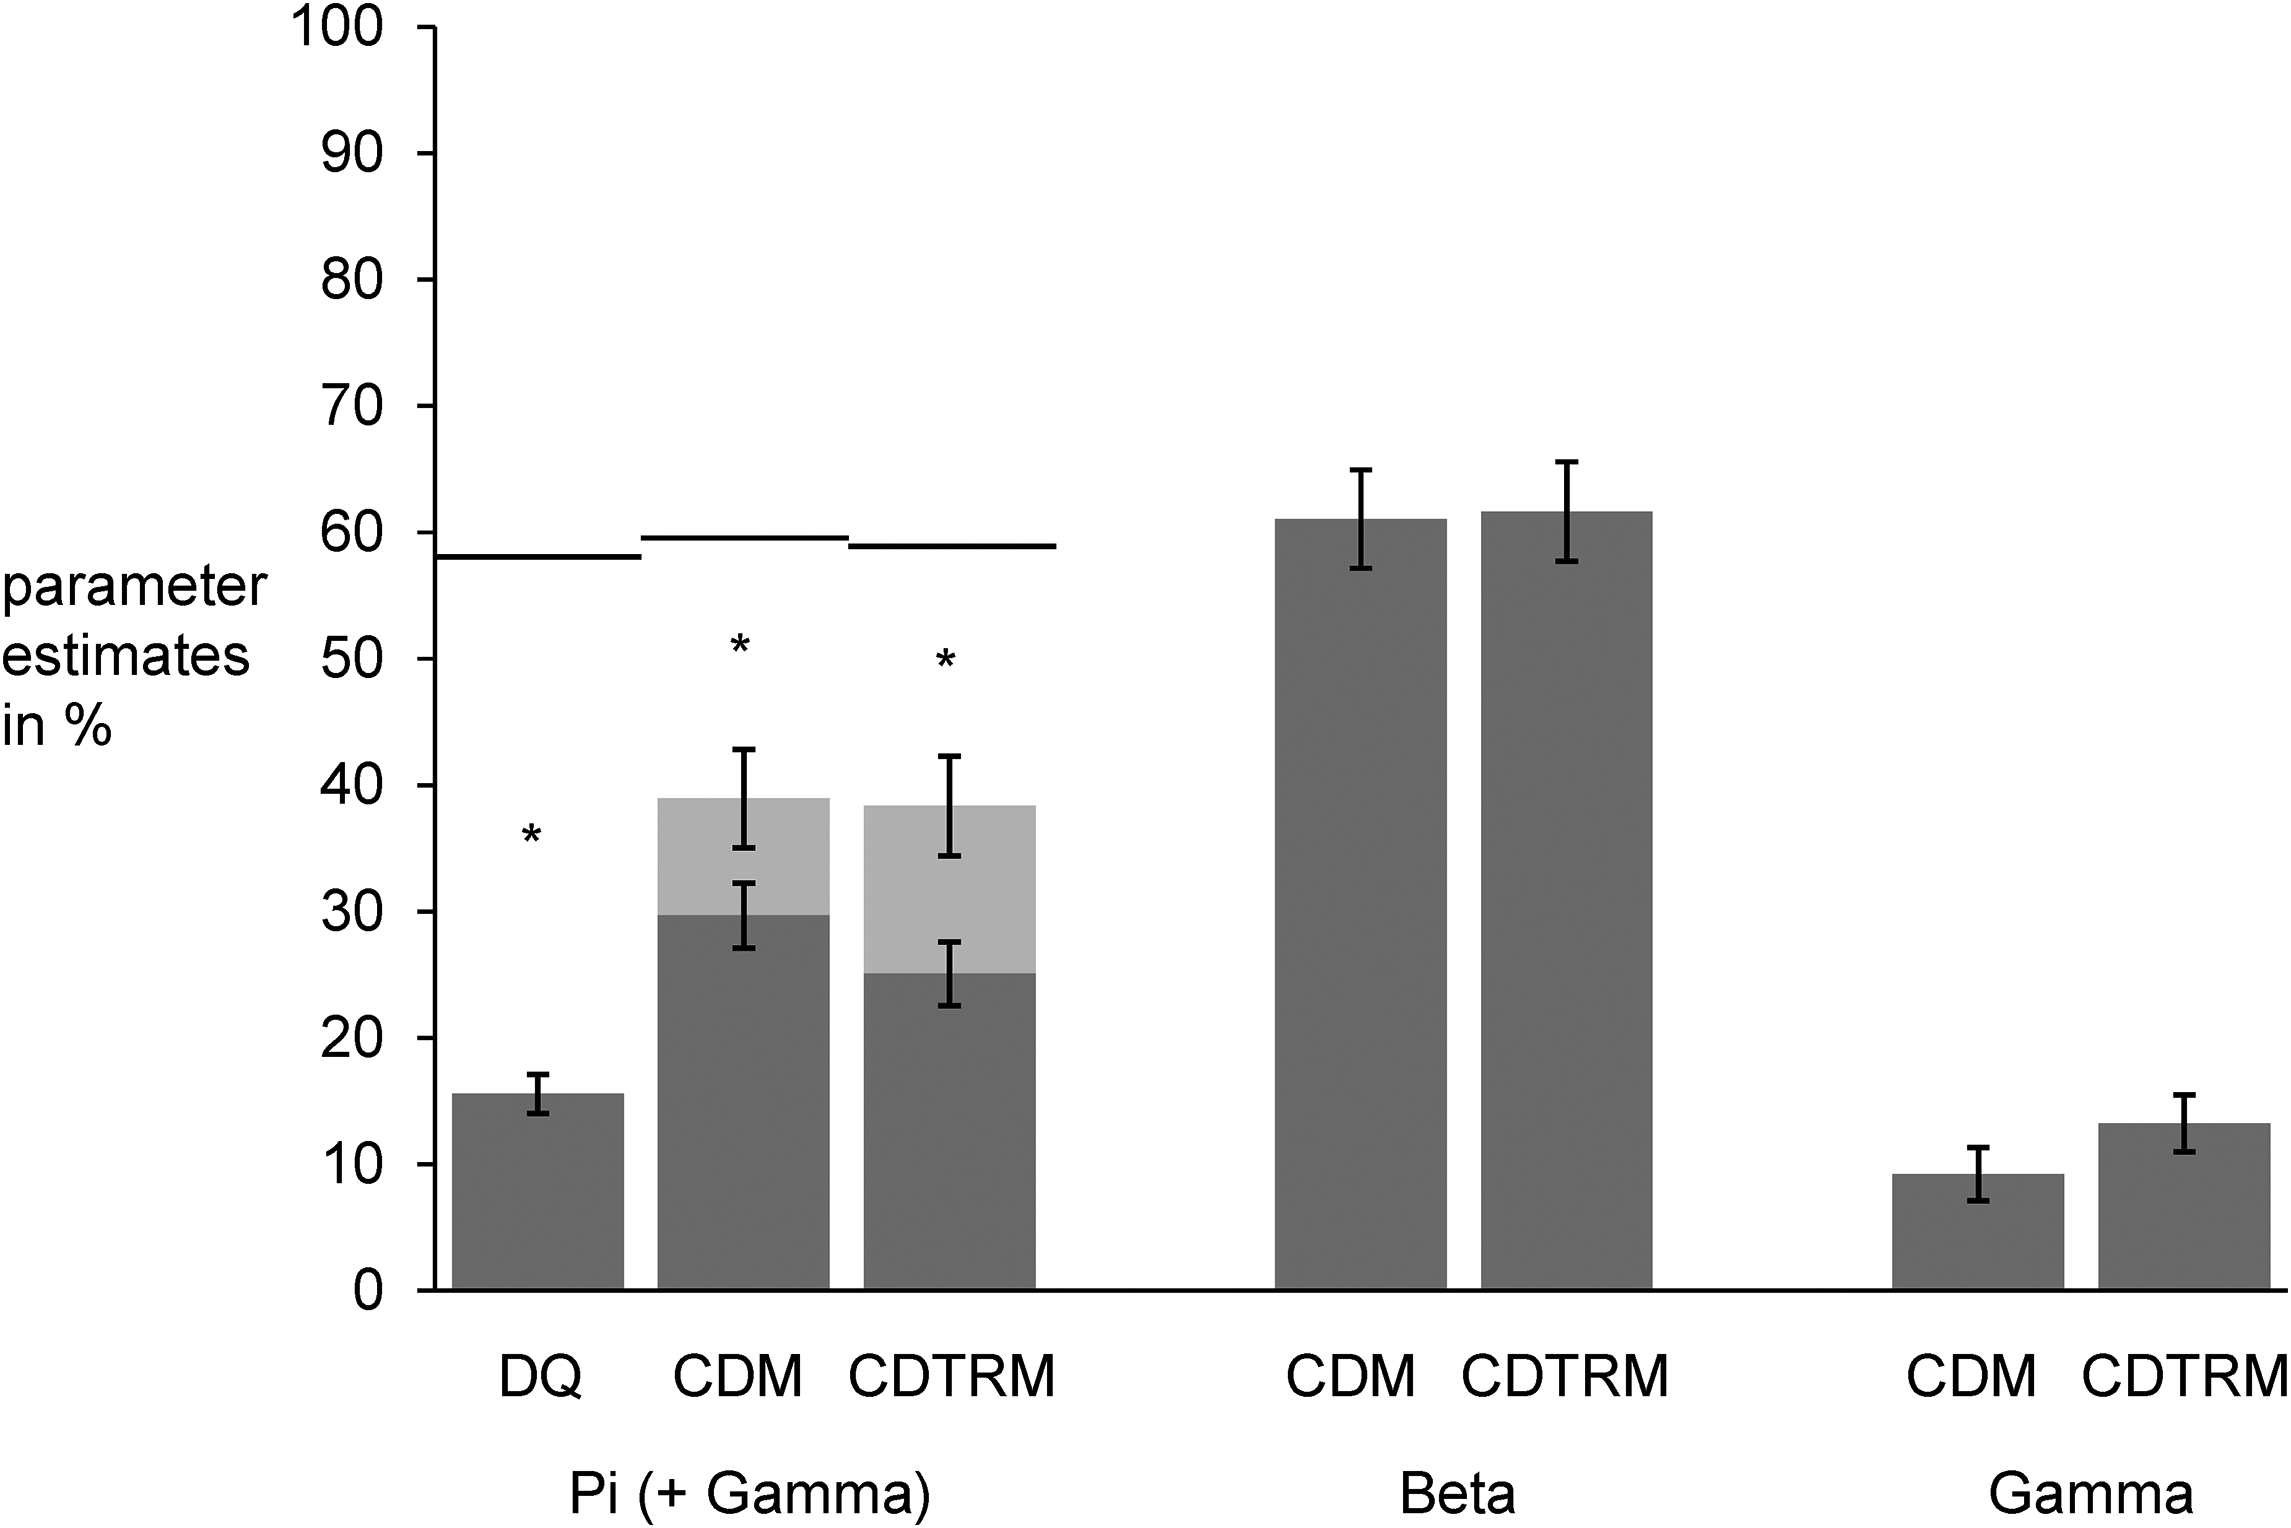
Parameter estimates for Direct Questioning (DQ), the Cheating Detection Model (CDM), and the Cheating Detection Triangular Model (CDTRM). For DQ, only the prevalence π of the sensitive attribute is estimated. For the CDM and CDTRM, the proportion of honest carriers of the sensitive attribute (π), the proportion of honest non-carriers of the sensitive attribute (β), and the proportion of non-adherent respondents who choose the self-protective response alternative (γ) is estimated. Since the true status of these non-adherent respondents remains unknown, only a lower (π) and an upper (π + γ) bound for the prevalence of the sensitive attribute can be determined. The solid lines represent the known values for the sensitive attribute in the respective conditions.
True Prevalences and Parameter Estimates (standard errors in parentheses) for the prevalence of the sensitive attribute in the total sample (N = 2787).
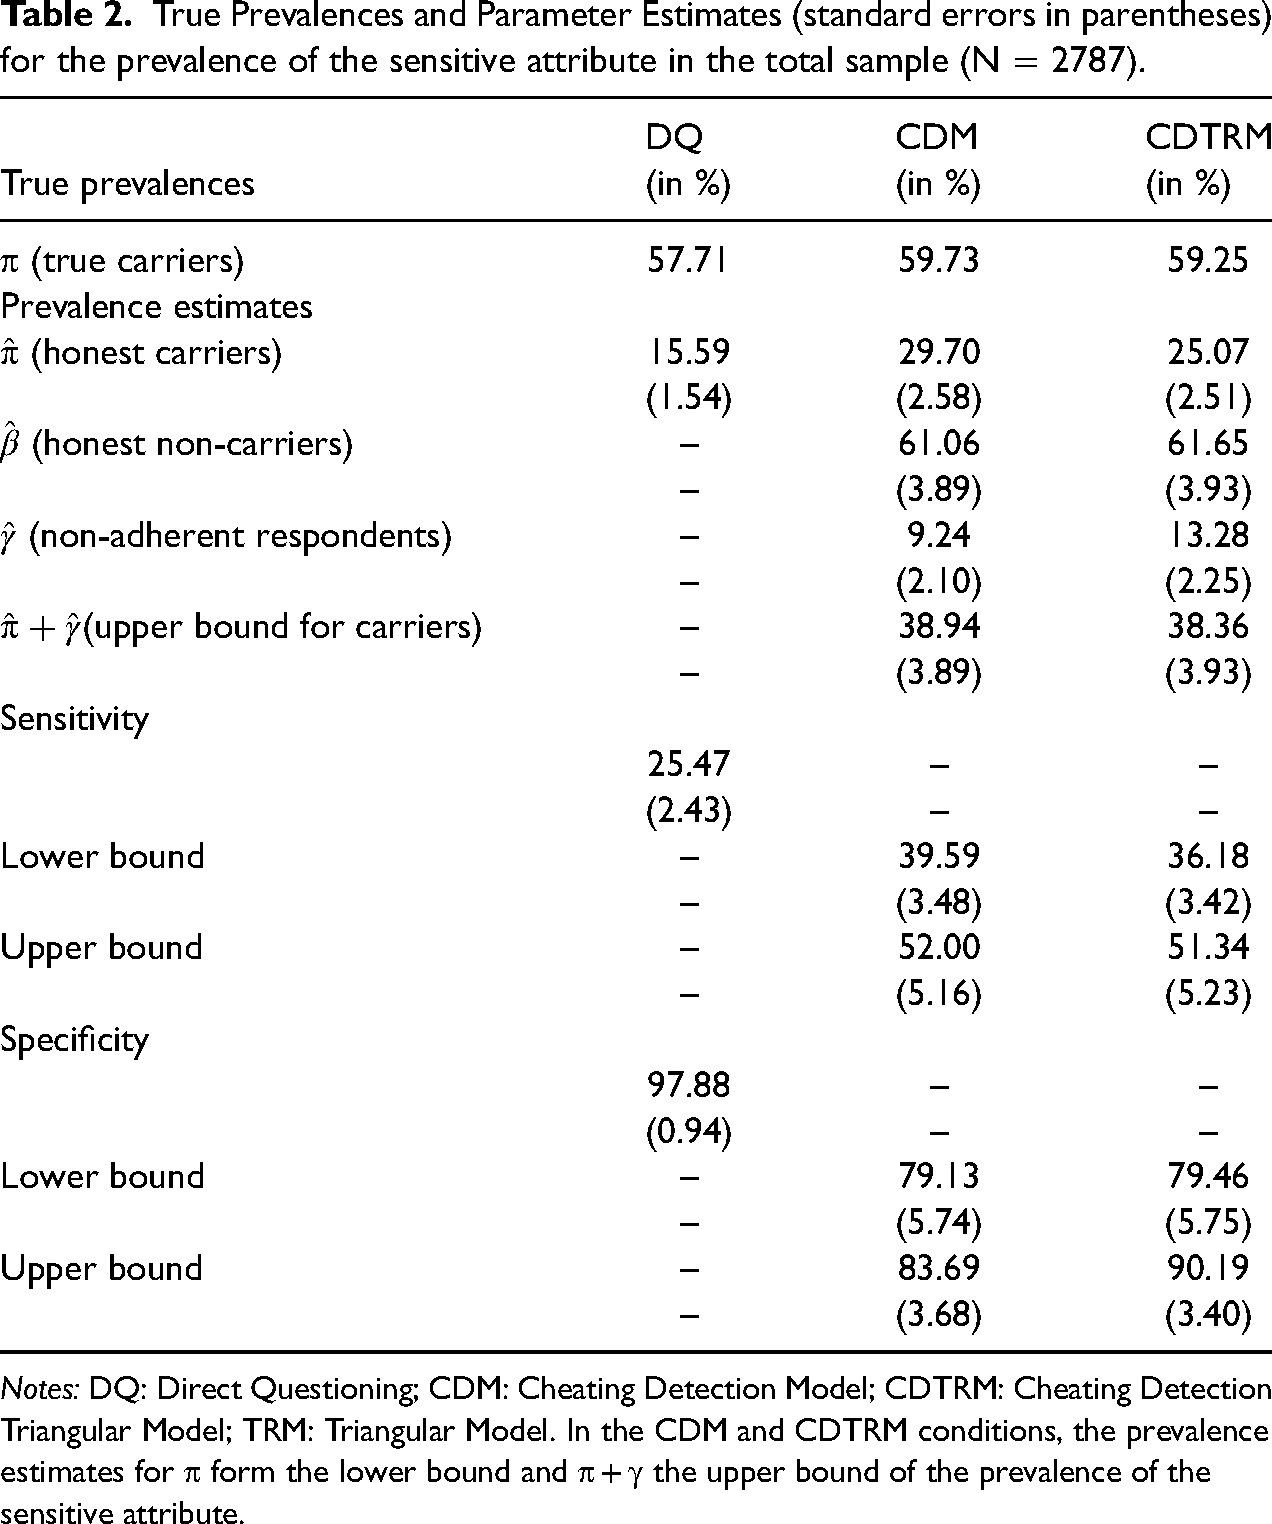
Notes: DQ: Direct Questioning; CDM: Cheating Detection Model; CDTRM: Cheating Detection Triangular Model; TRM: Triangular Model. In the CDM and CDTRM conditions, the prevalence estimates for π form the lower bound and π + γ the upper bound of the prevalence of the sensitive attribute.
Parameter comparisons for the prevalence of the sensitive attribute in the total sample (N = 2787).
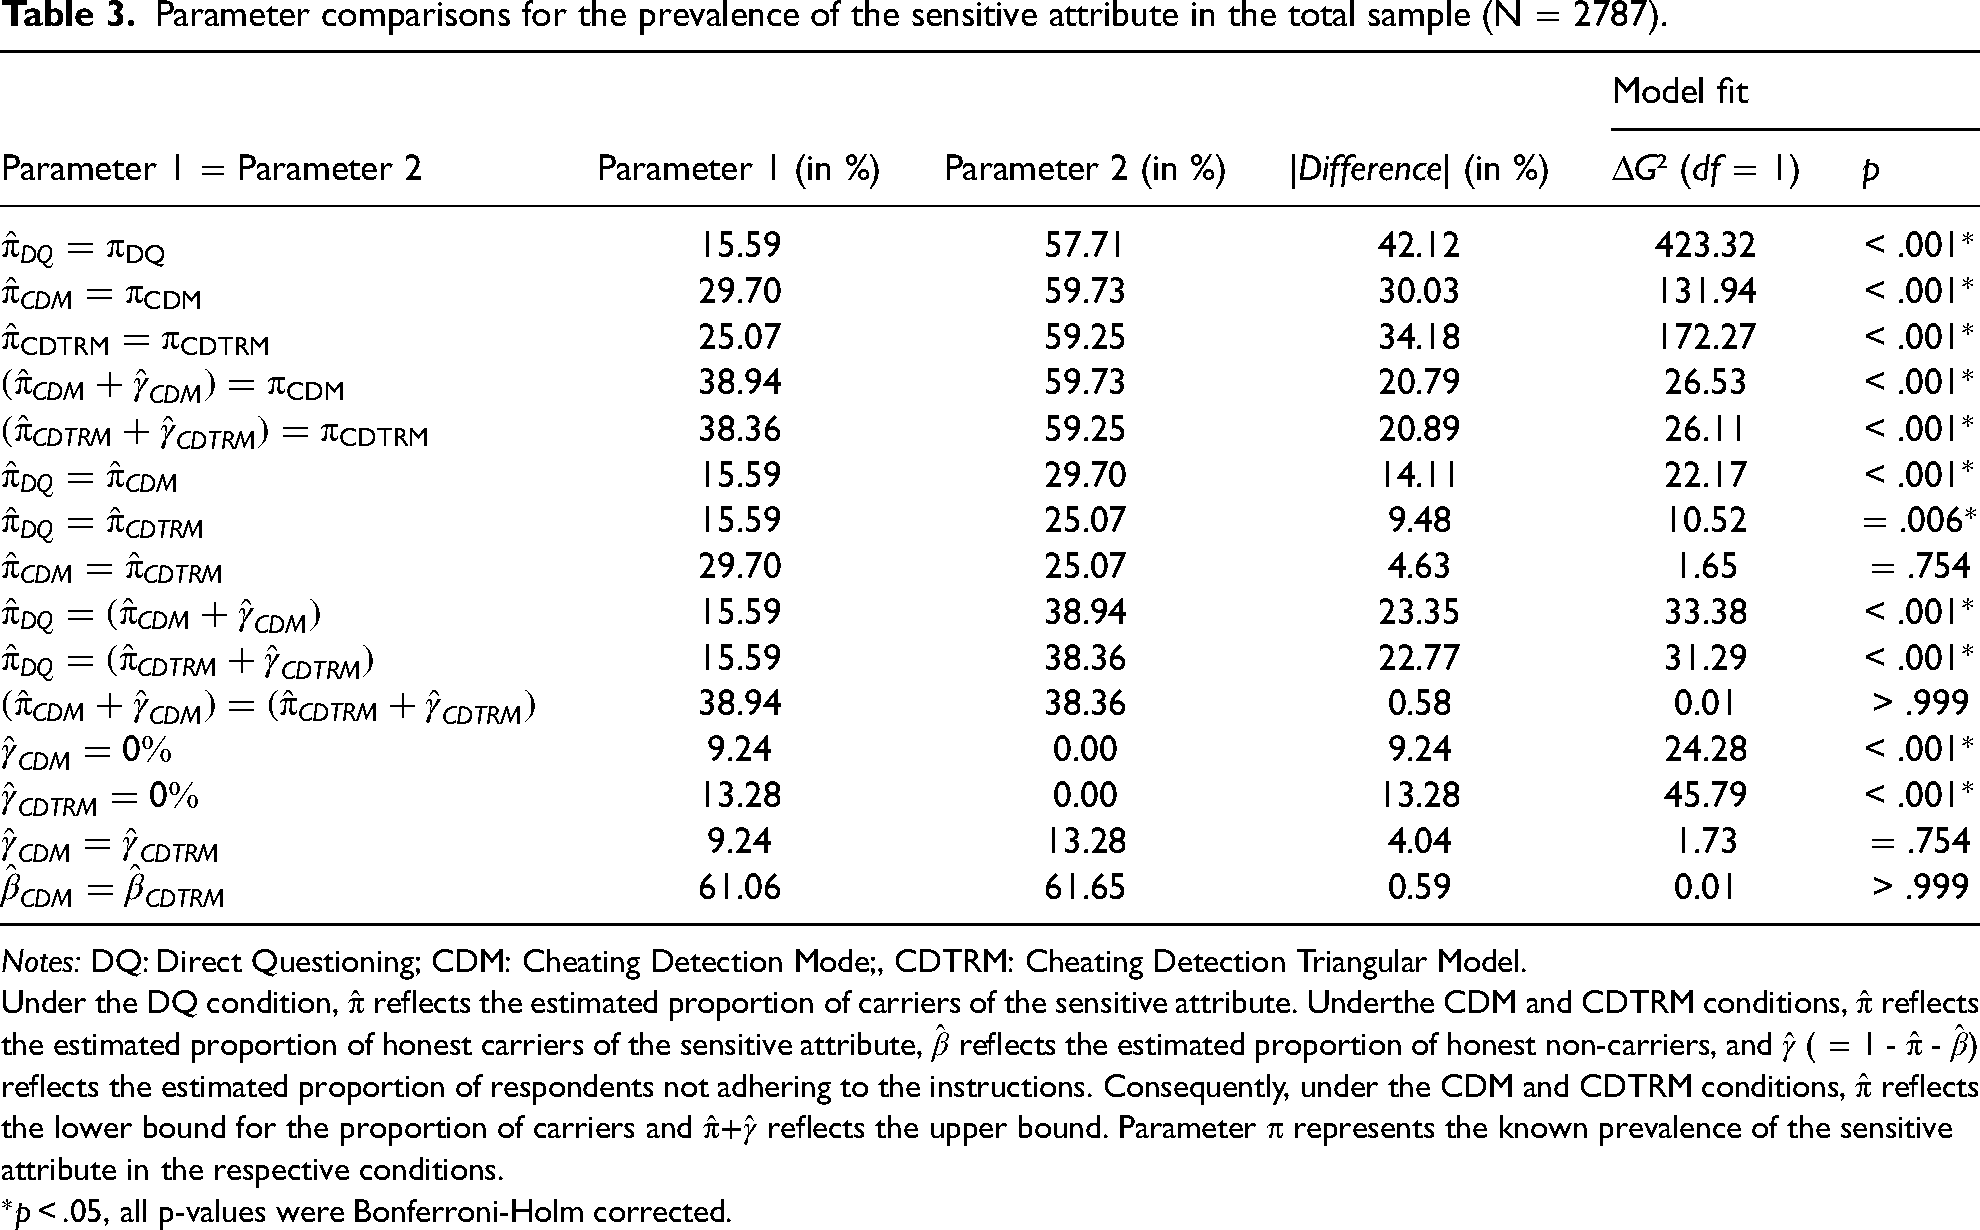
Notes: DQ: Direct Questioning; CDM: Cheating Detection Mode;, CDTRM: Cheating Detection Triangular Model.
Under the DQ condition,
*p < .05, all p-values were Bonferroni-Holm corrected.
Comparisons of Sensitivity and Specificity by questioning technique.
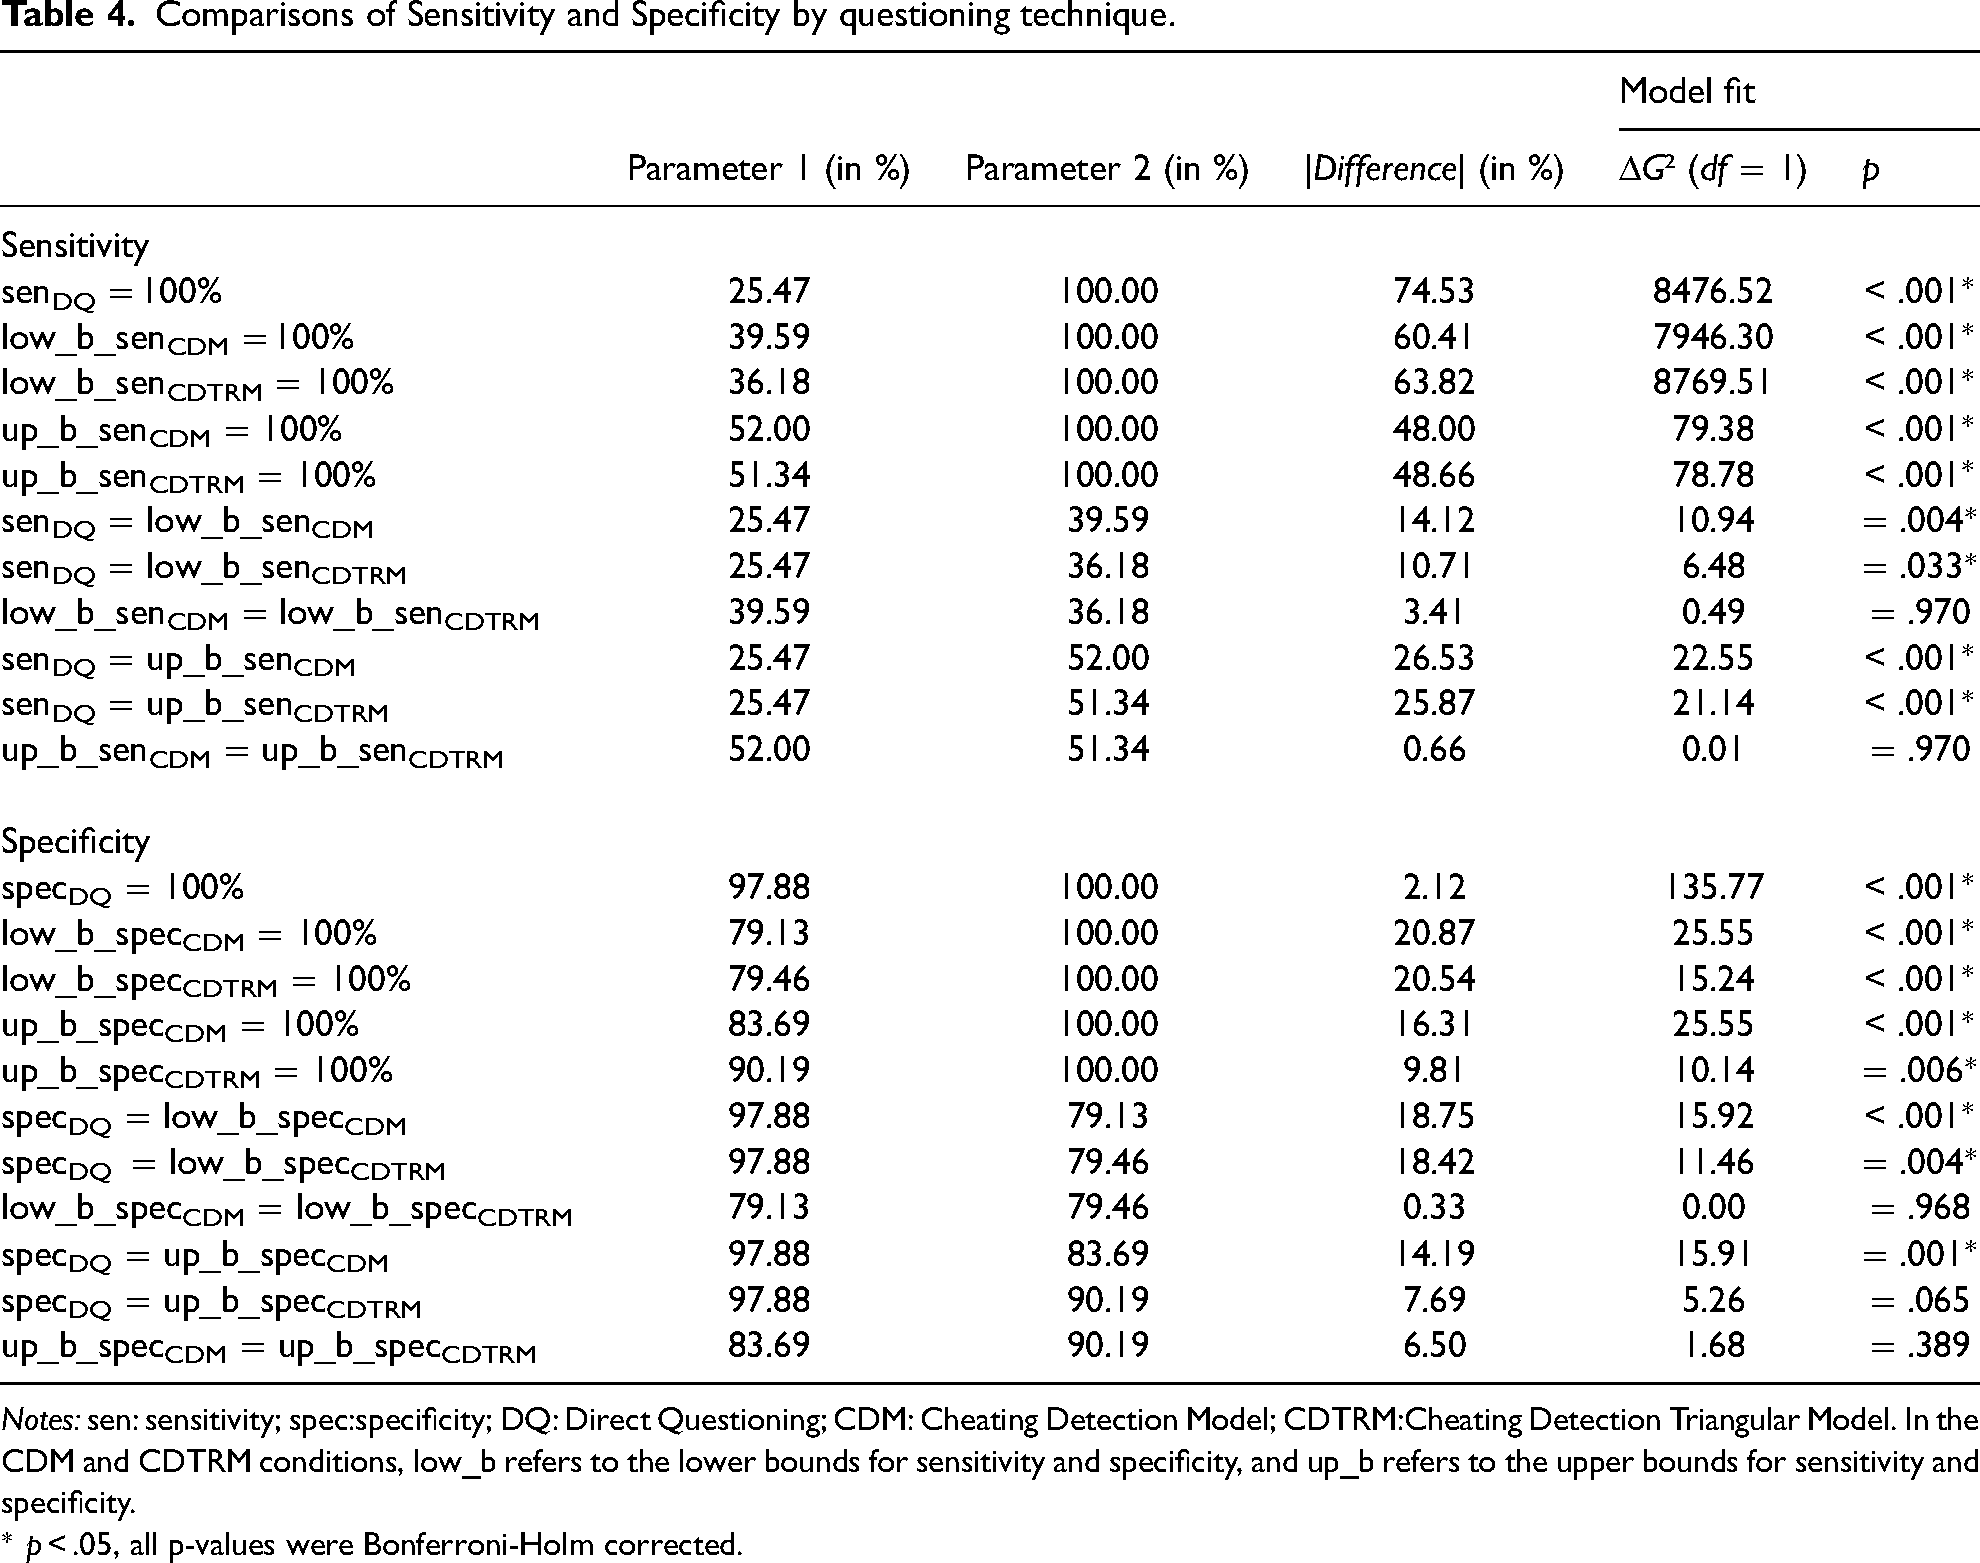
Notes: sen: sensitivity; spec:specificity; DQ: Direct Questioning; CDM: Cheating Detection Model; CDTRM:Cheating Detection Triangular Model. In the CDM and CDTRM conditions, low_b refers to the lower bounds for sensitivity and specificity, and up_b refers to the upper bounds for sensitivity and specificity.
* p < .05, all p-values were Bonferroni-Holm corrected.
Exploratory analysis for the extended TRM
Contrary to a central assumption of the model, TRM prevalence estimates differed as a function of randomization probability (π1 = 22.58%, SE = 2.38%; π2 = 0.00%, SE = 8.36%; ΔG²(1) = 45.79, p < .001). Prevalence estimates could therefore not be pooled across conditions and were considered untrustworthy (cf. Heck et al. 2018). This precluded a meaningful comparison of the validity of the TRM and the validity of the other models.
Prevalence estimates for the sensitive attribute
In the anagram task, 59.13% of the respondents over-reported on their performance. Over-reporting rates did not differ significantly across conditions (DQ: 57.71%, CDM: 59.73%, CDTRM: 59.25%, χ²(2) = 0.64, p = .726, Cramer’s V = 0.02). Prevalence estimates
Sensitivity
In the DQ and TRM conditions, model sensitivity was assessed by estimating the prevalence π among carriers. In the CDM and CDTRM conditions, the lower and upper bounds for sensitivity were determined by computing π and π + γ for carriers. The sensitivity was significantly <100% for all questioning techniques. In the DQ condition, sensitivity was estimated at 25.47%. In the CDM condition, sensitivity estimates ranged from 39.59% (lower bound) to 52.00% (upper bound); and in the CDTRM condition, they ranged from 36.18% (lower bound) to 51.34% (upper bound). Pairwise comparisons revealed that both the lower and upper bound estimates for sensitivity under the CDM and CDTRM conditions were significantly higher than the sensitivity of DQ. Neither the lower nor upper bound estimates differed significantly between the CDM and CDTRM conditions. Detailed inferential statistics for the parameter comparisons are given in Table 4.
Specificity
In the DQ and TRM conditions, model specificity was assessed by estimating 1 − π among non-carriers. In the CDM and CDTRM, the lower and upper bounds for specificity were determined by estimating β ( = 1 − π −γ) and β + γ ( = 1 − π) for non-carriers. The specificity was significantly <100% for all questioning techniques. In the DQ condition, specificity was estimated at 97.88%. In the CDM condition, specificity estimates ranged from 79.13% (lower bound) to 83.69% (upper bound). Under the CDTRM condition, the specificity ranged from 79.46% (lower bound) to 90.19% (upper bound). Pairwise comparisons revealed that the specificity of DQ was significantly higher than even the upper bounds of CDM and CDTRM. Neither the lower nor the upper bound estimates of specificity differed significantly between the CDM and CDTRM conditions. Detailed inferential statistics for the parameter comparisons are given in Table 4.
Proportion of carriers among non-adherent respondents
Both extended MPT models established to estimate the proportion of carriers among non-adherent respondents fit the data well, CDM: G²(1) = 2.50, p = .114; CDTRM: G²(1) = 0.85, p = .357. Consequently, the resulting parameter estimates were considered trustworthy (cf. Heck et al. 2018). The estimated proportion of carriers among non-adherent respondents (c_g) was 80.16% (SE = 11.94%) in the CDM and 67.25% (SE = 8.55%) in the CDTRM condition, respectively. This proportion was significantly different from 100% in the CDTRM condition, ΔG²(1) = 11.13, p < .001, but not in the CDM condition, ΔG²(1) = 2.20, p = .138. However, these results should be interpreted with caution, since a post-hoc power analysis indicated low power (1 − β = .22) for this test under the CDM condition.
Comprehensibility and Evaluation of the Questioning Techniques
Objective comprehensibility of the questioning techniques
To assess whether CDM and CDTRM differed with respect to their objective comprehensibility, we computed the proportion of respondents who correctly answered all comprehension questions in their first attempt (CDM: 13.42%, CDTRM: 26.99%), in their first or second attempt (CDM: 49.73%, CDTRM: 55.94%), or in any attempt (CDM: 76.16%, CDTRM: 76.14%). Three χ² tests employing a Bonferroni-corrected alpha level revealed that compared to respondents under the CDM condition, respondents under the CDTRM condition answered all comprehension questions correctly significantly more often in their first attempt, χ²(1) = 63.53, p < .001, Cramer’s V = 0.17, or in their first or second attempt, χ²(1) = 8.63, p = .003, Cramer’s V = 0.06. However, no difference between the CDM and CDTRM conditions was observed regarding the proportion of respondents who answered all comprehension questions correctly by the third attempt, χ²(1) < 0.001, p = .994, Cramer’s V < 0.001.
Self-reported response behavior and subjective evaluation of the questioning technique
Consistency analyses indicated that the nine items capturing respondents’ subjective evaluation of the questioning techniques were highly intercorrelated (Cronbach α = .84). Therefore, we computed the mean of all items and compared this mean across questioning techniques. Higher values indicated a more positive evaluation of the questioning technique. A one-way between-subjects analysis of variance (ANOVA) revealed a significant effect of the questioning technique (DQ, CDM, ([CD)TRM) on subjective evaluations, F(2, 2784) = 336.49, p < .001, η p = 0 .20.
Bonferroni-corrected post-hoc tests showed that DQ (M = 6.14, SE = 0.80) was evaluated significantly more positively than the (CD)TRM (M = 5.21, SE = 1.08), and that the (CD)TRM was evaluated significantly more positively than the CDM (M = 4.75, SE = 1.08). This pattern of results was observed for every item of the scale except for the item measuring adherence to the instructions (“I carefully read and followed all instructions”), for which Bonferroni-corrected post-hoc tests did not reveal a significant difference between the CDM and CDTRM conditions. Detailed statistics for these analyses can be obtained from Appendix C of the electronic supplement.
Additional Analyses of Respondents with High Understanding of the CDM and CDTRM
To further explore how high respondent vigilance and a deeper understanding of the questioning techniques influenced the results, we conducted additional analyses on the validity of the CDM and CDTRM in the subsample of respondents who answered all comprehension questions correctly on their first attempt. We expected that limiting the analysis to these respondents would increase the validity of the prevalence estimates. This subsample was quite small compared to the total sample (CDM: n = 149, CDTRM: n = 302), and was even smaller when performing separate analyses to assess sensitivity and specificity for carriers and non-carriers. This limited the power of some of the following analyses; however, their results nevertheless provide valuable insights into the functioning of the models and the validity of estimates obtained under optimized conditions. Please note that these analyses do not directly test whether deeper understanding is a moderating factor, which would require a direct test of the interaction.
Compared to the total sample (CDM: 29.70%, CDTRM: 25.07%), prevalence estimates were slightly lower in the subsample of respondents with a high level of understanding who solved all comprehension questions on their first attempt (CDM: 21.94%, CDTRM: 22.92%). However, the true prevalence rates were also slightly lower in this subsample (CDM: 53.02%, CDTRM: 50.66%) than in the total sample (CDM: 59.73%; CDTRM: 59.25%). The proportion of non-adherent respondents (γ) was also lower among respondents with a high level of understanding (CDM: 0.62%, CDTRM: 5.73%; total sample: CDM: 9.24%, CDTRM: 13.28%). The sensitivity of the CDM was slightly lower in the subsample of respondents with high understanding (lower bound: 34.29%, upper bound: 37.79%) than in the total sample (lower bound: 39.59%, upper bound: 52.00%). For the CDTRM, a lower bound of 39.17% and an upper bound of 47.28% for sensitivity were calculated in the subsample of respondents with high understanding. Thus, the lower bound was higher and the upper bound lower than in the total sample (lower bound: 36.18%, upper bound: 51.34%). This reduction in range was due to the reduced number of non-adherent respondents (i.e. the smaller γ) in the subsample with a high level of understanding.
The specificity of the CDM was slightly higher in the subsample of respondents with high understanding (lower bound: 86.74%, upper bound: 86.74%) than in the total sample (lower bound: 79.13%, upper bound: 83.69%). For the CDTRM, a lower bound of 91.28% and an upper bound of 94.42% for the specificity were calculated in the subsample of respondents with high understanding. Thus, in the CDTRM, both the lower and upper bounds were higher than in the total sample (lower bound: 79.46%, upper bound: 90.19%).
In summary, limiting the analysis to respondents with a high level of understanding reduced instruction non-adherence and increased the specificity of both CDM and CDTRM estimates. However, it also slightly reduced the sensitivity of CDM estimates. Only the sensitivity of the CDTRM was largely unaffected. Detailed statistics for these analyses are provided in Appendix D in the electronic supplement.
We also tested whether there were any demographic differences between respondents correctly answering all comprehension questions on their first attempt (n = 451) and respondents failing to do so (n = 1778). The two groups of respondents did not differ significantly with regard to gender, χ²(1) = 2.84, p = .092, Cramer’s V = 0.04. However, significant differences were observed with regard to age group, χ²(5) = 38.03, p < .001, Cramer’s V = 0.13, and educational achievement, χ²(8) = 68.80, p < .001, Cramer’s V = 0.18. Respondents answering all comprehension questions correctly in their first attempt were slightly younger and slightly higher educated than respondents who failed to correctly answer all comprehension questions in their first attempt. Detailed descriptive statistics can be obtained from Table 4 in Appendix D in the electronic supplement.
We also conducted a 2 (model comprehension: correctly answering all comprehension questions in the first attempt versus failing to correctly answer at least one comprehension question in the first attempt) × 2 (questioning technique: CDM versus CDTRM) between-subjects ANOVA with the scale mean for the nine items capturing the respondents’ subjective evaluation of the questioning techniques as the dependent variable. This analysis revealed a significant main effect of correctly answering the comprehension questions in the first attempt, F(1, 2225) = 330.04, p < .001, ηp = 0.13, and a significant main effect of questioning technique condition, F(1, 2225) = 48.87, p < .001, ηp = 0.02, but no interaction between these factors, F(1, 2225) = 3.57, p = .059, η p = 0.002. Respondents correctly answering all comprehension questions in their first attempt evaluated the questioning technique more favorably (M = 5.86, SD = 0.83) than respondents failing to correctly answer at least one of the comprehension questions in their first attempt (M = 4.76, SD = 1.05). Overall, the CDTRM (M = 5.21, SD = 1.08) was rated more favorably than the CDM (M = 4.75, SD = 1.08) on almost all scale items. However, this main effect was qualified by an interaction for the item “The question was cumbersome to answer.” Only among respondents who correctly answered all comprehension questions in their first attempt were CDM questions rated significantly more cumbersome to answer than CDTRM questions; among respondents failing to correctly answer at least one comprehension question in their first attempt, both questioning techniques were rated equally cumbersome to answer. For the two items “I carefully read and followed all instructions” and “I just randomly ticked one of the answers,” only a significant main effect of correctly answering all comprehension questions on the first attempt was observed, with more favorable evaluations provided by respondents who correctly answered all comprehension questions in their first attempt. For these two items, the main effect of questioning technique and the interaction between the two factors were not significant. Detailed statistics for these ANOVAs can be obtained from Table 5 in Appendix D of the electronic supplement.
DISCUSSION
The current study presents the first individual-level validation of three competing indirect questioning techniques: the Cheating Detection Model (CDM; Clark and Desharnais 1998), the Triangular Model (TRM; Yu et al. 2008), and the newly proposed Cheating Detection Triangular Model (CDTRM), which combines the CDM’s cheating detection mechanism and the TRM’s simplified, easy-to-understand instructions. Going beyond previous studies, we applied an extended version of the TRM consisting of two groups with different randomization probabilities. This enabled a comparison of prevalence estimates across groups and uncovered a violation of the main assumption inherent to the TRM that prevalence estimates are not dependent on randomization probability. A potential reason for this unexpected finding could be instruction non-adherence and the fact that self-protective answers differentially affect the two conditions differing with regard to randomization probability. In particular, the TRM (see Figure 1) cannot account for a proportion of “At least one statement is true” responses that is below the randomization probability p. For this reason, model assumptions are more likely to be violated and prevalence estimates are more distorted by self-protective answer behavior in the condition with a high randomization probability. This is also a likely reason for why in the present study, a high randomization probability (p2 = .842) resulted in an implausible boundary prevalence estimate of 0%. Unfortunately, however, the TRM does not allow for the detection of instruction non-adherence, making it difficult to pinpoint the exact reasons for its failure. An additional potential explanation for why TRM estimates are influenced by the randomization probability is that a lower p might decrease confidentiality, which in turn might increase the number of respondents choosing the self-protective response option. However, previous studies did not show a strong association of subjective confidentiality and randomization probability (Soeken and McReady 1982). Nevertheless, given the demonstrated violation of one of its central assumptions, it seems difficult to justify further use of the TRM in its original format. Moreover, our findings regarding the TRM emphasize the importance of taking instruction non-adherence into account (cf. Wu and Tang 2016), as the CDTRM we introduce in the present study is able to do.
The CDTRM uses the same set of instructions as the TRM, but employs the measurement model of the CDM. Therefore, unlike the TRM, the CDTRM can provide an estimate of the prevalence of instruction non-adherence. In the present study, the proportion of respondents who did not follow the CDTRM instructions but instead chose the self-protecting alternative was significantly > 0 (13%). This finding provides direct evidence for the occurrence of instruction non-adherence in the CDTRM, and indirect evidence that instruction non-adherence likely also impaired the validity of the original TRM.
Both the CDTRM and the CDM provided significantly higher estimates for the prevalence of the sensitive attribute than a conventional direct question. Thus, they both met a weak validation criterion (“more is better”), according to which higher prevalence estimates can be considered less biased by socially desirable responding and therefore more valid. However, the CDTRM, CDM, and DQ all significantly underestimated the known prevalence of the sensitive attribute and thus failed to meet the strong validation criterion represented by the ground truth we established in the present study. Moreover, all questioning techniques had an estimated sensitivity and specificity considerably lower than 100%. With respect to sensitivity, CDTRM and CDM outperformed DQ; however, with respect to specificity, DQ performed better than the CDTRM and the CDM. A similar pattern of results was recently observed for the Crosswise Model (Höglinger and Diekmann 2017; Höglinger and Jann 2018; Meisters et al. 2020a); it might therefore potentially be generalizable to other indirect questioning techniques as well. In this case, the decision for or against the application of indirect questioning techniques should be based on whether the aim is to maximize the validity of the overall estimate, the sensitivity, or specificity in a given context. In most cases, maximizing both the sensitivity and the overall validity of the estimate seems preferable, for example in situations in which underestimating the prevalence of a sensitive attribute can have serious negative consequences, as is true for most sensitive attributes. This is particularly the case when a study’s ultimate goal is to assess the need for educational or preventive measures, such as in surveys on medication non-adherence (Ostapczuk et al. 2011), tax evasion (Korndörfer, Krumpal, and Schmukle 2014; Kundt, Misch, and Nerré 2017), or xenophobia (Hoffmann et al. 2020; Ostapczuk et al. 2009b). In these cases, favoring indirect over direct questioning techniques seems advisable; this choice might however come at higher costs regarding dropout rates and completion times. Albeit less frequently, there might be situations in which maximizing specificity and thus reconsidering the application of indirect questioning techniques might be advisable if an overestimation of the prevalence of a sensitive attribute is associated with serious negative consequences such as reputational damage, as can be true for illegal or morally reprehensible behavior, where in dubio pro reo might be the more appropriate choice. Moreover, in cases in which an attribute under investigation does not seem sensitive in a given sample or situation, the use of indirect questioning techniques may not outweigh the costs (cf. Lensvelt-Mulders et al. 2005).
A comparison of the CDTRM and the CDM revealed that both models obtained comparable estimates for the prevalence of honest carriers (π), honest non-carriers (β), and non-adherent respondents (γ), as well as for sensitivity and specificity. However, the objective comprehensibility of the (CD)TRM exceeded the comprehensibility of the CDM, as evidenced by the fact that in the (CD)TRM condition, significantly more respondents correctly answered all comprehension questions in their first attempt. This finding corresponds to the basic objective of non-randomized response techniques such as the TRM to facilitate a higher level of understanding among respondents than randomized response techniques such as the CDM (cf. Yu et al. 2008). In accordance with this finding, a previous study assessing the proportion of correct responses for several indirect questioning techniques (Hoffmann et al. 2017) also reported problems in understanding the relatively complex instructions of the CDM.
While CDTRM and CDM prevalence estimates were comparable, considerable differences between the two models were observed with respect to the respondents’ self-reported evaluations. Overall, respondents evaluated the (CD)TRM more favorably than the CDM, and fewer respondents reported having answered randomly in the (CD)TRM compared to the CDM condition. Respondents indicated the same degree of carefulness in reading and following the instructions for both models. However, respondents in the CDM condition reported a more negative attitude toward indirect questioning techniques than respondents under the (CD)TRM condition; they might therefore be less likely to participate in future surveys incorporating these techniques. Taking both the respondents’ objective performance and their subjective evaluations of the questioning techniques into account, we recommend employing the CDTRM over the CDM.
The status of non-adherent respondents with respect to the sensitive attribute in the CDM (and thus also in the CDTRM) usually remains unknown. Thus, the CDM and the CDTRM do not assume that non-adherent responses are limited to carriers. Rather, they are assumed to also occur among non-carriers, which our analysis seems to confirm. Other indirect questioning techniques, such as the Stochastic Lie Detector (Moshagen et al. 2012), make stronger assumptions and presume that only carriers have a motivation to disregard the instructions and to choose self-protective responses, although in the Stochastic Lie Detector both carriers and non-carriers are asked to provide potentially incriminating responses. It has been difficult to test the validity of such assumptions. Employing a strong validation approach based on individual-level data, the present study was the first to empirically determine the proportion of carriers among non-adherent respondents. We found that this proportion was 80.16% and 67.25% in the CDM and CDTRM conditions, respectively. Our results suggest that in the current study, the group of non-adherent respondents did not consist solely of carriers or non-carriers, but rather of a mixture of these two groups. It has, however, yet to be shown whether this finding can be generalized to different attributes or samples.
We also found that limiting the analysis to respondents with high comprehension who correctly answered all comprehension questions in their first attempt slightly reduced instruction non-adherence and increased the specificity of the CDTRM and CDM. However, analyzing only respondents with high levels of comprehension also slightly reduced the sensitivity of the CDM. For the CDTRM, the same analysis led to an increase in the lower bound estimate for sensitivity and a decrease in the upper bound estimate. This pattern of results indicates that for respondents with a precise understanding of indirect questioning techniques, the proportion of false positives decreases, while the proportion of false negatives slightly increases. Similar patterns have been observed for another non-randomized response technique, the Crosswise Model (Meisters et al. 2020a), suggesting that such models are affected by a general tradeoff between false positives and false negatives, or sensitivity and specificity (Höglinger and Jann 2018; Meisters et al. 2020a). Future studies should therefore address the question of whether the instructions for indirect questioning techniques can be further optimized to increase both sensitivity and specificity.
In the current study, all of the investigated models underestimated the true prevalence of the sensitive attribute and provided false positives and false negatives. One potential reason for these somehow unsatisfactory results might be found in the asymmetry of the models under investigation. Since asymmetric models offer a self-protective alternative, the most plausible form of non-adherence is a self-protective answer strategy. If non-adherence cannot be detected, such as in the TRM, a self-protective answer strategy results in an underestimate of the prevalence of socially undesirable attributes. If in contrast, self-protective answering can be detected, as for example in the CDM and CDTRM, the validity of the estimates should arguably be higher (Clark and Desharnais 1998). Since both the CDM and the CDTRM still provided prevalence estimates below the known truth; however, cheating detection in these models seems still not to be perfect and in need of further improvement. Another response style that might potentially occur in asymmetric models could be random responding, which might occur when respondents are generally inattentive. If all respondents answered randomly in the TRM, prevalence estimates for π would be a function of the randomization probability p, and would approximate 0% for p ≥ .50 and 50% for a theoretical p of .00. In the CDM and CDTRM, random responding would distort estimates in the direction of 50% for π and γ and in the direction of 0% for β. Since in the current study, we found estimates for β of > 60%, random responding does not seem to have played a major role.
In general, symmetric models in which there is no self-protective answer option, such as the extended CWM (ECWM), offer important advantages over asymmetric models, and there is evidence suggesting that symmetric models might be superior to asymmetric models (Hoffmann et al. 2020; Ostapczuk, Moshagen et al. 2009a). Moreover, the validity of symmetric models such as the CWM has been evaluated favorably in previous strong validation studies (e.g. Hoffmann et al. 2015). However, symmetric models are also associated with some disadvantages. Recent studies showed that the CWM can produce substantial rates of false positives (Höglinger and Diekmann 2017; Höglinger and Jann 2018; Meisters et al. 2020a), which were comparable to those found in the present study. Since symmetric models do not provide a self-protective response alternative, a very plausible type of non-adherence in these models is unsystematic, random responding. In the CWM, however, random responding systematically biases prevalence estimates in the direction of 50% and therefore potentially threatens the validity of prevalence estimates (Heck et al. 2018; Schnapp 2019; Walzenbach and Hinz 2019). Another potential bias in symmetric models is a systematic preference for one of the two answer options. The effects of this type of bias in the CWM would strongly depend on the degree to which non-carriers and carriers are affected equally (for a more detailed description of the effects see Heck et al. 2018). Although in the ECWM, a model misfit can indicate such a systematic bias, the ECWM does not allow estimating the extent to which instruction non-adherence occurs, nor can it provide a correction of the prevalence estimate for instruction non-adherence or suggest potential reasons for non-adherence (Heck et al. 2018). In contrast, asymmetric models with a cheating-detection extension offer the advantage that at least for a part of the respondents it can be determined that a self-protecting answer strategy is responsible for non-adherence. Moreover, these models allow estimating the proportion of non-adherent respondents, which cannot be achieved by the (E)CWM. Of course, a questioning technique completely avoiding instruction non-adherence qua design would be preferable; since none of the existing questioning techniques however seem to be able to avoid all possible forms of instruction non-adherence, in some situations it might be useful to at least estimate its extent. This opportunity is provided by models such as the CDM, the CDTRM, a cheating-detection extension of the Unrelated Question Model (Reiber, Pope, and Ulrich 2020), and the Stochastic Lie Detector (Moshagen et al. 2012).
Given the distinct advantages and disadvantages of both model classes, it seems desirable to combine symmetric models with the possibility to detect non-adherence. There is an extension of the CDM in a symmetric variant, which has been evaluated more positively than the original asymmetric variant that was applied in the current study (Ostapczuk, Moshagen et al. 2009a). It is however not possible to combine the symmetric variant of the CDM with the easy-to-understand instructions of the TRM, since a part of the instructions of the symmetric CDM cannot be applied to the TRM. Unfortunately, it is also not possible to transfer the cheating detection extension to easy-to-understand symmetric models such as the (E)CWM because of the symmetry of the answer options in these models.
The advantage of the CDTRM to detect and estimate the prevalence of non-adherence comes at the cost of a lower efficiency compared with other RRT models, as including an additional cheating parameter in the model (γ) leads to a higher standard error in the estimation of the proportion of carriers of the sensitive attribute (π). Since both the CDM and the CDTRM are based on the same measurement model, their efficiency is identical. However, the CDTRM is generally less efficient than models that do not include a cheating parameter such as the TRM, the (E)CWM, or the Unrelated Question Model (Greenberg et al. 1969). Furthermore, the efficiency of the CDTRM and the CDM is affected by the choice of randomization probabilities p1 and p2. More extreme randomization probabilities chosen symmetrically around .50 (that is, p1 approximating 0 and p2 approximating 1) result in higher power to detect a significant difference between the indirect and the direct questioning conditions. However, while very small values of p optimize efficiency, they also reduce confidentiality and are therefore usually avoided. Randomization probabilities in the current study were chosen to ensure an appropriate balance between statistical efficiency and confidentiality. As a consequence of the randomization procedure, the efficiency of all RRTs is always worse than the efficiency of a direct question because of the random variance that has to be added by the randomization procedure to preserve confidentiality. The use of the CDTRM is particularly interesting when not only the prevalence estimate, but also the proportion of non-adherent respondents is of interest, for example, to indirectly deduce the level of sensitivity of an attribute. A higher proportion of non-adherent respondents suggests that an attribute is more sensitive (Moshagen and Musch 2012; Ostapczuk et al. 2009a; Ostapczuk et al. 2011). In future studies, it would also be interesting to correlate CDTRM estimates with continuous covariates such as personality traits, for example, the Honesty–Humility factor of the HEXACO Personality Inventory (Ashton and Lee 2009; Lee and Ashton 2004; 2006; 2018). Such associations could be tested, for example, by using the R package RRreg (Heck and Moshagen 2018). Data analyses for the CDTRM with RRreg can be based on the model “CDM” that is already part of RRreg since the CDM and the CDTRM are based on the same measurement model. Only the answer options are named differently – the answer option “yes” of the CDM in RRreg (or “true” in our study) corresponds to the answer option “at least one of the statements is true” in the CDTRM and the answer option “no” of the CDM in RRreg (or “false” in our study) corresponds to the answer option “none of the statements is true” in the CDTRM.
Limitations
In the current study, we observed significantly higher dropout rates in the indirect as compared with the direct questioning technique condition. However, the distribution of age, gender, and education did not differ between the questioning technique conditions in the final dataset. Since there was therefore no confounding with demographic variables, the validity of the results was probably unaffected.
The anagram task used in the current study could potentially be solved. However, in a previous study, < 1% of participants were able to do this (Hoffmann et al. 2015). Therefore, the risk of falsely classifying a respondent as an over-reporter was very low and rather negligible. Even if 1% of the respondents claiming to have solved all three anagrams had actually solved it, false positive and false negative rates would have changed only very slightly. Moreover, the fact that solving all three anagrams was theoretically possible can be considered an important advantage of the present design because it was therefore not necessary to deceive the respondents. For this reason, the anagram task seems ethically more justifiable than a task in which respondents have to be deceived. The possibility that some respondents may have deceived themselves when reporting the number of anagrams they had solved cannot be ruled out completely. However, to minimize the risk of self-deception and to ensure that participants were actually aware of whether they had solved all anagrams, we presented the solutions to all anagrams directly before asking the respondents whether they had solved them. We refrained from instructing participants not to use online tools to solve the anagrams because we did not want to point them to this little-known possibility. However, given that both the two example anagrams as well as the first two of the “real” anagrams were very easy to solve, it was highly unlikely that they felt any need to use online tools for these anagrams. Moreover, the time limit for the anagrams was chosen so as to make it almost impossible to use online tools within the small time frame that was available to solve each anagram. Anagram tasks like the one we used in the present study have already successfully been applied in other studies of cheating (e.g. Chou 2015; DePalma, Madey, and Bornschein 1995; Hoffmann et al. 2015; Meisters et al. 2020a).
In the current study, we only investigated online applications of the RRTs. It is not clear whether the current results generalize to offline applications such as personal interviews or computer-assisted telephone interviews. However, online surveys of RRTs have become more frequent during the past years, both in research and in practice (e.g. Erdmann 2019; Hilbig et al. 2015; Höglinger, Jann, and Diekmann 2016; Höglinger and Diekmann 2017; Höglinger and Jann 2018; Meisters et al. 2020a; Moshagen and Musch 2012; Musch et al. 2001; Ostapczuk and Musch 2011; Thielmann et al. 2016 and many more) and will probably become even more important in the future given their favorability in terms of time and costs compared to offline RRTs. Therefore, testing the validity of online RRT applications such as in the present study seems an important endeavor.
Another limitation of the current research is that the CDM, and therefore also the CDTRM, assume that p and π (or β or γ) are independent, which cannot be tested in a saturated model. It is however important to note that this assumption is also made in many other RRT variants, as most RRT models are saturated in their original format. Our data suggest that the different prevalence estimates in the two TRM groups with different randomization probabilities are likely due to self-protective answering. Therefore, the CDM and CDTRM may be considered superior to the TRM because they allow detecting such self-protective answering and estimating its extent. To allow a test of central model assumptions such as independence of p and π, we recommend using appropriately extended RRT models with at least one degree of freedom in future studies. For the CDM and CDTRM this could be achieved by employing a four-group design such as the one proposed by Reiber et al. (2020).
Finally, it might be argued that the comparison of prevalence estimates in the present study was potentially biased in favor of the CDM and the CDTRM since these methods provide an interval instead of point estimates. Providing an interval might however be advantageous to indicate uncertainty with respect to a prevalence estimate, as opposed to presenting a point estimate which only appears to be more precise, but may actually be severely biased.
Conclusions
The present results suggest that the newly proposed CDTRM, which combines the simplified instructions of the TRM with the cheating detection capability of the CDM, should be preferred over its two predecessor models. Unexpectedly and problematically, TRM prevalence estimates were also found to be influenced by the randomization probability, probably due to instruction non-adherence by some respondents, which unfortunately cannot be detected by this model. Compared to the CDM, the CDTRM obtained prevalence estimates of similar validity, but received substantially more positive evaluations with respect to the respondents’ subjective experience of the questioning technique. The CDTRM therefore appears to be a promising new indirect questioning technique that may help to reduce the influence of socially desirable responding with easy-to-understand instructions, a mechanism to detect instruction non-adherence, and a high level of acceptance by respondents. However, we also note that all prevalence estimates obtained via CDTRM, CDM or conventional direct questions still underestimated the known prevalence of the sensitive attribute. Both the sensitivity and specificity of the models were far from perfect, with indirect questioning techniques achieving higher sensitivity but lower specificity compared to direct questions. We therefore recommend choosing indirect over direct questioning techniques in situations in which maximizing the overall validity or sensitivity is of paramount importance; if, however, maximizing specificity is more important, choosing direct over indirect questioning might be advisable.
Footnotes
Author’s Note
The raw data for the sensitive questions and the subjective evaluation of the questioning techniques, the SPSS code for the main analyses, the multiTree equations for the models, and the empirically observed answer frequencies are available on OSF (![]() ). The multiTree equations for the models and the empirically observed answer frequencies are also provided in Appendix A in the electronic supplement.
). The multiTree equations for the models and the empirically observed answer frequencies are also provided in Appendix A in the electronic supplement.
Funding
The authors disclosed receipt of the following financial support for the research, authorship, and/or publication of this article:
This research was funded by the Deutsche Forschungsgemeinschaft (DFG, German Research Foundation), Grant numbers 393108549 and 439602023.