
Abstract
Virtually, all large-scale family surveys in the United States and Europe have yielded a positive view of family ties in contemporary societies. The present study examines whether surveys like these are affected by selective nonresponse. Are people with negative family ties less likely to participate in surveys, and if so, to what extent does this yield a biased descriptive view of family solidarity? Using a novel multiactor design with matched register data, we examine the determinants of nonresponse of the parents of adult children aged 25–45 in the Netherlands. Our analysis reveals significant effects of the strength of parent–child ties on parental nonresponse, especially for fathers. Moreover, we find negative effects of divorce on father’s participation and this effect is stronger when family ties are weak. While these findings support the hypothesis of selective nonresponse, the magnitude of the effects is small and descriptive findings on family ties change only modestly when correcting for selective nonresponse.
Many large-scale surveys in the United States and Europe have been developed for describing, comparing, and explaining family cohesion and solidarity in contemporary societies (Foner and Dreby 2011; Seltzer and Bianchi 2013; Silverstein and Bengtson 1997; Swartz 2009). Analyses have focused in particular on the quality of ties between adult children and their aging parents and on the degree to which the generations support each other in social, practical, and financial ways in times of need, especially during old age (Albertini and Kohli 2013; Dykstra et al. 2006; Lowenstein and Ogg 2003; Motel-Klingebiel, Tesch-Roemer, and Von Kondratowitz 2005; Nauck and Arranz Becker 2013; Silverstein and Bengtson 1997; Szydlik 2016). Studies generally show that ties between the generations are positive, that contact is frequent, and support is common when it is needed. Some authors have criticized these findings by arguing that conflict and tension in families have been overlooked (Luescher and Pillemer 1998). Recent studies suggest that there indeed can be ambivalence in parent–child relations, with parents and children experiencing both positive and negative feelings about each other (Connidis 2015), but the prevalence of family conflict remains surprisingly low (Bengtson et al. 2002; Steinbach 2008; Van Gaalen and Dykstra 2006). Under specific conditions, there is more conflict and detachment in families, such as when parents divorced when the children were young (Kalmijn 2013), or among specific immigrant groups (Treas and Mazumdar 2002; Zhou 2007), but in general, the view of adult intergenerational relationships as positive and unproblematic remains seemingly in contrast to what novels, movies, and human interest stories would lead us to believe.
The surveys on which these conclusions are based, like other surveys in the social sciences, suffer from nonresponse. For example, in the Survey of Health, Ageing and Retirement (aged 50+), the household response rates varied between 40 percent and 60 percent, depending on the country (Börsch-Supan et al. 2005). The earlier multination OASIS study of aging, which covered all ages but was limited to urban settings, had a refusal rate of 37 percent and an additional noncontact rate of 14 percent (Lowenstein and Ogg 2003). In the American context, where response rates have traditionally been higher, the National Survey of Families and Households reports a response rate of 64 percent when counting respondents who could not be screened as nonresponse (Sweet, Bumpass, and Call 1988). In the Netherlands Kinship Panel Study, another widely used survey in intergenerational research, the response rate was 45 percent after nonresponse follow-up (Dykstra et al. 2005). The more recent German PAIRFAM survey, finally, had a response rate of 37 percent although this was higher in the youngest cohort than in the oldest cohort (Huinink et al. 2011).
High levels of nonresponse are not per se problematic since part of the nonresponse is due to practical and idiosyncratic reasons (Groves and Couper 1998) and therefore more or less random (Tourangeau 2017). The more important question is to what extent and in what ways nonresponse is selective. Response can be selective with respect to demographic variables such as gender, age, and urbanization, but this is often solved by using weights based on population distributions (Tourangeau 2017). A potentially serious issue arises when nonresponse is selective with respect to the topic of the survey. For example, surveys about political opinions are believed to overestimate the degree of political interest of the population since those least interested in politics may be less likely to participate (Brehm 1993; Stroud and Kenski 2007). Similarly, time use surveys are sometimes believed to underrepresent people who are very busy because respondents with little time would be more likely to refuse (Abraham, Maitland, and Bianchi 2006; Van Ingen, Stoop, and Breedveld 2009).
The same concern arises for the nature and strength of family ties. For example, if people with stressed family ties or parents who never see their adult children are less likely to participate in a family survey, this would lead to an overly rosy picture of family cohesion. Not all family surveys will have introduced their interview to the respondent in “family” terms, so that the participation of a respondent may not directly depend on his or her family ties. Nonetheless, survey bureaus cannot be completely silent on the topic when recruiting respondents for a lengthy interview about family issues. Moreover, social isolation reduces participation in surveys (Abraham et al. 2006; Amaya and Presser 2017; Groves and Couper 1998; Watanabe, Olson, and Falci 2017), and it is plausible that social isolation is inversely correlated with family cohesion. Survey response also depends on personality traits which in turn can be related to social cohesion and the strength of family ties (Porter and Whitcomb 2005). These considerations would suggest that people who have weak or negative family ties are less likely to participate in family surveys, which then could lead to a biased descriptive view of family cohesion in society at large.
It is not straightforward to examine whether and to what extent nonresponse in surveys is selective with respect to family cohesion. The most common ways to examine nonresponse have been register analyses, panel analyses, and what can be called “doorstep” methods (Groves and Peytcheva 2008; Lynn 2008). Registers provide basic demographic traits such as income, household composition, and marital status that can be used in analyzing selective nonresponse. Analyses show that nonresponse is higher among single and especially divorced respondents (Korkeila et al. 2001; Tolonen et al. 2006). These findings are consistent with the hypothesis of selective nonresponse, but the evidence is indirect since no information is available on the quality of the ties in married and divorced families.
Panel surveys provide more extensive opportunities to study nonresponse since all measures in a given wave can be used to predict response in a following wave. One disadvantage of this method is that the pattern of nonresponse is conditional on the initial response of a respondent. Also, few panel attrition studies have so far looked at family ties as a predictor of nonresponse. Indirect evidence comes from a study that looked at effects of the quality of couple relationships on attrition in the PAIRFAM survey (Muller and Castiglioni 2015). Mueller and Castiglioni found weak effects on attrition, in contrast to the hypothesis of selective nonresponse.
A third type of nonresponse studies uses information obtained from an initial contact with the respondent. For example, an interviewer can ask a brief question on the central topic of the survey or interviewers can obtain useful information when a respondent explains his or her refusal to participate (Durrant and D’Arrigo 2014; Matsuo et al. 2010; Vercruyssen, Roose, and Van de Putte 2011). This method can work for topics like employment, voting, or even time use but is difficult to apply to more complex topics like family cohesion.
In this article, we use an alternative, multiactor approach to study selective nonresponse. Multiactor data are data where information is gathered among related and independently living respondents such as respondents and their adult children, parents, siblings, or former partners (Dykstra et al. 2005; Poortman 2018). This setup can be used to examine selective nonresponse. For example, if a child reports about the tie he or she has with a parent, this information can be used to predict the response of that parent. Such a design has been used in the past and indeed suggests that there is considerable selectivity with respect to intergenerational closeness and contact (Bastaits et al. 2015; Kalmijn and Liefbroer 2011; Schröder et al. 2012). A disadvantage of this method is that in multiactor data, family members (secondary respondents) are typically recruited via the initial respondent (primary respondents). Family members are contacted, but only if the primary respondent gave permission to do so and subsequently provided valid contact information about the family member.
The indirect approach has two known problems. First, the probability of obtaining permission to contact a family member may already be selective. For example, an adult son who has a problematic relationship with his parents may not want the researcher to obtain information about him from his parents’ point of view and hence not grant permission to contact the parent. Second, the nonresponse of a secondary respondent, given that permission was granted, may reflect the wish of that person not participate together with the primary respondent. Both issues are clearly related to the quality of family ties. The multiactor method obviously is valid for assessing secondary nonresponse, but if the goal is to use the method as an indirect way to assess initial nonresponse, the degree of selectivity is likely to be overestimated.
The data we use in this article allow us to circumvent these problems to some extent. We have multiactor data where parents and adult children (living in different households) were approached independently of each other. Specifically, population registers were used to find the parents of the (adult) children, and these were invited to participate regardless of the child’s participation and without first asking permission to the child. We use information from the participating children on their relationship to the parent to predict the likelihood that the parent participates. Register information is used for obtaining information on the traits of responding and nonresponding parents. Given the elaborate measurement of family ties in our survey, we can look at four aspects of the parent–child relationship: contact frequency, closeness, support exchange, and conflict. These measures were based on earlier work on intergenerational solidarity and conflict (Bengtson et al. 2002). Our method is a step forward because family members were approached independently, but the multiactor method also has limitations. If there are families in which all members have a tendency not to participate, this may still bias our estimates. We explore this issue to some extent but cannot rule out selection bias completely.
Selectivity with respect to the topic of the survey—the “topical hypothesis” of nonresponse—may also have implications for the link between marital status and nonresponse. Past research has demonstrated that divorced persons are less likely to participate in surveys (Korkeila et al. 2001; Tolonen et al. 2006). One explanation for this is that single respondents are less likely to be contacted since the chance that someone is home is lower (Groves and Couper 1998). This explanation applies mostly to participation in face-to-face surveys and is not per se linked to divorce but more to household composition. Another explanation lies in the social isolation hypothesis of nonresponse. Studies show that single divorced persons on average experience more feelings of loneliness than married persons (Dykstra and Fokkema 2007), and social isolation in turn is linked to nonresponse. A third explanation lies in the topic of the survey: Divorced persons may prefer not to talk about family issues since they may have had negative experiences with their family or because there is social disapproval of divorce in their social context.
The second goal of this article is to examine the role of divorce for understanding patterns of nonresponse. Our data contain a systematic and register-based oversample of children who grew up in divorced families. Moreover, if a child experienced a divorce when he or she was young, both divorced parents were approached for the survey. Due to this oversample, we have sufficient statistical power to examine whether there is selectivity within the population of divorced individuals. In other words, we can examine whether the effect of family ties on nonresponse is different for divorced parents. We combine this with analyzing the role of gender which is important given the finding that many divorced fathers lose contact with their children (Kalmijn 2015). Research has suggested that uninvolved fathers are less likely to participate, but we do not yet know how this is for the more select group of divorced fathers (Bastaits et al. 2015). To examine these issues, we test the interaction effect of divorce, gender, and intergenerational relationship quality on parental nonresponse.
Data and Method
Data
Data were obtained from the recently collected survey Parents and Children in the Netherlands (OKiN; Kalmijn et al. 2017, 2018). The OKiN was based on a stratified random sample of the population aged 25–45. Using the Dutch population register, three groups were sampled: children who were living with both biological parents at age 15, children who were living with only one biological parent without a partner at age 15, and children who were living with one biological parent and his/her (new) partner at that age. The fieldwork was done by Statistics Netherlands (CBS) and had a mixed-mode design: an initial web-based interview (via a postal mail invitation letter) followed by a face-to-face interview at home for the nonresponse. The response rate was 62 percent (N = 6,485), which compares very well to previous Dutch surveys (Stoop 2005). Of the final response, 62 percent was via computer assisted web interview (CAWI) and 38 percent via computer assisted personal interview (CAPI).
Using the registers, we identified the biological parents and their current new partners (if applicable) of all the adult children in the original sample. Parents and stepparents who were alive and living in the Netherlands were approached with a postal mail letter that invited them to participate in a web-based questionnaire (CAWI). The respondents were presented with a conditional incentive (via a lottery) and received two reminders via postal mail. In the second reminder, a paper version of the questionnaire was included for a paper and pencil interview (PAPI). Using first CAWI and then PAPI has proven to be a cost-effective mixed-mode approach (Messer and Dillman 2011; Millar and Dillman 2011). A third of the respondents used the PAPI mode.
All parents were approached individually and directly, which means that we did not first ask the child for permission to contact the parents. Respondents were not explicitly informed about each other’s participation, but there was a footnote in the invitation letter stating that there was a possibility that parents or children would also participate. The response of the parents (including stepparents) was 38 percent (N = 9,325). The lower response for the parents versus the adult children is probably due to the lack of a conditional incentive for participation and the lack of a face-to-face follow-up (no CAPI). As is known, web-based and postal surveys tend to have lower response rates than face-to-face studies (Manfreda et al. 2008). The parent sample was quite large and budget constraints prevented us from implementing a CAPI round. Registers were linked to the data to obtain basic socioeconomic and demographic traits of the parents (and children).
The analytical sample was organized as dyads (father–child dyads and mother–child dyads). Only biological parents were included. The base sample consists of 6,150 (adult child) respondents, which means that there were 12,300 fathers and mothers. Of these, we excluded dyads where the parent was no longer alive and where the child never knew the parent (N = 10,548). Of these, some fathers (and a few mothers) were not found in or used from the registers (6.1 percent), mainly because of international migration, leaving us with 9,906 parents to analyze. Parents living abroad were not approached. The average age of the fathers was 62.9 and the age of the mothers was 60.6. We applied multiple imputation to impute missing values via mi and mi estimate in Stata, using 50 imputations and chained regression estimation (Royston 2005). We imputed four independent variables: health (5.5 percent), socioeconomic status (SES; 1.6 percent), income (0.4 percent), and working hours (3.9 percent). All analyses are presented separately for mothers and fathers.
Measures
To analyze nonresponse, we created a variable indicating whether the parent responded. No further distinction can be made between refusals or unreached respondents. We do present an additional analysis in which we contrasted early participants and late participants. We used two sets of independent variables in the model: individual traits of parents and relationship traits.
We included the following variables as controls from the registers for each individual parent: (a) personal income, (b) hours worked, (c) social security income receipt (yes/no), (d) migrant status, (e) home ownership, (f) age and age squared, and (g) urbanization. Details are provided in the Online Appendix. We added information on the parent as provided by the child to enrich the analysis: (a) general health (Idler and Benyamini 1997), (b) an index of health/cognitive age-related limitations in daily living (i.e., the Instrumental Activity of Daily Living (IADL) scale) (Börsch-Supan et al. 2005), (c) SES, based on the average of the standardized scores of occupational status and educational level (Ganzeboom 2005), and (d) an index of outdoor cultural participation (De Graaf, De Graaf, and Kraaykamp, 2000). All these variables are relevant since they may confound the effects of family ties on the response likelihood. Especially important is the inclusion of education and occupational status, which was not currently available in our set of register data but which is known to affect nonresponse. Cultural participation is useful as a proxy for societal participation. Table 1 presents the means and standard deviations of all variables.
Descriptive Statistics of Analytical Sample (Unweighted).
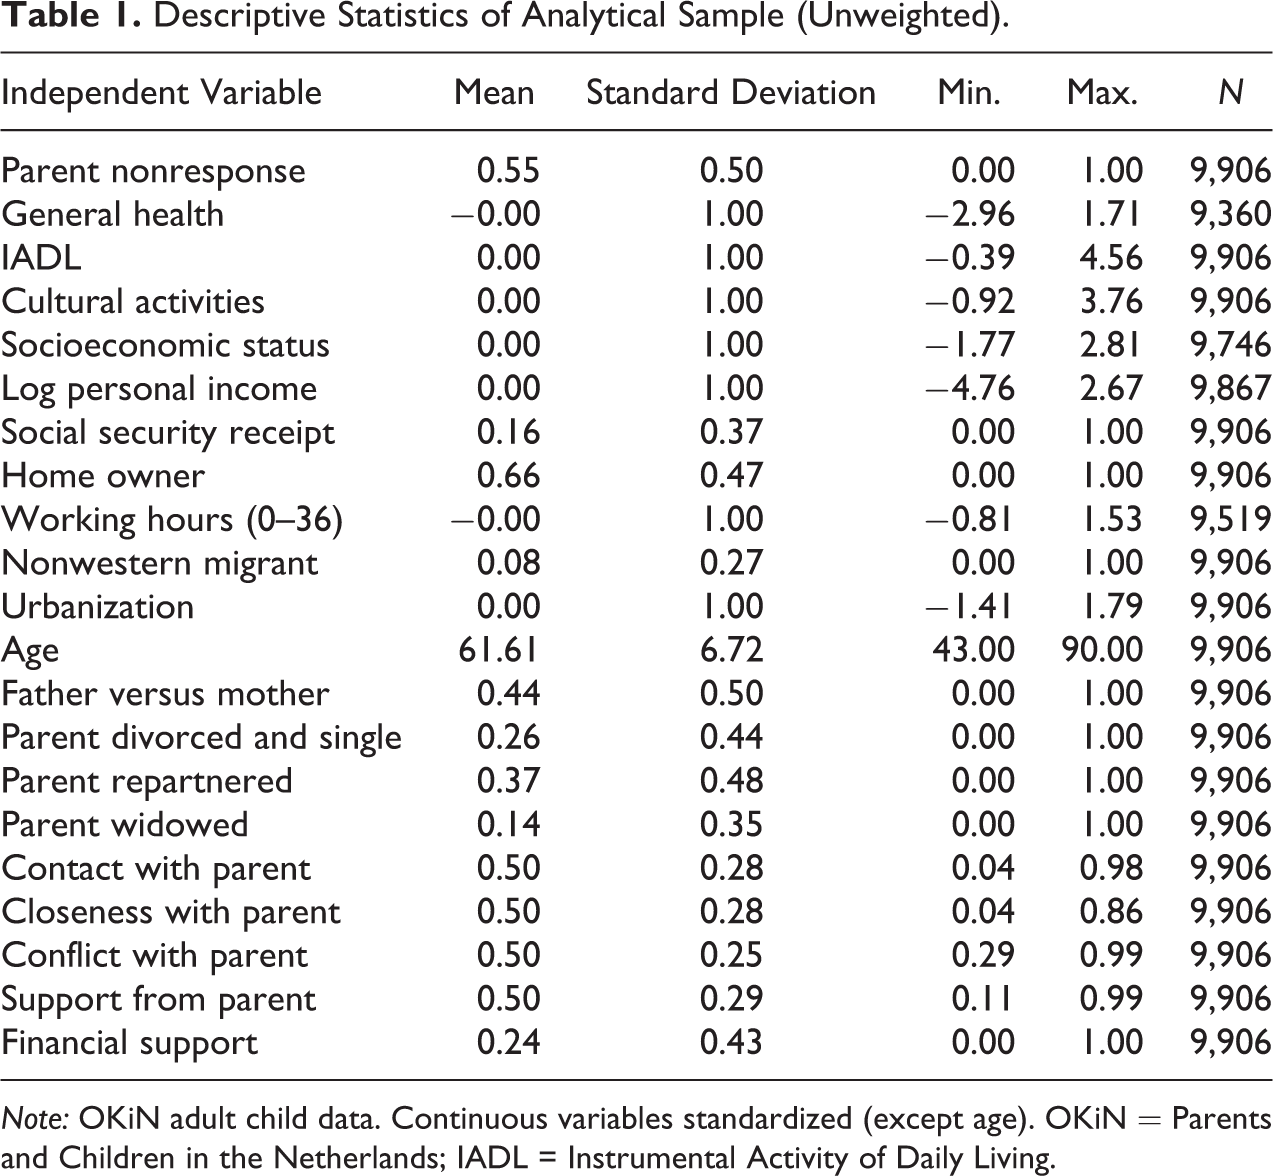
Note: OKiN adult child data. Continuous variables standardized (except age). OKiN = Parents and Children in the Netherlands; IADL = Instrumental Activity of Daily Living.
The following relationship traits, as reported and perceived by the child, were included: (a) the amount of face-to-face contact with the parent in the last 12 months (on a six-category frequency scale); (b) the degree of closeness in the relationship (five-point scale); (c) the amount of conflict and/or tension in the relationship (on a four-point scale); (d) a sum of the following types of support received from the parent in the last 12 months: support with practical matters, support with household chores, and receiving good advice (appraisal support); and (e) financial support in the form of monetary or material gifts from the parent (above 100 euro and not for birthdays). The answering categories of the first four traits are ordered and were converted into percentile scores. We experimented with other codings, but these yielded similar results. The advantage of the percentile or rank score was that the regression coefficient can be interpreted as the maximum possible effect (rank scores range from 0 to 1).
In select models, we also used an index of intergenerational (IG) quality that combined the three “positive” relationship traits, that is, contact, closeness, and support (Cronbach’s α = .75 for mothers and α = .82 for fathers). Conflict was left out of this index as it constitutes a different dimension (Gilligan et al. 2015).
We considered the marital status of the (biological) parents using information from the children (for the parent’s marital history) and the registers (for their current partner status). We made a distinction between (a) biological parents who were still married or cohabiting (the reference), (b) parents who divorced/separated and were single (regardless of when this occurred), (c) parents who divorced/separated and repartnered, and (d) parents who were widowed. 1 In prior nonresponse research, divorced respondents who repartnered have been included in the “married/cohabiting” category. In our view, these should be analyzed separately since repartnered respondents may also have a history of family issues.
Design
We start with a linear probability model (LPM) for fathers and mothers, which contained parental characteristics only (Table 2). We opted for an LPM because of its ease of interpretation; effect sizes are important and meaningful when analyzing nonresponse. Next, we present models where we entered the relationship variables (Table 3). We estimated models with each relationship variable separately and one model where we entered all relationship variables simultaneously. The models in Table 3 included the individual traits of the parents, but for the sake of space, these were not presented again since they were already listed in Table 2. Table 4 presents models where the distinction between early and late participation was used as a dependent variable, conditional on response. Early participation is participation via CAWI, late participation is participation via the CAPI follow-up (Computer Assisted Personal Interviewing). In Table 5, we examined whether nonresponse among divorced parents was possibly especially selective with respect to the quality of the parent–child relationship. To do so, we estimated the model with interaction effects of divorce/separation and the relationship traits.
Linear Probability Model of Nonresponse of Fathers and Mothers.
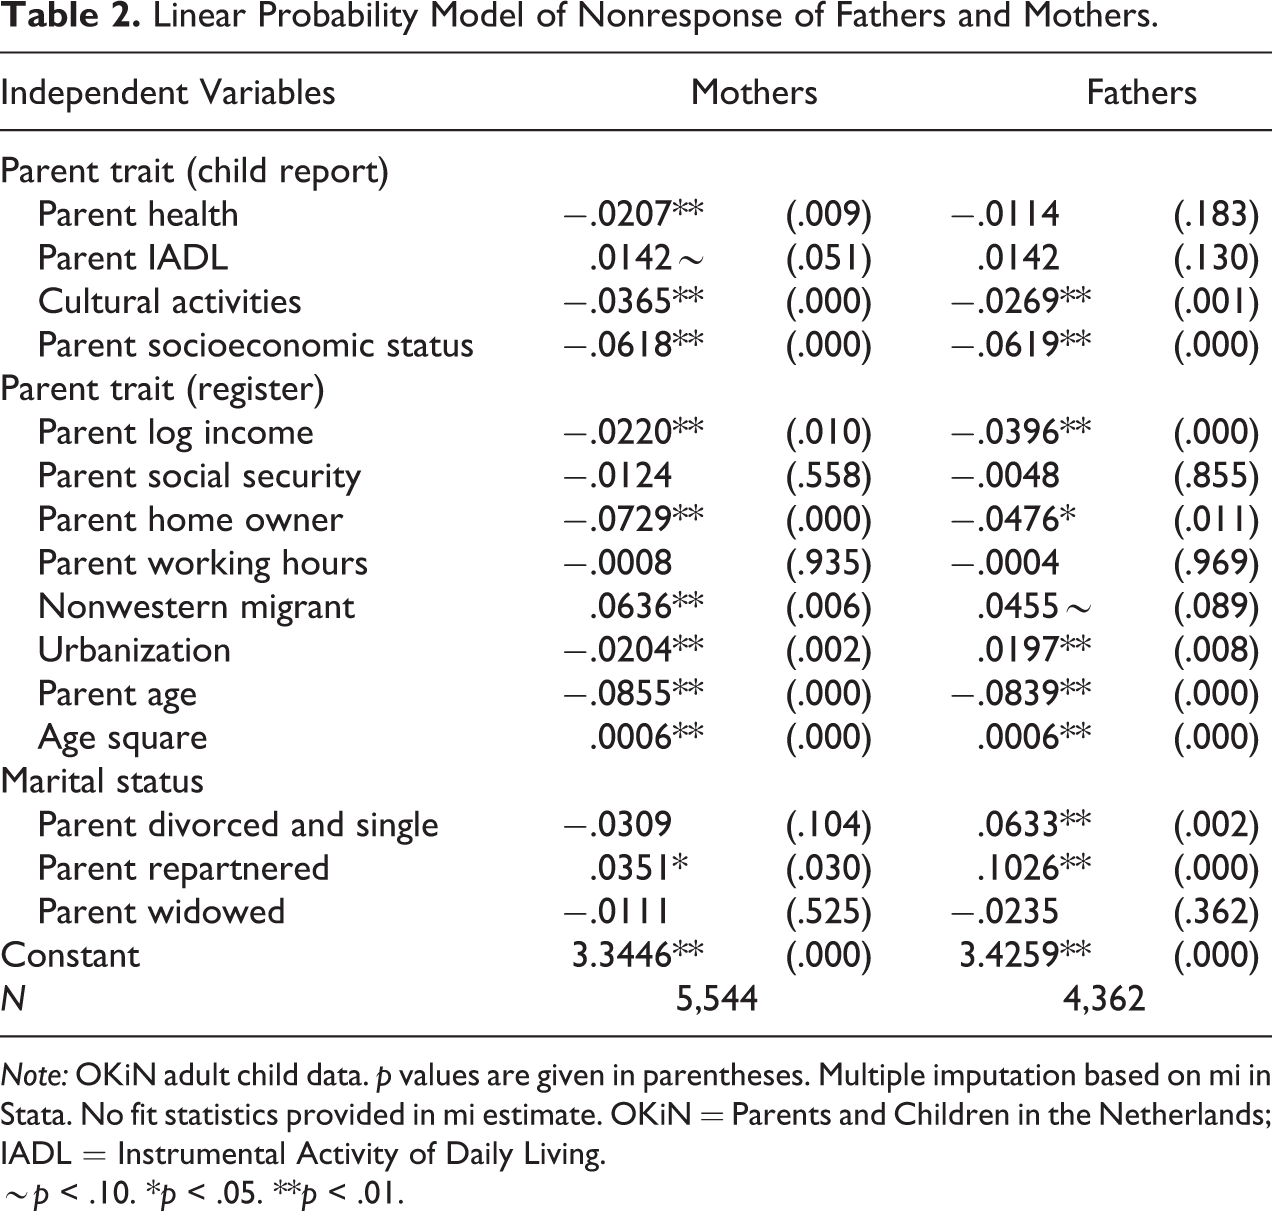
Note: OKiN adult child data. p values are given in parentheses. Multiple imputation based on mi in Stata. No fit statistics provided in mi estimate. OKiN = Parents and Children in the Netherlands; IADL = Instrumental Activity of Daily Living.
∼p < .10. *p < .05. **p < .01.
Linear Probability Model of Nonresponse of Fathers and Mothers with Relationship Traits.
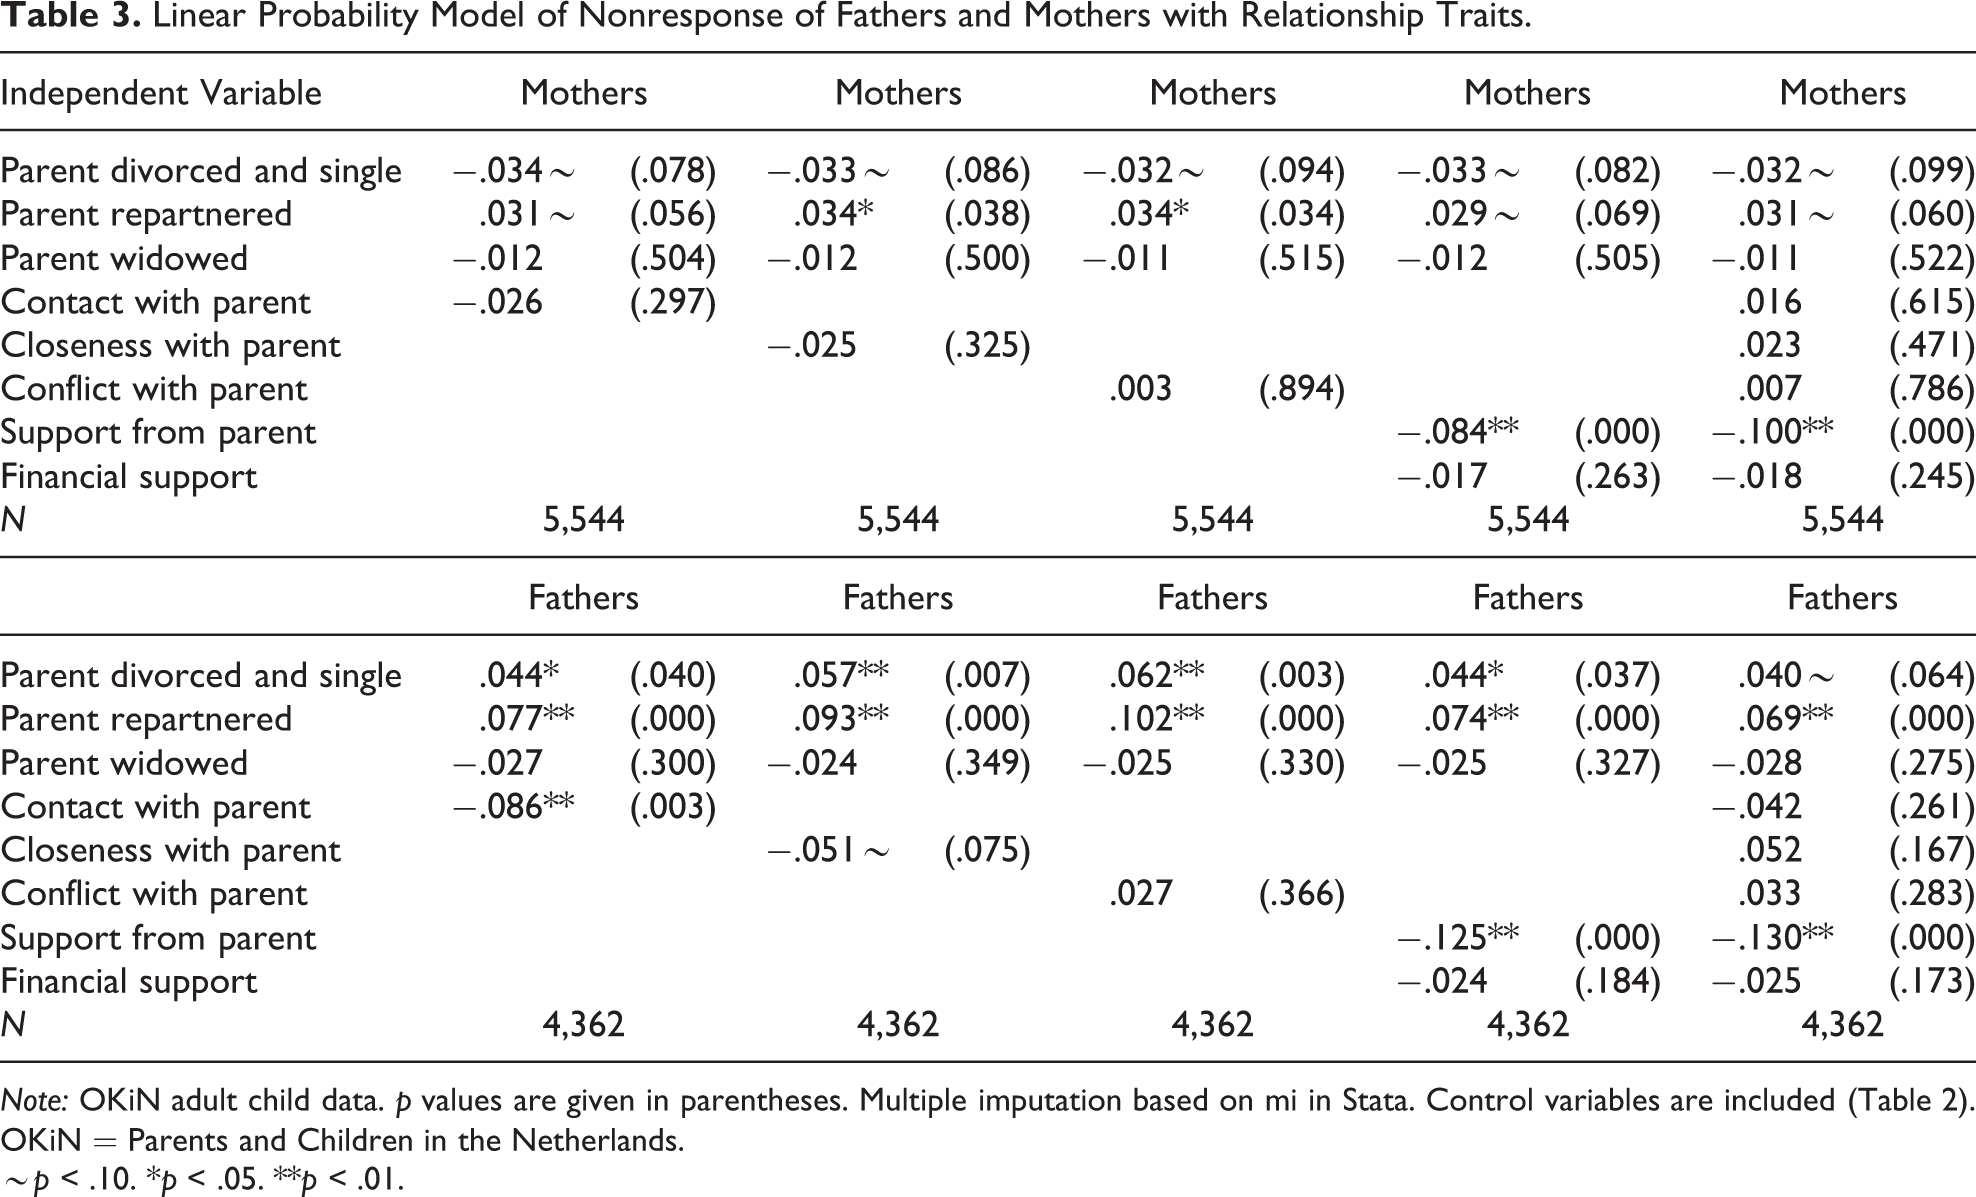
Note: OKiN adult child data. p values are given in parentheses. Multiple imputation based on mi in Stata. Control variables are included (Table 2). OKiN = Parents and Children in the Netherlands.
∼p < .10. *p < .05. **p < .01.
Linear Probability Model of Late versus Early Response of Fathers and Mothers.
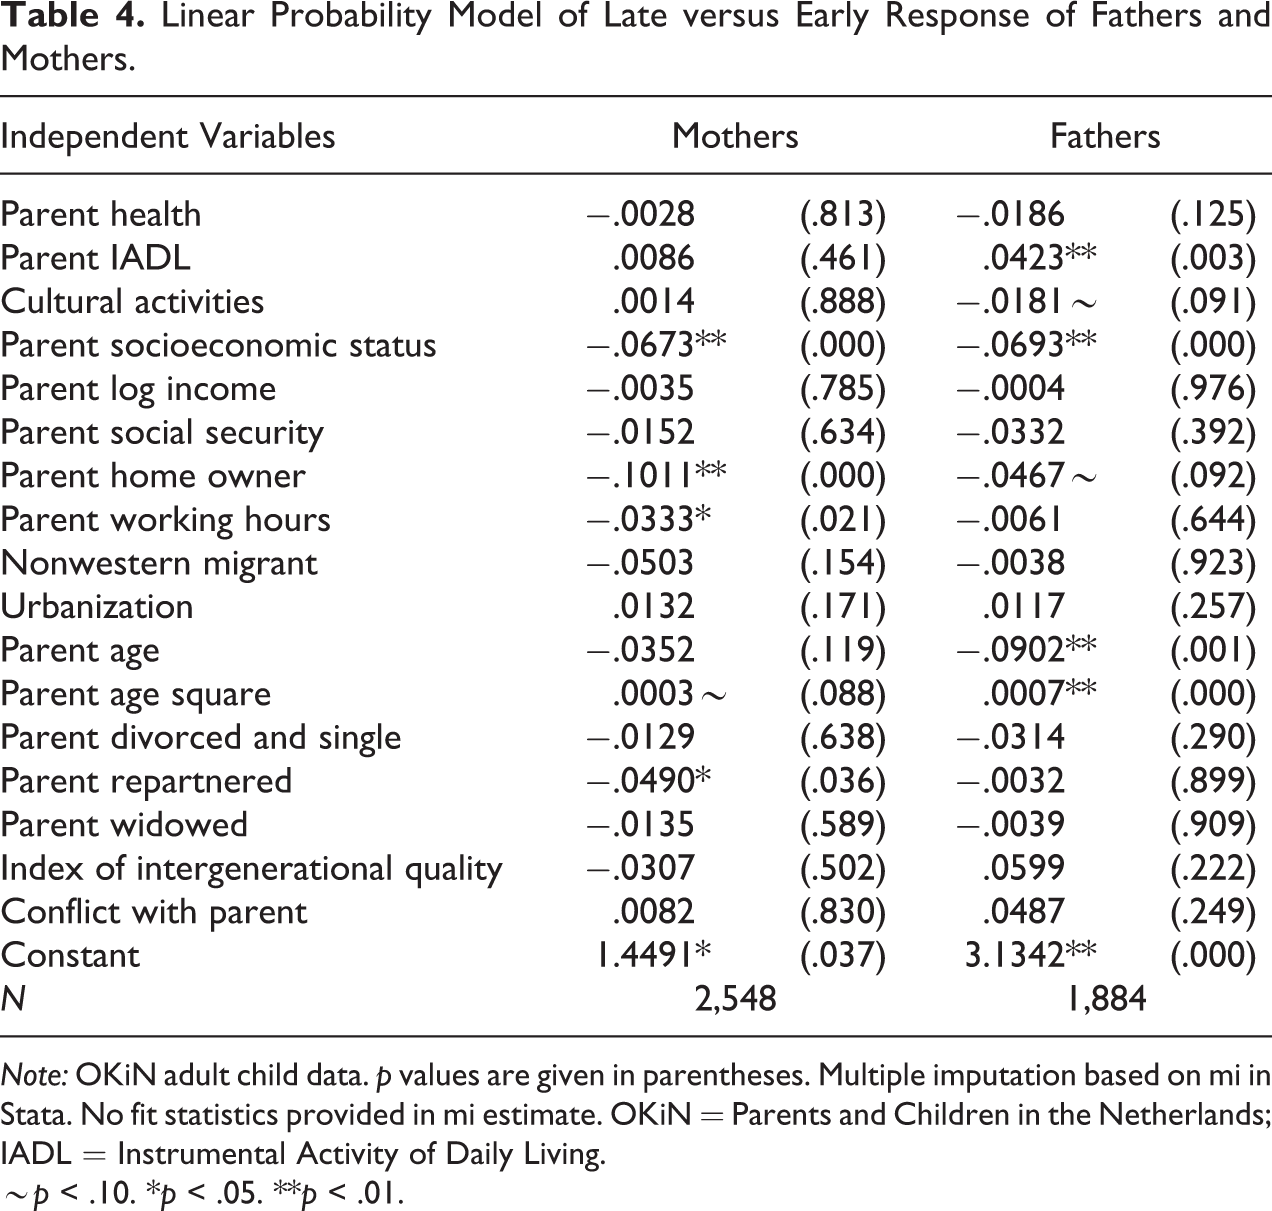
Note: OKiN adult child data. p values are given in parentheses. Multiple imputation based on mi in Stata. No fit statistics provided in mi estimate. OKiN = Parents and Children in the Netherlands; IADL = Instrumental Activity of Daily Living.
∼p < .10. *p < .05. **p < .01.
Linear Probability Model of Nonresponse of Fathers and Mothers with Interactions.
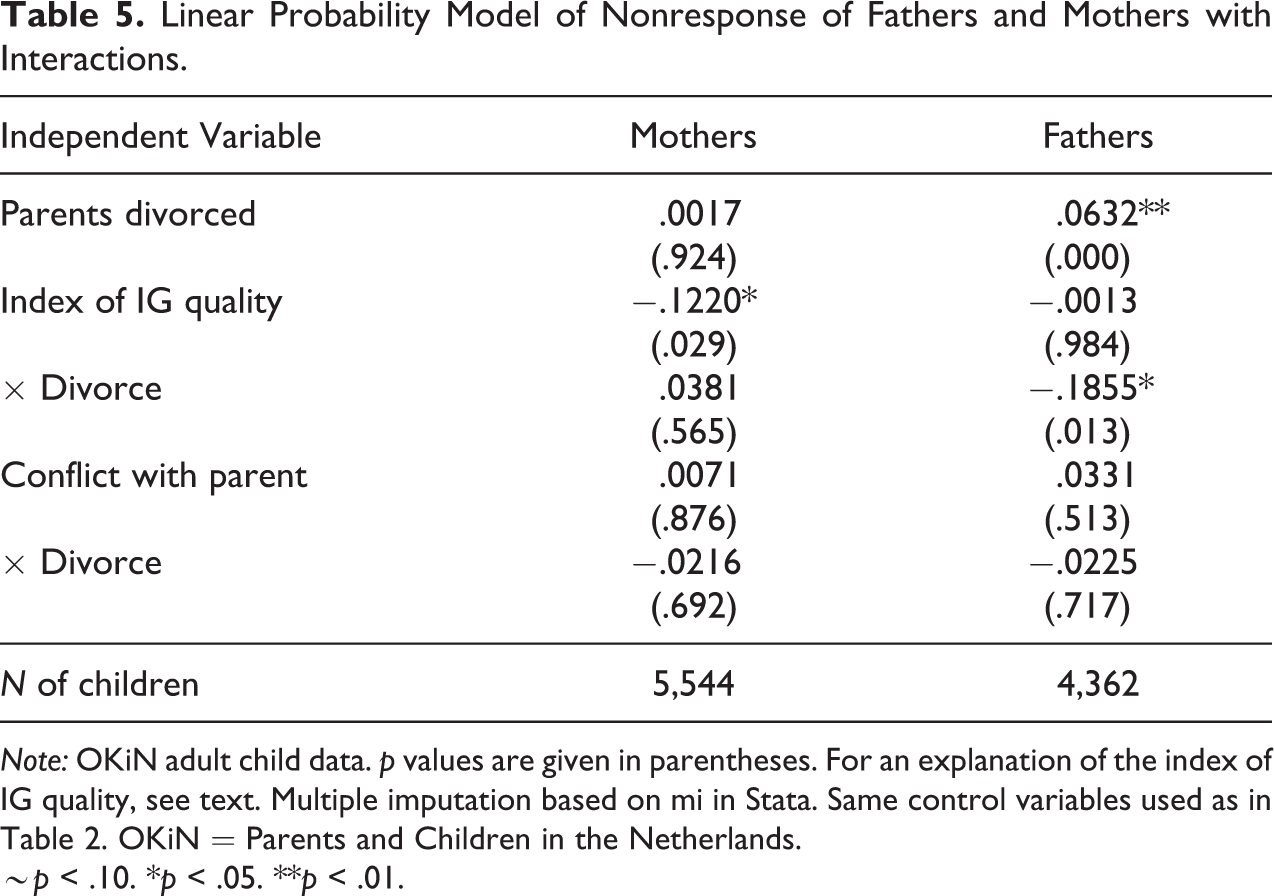
Note: OKiN adult child data. p values are given in parentheses. For an explanation of the index of IG quality, see text. Multiple imputation based on mi in Stata. Same control variables used as in Table 2. OKiN = Parents and Children in the Netherlands.
∼p < .10. *p < .05. **p < .01.
In the last part of the analysis, we analyzed the implication of nonresponse bias for descriptive evidence about family cohesion. To address this issue, we used a weighting procedure. Much statistical research has been done on alternative methods of weighting to correct for nonresponse (Brick, 2013), but when individual information is available on nonresponse, as is the case in panel data or in matched register data, the approach is relatively simple (Tolonen et al. 2019; Vandecasteele and Debels 2007). Using the regression model for parental nonresponse, we calculated the inverse of the predicted probability that a parent responded using the child data (based on a logistic regression model). Next, we matched the child data to the parents who responded and add the weight. We compare frequencies of contact, closeness, conflict, and support as reported by parents with and without this weight to assess the implications of selective nonresponse (Table 6). The information applies to the relationship with one (randomly chosen) child from the current union (if the parents were still married/cohabiting) or one (randomly chosen) child from the previous union (if the parents divorced/separated). This analysis will be presented separately for married/cohabiting mothers, married/cohabiting fathers, divorced/ repartnered mothers, and divorced/repartnered fathers.
Frequency Distributions of Parent Reports About Relationship With Biological Child Before and After Correcting for Selective Nonresponse.
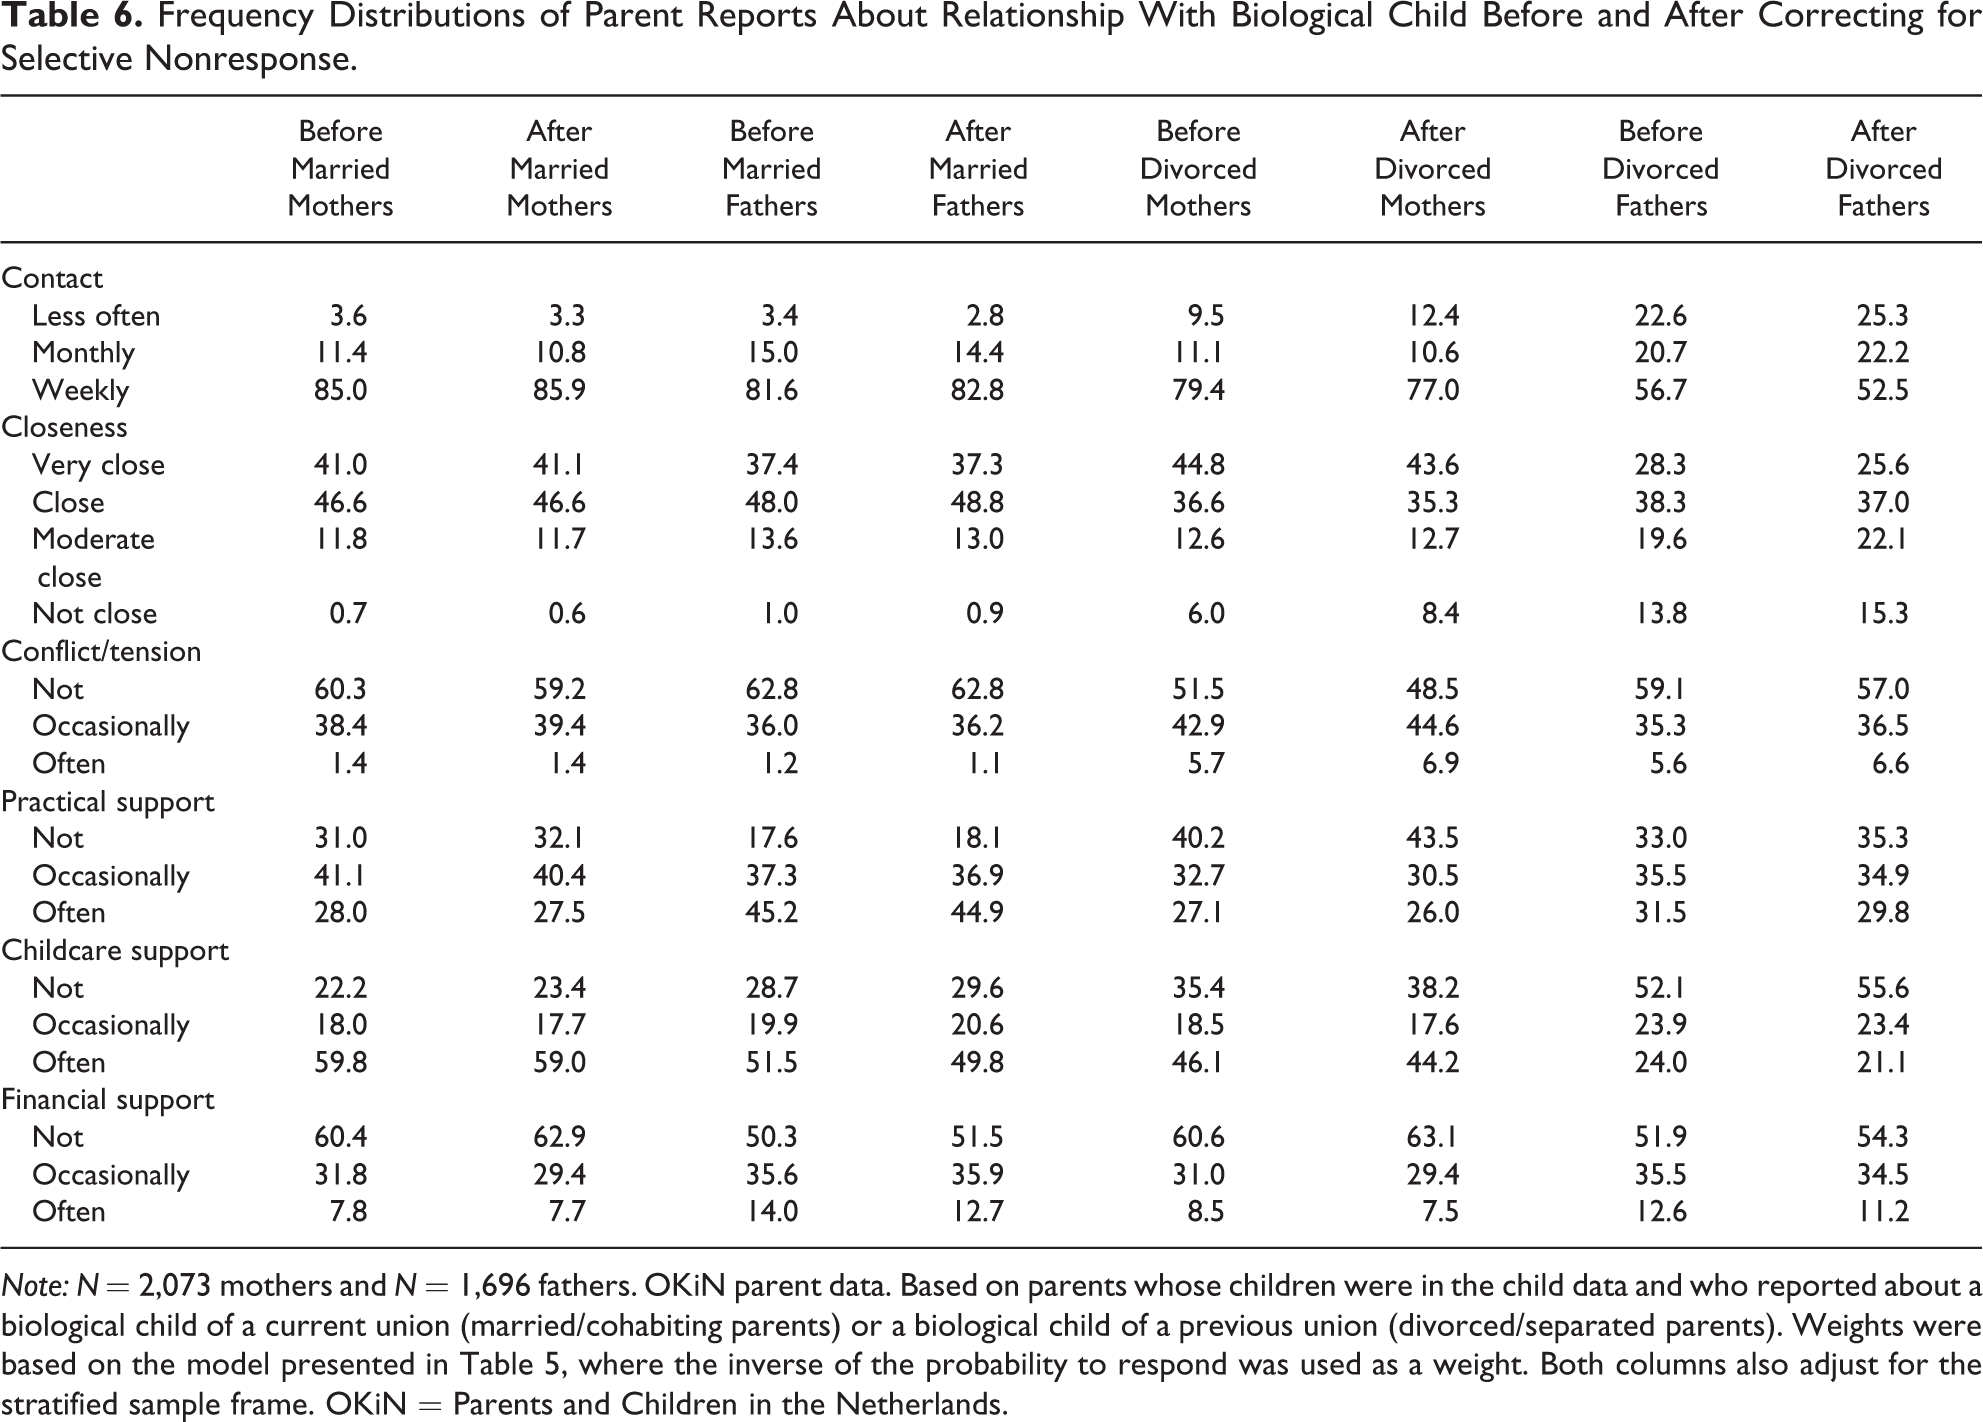
Note: N = 2,073 mothers and N = 1,696 fathers. OKiN parent data. Based on parents whose children were in the child data and who reported about a biological child of a current union (married/cohabiting parents) or a biological child of a previous union (divorced/separated parents). Weights were based on the model presented in Table 5, where the inverse of the probability to respond was used as a weight. Both columns also adjust for the stratified sample frame. OKiN = Parents and Children in the Netherlands.
Results
Descriptive Evidence
For the sample of responding children, 43.3 percent of the fathers and 46 percent of the mothers responded. When looking at the response of parents in the full sample, that is, not conditional on children’s response, the response rates were somewhat lower, that is, 38 percent for fathers and 40 percent for mothers. This suggests that there was an association between the response of parents and children. A direct way of assessing such “family effects” is to calculate an odds ratio (OR) for the response probability of parents and children. The OR was 1.59 for fathers and children and 1.82 for mothers and children (both statistically significant). This confirmed that the response rates of parents and children were related, despite the fact that they were sampled and approached independently.
Regression Results
The first set of regression models is presented in Table 2. The dependent variable is the probability of a nonresponse, and the independent variables are parent traits from either the registers or the child reports. Most of the variables that we included had significant effects on nonresponse. When we use the term “effects” in the text, we mean this in a statistical sense; we do not imply that these effects are evidence of causality. First, there were clear status and integration effects. Parents with higher SES and higher income and parents who were more involved in cultural participation were more likely to participate. Homeowners were more likely to participate than renters. Age had a nonlinear effect on nonresponse first declining with age and then increasing. The turning point was at age 71 for mothers and age 69.9 for fathers. After these ages, nonresponse began to increase, as one would expect. Good health itself had a small negative effect on nonresponse (for mothers) and parents with daily living limitations were more likely to have a nonresponse (p = .051). Non-Western migrants were less likely to participate, especially migrant women.
We now turn to the marital status variables. Divorced single fathers had a six percentage points lower response rate compared to married/cohabiting fathers, and repartnered fathers had a 10 percentage points lower response rate. Divorced single mothers were not less likely to participate compared to married/cohabiting mothers, but repartnered mothers were slightly less likely to participate. Clearly, the two divorce effects were stronger for fathers than for mothers. In a pooled model, both interactions were statistically significant (t = 3.27 and t = 3.09 for single/divorced and divorced/repartnered parents, respectively).
In Table 3, we added the relationship traits to the model. The results for mothers are in the top panel. Of the five traits, one had a significant effect on nonresponse and in the direction one would expect. The mother was more likely to respond when (s)he has offered more support to her child in the past 12 months. There were no effects of contact, closeness, and conflict. The effect of financial support was weak and insignificant; hence, the effect was limited to support that takes time to give.
Effects for fathers appeared stronger. Three effects had p-values below 10 percent. The father was more likely to participate when he had more frequent contact with the child, when the relationship was closer (p = .08), and when the father gave more support to the child. While significant, most of these effects were not large. Since all relationship traits are rank scores, their theoretical range is 1. Hence, the estimated effect of contact of .086 in Table 3 implies that the difference in response rates between fathers with the most and fathers with the least amount of contact in the data was 8.6 percentage points. Interesting to observe is that there was no effect of intergenerational conflict on response at all. When including all relationship traits in one model, only the support variable had a significant effect and this applied to both fathers and mothers.
When we compared Tables 2 and 3, we noticed some decline in the marital status effects when the intergenerational relationship variables were included. A formal test of mediation shows that for fathers, the effect of divorce/single was reduced by .023 (t = 3.25, p < .01), and the effect of divorce/repartnered was reduced by .033 (t = 3.60, p < .01). Nonetheless, the two effects for fathers remained significant in Table 3. Hence, there was only partial mediation of marital status effects for fathers by relationship variables. For mothers, the reductions in the effects of divorce were statistically insignificant.
In Table 4, we replaced the response variable with a variable indicating whether the parent responded using the paper-and-pencil questionnaire or via the initial CAWI interview. This dependent variable can be seen as an indicator of response likelihood since parents who responded on paper were initial nonrespondents. Some of the parental traits had effects that were consistent with this interpretation. High-status parents were more likely to respond early, just as they were more likely to respond at all. The marital status variables and the relationship variables had no effect (with one exception). This suggests that there was little topic-related selectivity in late versus early response.
In Table 5, we present models where we interacted the relationship traits by marital status. We combined the two divorce variables and we used an index of relationship quality consisting of contact, closeness, and support. These models yielded a number of additional findings that were important. Specifically, we found a significant interaction between the divorce variable and the relationship quality index for fathers. The main effect for relationship quality—which applies to married/cohabiting fathers—was −.001 which was insignificant. In other words, for married/cohabiting fathers, there was no selectivity in nonresponse with respect to the quality of family ties. The interaction with the divorce variable was −.186, which means that the effect of relationship quality on nonresponse for divorced fathers was −.001 + −.186 = −.187. Hence, the evidence for selective nonresponse that we found in Table 3 only applied to divorced fathers. The two interactions for mothers were both insignificant.
In Figure 1, we present the predictive margins of the model by relationship quality and mother’s and father’s marital status as well as the confidence intervals. All other independent variables were set at their means. The figure illustrated again that relationship quality mattered only for divorced fathers and not for married/cohabiting fathers. The pattern also made clear that the response deficit among divorced fathers increased with declining relationship quality. Most interesting perhaps was the finding that response levels do not differ between married/cohabiting and divorced fathers when the quality of the relationship was good. Among mothers, the lines were more parallel and the (small) effect of divorce remains present regardless of relationship quality.
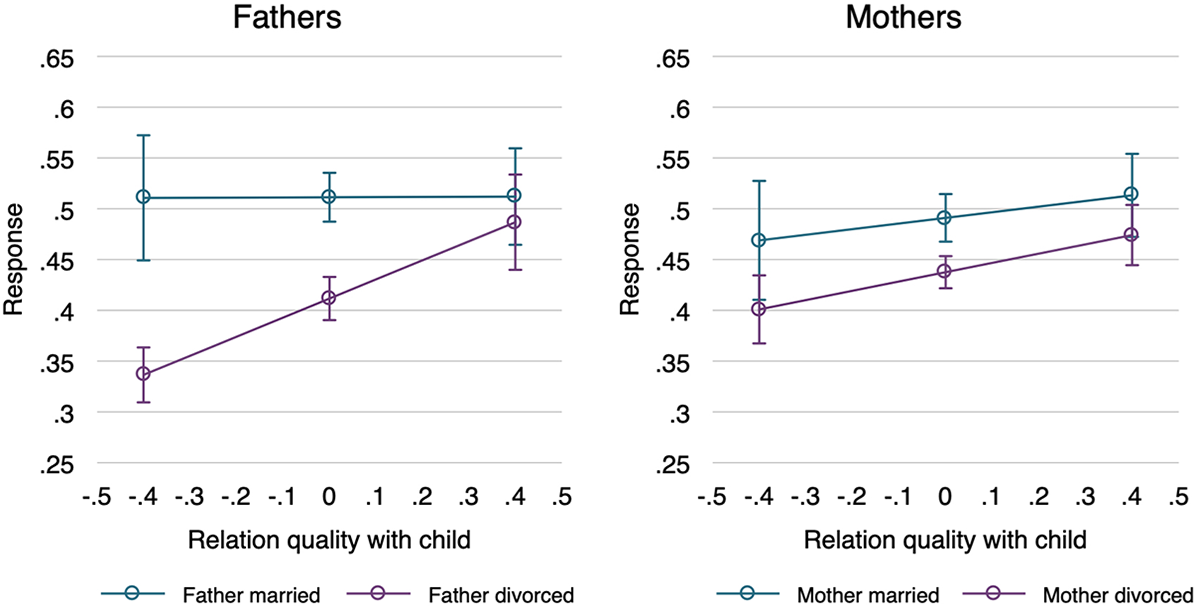
Response rates of parents in the Netherlands.
Although we did not find strong effects of relationship variables on nonresponse, there were some effects. This raises the question if and to what extent nonresponse matters for the descriptive evidence on family ties. Table 6 presents the frequency distributions of contact, closeness, conflict, and support based on the parent data. The first set of frequencies was only weighted for the stratified sample frame. The second set was also weighted for the inverse probability of parental response, as predicted by a logit model (using the same variables as those in Table 5), thereby controlling for selective nonresponse. We noticed small differences in the descriptives. For mothers and for married/cohabiting fathers, levels of support, contact, and conflict differed one to two percentage points at the most, a trivial difference. Even for divorced fathers, differences were small. For example, less than monthly contact was 22.6 percent in the uncorrected sample and 25.3 percent in the corrected sample. Not close and moderate close combined was 33.4 percent uncorrected and 37.4 percent corrected.
Conclusion
In the distant past, participation in surveys was large, but nonresponse rates have been increasing over time, raising concerns about the validity of descriptive evidence that surveys aim to provide (De Leeuw and De Heer 2002). These concerns apply in particular to topical surveys where researchers cannot avoid to explain the content and purpose of the survey to potential respondents. The risk of selective nonresponse is then not unlikely, but it has been difficult to empirically test such claims.
Our multiactor analyses show that there were small effects of family cohesion on the likelihood that sample respondents participate in a survey about family relationships. Of all the relationship indicators that we examined, mainly downward intergenerational support—from parents to children—affected parental nonresponse. This seems plausible since giving support to adult children and participating in a family survey are to some extent similar behaviors: They both require a person do something for someone else and they both are related to a sense of obligation to do so (Groves, Cialdini, and Couper 1992; Silverstein, Gans, and Yang 2006). It is further important to notice that parent–child conflict had no effect on parental response at all.
Among fathers, we found that nonresponse was more selective when fathers were divorced or repartnered than when fathers were in their first marriage. Divorced fathers were less likely to participate—something that is known already—but on top of that, divorced fathers who have weak ties with their children were less likely to participate—a new finding. For women, selective nonresponse existed as well but did not depend on marital status. The effect size of relationship quality for divorced fathers was not small. The range of the index variable was 0.88, and the implied effect of the index variable for divorced fathers was −0.186. This means that there was a maximum of 0.88 × 18.6 = 16 percentage points difference in response rates between divorced fathers with the lowest score and divorced fathers with the highest score on the index.
Substantively, the effects of divorce have often been interpreted in terms of the social integration hypothesis since divorced persons are on average more socially isolated than married persons and social isolation increases nonresponse (Amaya and Presser 2017; Groves and Couper 1998). Our analysis also points to the role of the survey topic. Divorced fathers often have more negative experiences with their former children (Kalmijn 2013), and this could make them more reluctant to participate in a survey addressing family issues. We showed that divorced fathers with good ties to their children were not less likely to participate. That the divorce effect only exists when relationships with the children were poor provided additional and more direct evidence for the topical hypothesis about nonresponse (Figure 1).
We examined the potential implications of selective nonresponse by using panel-like weights that adjust for selective nonresponse. After doing this, we observed that the uncorrected percentages of support, closeness, conflict, and contact in the parent data were off by no more than one to two percentage points as a result of selective nonresponse. The largest differences were found for divorced fathers, as one would expect, but even here, the effects do not translate into a substantial bias. The regression effects of having a poor relationship with the father on nonresponse propensities apparently did not translate into large biases in the overall descriptive evidence. A simple example can illustrate why this is the case. Suppose that 25 percent of father–child ties are negative and 75 percent are positive. If 60 percent of fathers with positive ties participate and 45 percent of fathers with negative ties—a substantial difference in line with our effects in Table 4—we would observe in the data that 20 percent of the fathers have negative ties. This is an underestimate of poor ties but a modest one. Selective nonresponse needs to be much larger to have an meaningful impact on descriptive findings about the strength of family ties.
Our evidence was based on a sample of (adult) children who did respond. Although family members were approached independently, it is still possible that response tendencies are correlated between parents and children. Our calculations show that when a child responded, the parent is more likely to respond. There can be many reasons for such “family effects” in nonresponse. Family members share characteristics that affect response (e.g., similar SES of parents and children). A lack of family cohesion may affect the response probability of all members, leading to a tendency of entire families not to participate. Finally, there may have been communication about the survey between parent and child. With the data at hand, it is not possible to test the relevance of these mechanisms.
Because we cannot analyze parental nonresponse for children who did not respond, there may be sample selection bias in the effects of family cohesion on nonresponse is difficult (Fu, Winship, and Mare 2004). We reestimated our models including the variable that measures the child’s follow-up approval—as a proxy for the child’s “response likelihood”—but this did not change the estimates of any of the relationship variables. Our design of independent register-based samples of parents and children improves upon earlier multiactor designs but did not remove the entire association between the responses of family members.
Another issue is that we relied on reports by the child on the relationship with the parent. This is clearly a one-sided view of the relationship, and some authors find that parents are more positive about the relationship with the child than children are about the relationship with the parent (Mandemakers and Dykstra 2008; Seltzer and Bianchi 2013). Further analyses of our own data suggest that the correlation between reports of parents and children is reasonable, however. For example, the correlation between closeness reports of parents and children in dyads is .62, which is substantial (Van Houdt, Kalmijn, & Ivanova 2020). It would still be interesting, however, for future research to study the problem in a reverse direction by analyzing the response of children for parents who responded.
We started this article with the question “Are national family surveys biased toward the happy family?” Our answer now is: in general no. Still, for divorced fathers, selective nonresponse may be an issue, something which is obviously relevant given the historical increase in divorce in most Western countries. That the effect on nonresponse also applies to married/cohabiting men who were previously divorced makes the problem even more salient. While these issues should deserve more attention from survey researchers in sociology, demography, and psychology, concerns for an overly rosy picture of family life in surveys are probably not warranted.
Supplemental Material
Supplemental Material, sj-pdf-1-smr-10.1177_0049124120986208 - Are National Family Surveys Biased toward the Happy Family? A Multiactor Analysis of Selective Survey Nonresponse
Supplemental Material, sj-pdf-1-smr-10.1177_0049124120986208 for Are National Family Surveys Biased toward the Happy Family? A Multiactor Analysis of Selective Survey Nonresponse by Matthijs Kalmijn in Sociological Methods & Research
Footnotes
Author’s Note
The OKiN was developed, designed, and executed by a collaborative team of researchers from the NIDI-KNAW and Statistics Netherlands (CBS). The survey described in this article was officially approved by the AISSR Ethical Advisory Board of the University of Amsterdam. Respondents were approached with informed consent. The data are publicly available without cost from DANS-KNAW (Dutch data archive).
Declaration of Conflicting Interests
The author(s) declared no potential conflicts of interest with respect to the research, authorship, and/or publication of this article.
Funding
The author(s) disclosed receipt of the following financial support for the research, authorship, and/or publication of this article: The survey was conducted as part of a larger project on Family Complexity funded by the European Research Council under the Horizon 2020 program (ERC grant agreement no. 669334).
Supplemental Material
Supplemental material for this article is available online.
Note
References
Supplementary Material
Please find the following supplemental material available below.
For Open Access articles published under a Creative Commons License, all supplemental material carries the same license as the article it is associated with.
For non-Open Access articles published, all supplemental material carries a non-exclusive license, and permission requests for re-use of supplemental material or any part of supplemental material shall be sent directly to the copyright owner as specified in the copyright notice associated with the article.