
Abstract
Panel attrition is a major problem in long-term panel studies. While the design of the German National Educational Panel Study adult survey—combining biannual competency tests with regular face-to-face interviews—is highly innovative, such a design could raise respondent burden and thus potentially increase panel attrition and nonresponse bias. To test this possibility, we use an experimental split questionnaire design administering two tests to one half of the respondents but only one test to the other half. Analyzing the effects of these different experimental settings on response behavior shows that even though those assigned to the longer test variant had no higher probability of refusing to participate in the survey, they were significantly more likely to apply alternative strategies for not taking the tests. The results also show that not only test avoidance but also low test performance has negative consequences for survey participation in later waves.
Panel attrition, one of the major problems in long-term panel studies, is widely discussed in the literature on survey research methods (e.g., Laurie 2008; Lugtig 2014; Lynn 2008; Uhrig 2008; Watson and Wooden 2009). In general, attrition is considered a problem not only because it reduces the overall number of respondents but also because it might be selective, thereby potentially increasing the bias of estimates (e.g., Ahern and Le Brocque 2005; Behr, Bellgardt, and Rendtel 2005; Das, Toepoel, and Soest 2011; Fitzgerald, Gottschalk, and Moffitt 1998; Mirowsky and Reynolds 2000).
Constituting a special type of nonresponse, panel attrition should increase with respondent burden (for nonresponse in general, e.g., Groves et al. 1999, 2009, for panel attrition in particular, e.g., Laurie 2008). Interview length and frustrating interview experiences are among the most important factors generating respondent burden. These two aspects of respondent burden should not only occur during the collection of survey data but also during the tests that assess respondents’ competencies. However, as testing cognitive competencies within regular personal interviews in a panel study of the adult population is new and uncommon, little is actually known about the consequences of testing competencies within an ongoing panel study.
Many large-scale studies use competency tests to analyze student abilities in central domains of school curricula such as reading, mathematics, or science. Well-known examples are the Trends in International Mathematics and Science Study (e.g., Mullis and Martin 2013; Mullis et al. 2009) or the Programme for International Student Assessment (e.g., Organization for Economic Cooperation and Development [OECD] 2014a, 2014b). In these studies, the most common way of carrying out competence tests is conducting them only once with students during classroom interviews.
In recent years, competency tests have also been adopted as part of large-scale international studies of the adult population. The most prominent examples for this type of study are the International Adult Literacy Survey (IALS; OECD 2000), the Adult Literacy and Lifeskills Survey (ALL; Statistics Canada and OECD 2005), and the Programme for the International Assessment of Adult Competencies (PIAAC; OECD 2009, 2013).
What the IALS, ALL, and PIAAC have shown is that it is feasible to conduct competency tests as part of regular cross-sectional interviews of the adult population, despite the burden that such tests place on respondents. The particular feature of Starting Cohort 6 of the National Educational Panel Study (NEPS; see Allmendinger et al. 2011; Aust et al. 2011, 2012a, 2012b; Bech et al. 2013) is that it was one of the first studies to apply such tests repeatedly in the context of a panel study. In this study, the target group is composed of a large sample of the adult population, participants are interviewed every year, and competency tests are administered every second year during face-to-face interviews.
As NEPS was among the first panel studies to include repeated competency tests, we wanted to learn more about the consequences of such a design, especially because preventing large or selective attrition is one of the core factors critical for the long-term success of a panel study. This article tackles the question of whether the administration of competence tests in one wave of an ongoing panel study will increase panel attrition and selective nonresponse in later waves of that study. Moreover, we examine whether attrition might be connected to respondents’ test performance because this connection would most likely aggravate the problems with regard to selectivity.
To answer these questions, we implemented an experimental split questionnaire design in the third wave of the NEPS’ Starting Cohort 6. We randomly assigned tests in two different domains, with a total duration of 65 minutes (plus a general 30-minute questionnaire) to half of the respondents, assigning the other half only one test, either of reading or mathematical competencies (about 35 minutes plus the same 30-minute general questionnaire). Thus, we were able to test the effects of announcing the test domain and duration on nonresponse in the panel wave in which the test took place, as well as the effect of being assigned to either of the test variants on response behavior in subsequent waves. Moreover, we tested whether effects of respondents’ test performance might also differ between the different test variants.
In the remainder of this article, we first discuss the relevant literature on respondent burden, giving the theoretical background against which we perform our analyses. Second, we describe the design of the NEPS adult study and develop hypotheses on the effects of the split questionnaire design on response rates and panel attrition. Third, we introduce the data, variables, and methods used in our empirical analyses. Fourth, we present our results and, fifth, we conclude by summarizing our core findings and discussing the implications for further research.
Theoretical Background: Respondent Burden in Repeated Tests
Among the factors influencing survey participation, respondent burden is considered one of the most important elements that might negatively affect participation. In his classic article on respondent burden, Bradburn (1978) distinguishes among four factors contributing to respondent burden: interview length, the effort required for answering survey questions, the stress caused by the survey tasks, and the frequency with which respondents are interviewed in a longitudinal survey. All four factors are of particular importance in panel surveys, especially in those that (like the NEPS) regularly test respondents’ competencies.
When discussing interview length, most textbooks on survey design state that respondents’ cooperation will decline with increasing interview length (Dillman, Smyth, and Christian 2009:26; Groves et al. 2009:206; Lavrakas 2008:659-660; Schnell 2012:117-118). Likewise, when interview length is varied experimentally, most of the literature reports negative effects of interview length on response rates (Groves et al. 1999). This finding applies both to cross-sectional and to longitudinal surveys.
Several studies show that respondents receiving a longer instrument than others were more likely to refuse to participate in the following panel wave (Bogen 1996; Sharp and Frankel 1983; Zabel 1998). In studies that use different interview modes, negative effects are primarily observed for telephone interviews (e.g., Dijkstra and Smit 2002; Hansen 2007; Roberts et al. 2010), online surveys (Galesic and Bosnjak 2009; Marcus et al. 2007), and mail surveys (Dillman, Sinclair, and Clark 1993; Porter 2004). However, evidence is not as clear-cut for face-to-face interviews. For example, Groves et al. (1999) argue for a negative effect of survey length on participation. Others (e.g., Lynn 2014; Sharp and Fraenkel 1983) 1 do not find any significant effect, yet they provide no explanation as to why the influence of questionnaire length should vary over different survey modes.
Research on the other three factors of respondent burden is sparse. One exception is Lenzner and coauthors (Lenzner 2012; Lenzner, Kaczmirek, and Galesic 2011; Lenzner, Kaczmirek, and Lenzner 2010) who argue that questions containing text features making the questions difficult to understand are among the main factors increasing the effort involved in answering survey questions. Their methods include a quantitative analysis of response times (Lenzner et al. 2010), a small experiment using eye-tracking methods with 44 respondents (Lenzner et al. 2011), and an analysis of different indicators of response quality (Lenzner 2012). Lenzner and coauthors show that various factors that might potentially contribute to lower item comprehensibility indeed lead to an increase in cognitive burden. However, despite some indication of negative effects on response quality, they found no significant effects of such difficult questions on survey dropout (Lenzner 2012; Lenzner et al. 2010).
A further example of research studying the effect of the effort involved in answering survey questions is Dillman et al. (1993). They show that lowering cognitive burden by applying a more user-friendly questionnaire design has a positive effect on response rates, even beyond the positive effect of shortening the questionnaire.
As competency tests aim at measuring the entire range of a particular competency domain (e.g., mathematics) in a given population, they include a large set of tasks, from very easy to very difficult. That only respondents with outstanding skills can succeed at all of these tasks is thus very likely. Therefore, because answering competency test questions should be more difficult than answering regular survey questions, that competency tests demand higher effort is very clear.
Bradburn’s (1978) third factor of respondent burden is the stress caused by the survey tasks. He defines stress as the discomfort the respondent experiences when taking a survey. Such stress may result from a variety of factors including being asked embarrassing questions or questions about sensitive topics and having to take mental or physical tests. Among these factors, the influence of sensitive topics on respondent behavior is the most discussed in the literature. However, most contributions assume that sensitive topics lead to item nonresponse or biased responses rather than to unit nonresponse. 2 Among the few studies that report lower response rates for surveys with sensitive questions are Dillman et al. (1993), Singer, van Hoewyk, and Neugebauer (2003), Singer, Mathiowetz, and Couper (1993), Singer and Presser (2008), and Tourangeau and Yan (2007).
For the present study, stress caused by taking mental or physical tests is more relevant. We argue that taking such tests is likely to increase respondents’ discomfort in two ways: First, as respondents are aware that their performance is being evaluated, the testing situation itself is likely to put pressure on them to perform well. Second, those who realize that they are not performing well will feel frustrated, a feeling that might create additional discomfort.
Both aspects of respondent burden—the effort involved in answering survey questions and the stress caused by the survey tasks—have particular consequences for repeated tests because respondents’ experiences in previous interviews appear to be an important source of panel attrition. Several studies show that respondents who enjoyed the interview, who were cooperative, and who had no difficulties answering the questions are more likely to participate in the next panel wave (Branden, Gritz, and Pergamit 1995; Hill and Willis 2001; Kalton et al. 1990; Laurie, Smith, and Scott 1999; Lepkowski and Couper 2002; Loosveldt and Carton 2001; Olsen 2005). Despite no empirical evidence of the effects of long competency tests on further participation, the results of these studies suggest that test performance might be highly predictive of future cooperation (for the potential connection between low skills and dropping out of longitudinal studies, see also Freese and Branigan 2012).
Bradburn’s fourth factor, the frequency with which respondents might be interviewed in a longitudinal survey, is of particular importance in a panel study with repeated interviews and tests (e.g., the NEPS). As Watson and Wooden (2009) argue, it is a “distinctive feature of longitudinal surveys…that nonresponse is not a one-off event and tends to accumulate over time as further waves of interviewing are conducted” (p. 157). Therefore, one can expect that the negative effects of interview length and test-induced cognitive burden will accumulate over successive panel waves. For this reason, the three other factors of respondent burden may have even more severe effects in longitudinal studies than they do in a cross-sectional design.
Study Design and Hypotheses
The Design of the NEPS Adult Study
NEPS Starting Cohort 6 is based on a large representative sample of the German residential population born between 1944 and 1986. The study comprises three subsamples, which were drawn in a two-stage process. In the first stage, municipalities in more than 250 sample points across Germany were selected. In the second stage, individuals in the selected age range were randomly drawn from the registers of the local residents’ registration offices in the selected municipalities.
The first subsample, drawn in 2007 for an earlier study called “Working and learning in a changing world” (ALWA), covered the cohorts from 1956 to 1986. Fieldwork for the first panel wave took place between August 2007 and April 2008 (for details, see Antoni et al. 2011; Kleinert et al. 2011). Only ALWA respondents who consented to be recontacted became part of NEPS Starting Cohort 6.
For the second NEPS wave in 2009/2010, two additional subsamples were drawn: a refreshment sample of the same age cohorts and an additional sample covering older persons born between 1944 and 1955. Finally, another refreshment sample for the entire range of age cohorts (1944–1986) was drawn for wave 4, which took place in 2011/2012.
Since then, these samples have been interviewed once a year, either in computer assisted telephone interview (CATI) or in computer assisted personal interview (CAPI) mode (for details, see Allmendinger et al. 2011). In even waves, the majority of interviews are conducted by telephone. In uneven waves, interviews are conducted face-to-face and combined with standardized competency tests. 3
The study design implemented in NEPS Starting Cohort 6 is unique, as it features the administration of competency tests in every second wave of a panel study of the adult population. This design was implemented for the first time in the third wave (2010/2011). The test domains in this wave were mathematics and reading German texts. In wave 5 (2012/2013), both science and information and communication technology were tested (NEPS 2011).
The advance letter informed all respondents about the survey topic and the test(s) but not about interview length or test domains. Instead, the face-to-face interviewers were instructed to mention interview duration before the interview started. Respondents had 30 minutes to work on each test. Most were not able to answer all the questions within this time. After the test, respondents had to answer a background questionnaire, which on average took another 30 minutes. The entire interview thus exceeded by far the burden usually imposed on respondents by noncommercial surveys. After the face-to-face data collection, telephone interviews without testing were conducted as a conversion measure with those who could not be reached in person or who refused to participate in the face-to-face interview.
For testing whether administering such a long and demanding instrument might have negative consequences for nonresponse, an experimental split questionnaire design was set up in wave 3. Half of the respondents were assigned both tests, with 25 percent receiving the reading test first and 25 percent the mathematics test first. The other half were assigned only one of the tests: 25 percent reading and 25 percent mathematics. Afterward, all four groups received the background questionnaire.
Hypotheses
Given the results in the literature as previously discussed, we expect four different effects of test assignment and test participation on cooperation and panel attrition.
Our first hypothesis concerns the immediate effects of interview length. Earlier studies found no negative effect of length on response rates in face-to-face surveys such as NEPS wave 3. However, in contrast to these studies, we modified interview length substantially. Therefore, our first hypothesis states what we call a direct announcement effect.
Our second hypothesis assumes that, in the context of a panel study, the current interview has long-term consequences not only for the present but also for later panel waves. This assumption applies primarily to interview length. We expect that those who experienced a higher burden in the earlier interview will be less likely to participate when recontacted. As respondent burden should be higher in longer interviews, in our second hypothesis, we postulate a length effect.
Our third hypothesis is based on the idea that, from a longitudinal perspective, respondents’ interview experiences should be particularly important to their decision to participate in later waves. In this context, we consider respondents’ performance in the competency tests to be highly relevant: As tests are a stressful and cognitively demanding survey task, test participation might be a source of respondent burden. Such a burden could particularly affect respondents who do not do well in the tests, as their not doing well entails a negative experience rarely found in a normal interview situation. Therefore, in our third hypothesis, we expect a performance effect.
Note, however, that we cannot completely rule out that respondents who do not perform well in the tests might show a comparable pattern of survey attrition even if they were not required to take a competence test.
From a theoretical perspective, at least three mechanisms may lead to a correlation between ability and survey attrition, which we cannot perfectly disentangle: First, due to their subjectively higher cognitive effort, persons with lower abilities may feel more burdened by survey questions and test items. We assume that this mechanism is by far more pronounced for competence tests than it is for regular survey questions. The reason for this assumption is that survey designers usually put substantial effort into reducing the difficulty of regular survey items, so that all respondents—including those with lower abilities—will be able to understand—and answer—them easily. In contrast, test items are designed to distinguish between high- and low-ability respondents. Thus, at least some of the items should require high cognitive effort.
Second, respondents with lower abilities might feel more frustrated by the test(s) because they realize that they are unable to answer a substantial amount of the test items. We consider this mechanism to be a special case of stress-induced respondent burden that should only occur in tests, but not in regular interviews.
Third, persons with lower abilities are, on average, lower educated. From previous research, we know that lower educated persons are less likely to participate in surveys (e.g., Lillard and Panis 1998; Nicoletti and Peracchi 2002; Watson and Wooden 2009), potentially, because they have lower appreciation for this type of research (Groves and Couper 1998). Thus, while those with a lower test performance might also be less likely to participate in later panel waves (regardless of whether they had to participate in a test or not), it is the former two mechanisms to which Hypothesis 3 mainly refers.
To distinguish between disinterest (as described by the third mechanism) and burden (as described by the first and second mechanism), we include educational attainment in our models (for details, see Analysis Strategy and the Use of Control Variables section), thereby controlling for the generally higher likelihood of the low educated to attrit. 4
Our fourth hypothesis involves the idea that a low test performance might have stronger effects for those who took two tests than for those who took only one. Given that the test in the two-test group took twice as long as that in the one-test group, the positive or negative experience of those in the two-test group was likely stronger, and the memory of this experience might have remained more salient in the next survey waves. Therefore, we expect to find a length and performance interaction effect.
Data and Method
Analysis Data and Variables of Interest
In the empirical analyses in this article, we used the NEPS: Starting Cohort Adults consortium data for survey waves 1–5. 5 We did so because, in contrast to the standard scientific use file, the consortium data include information on nonrespondents and provide additional paradata that we need for our analyses.
To test our first hypothesis, we use data from wave 3, in which the experiment took place, to analyze the potential effects of being assigned to one of three different test versions (only the reading test/only the mathematics test/both tests) on response outcomes. We distinguish between four different outcomes: (1) participation in the interview that included the test(s), (2) participation in the face-to-face interview while refusing to take or aborting the test(s), (3) participation in the telephone conversion interview, and (4) nonresponse. We use data from all respondents who participated in the wave 3 experiment, that is, all persons in the gross sample of wave 3 who were eligible, able to respond, and could be reached by interviewers. 6
To test Hypotheses 2–4, our analyses concentrate on long-term effects of the experimental condition—that is, the type of test assigned—and response outcomes in wave 3 on response behavior in later waves. To analyze the effects of having been a member of a particular group of (non-)respondents in wave 3 on wave-specific survey outcomes in the two following waves, we use data from waves 4 and 5. Again, we restricted the analysis samples in waves 4 and 5 to persons from the gross sample who were eligible, able to respond, and could be reached by interviewers in the respective wave. This restriction allows us to only analyze the effect of test participation in wave 3 on the likelihood to subsequently drop out of the survey due to nonresponse, but not for other reasons (as, e.g., ineligibility or inability to respond). 7
In our models, we distinguished between the same four types of survey participation as in wave 3 (compare the description above). We also created an additional dummy variable to differentiate between respondents who had received only one test and those who had received two tests in wave 3. Moreover, we calculated models including interactions between the number of tests and the outcomes in wave 3. The outcome variable for the wave 4 analyses distinguishes only between sample members’ interview participation and nonresponse because no tests were administered in wave 4. Wave 5 included another round of competency tests. Therefore, we again use an outcome variable similar to the one used in the models for wave 3.
As we argued in Hypotheses 3 and 4, test results might also have an effect on participation in subsequent waves. Therefore, we estimated two additional models to analyze the effects of test proficiency in wave 3 on outcomes in the two later waves. In these analyses, to measure test proficiency, we used the share of test items answered correctly among all items in the test(s). We prefer this operationalization to the weighted likelihood estimate test scores typically used in competence testing for the following reason: The percentage of test items should reflect respondents’ subjective perception of performance more adequately than the test score because the test score also takes item difficulty into account—a factor that is unknown to the respondents. Moreover, as we use this variable as an indicator of respondents’ subjective test experience, we do not distinguish between proficiency in different domains.
Analysis Strategy and the Use of Control Variables
In general, when treatment groups are randomized in an experimental design, outcome differences observed between those groups—in our case the different questionnaire versions assigned—should be due to treatment (e.g., Shadish, Cook, and Campbell 2002). Therefore, including control variables for analyzing the effects of experimental treatments is unnecessary. However, even though the expected values of the characteristics of participating groups are—due to random assignment—equal over repeated experiments (i.e., when averaging over groups generated by repeated random assignment), the characteristics of two randomly drawn groups will not necessarily be the same in a single experiment. In such a case, differences between groups might exist merely by chance. Moreover, if such differences exist, they might have an influence on the results (Shadish et al. 2002).
To test for such differences between experimental groups, we estimated a multinomial logistic regression model with test assignment (reading only, math only, both tests) as dependent variable. 8 Overall, with only a few exceptions, the results show no significant effects for the covariates included. These exceptions are people whose native language is not German, temporary dropouts, interview mode, and interviewer workload in the previous wave (for details, see Table A2 in the Online Appendix). To control for the potential influence of these differences, we included these variables as controls in our multinomial model, which predicts participation mode for wave 3.
The question of which control variables to include is more complex for the analyses focusing on the two later waves (4 and 5) because group composition of the experimental groups might develop differently over time, for example, due to differences in panel attrition between individual waves. Therefore, we chose a conservative strategy in waves 4 and 5 and included control variables for factors known to influence unit nonresponse in longitudinal surveys (for details on control variables, see Table A3 in the Online Appendix; for a general overview, see Watson and Wooden 2009).
Depending on the type of dependent variable, we used a logistic regression in wave 4 and a multinomial logistic regression in wave 5. In all models, we use robust standard errors that are clustered by interviewer. The model tables report average marginal effects because—unlike for odds ratios—bias due to unobserved heterogeneity is largely negligible for average marginal effects (Auspurg and Hinz 2011; Mood 2010).
The relevant respondent characteristics that we control for include, first, basic demographic information such as sex and age. Second, we control for potential time restrictions such as the number of children or employment status and working time. Third, we include native language to operationalize problems connected to handling the survey and—in particular—the tests. Fourth, we use respondents’ highest educational degree to control for education-related differences in survey participation, which we need to distinguish from test-related ability effects (compare our discussion of Hypothesis 3).
Another set of variables controls for interviewer characteristics. Given that studies have found older interviewers to be more successful (Durrant, D’Arrigo, and Steele 2011; Hox and de Leeuw 2002), these characteristics include, first, the age of the interviewer. As only categorical information on interviewers’ age is available, we include dummy variables for age groups. A second factor is interviewer workload, as earlier results indicate that a high interviewer workload may result in lower response rates (Groves and Couper 1998; Nicoletti and Buck 2004). We measured workload by the log number of cases the interviewer worked on in the respective wave, mean centered separately for the face-to-face and telephone fields.
Third, we wanted to control for interviewers’ motivation and strategies. Given that we have no direct information on the strategies and motivation of the interviewers, we instead use a proxy variable: the interviewer’s success rate before he or she finalized the interview with the respondent. This variable is set to 0 for the first case worked per interviewer and is mean centered separately for face-to-face and telephone fields. Fourth, another potentially important influence is interviewer experience (Durrant et al. 2010; Grooves and Couper 1998:200-205; Groves et al. 2009:294-295; Hox and de Leeuw 2002). However, the corresponding variable in the NEPS data captures only the experience that the interviewers gained while working for the NEPS’ field institute, but not for others. As face-to-face interviewers in Germany often work for different field institutes, this variable is not a good indicator of their overall experience. Therefore, we did not include it in our models.
A further set of variables covers respondents’ interview experiences, as experiences from earlier interviews, particularly the most recent one, are important predictors of nonresponse in the current wave (Watson and Wooden 2009:163). First, we include a dummy variable for respondents who—according to interviewer reports—were uncooperative in the previous interview. Second, we use the log number of contacts in the previous panel wave (mean centered separately for face-to-face field, telephone field, and temporary dropouts). Even though this variable mainly reflects accessibility, a high number of unsuccessful contacts might also result from respondents trying to avoid the interview by not answering their phone or opening their door and thus might predict future refusals (Watson and Wooden 2009:161). Third, high item nonresponse in one wave should indicate respondents’ uninterest in or unhappiness with the survey, a factor that might result in their not participating in a further panel wave (Loosveldt, Pickery, and Billiet 2002; Watson and Wooden 2009). We use two variables to measure item nonresponse: the log number of items refused and the log number of items answered with “don’t know” in the previous interview.
Finally, we controlled for differences resulting from survey design and fieldwork. In panel studies, processes of self-selection result in rising sample homogeneity over time. Thus, the likelihood of nonresponse typically decreases with every panel wave (at least over the first few waves). To control for this pattern, we include three dummy variables for the different NEPS subsamples: those in the 2007 subsample, who participated in the wave 1 competency tests (reference group) 9 ; those in the 2007 subsample, who did not participate in the tests; and those in the 2009 subsample. In the models for participation in waves 3 and 5, we also control for participation mode and pattern in the previous wave. Given that NEPS is a mixed-mode study, those who were in the face-to-face field should differ both from those who were interviewed by phone and from temporary dropouts, who did not participate in the previous wave at all.
Results
Immediate Effects of Test Announcement
As a first step, we present descriptive results illustrating the bivariate association of test announcement and participation in wave 3. Table 1 shows that test participation rates among those to whom we assigned only one of the tests are comparable, independent of the actual domain (reading or mathematics) of the test they received. 10 In both groups, 64–65 percent of the analysis sample participated in both, the test and the interview, while fewer than 2 percent refused to take or aborted the test and 14–15 percent participated in the subsequent telephone conversion. Thus, nonresponse was also very similar in both groups, with only below 19 and around 20 percent refusing to participate in the overall study. Among those to whom we assigned both tests, nonresponse is also comparable (around 20 percent). However, more persons avoided the tests by switching to a telephone interview or by refusing to take or aborting the tests. Thus, the test participation rate for this group is about four to five percentage points lower than for respondents who received only one test. This result is a first indication that, in line with our first hypothesis, respondents in the two-test version are more likely to avoid taking the tests than are persons in the one-test version. However, these respondents appear not to do so by refusing interview participation altogether—thus becoming nonrespondents—but by using different avoidance strategies.
Test Assignment and Participation Mode in Wave 3 (N and %).
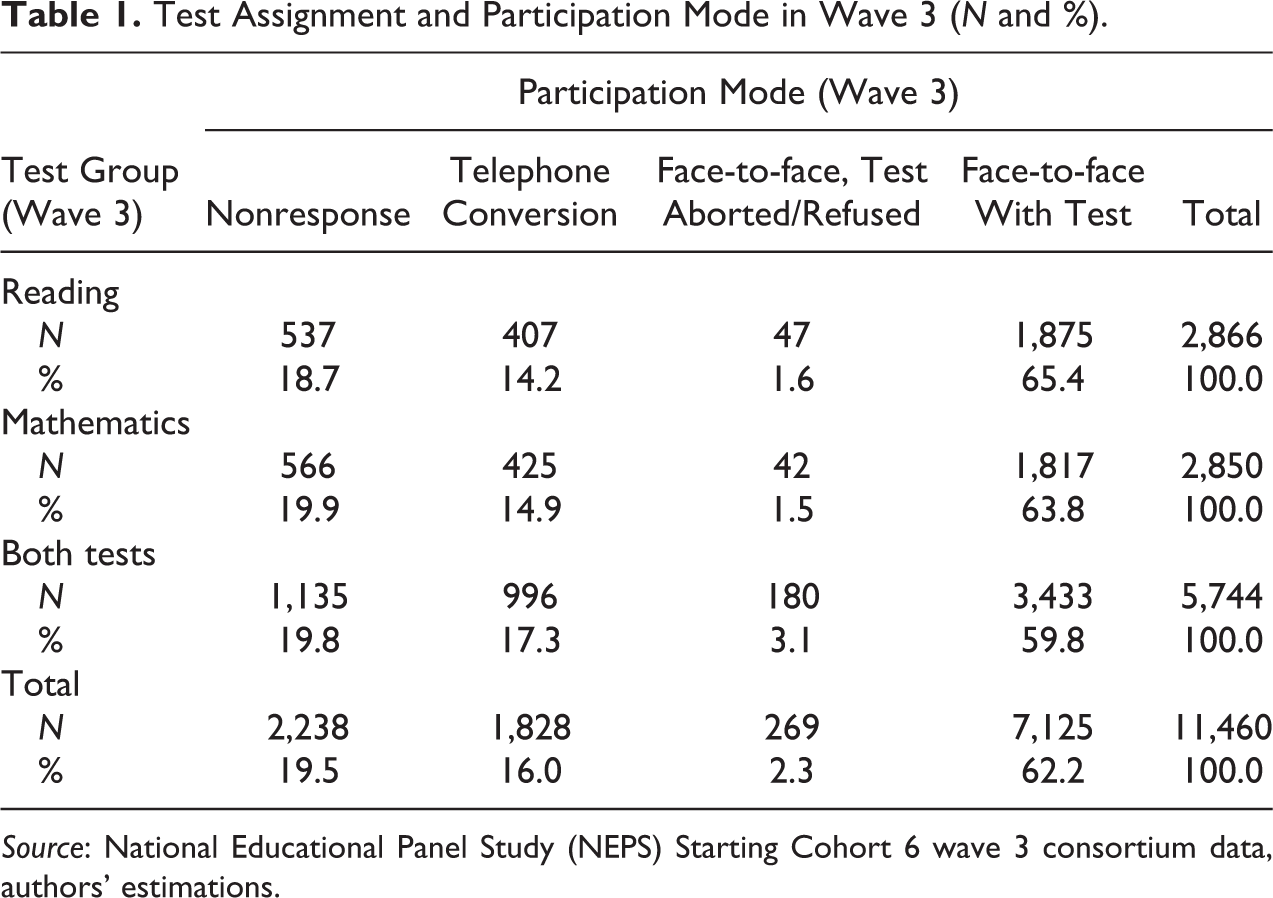
Source: National Educational Panel Study (NEPS) Starting Cohort 6 wave 3 consortium data, authors’ estimations.
These results are confirmed by the multinomial logistic regression model analyzing the effects of test assignment on response probability in wave 3 (Table 2). Results indicate the same avoidance pattern as the descriptive results: Those who were assigned the longer version (with two tests) are significantly less likely to participate in both the personal interview and the tests than respondents who were assigned one of the shorter test versions. At the same time, those who had been assigned two tests are more likely to either switch to a telephone interview or participate in the face-to-face interview without taking the test. However, we observe no significant effect of being assigned both tests on nonresponse. In general, these results confirm our first hypothesis—with the important constraint that as long as the study provides other possibilities for avoiding the tests, announced test duration appears to have no direct effect on nonresponse in the wave in which the tests are administered.
Effects of Test Assignment on Participation Mode in Wave 3.
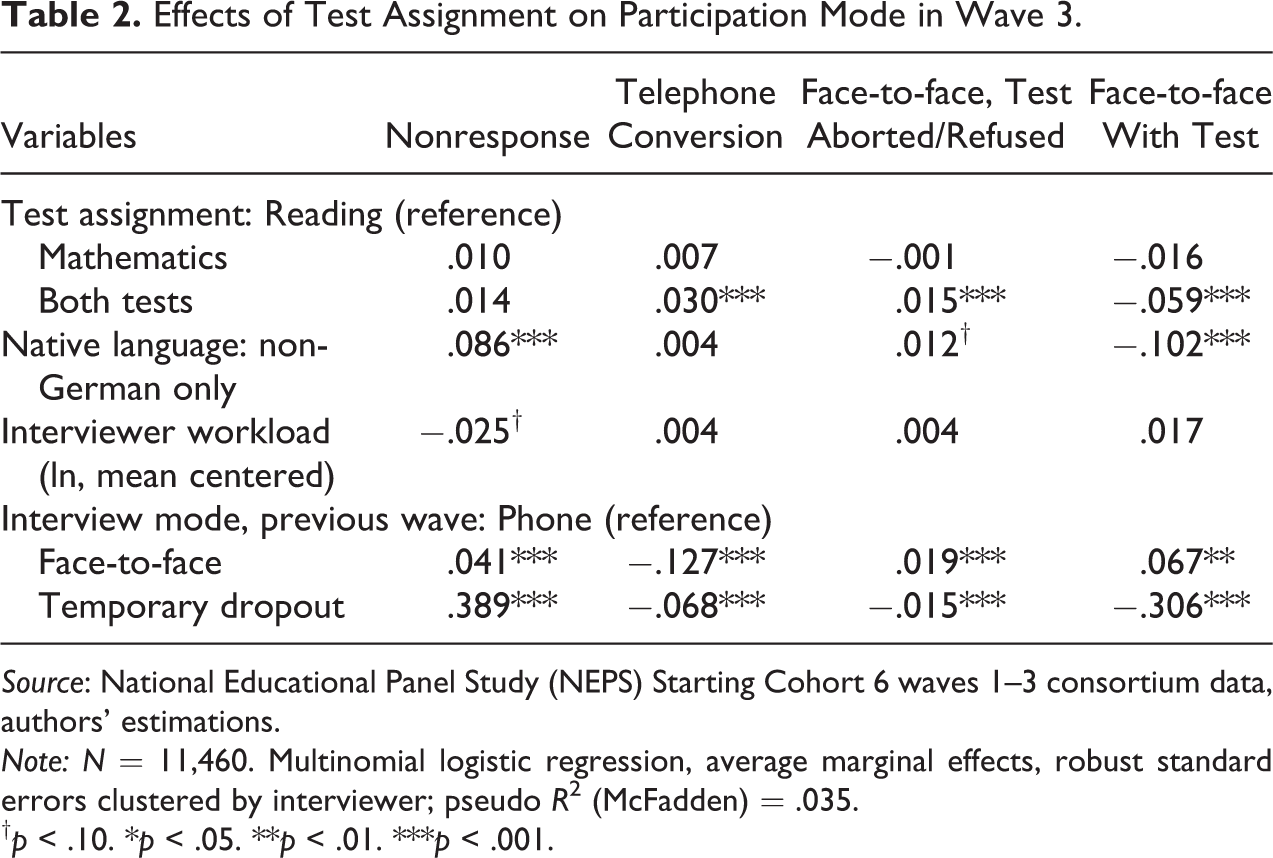
Source: National Educational Panel Study (NEPS) Starting Cohort 6 waves 1–3 consortium data, authors’ estimations.
Note: N = 11,460. Multinomial logistic regression, average marginal effects, robust standard errors clustered by interviewer; pseudo R 2 (McFadden) = .035.
† p < .10. *p < .05. **p < .01. ***p < .001.
Effects of Test Participation on Panel Attrition
In Hypothesis 2, we expected that participating in the two-test version, as opposed to taking only one test, increases the likelihood of refusing interview participation in the two subsequent panel waves as well as the likelihood of avoiding future tests. We tested this assumption using binary logistic regressions for panel wave 4 (Table 3) and multinomial logistic regressions in wave 5 (Table 4). In both tables, we distinguish between two models. Model 1 analyzes overall effects of test administration regardless of a possible mediation by participation mode in wave 3. Model 2 additionally controls for participation mode in wave 3 and, moreover, includes interaction effects between participation mode in wave 3 and test assignment. 11
Effects of Test Assignment and Response Mode in NEPS Wave 3 on Nonresponse in NEPS Wave 4.
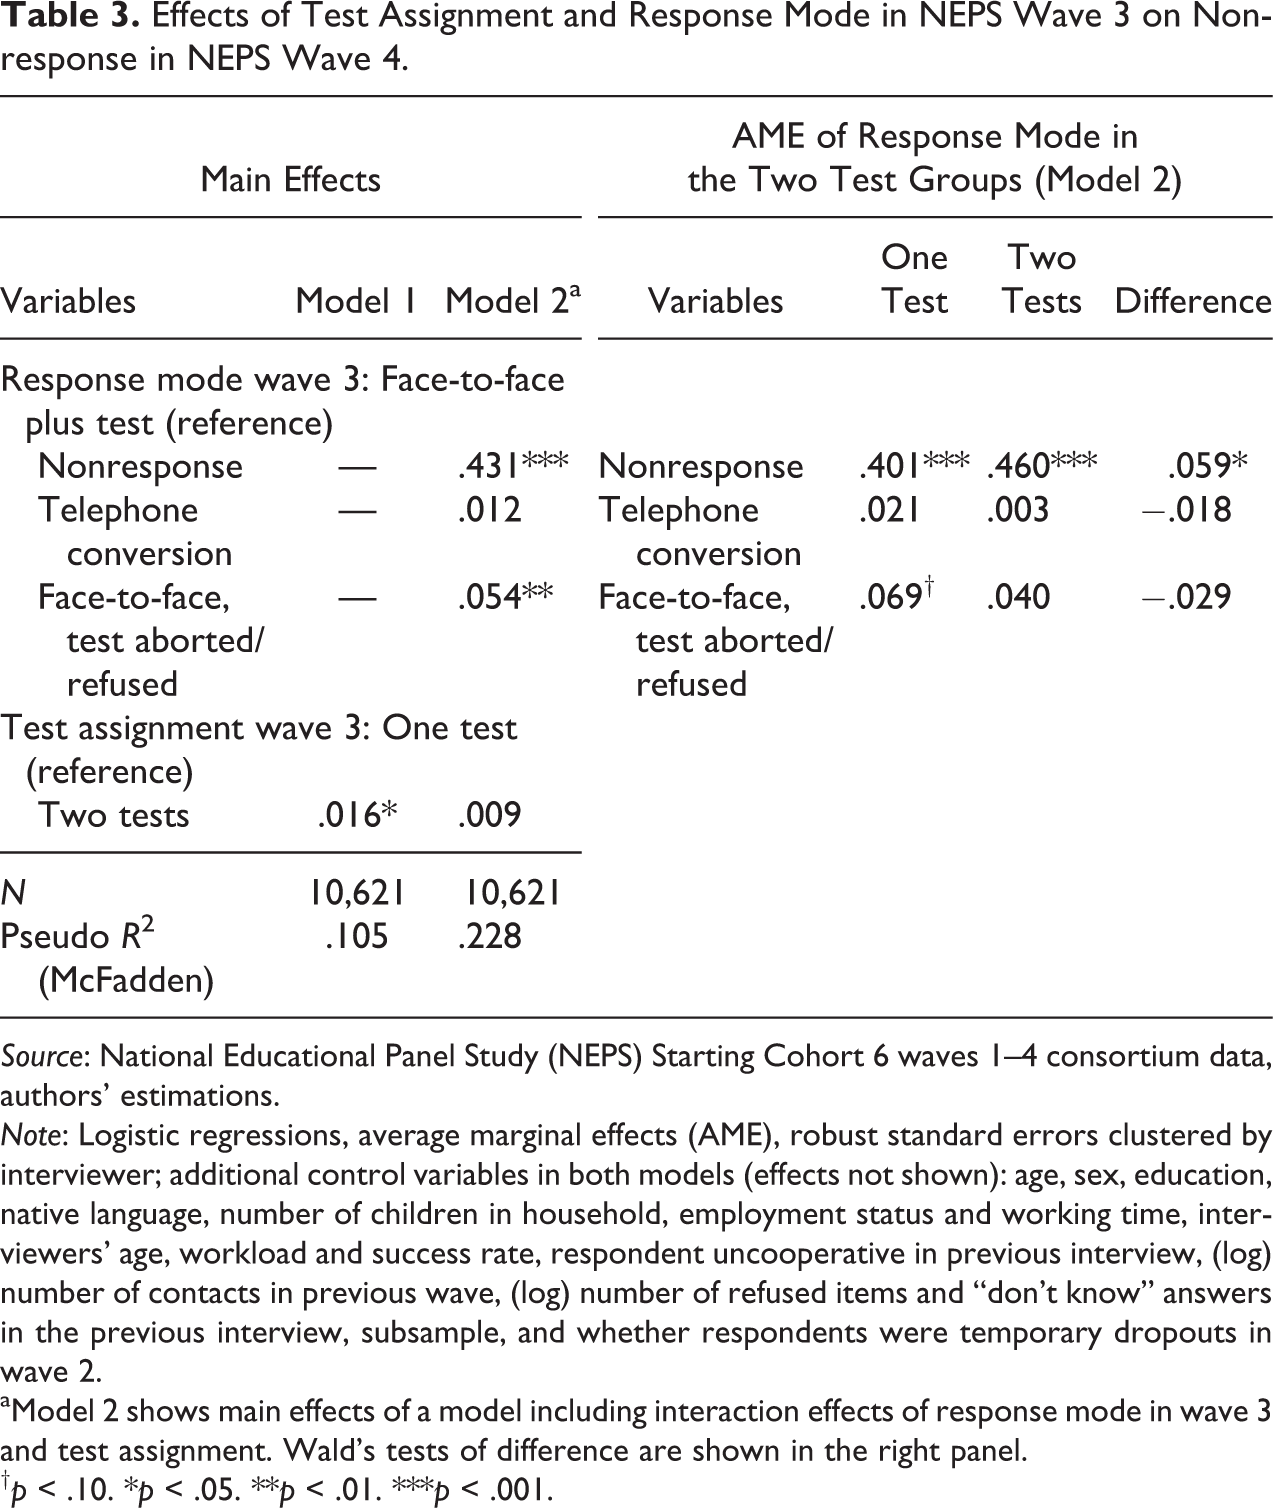
Source: National Educational Panel Study (NEPS) Starting Cohort 6 waves 1–4 consortium data, authors’ estimations.
Note: Logistic regressions, average marginal effects (AME), robust standard errors clustered by interviewer; additional control variables in both models (effects not shown): age, sex, education, native language, number of children in household, employment status and working time, interviewers’ age, workload and success rate, respondent uncooperative in previous interview, (log) number of contacts in previous wave, (log) number of refused items and “don’t know” answers in the previous interview, subsample, and whether respondents were temporary dropouts in wave 2.
aModel 2 shows main effects of a model including interaction effects of response mode in wave 3 and test assignment. Wald’s tests of difference are shown in the right panel.
† p < .10. *p < .05. **p < .01. ***p < .001.
Effect of Test Assignment and Response Mode in NEPS Wave 3 on Response Mode in NEPS Wave 5.
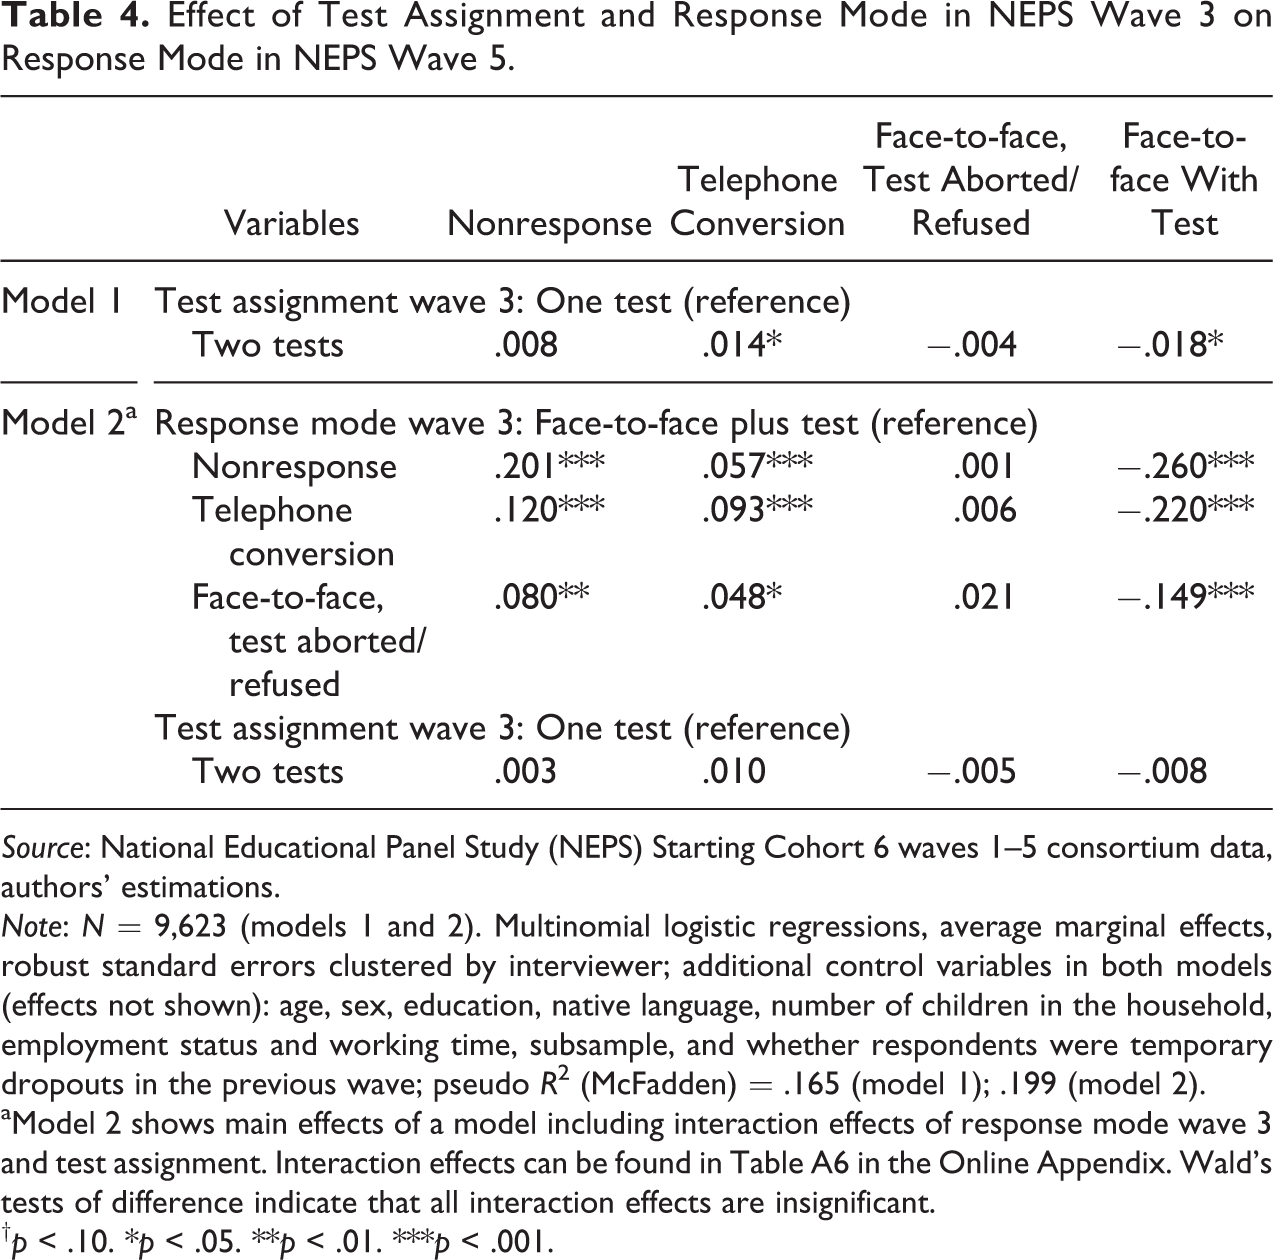
Source: National Educational Panel Study (NEPS) Starting Cohort 6 waves 1–5 consortium data, authors’ estimations.
Note: N = 9,623 (models 1 and 2). Multinomial logistic regressions, average marginal effects, robust standard errors clustered by interviewer; additional control variables in both models (effects not shown): age, sex, education, native language, number of children in the household, employment status and working time, subsample, and whether respondents were temporary dropouts in the previous wave; pseudo R 2 (McFadden) = .165 (model 1); .199 (model 2).
aModel 2 shows main effects of a model including interaction effects of response mode wave 3 and test assignment. Interaction effects can be found in Table A6 in the Online Appendix. Wald’s tests of difference indicate that all interaction effects are insignificant.
† p < .10. *p < .05. **p < .01. ***p < .001.
Results for wave 4 show that, overall, those who had been assigned to the two-test version in wave 3 are more likely to become nonrespondents in wave 4 (Table 3, model 1). While there is no such effect on nonresponse in wave 5, as model 1 in Table 4 shows, respondents who had been assigned two tests are more likely to again not participate in the test. Instead, they are more likely to opt for the telephone conversion. These results support Hypothesis 2.
However, when controlling for participation mode in wave 3 (model 2 in both tables), it becomes evident that the overall effects of test assignment are, in fact, completely mediated by respondents’ mode of participation in wave 3: Once mode of participation is controlled for, being asked to participate in the two-test version in wave 3 (in comparison to being asked to participate in the one-test version) has no significant effect on nonresponse in any of the two subsequent panel waves. What can be seen, though, is that—unsurprisingly—wave 3 nonrespondents are very likely to remain nonrespondents in the two subsequent panel waves as well. The results in Tables 3 and 4 also show that those who had aborted or refused the test (while participating in the face-to-face interview) in wave 3 have a significantly higher likelihood for nonresponse in waves 4 and 5. Moreover, in wave 5, nonrespondents and those who refused the tests are also more likely to choose the telephone conversion.
We observe a particular pattern for persons who had evaded the test by opting for a telephone interview in wave 3. For this group, no effects on nonresponse in wave 4 (in which no test was administered) can be observed. However, in wave 5, when the next round of competence testing was scheduled, persons who had been interviewed by phone in wave 3 were more likely to either choose this response mode again (thereby again evading the tests in wave 5) or to become nonrespondents.
Finally, our results show that these effects are homogeneous in the two test assignment groups, with one important exception: Wave 3 nonrespondents from the two-test group have a significantly higher likelihood to remain nonrespondents in wave 4 than those who were assigned to only one test. 12
Summing up, these results indicate the relation between the test version administered and nonresponse to be rather complex. In the test wave itself, there is no direct effect of being assigned to the two-test group on nonresponse, but the two-test group is more likely to avoid the tests—either directly or by opting for a telephone interview. In later waves, there is an overall effect of the test version administered in wave 3 on nonresponse, which, however, is completely mediated by the differences in response mode found in wave 3: Once these are controlled for, no direct effect of being assigned to the two-test group on nonresponse in waves 4 and 5 can be found. At the same time, persons who avoided the test in wave 3 are subsequently more prone to nonresponse and repeated test avoidance.
Effects of Test Results on Panel Attrition
In Hypothesis 3, we argue that not performing well on the tests should be associated with a higher likelihood to refuse interview participation in further waves of the study or to avoid further tests. Accordingly, we expect that a high test performance will have a positive influence on respondents’ continuing participation in the survey. Moreover, in Hypothesis 4, we expect this effect to be stronger if the test duration had been longer.
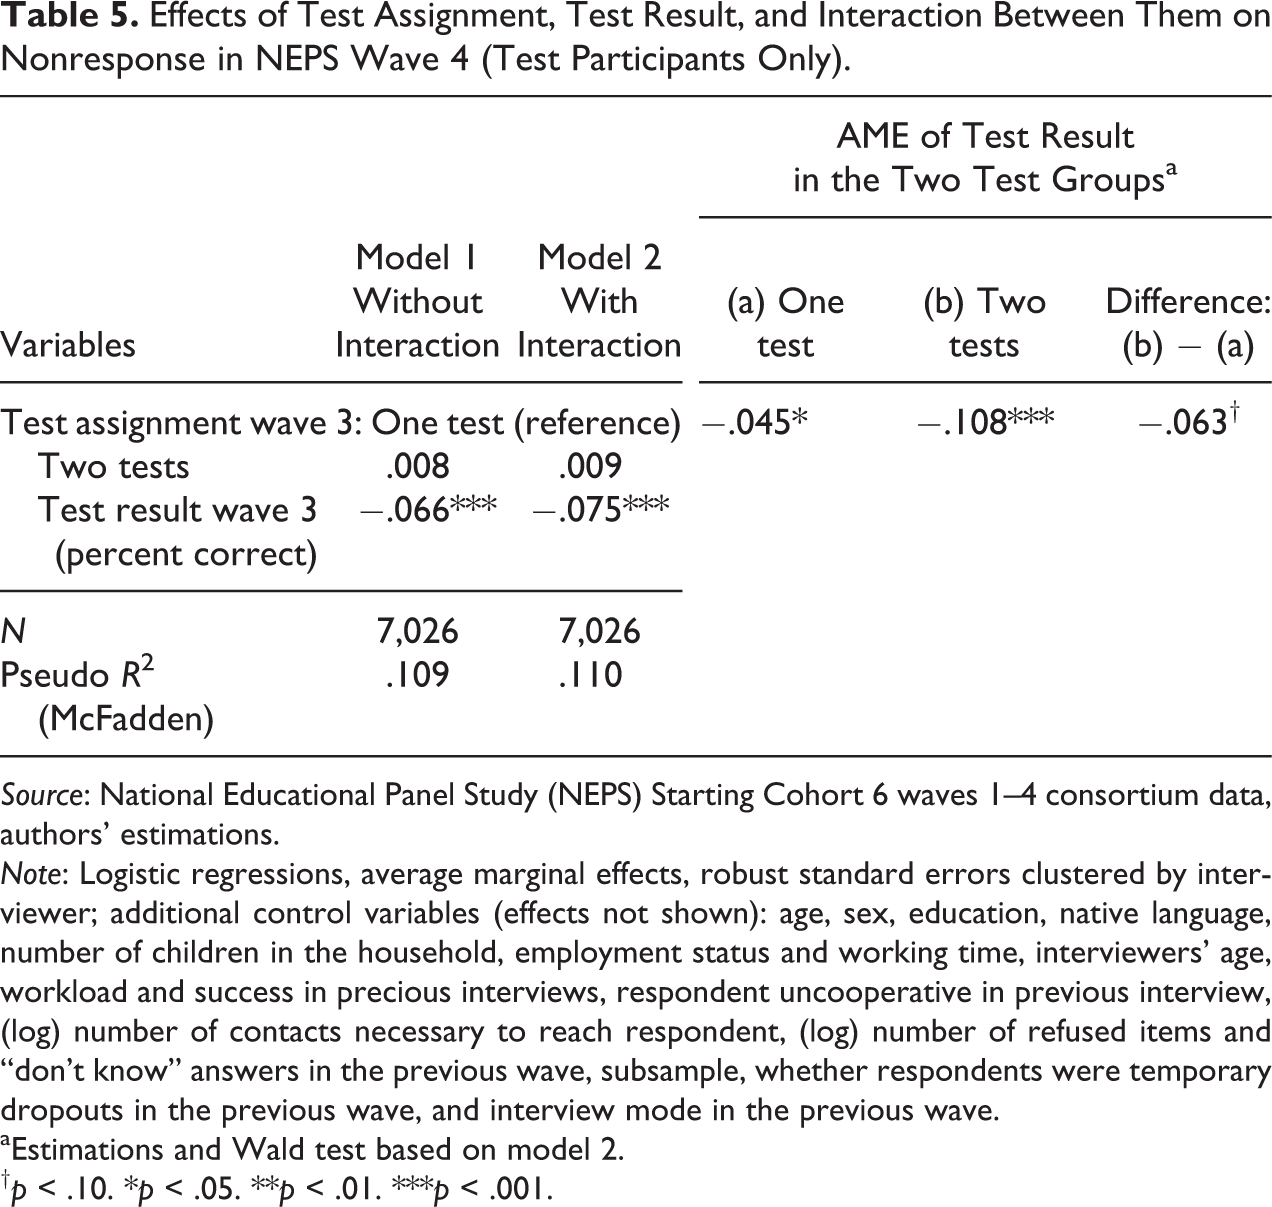
As Table 5 shows, results for wave 4 support Hypothesis 3 and to some degree also Hypothesis 4. Model 1 includes only the main effects of test assignment and test performance, whereas model 2 also includes an interaction effect between these two variables. Both models show that a good test result has a negative effect on nonresponse, meaning that respondents who solved more items in the competency tests in wave 3 are less likely to drop out of the survey in wave 4. This finding supports Hypothesis 3. The insignificant effect for the two-test group is consistent with results from Table 2, indicating that those who had been willing to take both tests in wave 3 are no less willing to participate in the following wave than are respondents from the one-test group.
Effects of Test Assignment, Test Result, and Interaction Between Them on Nonresponse in NEPS Wave 4 (Test Participants Only).
Source: National Educational Panel Study (NEPS) Starting Cohort 6 waves 1–4 consortium data, authors’ estimations.
Note: Logistic regressions, average marginal effects, robust standard errors clustered by interviewer; additional control variables (effects not shown): age, sex, education, native language, number of children in the household, employment status and working time, interviewers’ age, workload and success in precious interviews, respondent uncooperative in previous interview, (log) number of contacts necessary to reach respondent, (log) number of refused items and “don’t know” answers in the previous wave, subsample, whether respondents were temporary dropouts in the previous wave, and interview mode in the previous wave.
aEstimations and Wald test based on model 2.
† p < .10. *p < .05. **p < .01. ***p < .001.
To determine whether an interaction exists between the number of tests assigned and the test results, we used model 2 to estimate the average marginal effects of test results for both test assignment groups (see right side of Table 5). While we observe a comparatively small negative effect of test result for the group that took only one test, we find a much larger and highly significant negative effect on nonresponse for the two-test group. Using a Wald’s test, we show that the difference between the effects for the two different groups is statistically significant from zero, although only at the 10 percent level.
Figure 1 displays this effect, showing the probability of being a nonrespondent in wave 4 depending on respondents’ test results separately for the two assignment groups. The figure shows that the slopes for both groups are clearly different. Whereas the one-test group shows only a weak link between test result and the likelihood of becoming a nonrespondent, in the two-test group, the nonresponse probability strongly decreases for those with a better test performance. These results support Hypothesis 4 for wave 4.
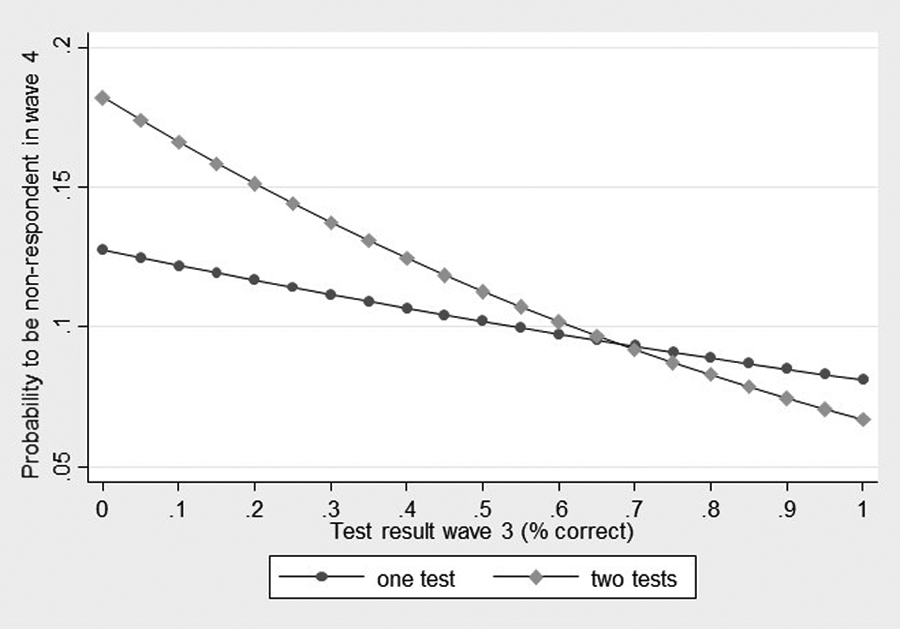
Probability of being a nonrespondent in wave 4 for the two-test assignment groups based on test results from wave 3 (predicted values based on Average Marginal Effects).
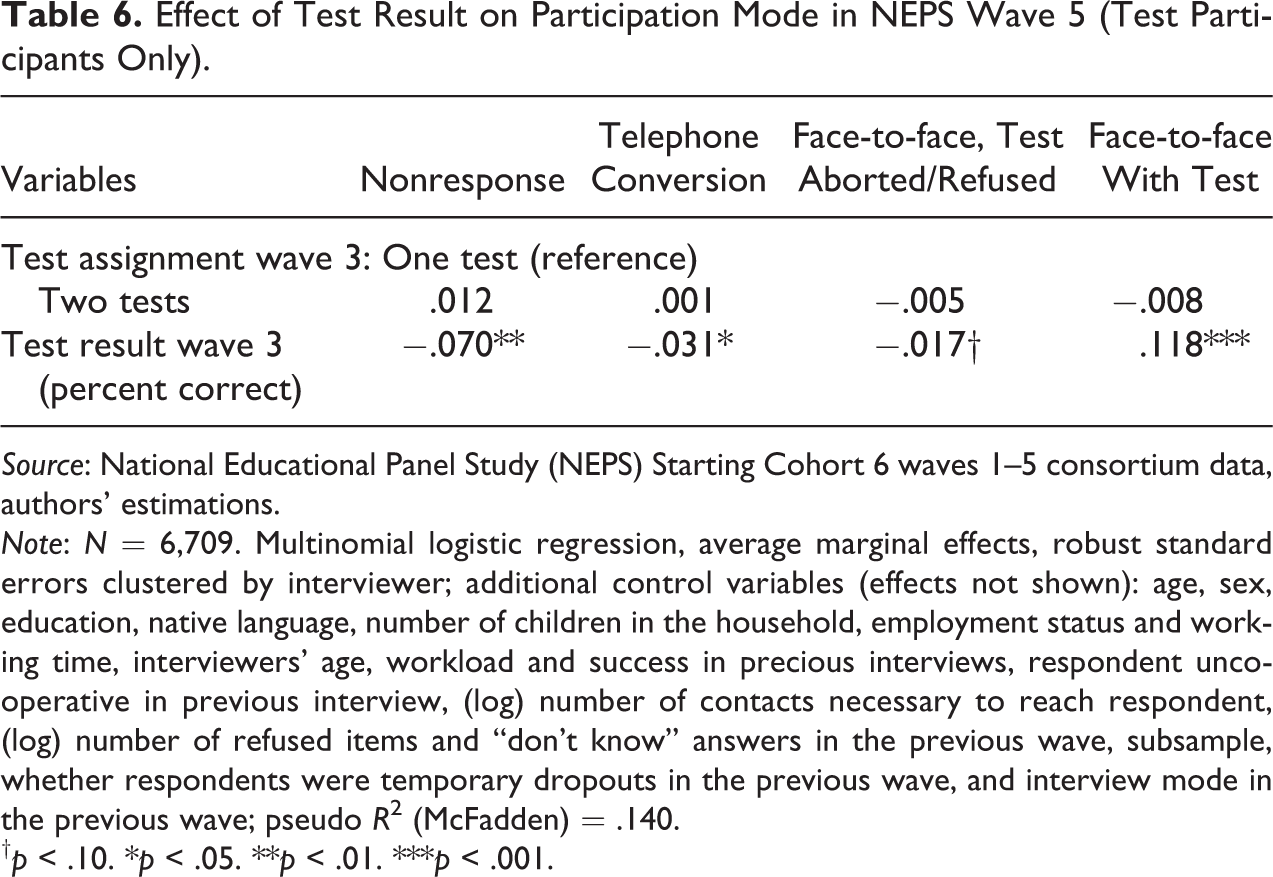
The situation is somewhat different in wave 5, the next wave in which competency tests were administered, albeit in different domains. Results displayed in Table 6 indicate that the influence of earlier test results remains significant in this wave. Those with better test results in wave 3 are more likely to participate in the wave 5 tests while they are at the same time less likely to refuse interview participation or avoid the test by switching to the telephone conversion. These results therefore support Hypothesis 3 for wave 5 as well.
Effect of Test Result on Participation Mode in NEPS Wave 5 (Test Participants Only).
Source: National Educational Panel Study (NEPS) Starting Cohort 6 waves 1–5 consortium data, authors’ estimations.
Note: N = 6,709. Multinomial logistic regression, average marginal effects, robust standard errors clustered by interviewer; additional control variables (effects not shown): age, sex, education, native language, number of children in the household, employment status and working time, interviewers’ age, workload and success in precious interviews, respondent uncooperative in previous interview, (log) number of contacts necessary to reach respondent, (log) number of refused items and “don’t know” answers in the previous wave, subsample, whether respondents were temporary dropouts in the previous wave, and interview mode in the previous wave; pseudo R 2 (McFadden) = .140.
† p < .10. *p < .05. **p < .01. ***p < .001.
As in the corresponding model for wave 4, we found no significant effect for having been assigned to the two-test group in wave 3 on wave 5 outcomes. However, in contrast to our results from wave 4, we could not identify a significant interaction effect between test results and test groups either. Therefore, we have to reject Hypothesis 4 for wave 5 (results available from the authors on request).
Conclusion
In NEPS Starting Cohort 6, repeated competency tests were conducted for the first time within a large-scale panel study of an adult population sample. As previous research had shown, both panel attrition and nonresponse bias increase with different aspects of respondent burden, in particular with increasing interview length and frustrating interview experiences. Both issues are relevant for testing respondents’ competencies because the tests used are lengthy, high in cognitive burden, and likely to generate frustration among those who are not performing well. To test the consequences of competency tests for panel attrition, we used an experimental split questionnaire design in the third panel wave, in which we assigned one test to one half and two tests to the other half of our respondents.
Our results show that long tests are harmful in terms of test realization rates but not necessarily in terms of nonresponse. At least if respondents are given the chance of not taking the tests without having to refuse to participate in the interview—as was the case in our experiment—long tests have no statistically relevant immediate negative effect on response rates. Nevertheless, those who originally avoided the test have a higher probability of dropping out of the study over subsequent panel waves. Therefore, in the long run, longer competency tests might negatively influence panel attrition.
A more serious problem is that less competent respondents are more likely to drop out of the study in subsequent waves and avoid future tests, thereby increasing selective nonresponse. This problem applies mainly to lower ability respondents, who as a group are already unwilling to participate in surveys, especially in those focusing on education. This process of the less competent respondents systematically dropping out of the study continues even two waves after the original test. Moreover, this selective attrition is more severe for those with a longer test duration, at least in the first wave after the test.
We conclude that in a panel study such as the NEPS, in which competency tests are repeatedly administered, there can be negative effects caused by long competency tests, and these effects appear to add up over time. In addition, the tests substantially increase selective nonresponse in one of the major dimensions of the survey’s interest—respondents’ competencies. Due to the discussed shortcomings of our experimental design, we cannot be certain that these negative effects are entirely related to the respondent burden that longer tests impose on respondents. Nevertheless, that this burden is at least an important part of their explanation is very likely.
The question arises as to how these problems can be handled, given that repeated testing is one of the most important and innovative features of the NEPS and should not be abandoned. We see three potential strategies, all of which may be combined for minimizing test-induced panel attrition and selective nonresponse.
First, one solution is to implement adaptive testing procedures (Frey and Seitz 2009; Pohl and Carstensen 2013), that is, computer-assisted tests that adapt to the participants’ competency levels based on what is known about them from their answers to previous questions. Adaptive testing can potentially reduce test-induced respondent burden in two ways: one, by minimizing the number of test items, thus reducing overall survey length, and two, by avoiding both frustration and boredom by selecting follow-up items at an appropriate level of difficulty for each respondent.
Second, our results suggest that both, the problem of test avoidance in the experimental wave and selective nonresponse resulting from low test performance in the subsequent wave, are stronger when longer tests are assigned. Thus, shortening test duration might be an option for reducing the negative effects of test administration on response behavior. At least until tests with adaptable difficulty are available, administering only one half-hour test could be preferable to two tests, which total an hour of testing.
Third, targeting respondents with lower skill levels—that is, those at a higher risk of dropping out of the study—with higher or specific incentives. As incentives have proved to be a proper means of increasing response rates, if one can target them at potential nonrespondents, they might help reduce nonresponse bias (Singer and Ye 2013). Yet, panel surveys usually avoid paying differential incentives, and we know little about their long-term effects (Laurie and Lynn 2009).
Nevertheless, some indication exists that paying higher incentives to less competent respondents might indeed be a good means of avoiding skill bias in a longitudinal survey (Freese and Branigan 2012). Moreover, other NEPS-based analyses have shown that paying incentives unconditionally (i.e., not only to survey participants) appears to be particularly effective for lower educated sample members. Kretschmer and Müller’s (2017) results show a considerable and significant positive effect for respondents who had been refusing to take or avoiding the tests—a group that our analyses have shown to be particularly important for reducing selective nonresponse. Thus, given current knowledge, we consider paying targeted, unconditional incentives a promising strategy, particularly when new samples of the NEPS survey are drawn. Given the lack of studies testing the effects of such a targeting strategy, investigating its effects should be a promising research topic for evaluation in future NEPS experiments.
Supplemental Material
supplemental_material - Experimental Evidence on Immediate and Long-term Consequences of Test-induced Respondent Burden for Panel Attrition
supplemental_material for Experimental Evidence on Immediate and Long-term Consequences of Test-induced Respondent Burden for Panel Attrition by Corinna Kleinert, Bernhard Christoph and Michael Ruland in Sociological Methods & Research
Footnotes
Acknowledgments
We would like to thank our colleagues at LIfBi, the IAB, and infas for their helpful comments and support. In particular, we would like to thank our former colleague Stephanie Eckman for her valuable and very detailed comments on an earlier version of the paper. We are also grateful for comments we received at several conferences, most notably at the 6th Conference of the European Survey Research Association (ESRA) and the 7th Workshop of Panel Surveys in Germany. Finally, we are indebted to the two anonymous reviewers, whose comments were very helpful and aided us to improve the article.
Declaration of Conflicting Interests
The author(s) declared no potential conflicts of interest with respect to the research, authorship, and/or publication of this article.
Funding
The author(s) disclosed receipt of the following financial support for the research, authorship, and/or publication of this article: Open access publication of this article was supported by the Institute for Employment Research (IAB).
Supplemental Material
Supplemental material for this article is available online.
Notes
References
Supplementary Material
Please find the following supplemental material available below.
For Open Access articles published under a Creative Commons License, all supplemental material carries the same license as the article it is associated with.
For non-Open Access articles published, all supplemental material carries a non-exclusive license, and permission requests for re-use of supplemental material or any part of supplemental material shall be sent directly to the copyright owner as specified in the copyright notice associated with the article.