
Abstract
Sharp inequality in India’s urban economy, coupled with an increasing reliance on the market system for infrastructure and basic services, has led to inadequate access to and poor quality of amenities for the urban poor. Disparities in welfarist interventions by central and state governments, manifest in changing administrative paradigm, have impacted inequality trends and patterns. Given this macro scenario, this article is designed to achieve two objectives: one, an analysis of the differential access of urban poor to select basic amenities and changes therein over time at the national level. An attempt is also made to bring out the deficits in amenities for households in different asset quintiles within the framework of India’s inclusive development strategy. Two, to analyse the pattern of access to basic services across the states, their changing pattern over time, and probe into their interdependencies with indicators of environmental sustainability. The basic idea is to examine quantitatively the complex relationship between the utilisation of natural resources, environmental degradation, and the provisioning of basic amenities to the poor. The possibility of the poor being forced to use non-renewable resources, posing serious threats to their micro-environment and its long-term implications are discussed using available secondary data and over-viewing empirical research on the subject. The article concludes by proposing broad directions in which solutions to the twin problems of providing a decent living environment to the poor and ensuring ecological sustainability can be sought.
Introduction
There exists an extensive body of global and national literature, conceptualising the impact of climate change on cities across diverse geographical and climatic settings, as well as in nations at varying stages of economic development. Happily, a few among these have focussed on the impact on the poor residing in vulnerable areas, engaged in precarious economic activities, and facing health and lifestyle challenges due to limited financial means. Notable examples include the United Nations Framework Convention on Climate Change conference (African Development Bank et al., 2002) study titled ‘Poverty and Climate Change: Reducing Vulnerability of the Poor Through Adaptation’ and the research by the International Institute for Environment and Development (2009) titled ‘Climate Change and the Urban Poor: Risk and Resilience in 15 of the World’s Most Vulnerable Cities’, that underscore the importance of not only eradicating poverty but also bolstering the adaptive capacities of the poor. The resilience of the cities is sought to be achieved through the provisioning of basic services to the poor to address the exigencies of climate change, as urban poverty in many developing nations is a consequence of the nature of development itself, and, consequently, its complete elimination is impossible in the short and medium term.
Despite a significant reduction in the share of people living globally in extreme poverty, from 36 per cent in 1990 to 10 per cent in 2015, signifying the upliftment of over a billion people, a substantial 736 million individuals continue to endure extreme poverty on less than $1.9 per day (World Bank, 2018). Furthermore, a recent report from the United Nations Development Programme (UNDP) and Oxford Poverty and Human Development Initiative (OPHI) indicates that 1.2 billion people, or 19.1 per cent of the global population, grapple with multidimensional poverty (UNDP & OPHI, 2022). Although remarkable economic growth in South Asian countries has succeeded in lifting many out of poverty, progress remains uneven and largely constrained to specific regions. It is well-documented that over 80 per cent of the world’s poor people, whether measured monetarily or through multidimensional indicators, are concentrated in South Asian and sub-Saharan African countries. The challenges posed by climate change have compounded the struggle against poverty in these regions.
Comprehensive eradication of poverty in all its manifestations, thus, remains a daunting task and was the rationale for placing this at the top among the Sustainable Development Goals (SDGs). This stipulates the elimination of poverty in all its forms by 2030, envisaging a support system for the most vulnerable segments of the population, enhancement of resources for provisioning of essential services for them, and assistance to communities affected by climate-related disasters. Notably, the process of global urbanisation has shifted, with 90 per cent of the increase in urban population occurring in South Asian and sub-Saharan countries (UNDESA, 2019). The significant concentration of this urban population in large cities gives rise to multifaceted challenges, one of which is the degradation of environmental quality.
The other point emerging from the overview of the relevant literature in India is that, while these are extremely elegant and rich in terms of their conceptual and theoretical framework, the conclusions are not always based on exhaustive and rigorous data analysis. It is only recently that access to basic amenities for the poor has been analysed in India, in some depth, but here too, the aspects of environmental degradation at the micro and macro levels are missing (Kundu et al., 1999; Ravi, 2023). An attempt, therefore, is made to investigate the hypothesis that urban poverty is linked to environmental stress, particularly in the context of the apprehension that the absence of access to municipal services among the poor leads to their high use of non-renewable resources.
This article employs secondary data to construct a set of indicators that capture accessibility to basic amenities, the dynamics of urbanisation, urban poverty, and various socio-economic and environmental factors. We draw data from diverse sources, including the Census (conducted in 2001 & 2011), that provide a wide array of indicators, including the geographical distribution of slums. Additionally, the National Sample Survey (NSS), collected data in its 69th and 76th rounds in 2012 and 2018 respectively, offering insights into socio-economic conditions at the household level, categorised by their socio-economic characteristics, such as expenditure classes, socio-religious identities, and so on. Furthermore, we tap into the wealth of data available from the National Family Health Survey (NFHS), encompassing three distinct rounds conducted in 2005–2006 (NFHS III), 2015–2016 (NFHS IV), and 2019–2021 (NFHS V). This comprehensive dataset provides valuable insights into the accessibility of basic amenities across states and wealth quintiles. Examining data from these three NFHS rounds enables us to discern emerging trends and temporal shifts, shedding light on the dynamic nature of access to basic services across diverse socio-economic strata. Additionally, we have built environmental indicators pertaining to air quality and municipal waste management, obtained from various ministries of central government.
Given the macro perspective presented above, the article analyses trends and patterns related to access to four essential urban amenities: drinking water, sanitation, electricity, and cooking fuel. The second section, following the present introductory section, analyses the trends in overall coverage at the national level during the first two decades of the present century, drawing from data in the population census for 2001–2011, NSS for 2012–2018, and NFHS for 2006–2021, as noted above. The next section brings out the disparities in service availability across different size-class distributions of urban centres. The fourth section analyses the inequities in access and improvements therein at various time points, focusing on the bottom 20 per cent of households in terms of wealth quintiles. The following section analyses the state-level scenario, trying to assess if over time the less developed states have been able to bridge their deficits, setting up a trend towards convergence. In the sixth section, we examine the interdependencies among indicators of urbanisation, access to basic amenities, and environmental quality at the state level. Finally, in conclusion, we present policy perspectives to enhance access to basic services for urban poor, particularly the socio-economically vulnerable population, with a focus on achieving sustainability in urban development.
Macro Overview in Provisioning of Basic Amenities in Urban Areas
An attempt has been made to assess the changes in household coverage of basic amenities, both for rural and urban areas, using data from the Census, NSS, and NFHS, as mentioned above. Unfortunately, data from the population census is not available for recent years. Information on civic facilities is available from the NSS at different points of time, and we have chosen to use data on amenities from the two most recent rounds conducted in 2012 and 2018 for an assessment of the trends and for consistency checks at the national level. For an in-depth examination of the access of the bottom 20 per cent of households (in terms of asset categories) to basic amenities in a comparative framework, we have used NFHS. This allows us to compare growth performance between 2006–2016 and 2016–2021, under different political regimes. Due to comparability issues between the three data sets, trends and patterns observed from each data source have been discussed separately without combining the data in statistical analysis.
For the purpose of comparison across all three data sources, however, a uniform definition has been maintained, as far as possible, for the selected amenities: drinking water, sanitation, electricity, and cooking fuel. In the context of drinking water, the identified indicator is the percentage of households having ‘improved drinking water sources’. Both the Census of 2001 and 2011, consider tap, hand pump, and tube wells as improved sources of drinking water. In the NSS 69th round conducted in 2012, bottled water, piped water into dwelling or yard/plot, public tap/standpipe, tube well/borehole, protected well, protected spring, and rainwater collection are considered as improved sources of drinking water. In the NSS 76th round conducted in 2018, the definition is further broadened by adding piped water from a neighbour, public, and private tanker truck, as improved sources. For the NFHS V, conducted in 2019–2021, sources such as piped water into dwelling/yard/plot, piped to a neighbour, public tap/standpipe, tube well or borehole, protected dug well, protected spring, rainwater, tanker truck, cart with a small tank, bottled water, and community RO plant are identified as improved sources. The NFHS V criteria have been applied retroactively to 2015–2016 and 2005–2006 to determine improved sources of drinking water. Although it is not possible to have exactly the same coverage when building the indicators from the Census or NSS data, one must mention that the new sources that have been included in the later years did not exist or their contribution was marginal in earlier years. Consequently, it should be possible to consider the trend emerging from different data sets as broadly comparable for improved drinking water. Regarding the other three amenities––sanitation (household having access to a toilet), electricity (household having an electricity connection), and cooking fuel (household using LPG/natural gas as a cooking fuel) too––the definitions are the same across all three sources and time points.
Improved Drinking Water
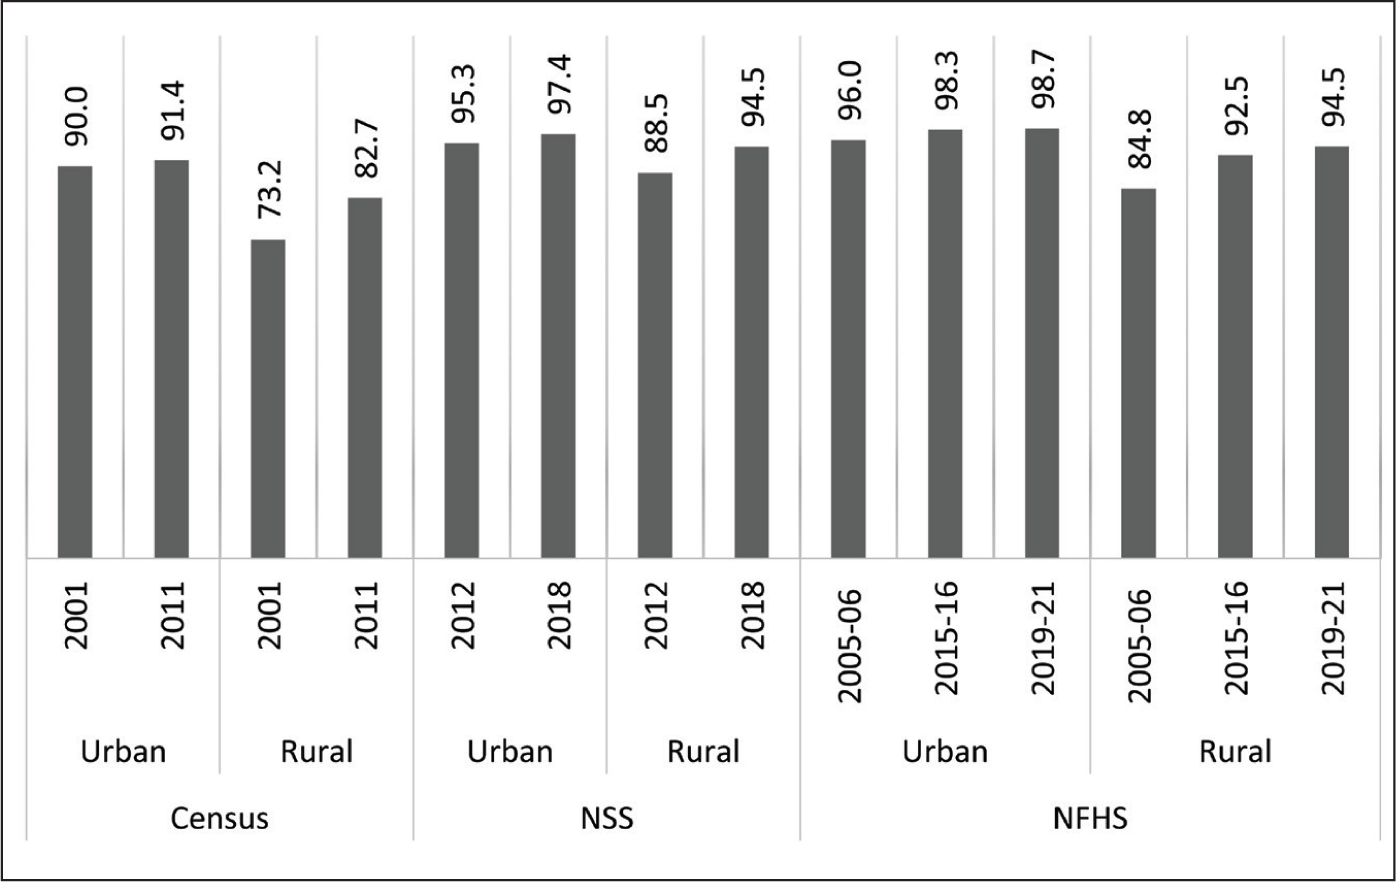
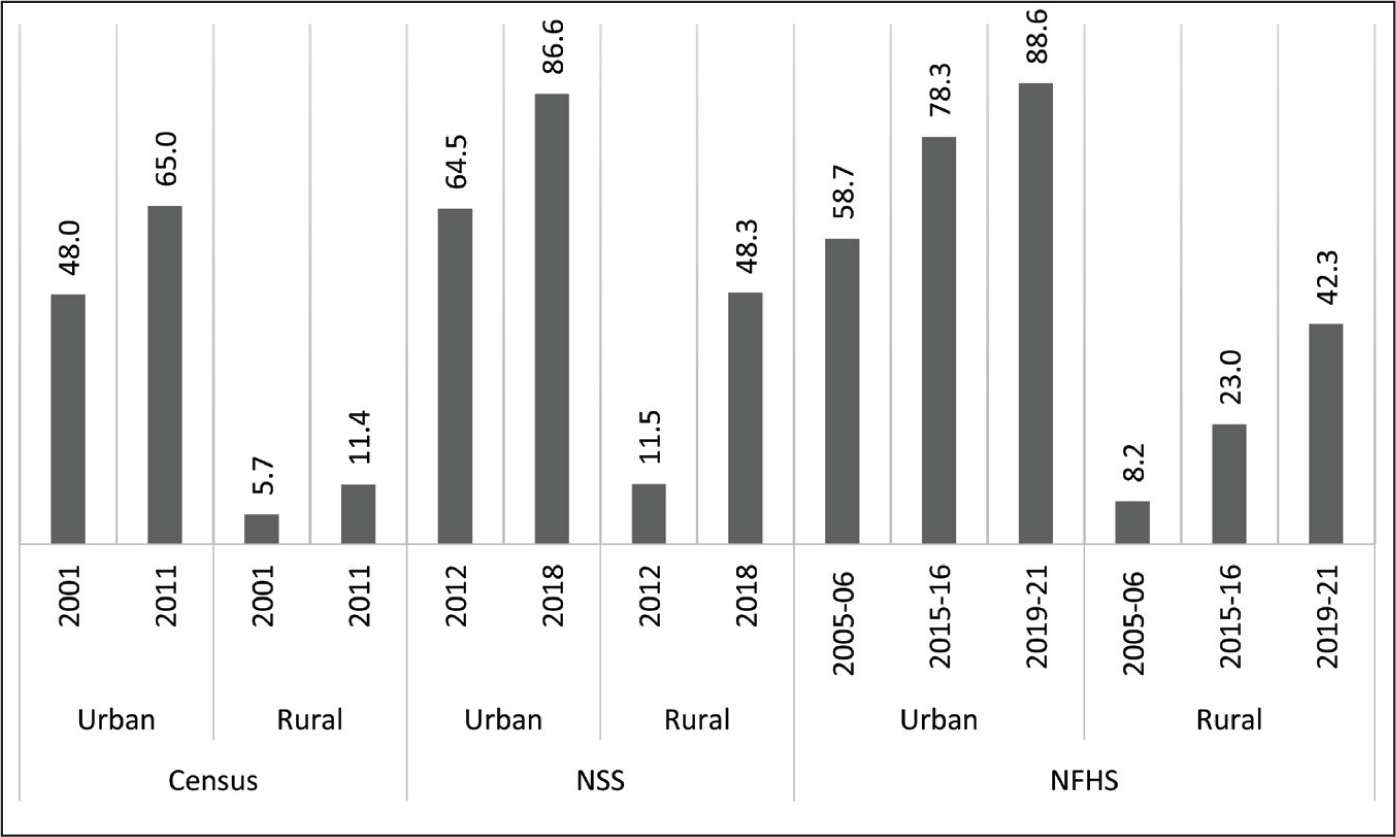
The data from Census, NSS, and NFHS surveys highlight a notable increase in the coverage of households with access to improved drinking water sources, both in rural and urban areas. Urban areas have seen a marginal rise in access. In 2001, 90.0 per cent of urban households had access to improved drinking water, a figure which has increased to 91.4 per cent by 2011. Considering the data from NSS, one can argue that the coverage has continued to rise, reaching 95.3 per cent in 2012 and 97.4 per cent in 2018. The NFHS data also supports this trend, with coverage increasing from 96.0 per cent in 2005–2006 to 98.3 per cent in 2015–2016, and then to 98.7 per cent in 2019–2021 ( Figure 1 ). These figures indicate that virtually all urban households now have access to improved drinking water. However, it is worth noting that the annual rate of change in percentage figures in the second period (2016–2021) is relatively low at 0.07 compared to 0.23 during 2006–2016 ( Table 1 ). This may be attributed, in part, to short-term or seasonal factors and, more importantly, the inherent challenge in enhancing coverage when the uncovered population is low. One must, however, recall that during the first decade of the present century, a large number of rural settlements were classified as new census towns. These towns are mostly deficient in basic services. Their lack of statutory status and slum-like conditions prevailing there would depress the rate of improvement. This would partially explain why the annual rate of coverage was higher during 2006–2016 compared to the latter period.
One positive aspect is that rural–urban inequality in access to improved drinking water is not very high and has diminished over the years. In 2001, the rural–urban difference was 16.8 percentage points, which has been reduced to 4.2 percentage points in 2019–2021 ( Figure 1 ). Furthermore, it is worth highlighting that the annual rate of change in rural areas surpasses that of urban areas during both time periods. This is a positive development, signifying that people in rural areas are coming closer to the level of access enjoyed by their urban counterparts.
Source: Census of India 2001 and 2011; NSS 2012 and 2018; NFHS 2005–2006, 2015–2016 and 2019–2021.
Annual Rate of Change in Access to Basic Amenities in India (2001–2021).
Source: Census of India 2001 and 2011; NSS 2012 and 2018; NFHS 2005–2006, 2015–2016 and 2019–2021.
Toilet Facilities
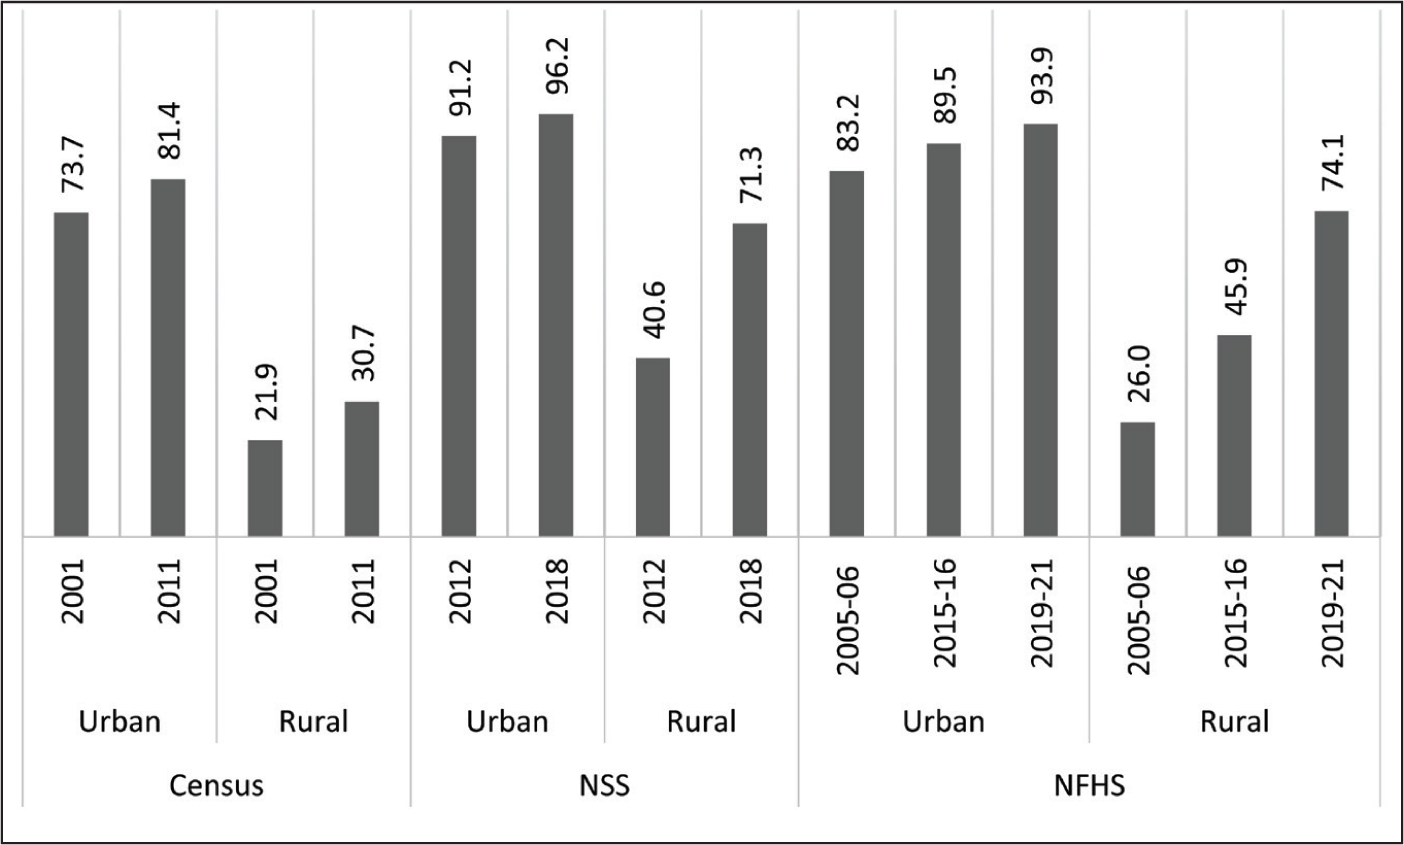
Access to toilet facilities in both urban and rural areas has made substantial strides over the past two decades, with a particularly pronounced acceleration during the recent period from 2015–2016 to 2019–2021. In 2001, merely 21.9 per cent of households had access to toilet facilities in rural areas, as per the population census, with the figure going up to 30.7 per cent in 2011. Going by the NFHS, it further increased to 45.9 per cent in 2015–2016 and reached at 74.1 per cent in 2019–2021 ( Figure 2 ). In urban areas, the coverage was already relatively high, starting at 73.7 per cent in 2001 and rising to 93.9 per cent in 2019–2021. The gap in access to toilet facilities between rural and urban areas has significantly diminished over the years, with a notable reduction during the second period. In 2005–2006, the initial gap stood at 57.2 percentage points, but by 2019–2021, it had been whittled down to approximately 19.8 percentage points, indicating substantial progress toward achieving greater equity in access. Furthermore, there has been a remarkable acceleration in the annual rate of change in toilet coverage, particularly during 2016–2021, when compared to the earlier period from 2006 to 2016. Rural areas witnessed an annual increase of 1.94 points in the first period going up to 6.27 points in the second period. The two figures are 0.63 and 0.98, respectively, in urban areas ( Table 1 ). What is noteworthy is that in all time periods, the annual rate of increase in coverage in rural areas is higher than in urban areas, based on all data sources, resulting in a reduction in rural–urban divide, as was the case with improved drinking water. Undoubtedly, much of the credit for the significant hike in growth during the second period in both rural and urban areas must be given to the Swachh Bharat Mission, which was launched in 2014.
Source: Census of India 2001 and 2011; NSS 2012 and 2018; NFHS 2005–2006, 2015–2016 and 2019–2021.
Electricity
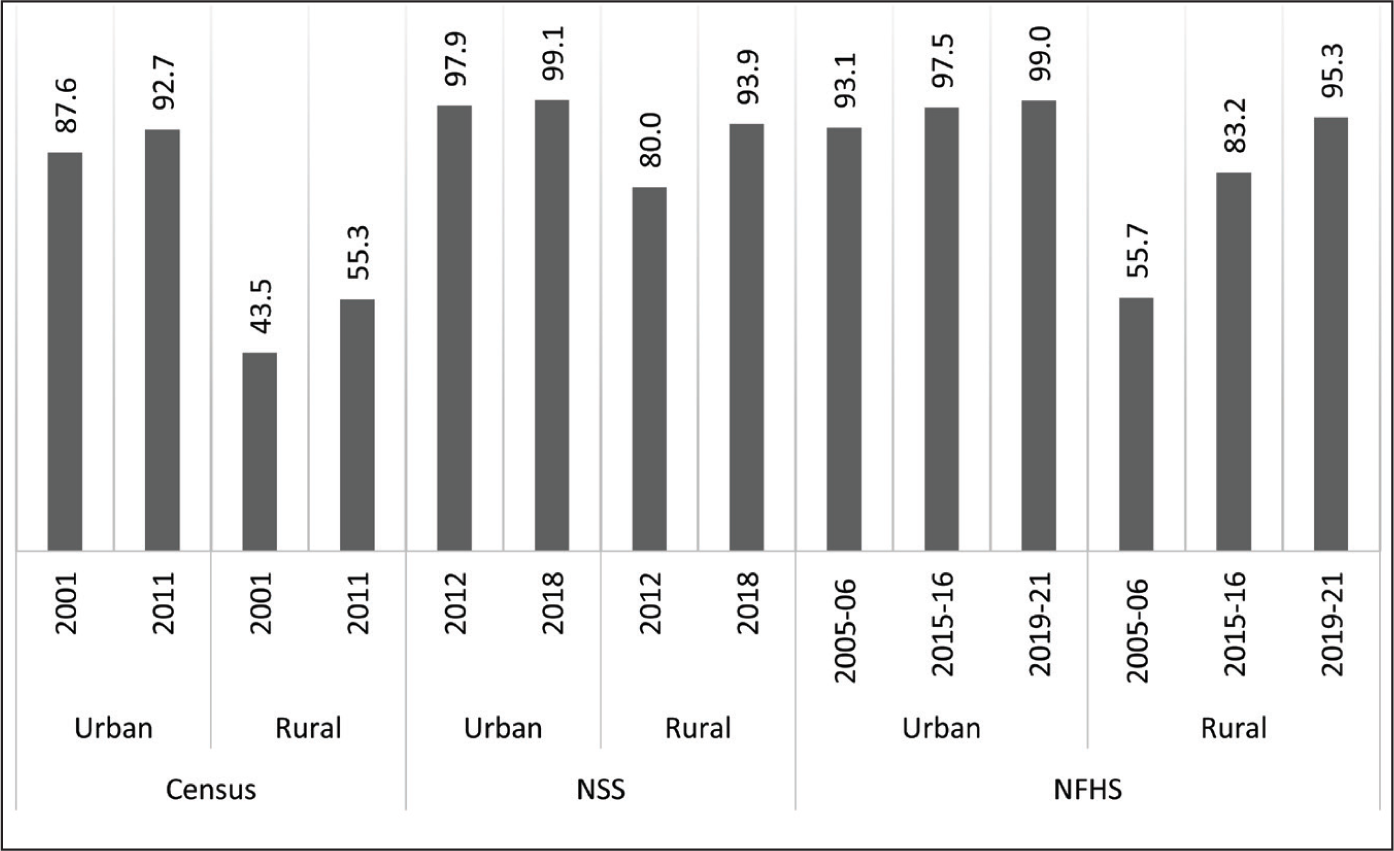
In 2019–2021, virtually all urban households had electricity connection, with 99.0 per cent coverage, while rural areas had reached the coverage of 95.3 per cent. This indicates a dramatic development since 2001 when there was a notable gap in electricity access between urban and rural areas. In urban areas, 87.6 per cent of households had electricity connections, which was more than double the coverage of rural areas at 43.5 per cent ( Figure 3 ). Notably, there was an acceleration in electricity coverage during 2016–2021, with rural areas experiencing rates eight times higher than those in urban areas. This remarkable progress has significantly narrowed the rural–urban gap over the past two decades. As a result, the rural–urban divide has almost disappeared in 2019–2021. The rural coverage has now reached 95.3 per cent which is only 3.7 per cent less than the urban coverage in 2019–2021.
Source: Census of India 2001 and 2011; NSS 2012 and 2018; NFHS 2005–2006, 2015–2016 and 2019–2021.
LPG
The usage of LPG has improved remarkably, with a substantial increase in both urban and rural areas. In urban areas, the proportion of households with access to LPG has gone up from 44.0 per cent in 2001 to an impressive figure of 88.6 per cent in 2019–2021 ( Figure 4 ), reflecting an annual increment of about 2 per cent throughout the two decades under consideration ( Table 1 ). Rural areas, on the other hand, have demonstrated even higher progress with the 5.7 per cent figure of 2001 skyrocketing seven-fold to reach 42.3 per cent in 2019–2021. While the initial annual rate of change in rural areas during 2006–2016, as per NFHS data, was low at 1.48, it accelerated to 4.29 during 2016–2021. These are much higher than those in urban areas, the figures being 1.95 and 2.29. One can argue that with dramatic progress in LPG coverage in both rural and urban areas over the past two decades, the relative disparity between rural and urban LPG access has declined, even though the absolute gap remains very high and has only marginally reduced from 50.5 in 2005–2006 to 46.3 in 2019–2021.
Source: Census of India 2001 and 2011; NSS 2012 and 2018; NFHS 2005–2006, 2015–2016 and 2019–2021.
It is a matter of some satisfaction that the annual rate of change is higher in rural areas compared to urban areas for all the amenities. This has resulted in narrowing the rural–urban gap, signifying a trend towards convergence and inclusivity. However, while comparing the progress of coverage for these four amenities in urban areas between the second and first periods, a mixed picture emerges. In the first period, the annual improvements were higher in the case of improved drinking water and electricity. However, the situation is reversed when we consider coverage in toilet facilities and LPG use. The latter can largely be attributed to focussed government-initiated missions such as Swachh Bharat and Ujjwala in the second period.
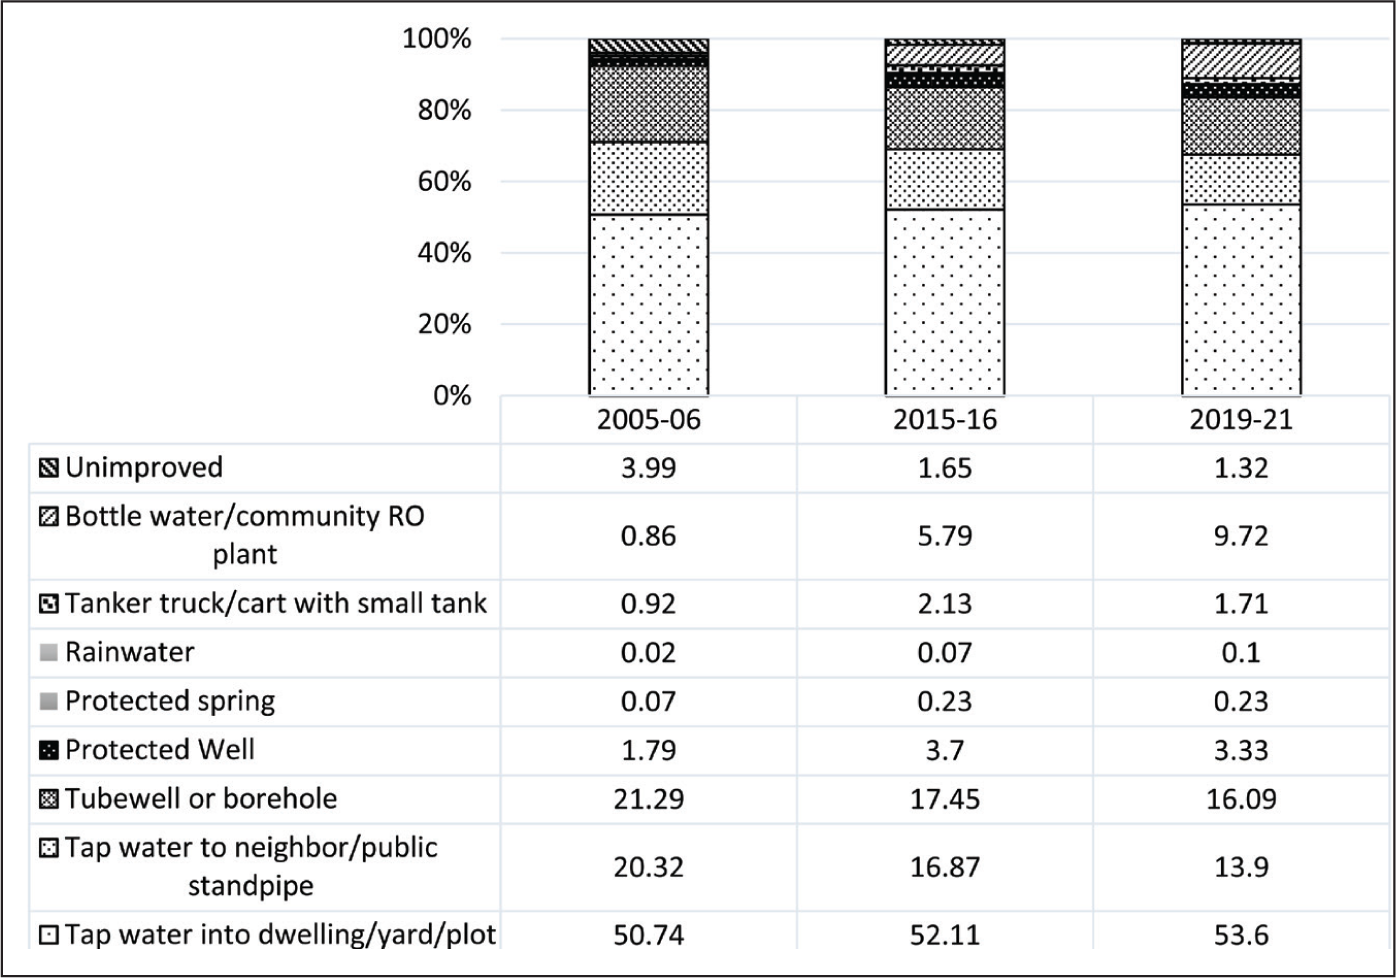
It is important to highlight one important fact regarding the coverage of households through improved drinking water in urban areas. Over the past decade and a half, there has been an increase in the share of households with tap water within their homes or on their premises ( Figure 5 ). This signifies an improvement in access and water quality, primarily benefiting the upper and middle classes. A similar trend is observed in the growing usage of bottled and RO water, which, in general, is less affordable for the poor. For the poor, relying on these sources implies a considerable out-of-pocket expenditure. Even more concerning is the decline in access to water from neighbourhood and community taps, dropping from 20.3 per cent in 2005–2006 to 13.9 per cent in 2019–2021. This has serious implications for the urban poor. It would be erroneous to assume that most of these people have shifted to piped water or can afford RO water. The decrease in the coverage of tube wells and borewells can be attributed to the inclusion of numerous new census towns, where people are heavily dependent on these, and their coverage has not increased significantly. The lower figure implies less water availability in urban peripheries and emerging new towns with a rural economic base. As a large segment of the urban poor generally finds a foothold in these marginal areas, the fall in the share of these sources would have alarming implications for them, since they do not get covered through the municipal system and do not have the capacity to go for more expensive sources of drinking water provided through private suppliers.
Source: NFHS 2005–2006, 2015–2016, and 2019–2021.
Interestingly, there is a reduction in drinking water coverage in urban areas if only piped water and tube wells are considered. This is noted in the Census data which reveals a decrease from 84.9 per cent in 2001 to 82.5 per cent in 2011, while NFHS data shows a drop from 92.4 per cent in 2005–2006 to 83.6 per cent in 2019–2021. It is evident that the overall increase in coverage is primarily attributed to sources like bottled water and community RO plants, with the percentage increasing from 0.86 per cent in 2005–2006 to 9.7 per cent in 2019–2021, even though these options are more expensive. Thus, it would be erroneous to consider the increased coverage of improved water as reflecting better access to drinking water for the urban poor.
The period between 2005–2006 and 2019–2021 recorded a remarkable increase in the access to basic amenities, as discussed above. Researchers have tried to analyse the trend and pattern by dividing the period into two; the years before the coming of the NDA government and the period after that. It is, however, difficult to do that with satisfaction since the information is not available at the exact time points of regime change. NFHS provides information only for the year 2015–2016, a year after the change in government in 2014. One can, nonetheless, analyse the divergence in the annual rate of improvement using NFHS data broadly covering the pre-NDA and NDA periods, without ideological distractions, and discuss the variations in the achievements in different periods.
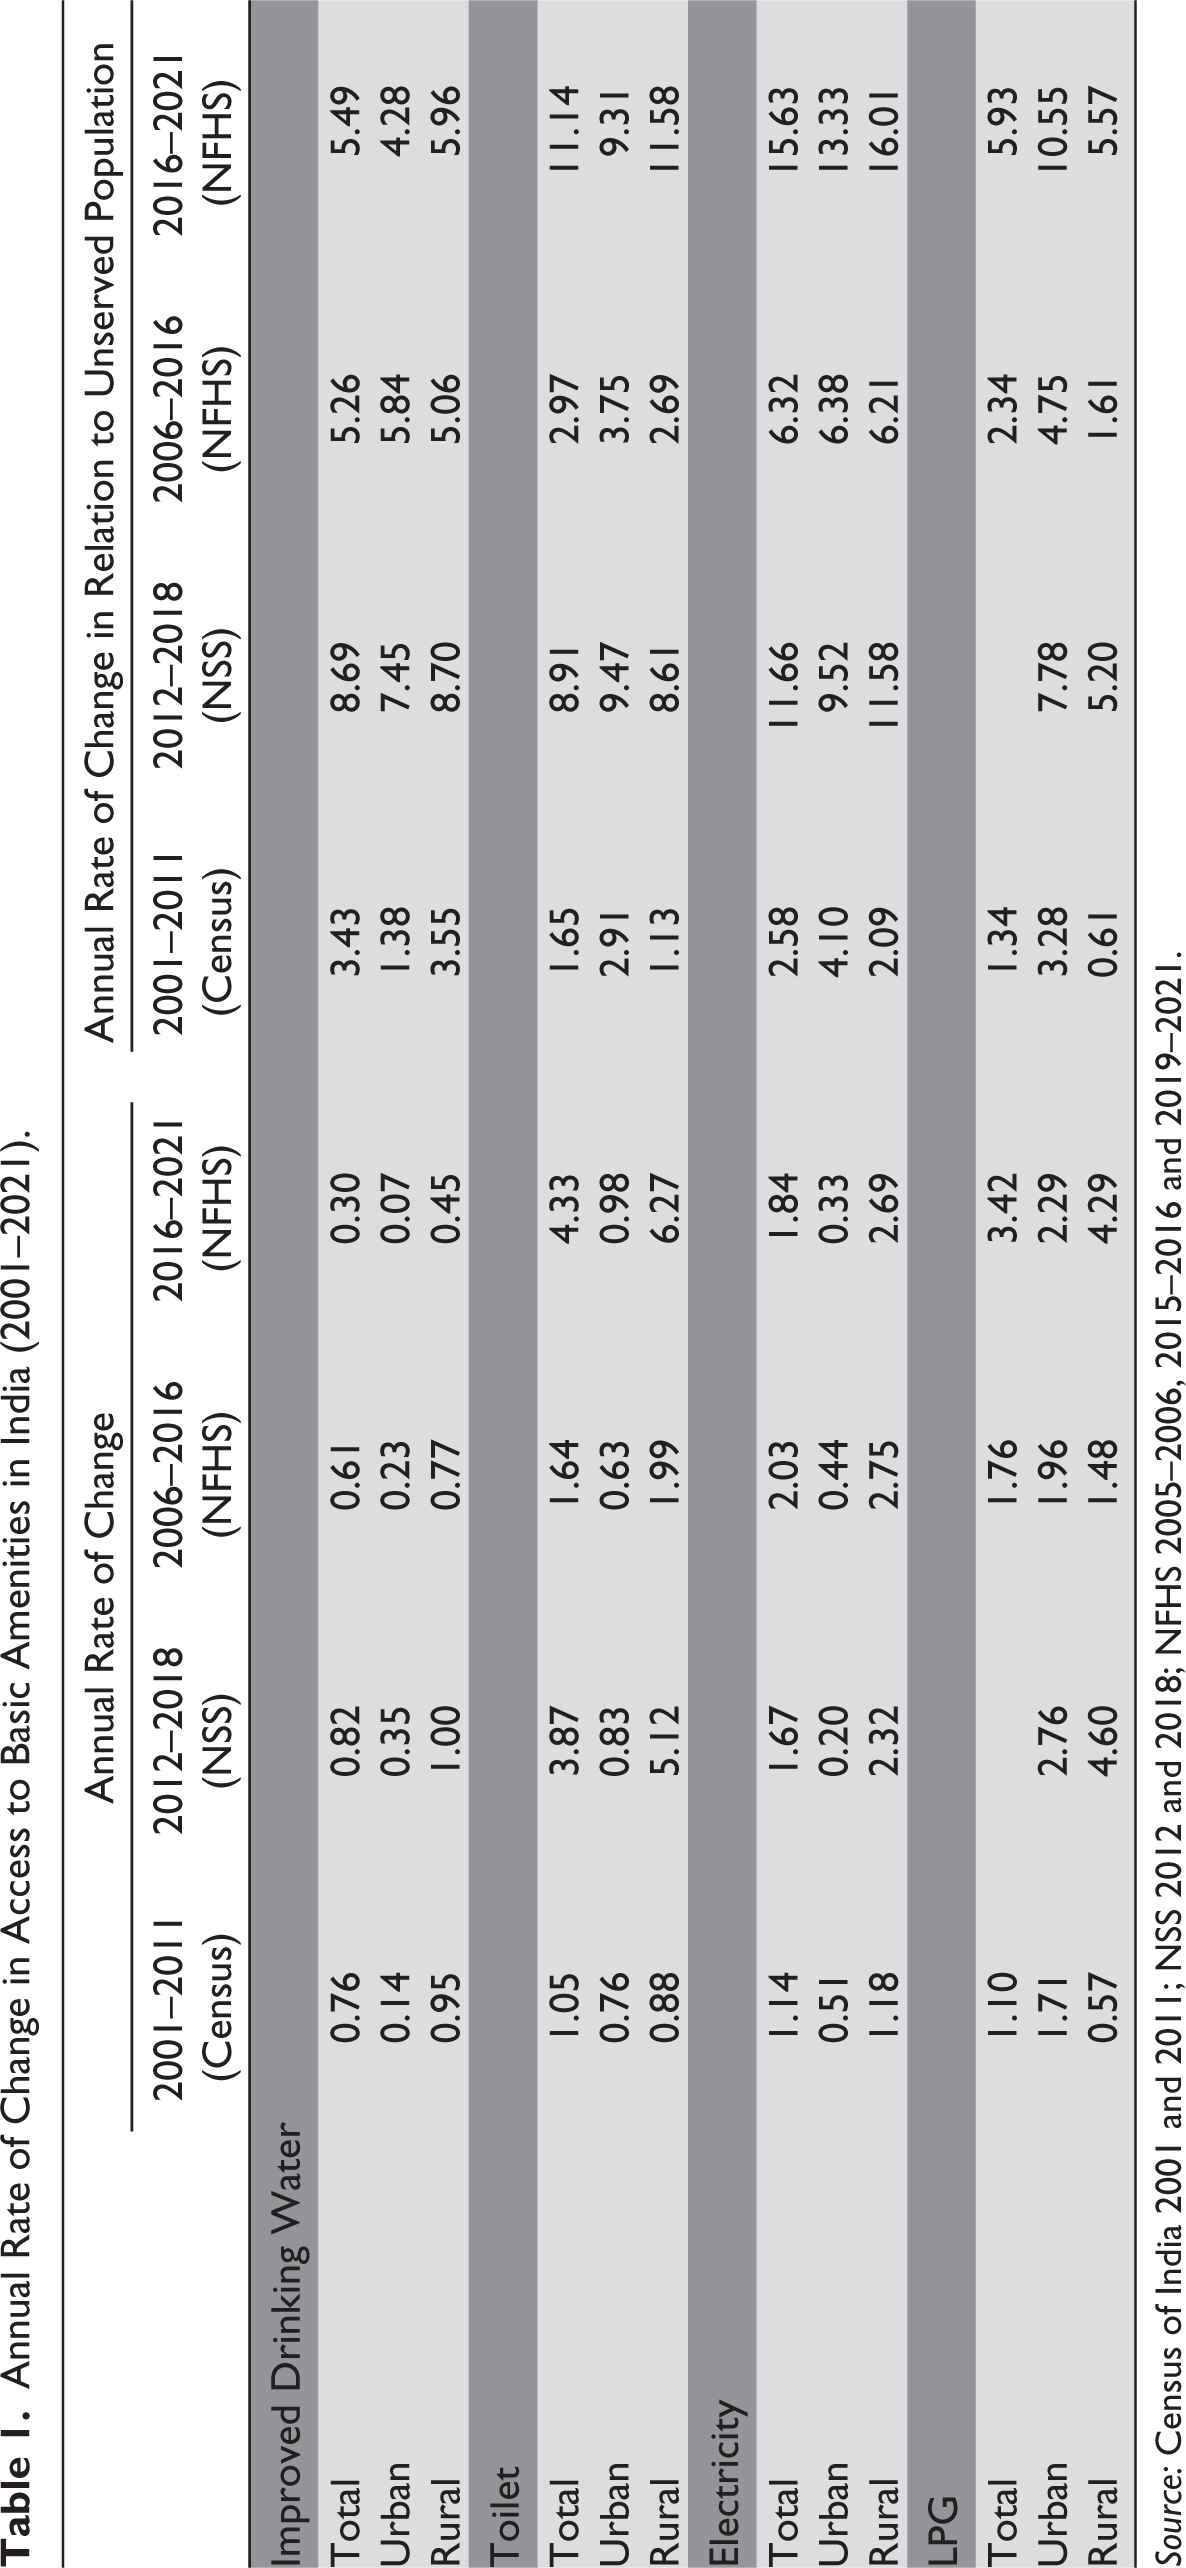
According to the ‘rate of growth calculations’ adopted by Shamika Ravi (2023), a member of the PM’s Economic Advisory Council, there has been greater progress in providing all four essential amenities during the period from 2016 to 2021, compared to the previous decade. Typically, when calculating the rate of growth in coverage, the increment in the number is divided by the base year value, assuming that growth factors are primarily influenced by the base factor. However, for percentage variables, this assumption may not hold true. As the coverage level increases, achieving the same percentage point, improvement becomes more challenging than when the coverage is low, and this rationale underlies the method used by Ravi (2023) in computing the rate of change in relation to unserved population. This argument is particularly valid when coverage exceeds 50 per cent. In such cases, it can be argued that because the share of the unserved population is decreasing over time, achieving the same percentage point improvement requires more effort. Following this rationale, Ravi (2023) divides the percentage increment in served population figures by the percentage of the unserved population in the base year. Although in many situations this argument would not be valid, we have calculated the ‘rate of change’ using Ravi’s (2023) method, as presented in Table 1 , and we consistently observe greater improvements in the second period. The findings contrast with the results of annual increment, as computed in the present study, that indicated that higher rate of coverage in the second period is observed only for sanitation and LPG. This variance can be attributed to the distinct methodology employed by Ravi (2023) in calculating the growth in coverage. It may not be appropriate to uniformly calculate the growth in coverage by dividing the increment in the percentage of coverage by that of the uncovered population in all situations.
Access to Basic Amenities by Size Classes of Urban Centres
India’s urban landscape encompasses a diverse range of towns and cities, varying in population size and level of access to basic amenities that, to an extent, determine their economic strength as also future growth patterns. This diversity can be noted in Table 2 , which presents data on the availability of basic amenities in urban areas across different size classes for the years 2001 and 2011. Unfortunately, due to data limitations, it is not possible to extend this analysis beyond 2011.
Access to Basic Amenities and Trends by Size Classes in India (2001–2011).
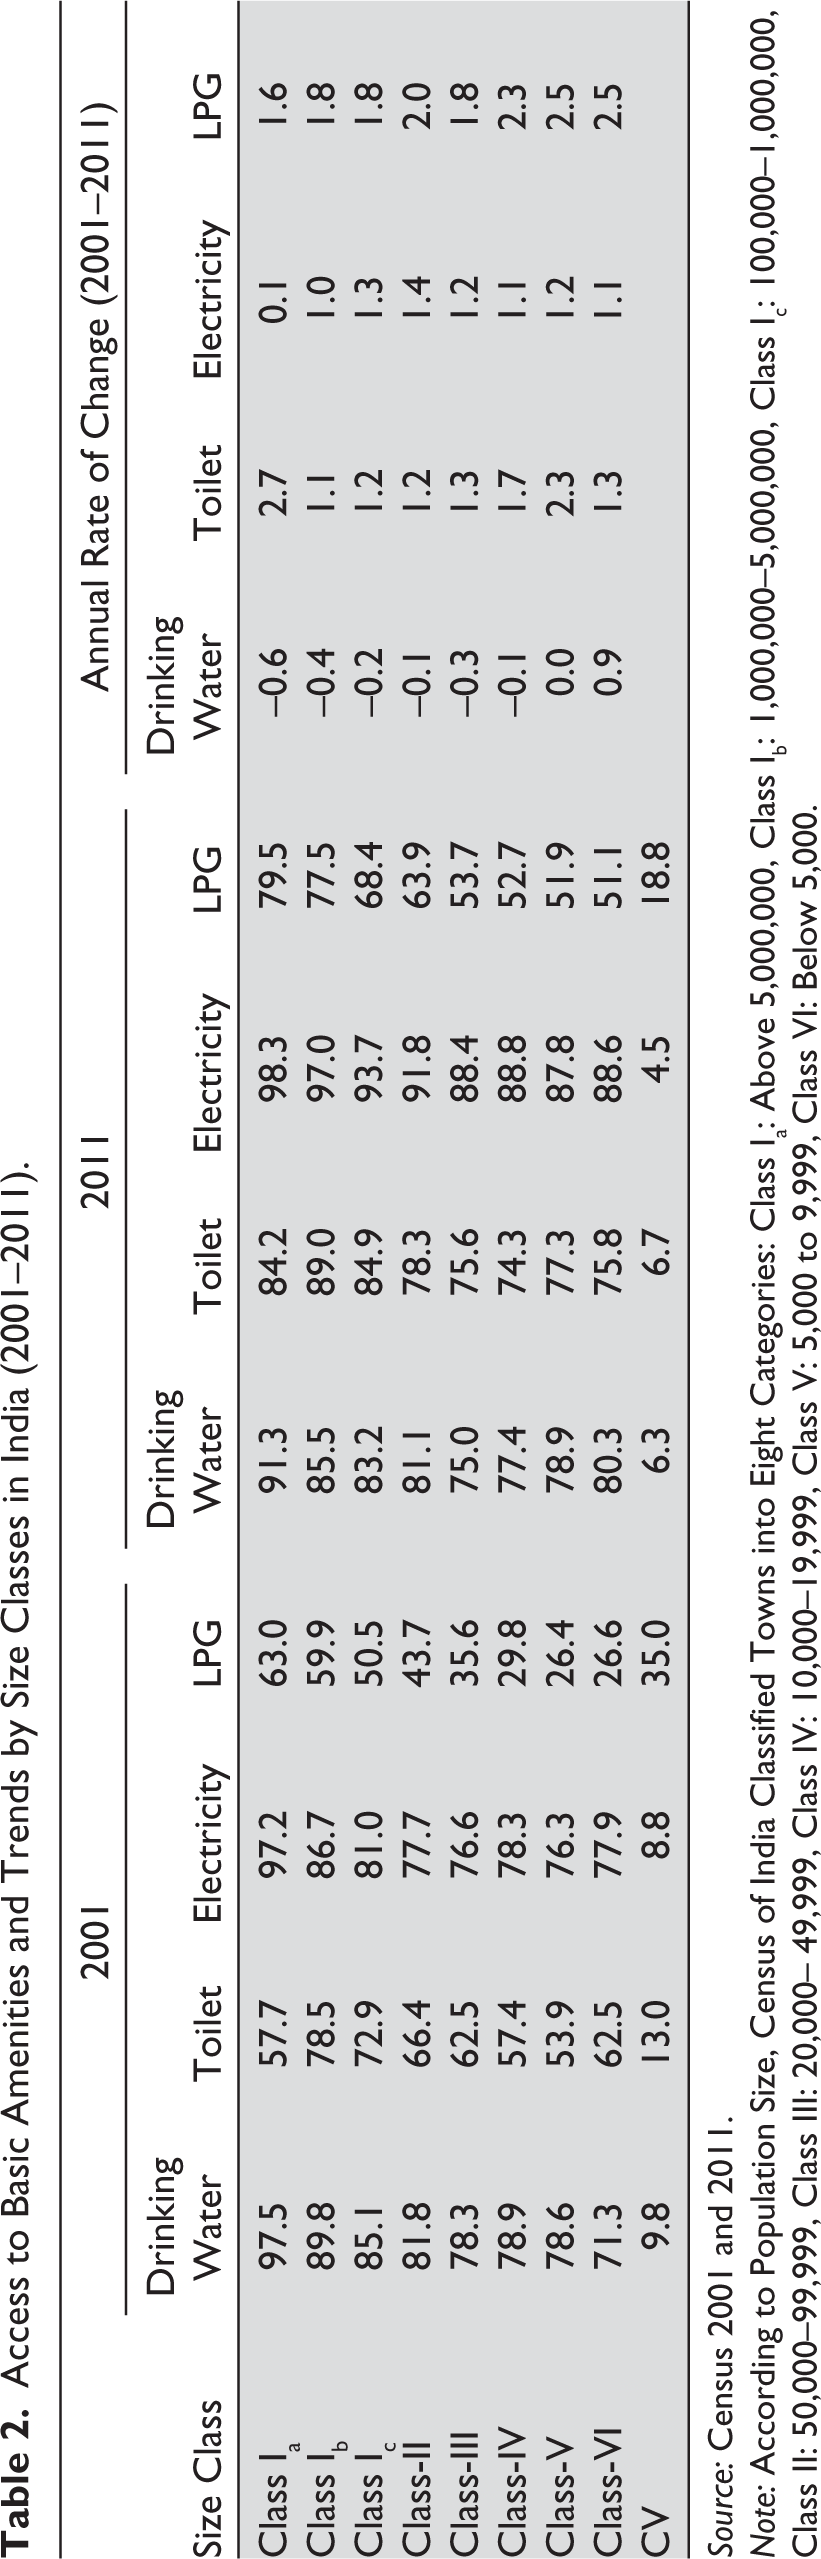
Source: Census 2001 and 2011.
Note: According to Population Size, Census of India Classified Towns into Eight Categories: Class Ia: Above 5,000,000, Class Ib: 1,000,000–5,000,000, Class Ic: 100,000–1,000,000,
Class II: 50,000–99,999, Class III: 20,000– 49,999, Class IV: 10,000–19,999, Class V: 5,000 to 9,999, Class VI: Below 5,000.
Access to basic amenities clearly is not uniform across different size classes of urban centres. Larger cities, especially those with populations exceeding 100,000, tend to have higher coverage in all four basic amenities, namely drinking water, toilet facilities, electricity, and LPG. This advantage is even more pronounced in Class Ia cities, with a population of more than 5 million. Access to these amenities, however, systematically declines as we go down the size category, Class IV, V, and VI towns, with a population of less than 20,000, recording very low figures. Although the megacities with over 5 million inhabitants typically enjoy higher coverage of basic amenities, as noted above, in the case of toilet facilities, the coverage is surprisingly less compared to smaller urban centres, particularly those with populations between 1 million and 5 million. In many smaller towns (Class II, III, and VI), the coverage hovers around 60 per cent, while the megacities had only 58 per cent coverage in 2001. The situation has altered in the following decade although the Ia cities have lower toilet coverage than those in the next lower category. This anomaly can be attributed to a large proportion of poor in the Ia cities living in their older parts where it has not been possible to improve the sanitation facilities. Furthermore, while larger cities show better access to clean fuel like LPG, approximately one-fifth of households, here, still depend on kerosene and other non-renewable sources, which would cause serious problems due to their density and congestion factor. The coverage is much less (around 50 per cent) in medium and small towns due to deficits in affordability, awareness, and availability, regarding clean fuel.
Disparities in access to basic amenities among urban areas of different sizes can be attributed to various factors. Larger cities are often better equipped to provide amenities with higher coverage and better quality due to greater resource-generating capacity. This gives them an edge over the other towns in the provisioning of infrastructure. Smaller towns belonging to Class IV, V and VI, on the other hand, often face budget constraints, hindering their capacity to provide amenities comprehensively. Additionally, the inclusion of a large number of census towns into the urban frame, having agrarian characteristics and a relatively low economic base, results in lower coverage in small towns. Also, several statutory towns, including those identified as urban due to the location of a public undertaking or a special project, may encounter financial constraints for the provisioning of amenities in their peripheral areas, resulting in low coverage.
An attempt can be made to analyse the progress in amenity coverage from 2001 to 2011, based on annual rates of change (2001–2011), as presented in Table 2 . It is noted that access to pipeline, handpump, and tube well based drinking water 1 has decreased in most size classes, with the sharpest drop in case of Class Ia (above 5 million population) and Ib (1–5 million) cities, indicating an accentuation of water-related problems in large cities. In contrast, coverage of toilet facilities increased in all size classes, underscoring some success of the government initiatives, launched before the Swachh Bharat Mission. The most significant improvements were observed in Class Ia cities and towns having 5,000–20,000 population. Electricity coverage experienced small improvements in most size classes, with the progress being higher in smaller towns. LPG coverage, too, exhibited significant progress across all size classes. In smaller towns, particularly those in Class III, IV, V, and VI, the increases in the coverage were significantly higher although they still have approximately half of their households relying on unsustainable cooking fuel.
To assess the trend towards convergence or divergence across different size classes of urban centres, we can look at the coefficient of variation (CV). Higher values of the CV indicate greater variability among size classes of urban centres. In the case of drinking water, toilets, and electricity, the coefficients of variation decreased during 2001–2011, indicating a convergence in coverage. One would argue that the gap between larger and smaller urban centres has narrowed over time. However, in the case of LPG, the CV is reduced by half and yet, it remains very high.
One would conclude that although there have been significant improvements from 2001 to 2011 in sanitation, electricity, and LPG access across cities and towns in various size classes, the coverage in formal system-based drinking water has decreased except in smaller urban areas. While larger cities (with a population of 100,000 or more) still mostly record higher coverage, the smaller urban areas have made substantial improvements in recent years. The decrease in coefficients of variation for all amenities under consideration suggests that the gap is narrowing, reflecting some success of India’s efforts to bring about equity in the provisioning of infrastructure and basic amenities. It further suggests the need for maintaining this tempo and for accelerating it through the programmatic interventions to meet the goal of reaching the last person in the economic and social hierarchy.
Equity in Access to Amenities
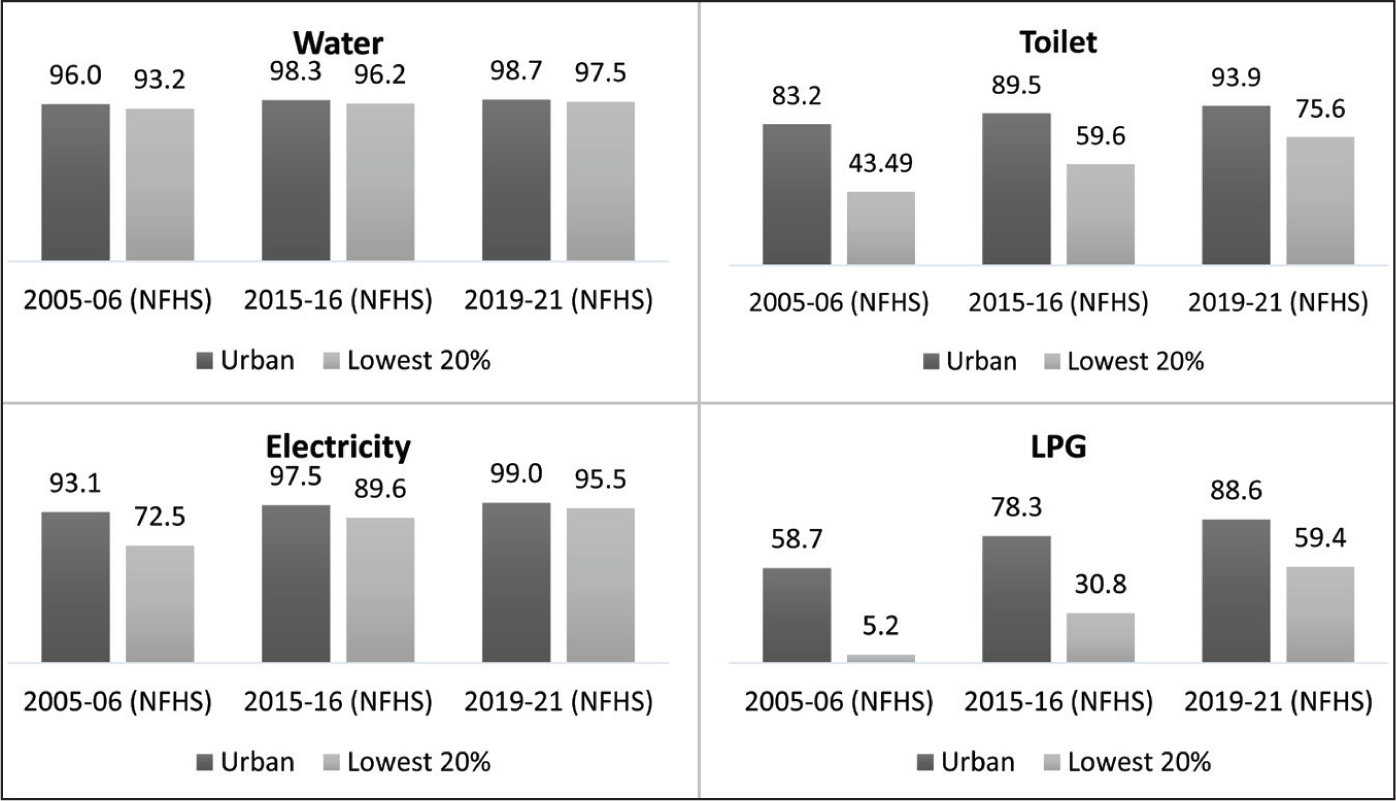
Access to basic amenities to households in different wealth quintiles, based on asset indices, has been analysed at different points of time, using the data from different rounds of NFHS to determine the levels of deprivation of the bottom 20 per cent of households and changes therein over time. The percentage of households having the four amenities under consideration works out to be consistently lower for those in the lowest 20 per cent asset group, compared to the overall urban average, at all the three time points ( Figure 6 ). The gaps, however, have gone down over time. More importantly, the gap in access of households to improved drinking water was very low in 2005–2006, the percentage figures being 96 and 93.2 for the average and bottom 20 per cent households, respectively. Happily, this has almost disappeared in 2019–2021. The same is the case for electricity connections.
Source: NFHS 2005–2006, 2015–2016, and 2019–2021.
However, in the case of toilet facilities, the lowest 20 per cent of households had a rate of 43.5 per cent in 2005–2006, which was only half the urban average of 83.2 per cent. Although access to toilets has significantly improved to 75.6 per cent for the lowest 20 per cent of households and 93.9 per cent for the urban average in 2019–2021, there is still an 18.3 per cent gap between the two. Similarly, for LPG access, the gap between the lowest 20 per cent of households and urban average, which was as high as 53.5 per cent in 2005–2006, significantly decreased to 29.2 per cent in 2019–21, as access for the lowest 20 per cent of households improved from 5.2 per cent to 59.4 per cent from 2006 to 2021. Despite these improvements, addressing the disparities in access to toilet facilities and LPG remains crucial policy concerns to ensure equity in provisioning urban amenities across different wealth quintiles.
It is important to mention that the annual rate of change in access to basic amenities during 2006–2021 is significantly higher for the lowest 20 per cent of households when compared to the overall urban figure ( Table 3 ). For toilets and LPG, the annual rate of change among the lowest 20 per cent of households is about three times that of all urban households in 2016–2021. For improved drinking water and electricity, this difference is even higher, being approximately fourfold. This clearly signals a trend of diminishing disparity in access to basic amenities in households in different economic categories, especially for improved drinking water and electricity facilities.
Annual Rate of Change in Access to Basic Amenities Among the Poor (Lowest 20 per cent Households of Wealth Quintile) in India (2006–2021).
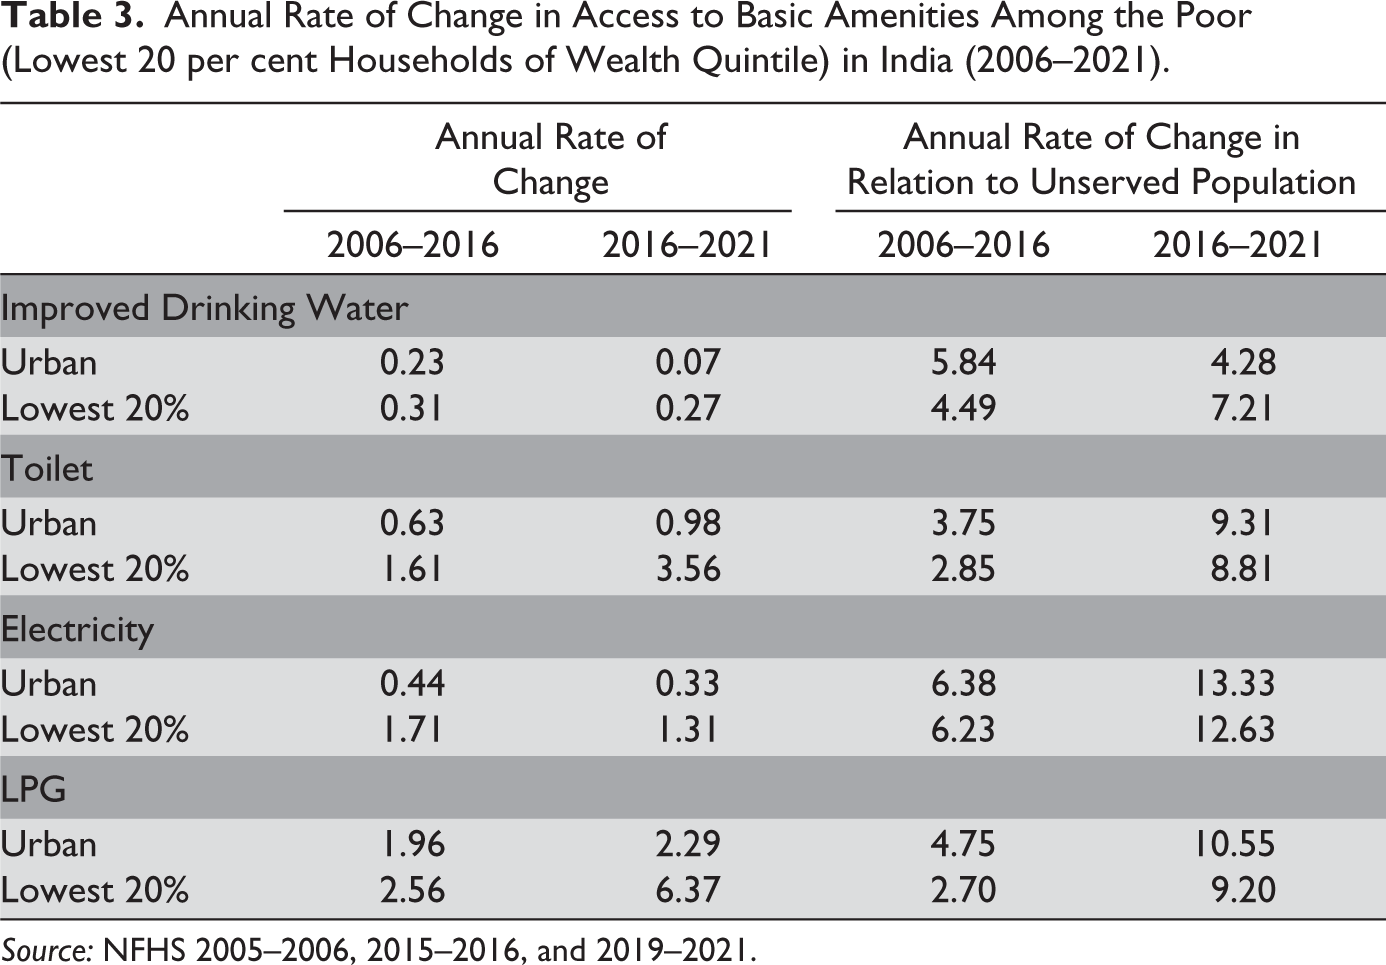
Source: NFHS 2005–2006, 2015–2016, and 2019–2021.
Analysing the rate of change during the two periods: from 2006 to 2016 and from 2016 to 2021, one observes a decline in the second period in the access to improved drinking water and electricity, suggesting challenges in maintaining the pace of initial progress at a higher level of achievement. The same is the case for the lowest 20 per cent of the households as well. In stark contrast, the situation is the opposite for toilet facilities and LPG, the rates being higher in the second period, for the average as well as the bottom 20 per cent of households. Here, the annual rate of change is substantially higher during 2016–2021, compared to 2006–2016. This boost can be attributed to major flagship missions launched by the government, targeting the poorer segments of the population, including the Swachh Bharat Mission in 2014 and the Pradhan Mantri Ujjwala Yojana (PMUY) in 2016.
The pattern emerging from the annual rate of change is different from that of the growth rate in relation to the uncovered population, as computed by Ravi (2023), discussed above. No wonder that her methodology indicates that the rates for all the amenities are higher in the second period for both the total urban and the lowest 20 per cent of households. This contradicts the results, discussed in the context of annual rate of change, as attempted in the present analysis. One would, however, question the procedure for computation of the growth rate of coverage as done by Ravi for toilets and LPG, where the coverage for some categories was 50 per cent or less in the base year.
Trends and Patterns of Access to Basic Amenities at State Level
Analysis of trends and patterns in access to four selected amenities has been undertaken in this section at three time points: 2005–2006, 2015–2016, and 2019–2021, using information available from NFHS. The analysis is similar to what was done in the previous section, except that this pertains to interstate variations. It is important to note that the variations vary significantly across different amenities owing to their distinct management systems and the diverse perspectives regarding their roles as public utilities. In provisioning these amenities, states play an important role, but the degree of its engagement varies significantly and so does the out-of-pocket expenditure incurred at household level in accessing these.
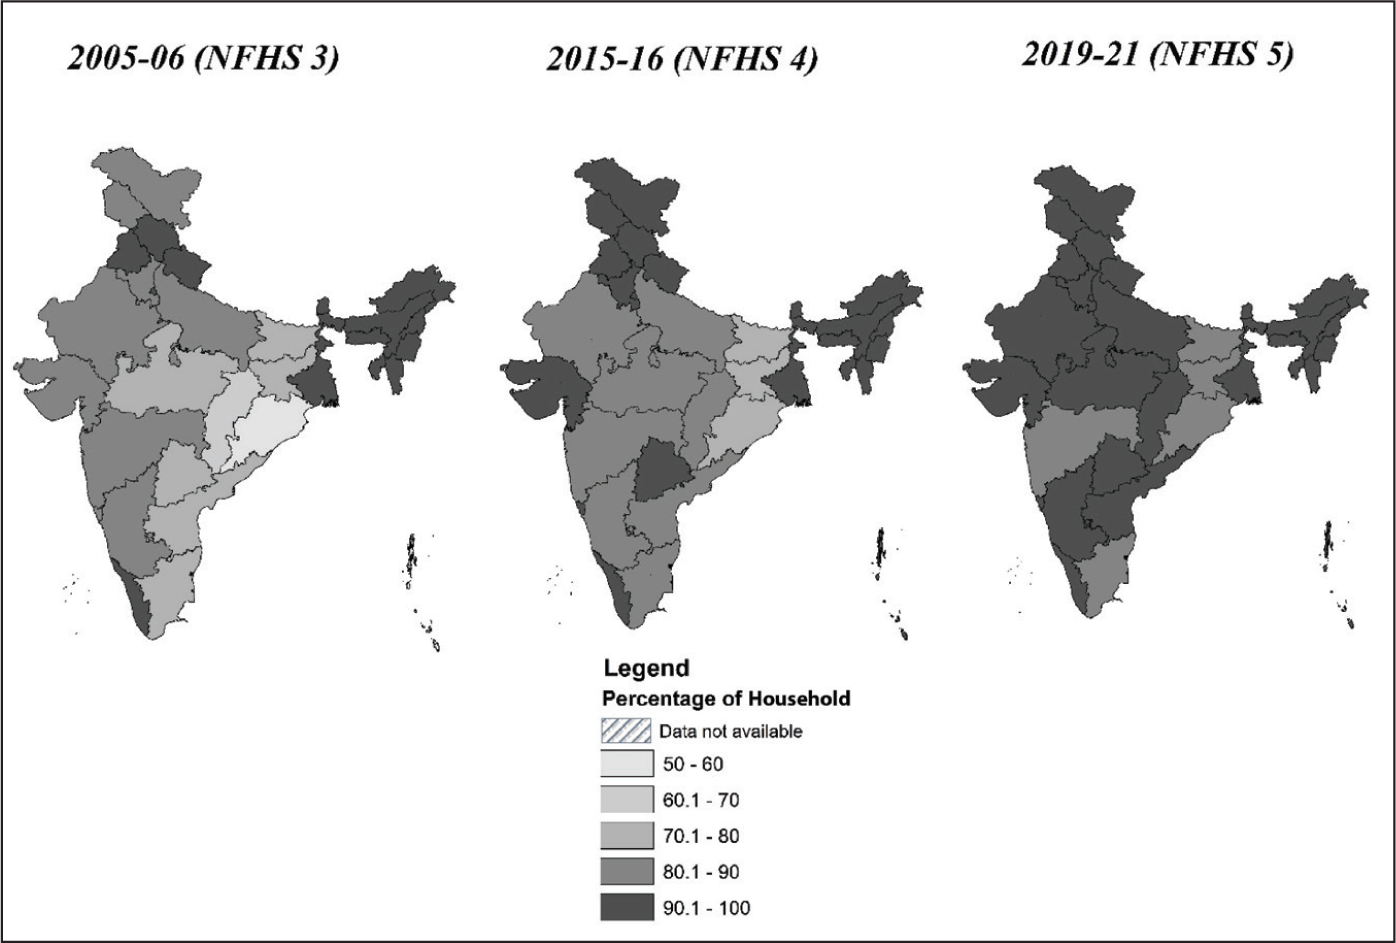
The coverage of households with improved drinking water in urban areas is above 90 per cent for the years 2019–2021 in all states. However, this low interstate variation hides a lot more than it reveals. This amenity is predominantly a publicly delivered service, but its provision through municipal and para-statal bodies is increasingly being managed within the marketing framework of pricing and affordability, particularly for upper-middle and high-income households. Furthermore, many cities are transitioning from public to private suppliers and intermediaries. In contrast, lower and lower-middle-class households continue to rely on government sources where the level of service, quality, reliability, and convenience in the delivery system is relatively low. There are several constitutional, legal, and administrative stipulations that make the provisioning of drinking water through public bodies somewhat mandatory. Interestingly, poorer and less urbanised states such as Bihar, Uttar Pradesh, Rajasthan, and Chhattisgarh, among others, record higher coverage along with richer states such as Punjab, Gujarat, Haryana, Maharashtra, and Tamil Nadu ( Figure 7 ). The coverage of households at the state level, thus, shows no correlation with their per capita income or degree of urbanisation ( Table 4 ).
Source: Prepared by Authors Using NFHS 2005–2006, 2015–2016, and 2019–2021 Data Set.
Association Between Access to Basic Amenities in Urban Areas and Per Capita Income and Level of Urbanisation in India.
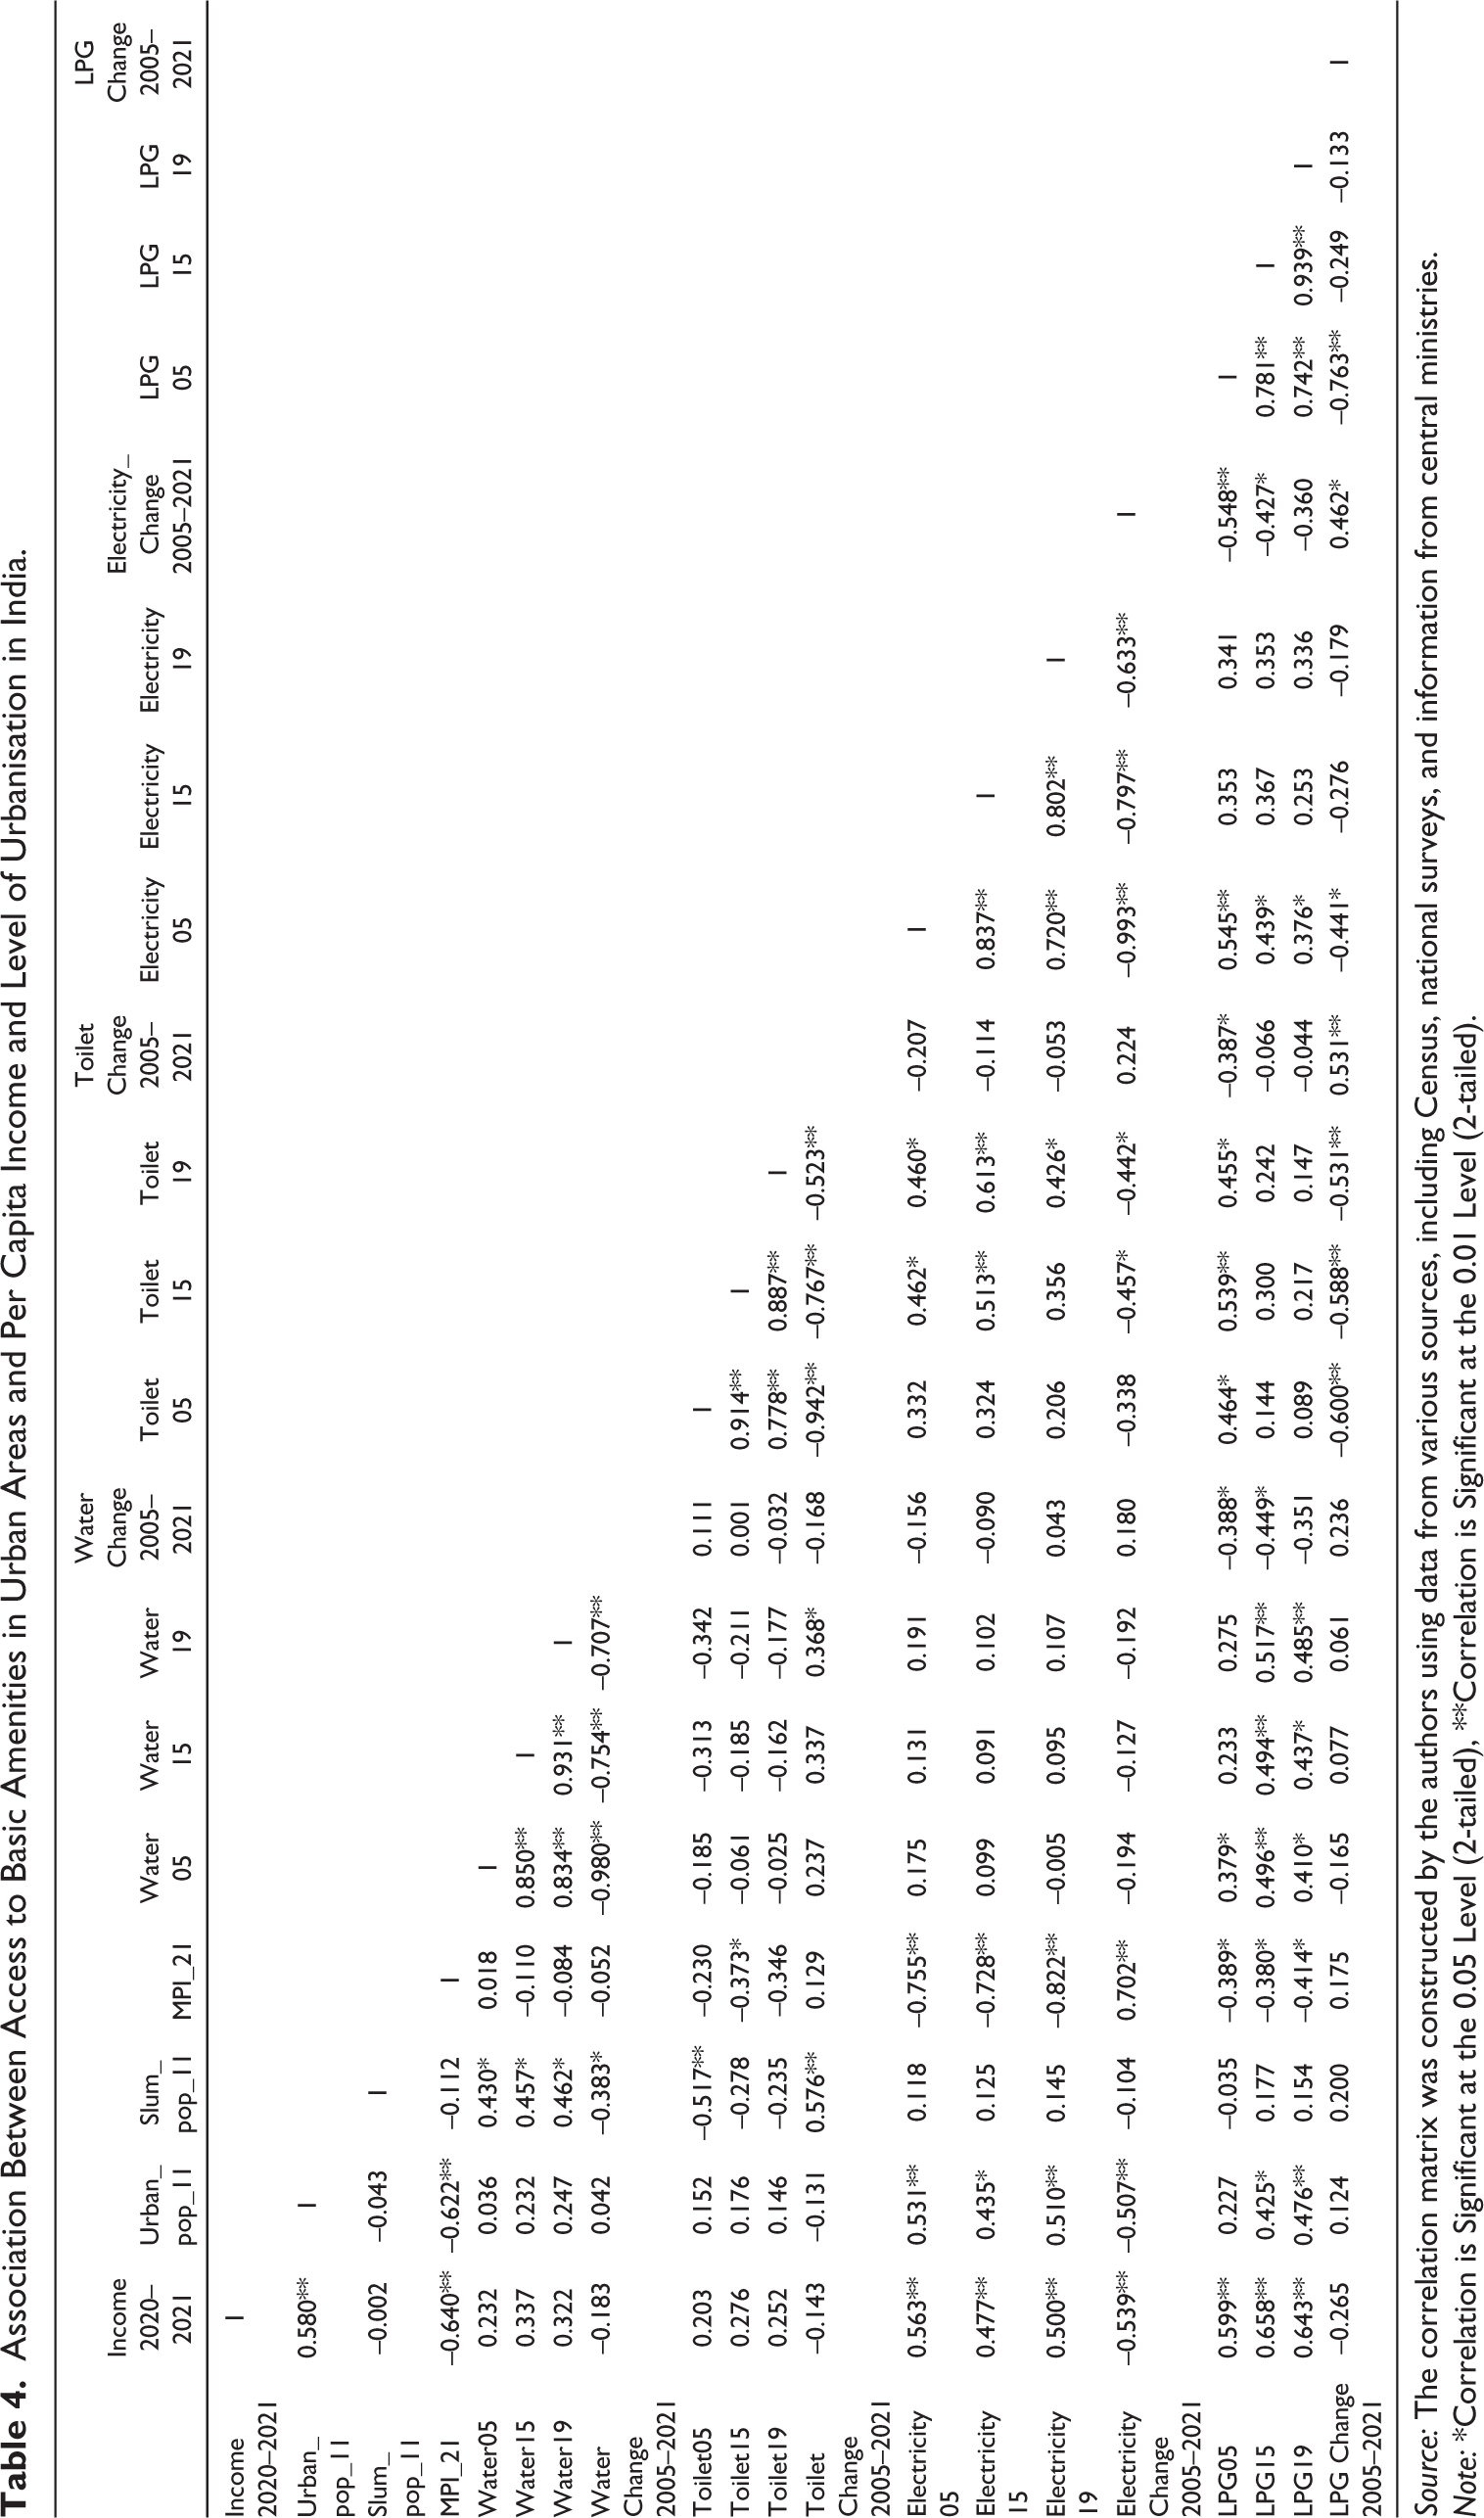
Source: The correlation matrix was constructed by the authors using data from various sources, including Census, national surveys, and information from central ministries.
Note: *Correlation is Significant at the 0.05 Level (2-tailed), **Correlation is Significant at the 0.01 Level (2-tailed).
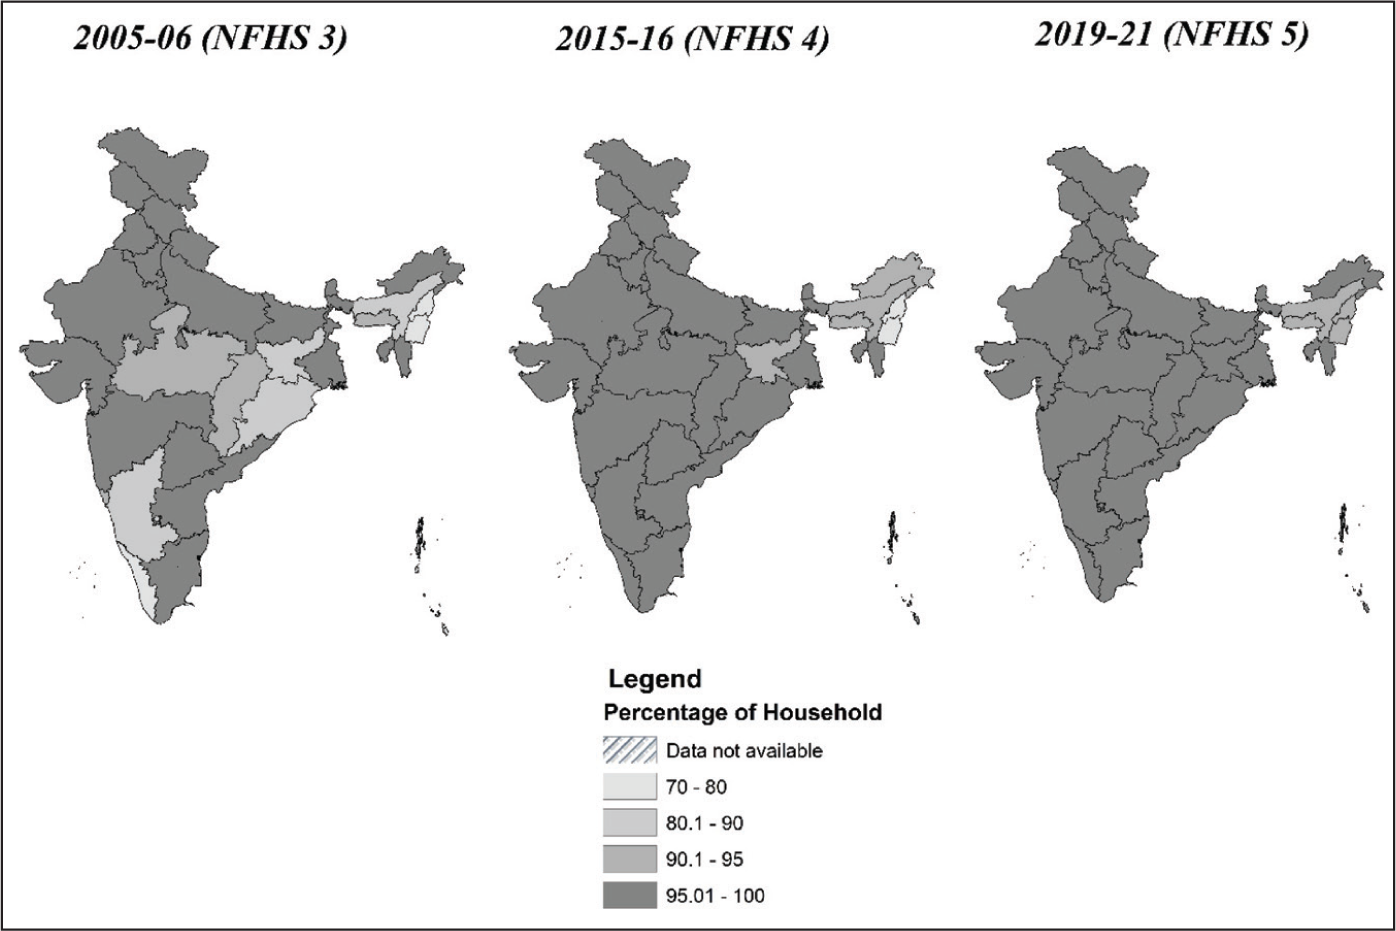
The variation in the percentage of households having toilet facilities in 2019–2021 does not exhibit a significant correlation with per capita income or the level of urbanisation ( Table 4 ). Notably, the spatial pattern for coverage of toilets differs significantly from that of drinking water, with no apparent association between the two. This distinction arises from the considerable involvement of the central government in sanitation, particularly through the Swachh Bharat Mission, resulting in a distinct spatial pattern of coverage. Developed and highly urbanised states like Haryana and Kerala as well as less developed states such as Tripura, Manipur, Nagaland, Jammu and Kashmir, and Assam, show high toilet coverage ( Figure 8 ). In contrast, some developed and highly urbanised states such as Tamil Nadu and Maharashtra exhibit low toilet facility coverage, similar to the less urbanised states such as Jharkhand, Bihar, and Odisha, which have lower per capita income.
Source: Prepared by Authors Using NFHS 2005–2006, 2015–2016, and 2019–2021 Data Set.
Public agencies and missions play a significant role in providing electricity and LPG, but here, a larger segment of the urban population depends on market-based systems. Consequently, there is a strong correlation between the spatial patterns of availability of these two amenities ( Table 4 ). Understandably, the level, duration, and quality of these services vary from city to city and across the states. One notices a positive correlation between the developmental indicators such as per capita income, urbanisation, and the coverage of these amenities. Many less developed states, including Odisha, Meghalaya, Uttar Pradesh, Jharkhand, Chhattisgarh, and Bihar, have low coverage for both electricity and LPG due to limited financial resources at both government and household levels (Figures 9 and 10). Importantly, one-third of the households in these states still rely on non-renewable sources for lighting and cooking fuel. Conversely, more developed states like Goa, Kerala, Mizoram, Sikkim, Gujarat, and Maharashtra report significantly higher coverage. Nearly all these states record 100 per cent coverage for electricity and over 94 per cent coverage for LPG, which is above the national urban average in 2019–2021.
In the context of access of households to all four amenities from 2006 to 2021, one observes significant progress nationwide. Importantly, the level of coverage and improvements are negatively correlated, suggesting that the poorer states have recorded higher progress than the better-off states ( Table 4 ). The CV in access to improved drinking water in urban areas decreased from 8.8 in 2005–2006 to 2.4 in 2019–2021, indicating a trend towards convergence. During this period, the northern and western states, characterised by higher per capita incomes, made smaller improvements. A few states, including Telangana, Punjab, Haryana, and Sikkim, have recorded slight declines (less than 1 percentage point), possibly due to their initial high coverage levels, which were close to 100 per cent in 2005–2006. In contrast, the less developed central and north-eastern states, including Odisha, Jharkhand, Chhattisgarh, Nagaland, Manipur, and Assam, witnessed substantial increases, all exceeding 5 percentage points. Notably, Nagaland and Manipur saw remarkable increases of more than 20 percentage points ( Figure 7 ). Despite these improvements and near-universal coverage in several states, challenges persist in the poorer states, particularly regarding the service delivery, quality, and regularity of water supply. The importance of targeted efforts to improve the management of safe drinking water, with a focus on the less developed states and poor households, cannot, therefore, be exaggerated.
Improvements in access to toilet facilities across the states over three NFHS rounds do not exhibit any relation with the level of income but has a strong and positive relation with the base year coverage levels. Less developed north-eastern states, including Mizoram, Manipur, Sikkim, Nagaland, and Arunachal Pradesh, that had high coverage in the base year, consistently showed low improvements, but a few could achieve 100 per cent coverage by 2019–2021 ( Figure 8 ). Additionally, the less developed eastern and central states with low coverage, such as Bihar, Odisha, Madhya Pradesh, Jharkhand, and Chhattisgarh, recorded high improvements––more than 15 percentage points––during the period from 2006 to 2021. In contrast, progress in the developed states has been relatively modest. However, a few developed states such as Andhra Pradesh and Tamil Nadu have made substantial progress, suggesting that economic development is not one among the drivers of change for this amenity. It is heartening to see states such as Bihar and Jharkhand with low coverage reaching access levels of Tamil Nadu and Maharashtra within a short period of one and a half decades. Notably, the CV for toilet access decreased from 12.9 in 2005–2006 to 4.6 in 2019–2021, indicating a trend toward convergence, with most states moving towards or achieving universal access.
The availability of electricity has expanded significantly in all states of the country. The improvements are higher in less developed states such as Bihar, Assam, Odisha, and Uttar Pradesh which had low coverage in the base year, with an increase of over 10 percentage points from 2005–2006 to 2019–2021. However, these states are still grappling with relatively high access deficits, highlighting the need for sustained efforts. On the other hand, Jammu and Kashmir, Goa, and Kerala form a special category, achieving 100 per cent coverage by 2019–2021, showcasing impressive progress ( Figure 9 ). The advancements in the access have been relatively modest in the developed states, except for Tamil Nadu and Kerala, showing an improvement of around 5 percentage points from 2005–2006 to 2019–2021. Figure 9 also reveals a convergence in access to electricity, with the CV dropping from 6.3 in 2005–2006 to 0.9 in 2019–2021. This progress is particularly evident in less-covered regions in the East and Northern India, narrowing the gaps with the well-served northern and western regions.
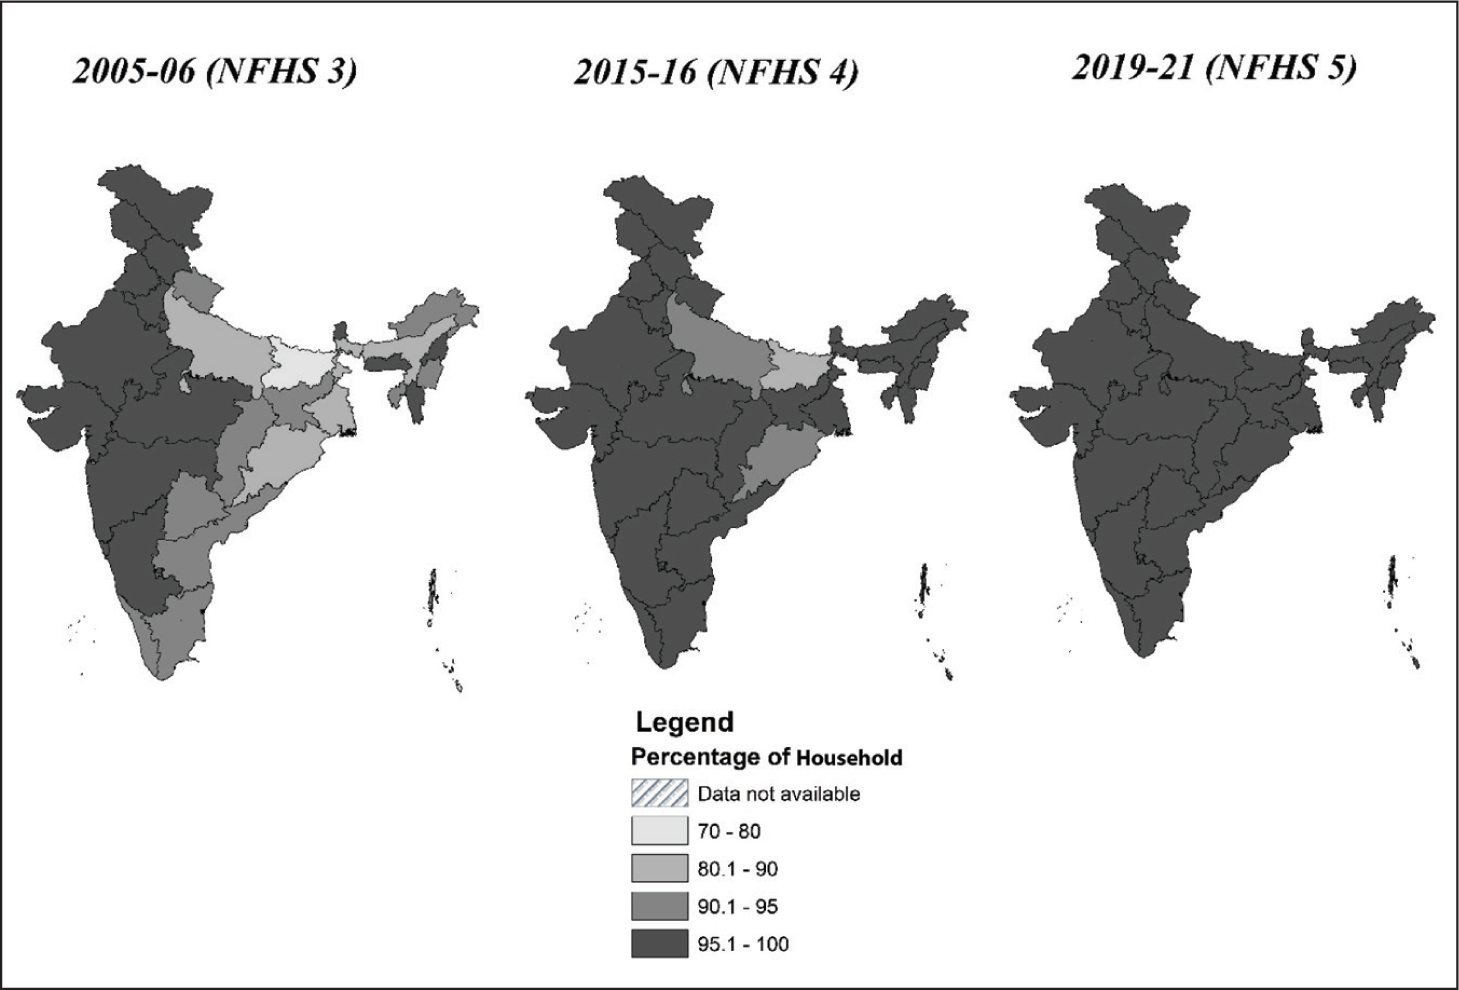
Source: Prepared by Authors Using NFHS 2005–2006, 2015–2016, and 2019–2021 Data Set.
Adopting clean cooking fuel, such as LPG, is crucial for both the environment and public health. India’s progress in providing LPG connections to backward regions has been impressive. Notably, the increase in household coverage is commendable at the national level, recording phenomenal progress in less developed regions, where the percentage of households with access to LPG was historically low. States such as Chhattisgarh, Bihar, Meghalaya, Odisha, and Jharkhand, which had LPG coverage of less than 50 per cent in 2005–2006, have made remarkable strides, improving their figures by over 30 percentage points by 2019–2021. Some of the more developed states, such as West Bengal, Tamil Nadu, Karnataka, and Andhra Pradesh, exhibit reasonable improvements and could achieve universal coverage by 2019–2021 ( Figure 10 ). However, the real challenge persists in northern and north-eastern states, such as Nagaland, Tripura, Odisha, Jammu and Kashmir, Jharkhand, and Meghalaya, that still have relatively low access to LPG, necessitating continued use of traditional and non-renewable cooking fuels by one-fourth of their households in 2019–2021. One of the most satisfying developments is the reduction in the CV for LPG access, which decreased from 24.0 in 2005–2006 to 12.1 in 2019–2021. Nevertheless, significant disparities persist among the states, with LPG access having the highest variation among the four amenities considered in this study. Strategic interventions are needed in the central, eastern, and north-eastern regions in the coming decade to achieve inter-state convergence in terms of access to clean cooking fuel.
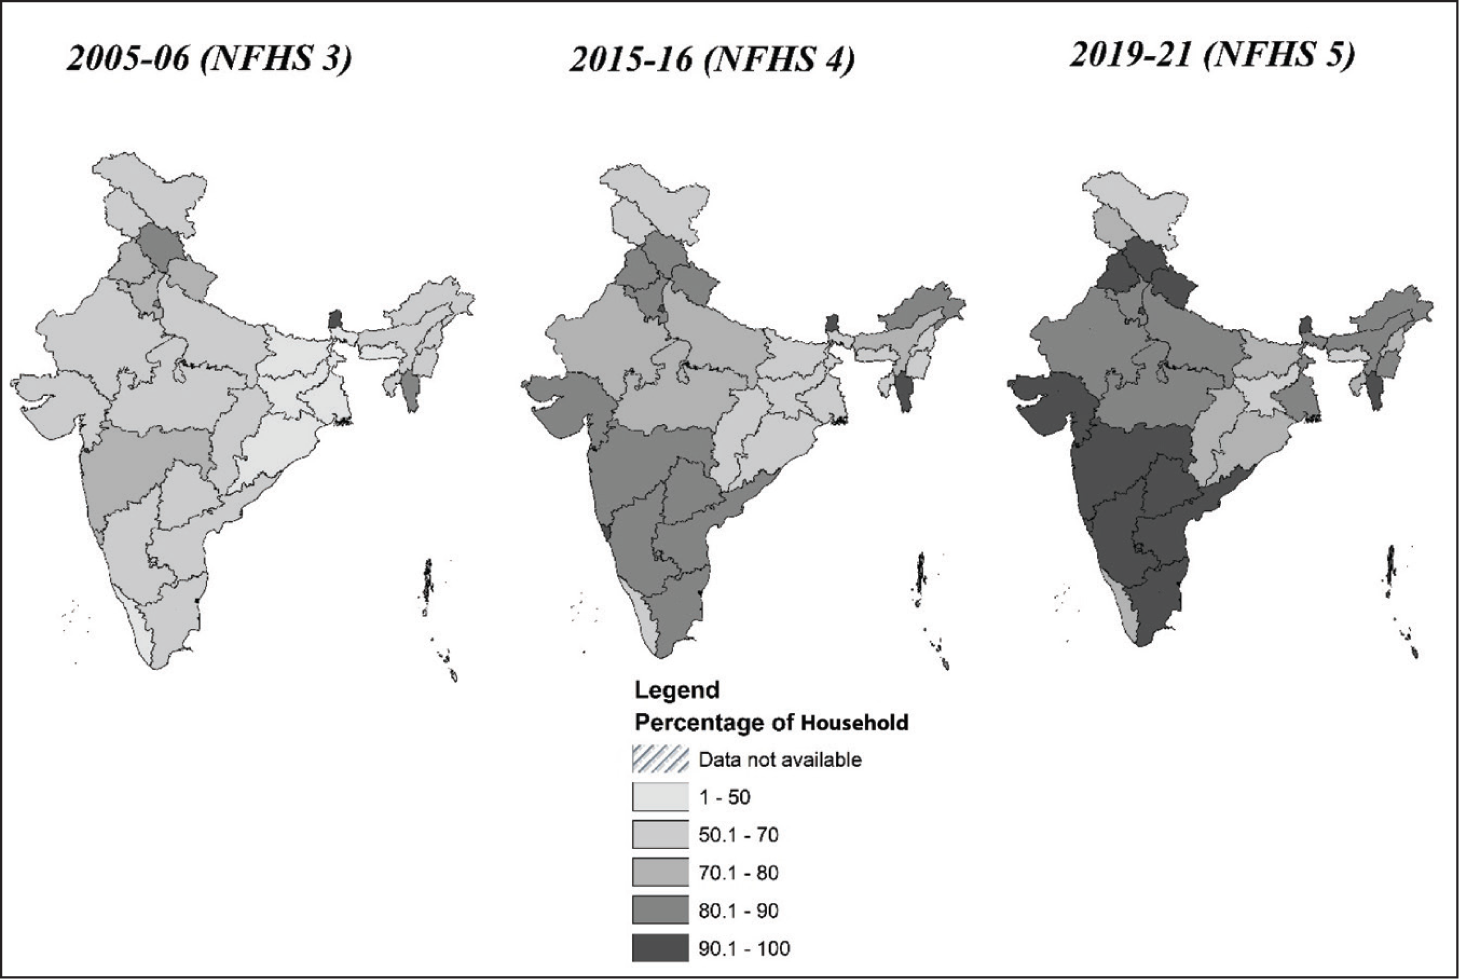
Source: Prepared by Authors Using NFHS 2005–2006, 2015–2016, and 2019–2021 Data Set.
There is an urgent need to improve the quality, convenience, and regularity of drinking water and electricity supply in urban areas, with particular emphasis on poor households, although the problem of coverage has been resolved. Furthermore, the disparities in access to toilet facilities and LPG must be addressed with a sense of urgency in the less developed states since they record significant deficits in serving the vulnerable urban populations, particularly in their backward regions. Achieving environmental sustainability while guaranteeing universal coverage in basic amenities would require not only augmenting the overall supply but also ensuring their equitable distribution, by targeting the amenities to the poor. Through these efforts, India can ensure a smooth journey towards inclusive urban environment and attainment of the SDGs, well ahead of 2030.
Analysis of Inter Dependencies at State Level
It would be important to explore the interdependencies between urbanisation, urban poverty, and access to basic amenities, along with their implications for environmental stress. This exploration is based on the indicators used for the state-level analysis in the preceding section, with the addition of a few new indicators to articulate the relevant dimensions. The list of indicators under the three dimensions used in the present analysis is given below along with their shortened keys.
Urbanisation–Poverty Context
Urban population (percentage) (Census, 2011): Urban pop
Slum population (percentage) (Census, 2011): Slum pop
Kutcha houses (percentage) (NFHS, 2019–2021): Kutcha house
Multidimensionally poor people living in urban areas (percentage) (NITI Aayog, 2019–2021): MPI
Access to Basic Amenities
Urban households having access to improved drinking water (percentage) (NFHS, 2005–2006, 2015–2016, and 2019–2021): Water05, Water15, Water19
Urban households having access to toilet facility (percentage) (NFHS, 2005–2006, 2015–2016, and 2019–2021): Toilet05, Toilet15, Toilet19
Urban households having electricity connection (percentage) (NFHS, 2005–2006, 2015–2016, and 2019–2021): Electricity05, Electricity15, Electricity19
Urban households using LPG as cooking fuel (percentage) (NFHS, 2005–2006, 2015–2016, and 2019–2021): LPG05, LPG15, LPG19
Resource Use and Environmental Stress
Population density in urban areas (square kilometres) (Census, 2011): Density
Air quality in urban areas (number of days with AQI > 50 in a year) (Central Pollution Control Board (CPCB), Ministry of Environment, Forest and Climate Change (MoEFCC), 2021): AQI
Percentage of Municipal Solid Waste (MSW) processed to the total MSW generated (Swachh Bharat Mission-Urban (SBM-U), Ministry of Housing and Urban Affairs (MoHUA), 2020): MSW
Plastic waste generated per 1,000 population (tonnes/annum) (MoEFCC and population projection by Ministry of Health and Family Welfare (MoHFW), 2018–2019): Plastic
Per capita fossil fuel consumption (in kilogram) (Ministry of Petroleum and Natural Gas (MoPNG)––sourced from Ministry of Statistics & Programme Implementation (MoSPI) National Indicator Framework (NIF) Progress Report (PR) 2020, 2018–2019): Fossil
It is often argued that those in poverty, excluded from the organised labour market, are forced to rely on informal employment in industrial and tertiary activities and use non-renewable resources in their struggle to create livelihoods and meet day-to-day necessities, because they cannot afford formal energy sources. It is contended that these people are primarily responsible for the degradation of the micro-environment in urban areas. The objective of the present analysis is to test this hypothesis and assess whether urban poverty, often linked to high rates of distress migration from rural areas, the growth of the unorganised sector, and the use of biofuel for domestic purposes are the key factors leading to significant environmental stress. The analysis has been carried out by constructing a matrix of correlations among the selected indicators and analysing the interdependencies in the context of a theory of change.
The pattern of correlations presented in Table 5 does not provide empirical support for the aforementioned hypothesis. However, the analysis indicates that the urbanisation pattern in the country has been exclusionary for the poor, leading to a significant level of pollution and environmental degradation. This exclusionary urbanisation has resulted in deceleration in urban growth rate in recent decades. This can partially be attributed to the denial of statutory status to numerous settlements exhibiting urban characteristics, and recognised by the registrar general of India, responsible for conducting the population census in the country. Additionally, the process has resulted in reduction in the percentage of slum population and that of kutcha houses. It is noteworthy that India has achieved a record of sorts by substantially reducing its percentage of slum population and even overshooting the stipulated Millennium Development Goals between 2001 and 2015.
The correlations between urbanisation, slum population, poverty, and access to basic amenities suggest that the states with a high degree of urbanisation report low levels of poverty, slum population, and kutcha houses. Access to all four essential amenities is much higher in the urbanised states like Goa, Mizoram, Tamil Nadu, Kerala, Maharashtra, Gujarat, Karnataka, Punjab, Haryana, Telangana, and Andhra Pradesh. These report low poverty rates, reflecting their exclusionary character. These economically developed states have a few large cities, where a large percentage of high and middle-income urban households reside. They can offer a high level of basic services to their urban dwellers, as evident from the positive and significant correlation between the indicators of the level of urbanisation and of basic services, observed at all the three points of time. This is particularly significant in the case of electricity and LPG connections, where the delivery system functions largely on market principles.
The correlation matrix ( Table 5 ) unravels an interesting pattern of relationship between urbanisation and environmental factors. The correlations between the level of urbanisation and environmental indicators like AQI, plastic waste, fossil fuel consumption and so on are high and significant. This suggests that with an increasing level of urbanisation, as per the business-as-usual scenario, environmental challenges would intensify. This holds true even though the urbanised states cover a larger segment of the urban population through improved sources of energy such as electricity and liquid cooking fuel. This is because per capita energy consumption in the large cities in these highly urbanised states is so high that despite their using energy sources with low carbon emissions, the environmental stress works out as very alarming. These states record a greater number of days with poor air quality in urban areas, primarily because much of their urban population is concentrated in a few large cities and their energy-intensive lifestyle, high-rise structures, use of petrol-driven vehicles along with other modern gadgets. These, result in high per capita energy consumption and high emission of greenhouse gases. Interestingly, despite having a relatively higher and more technically efficient municipal governance system and greater revenue-generating capacity, these cities do not exhibit significantly higher levels of garbage treatment.
Associations Between Urbanisation, Urban Poverty, Access to Amenities and Environmental Sustainability.
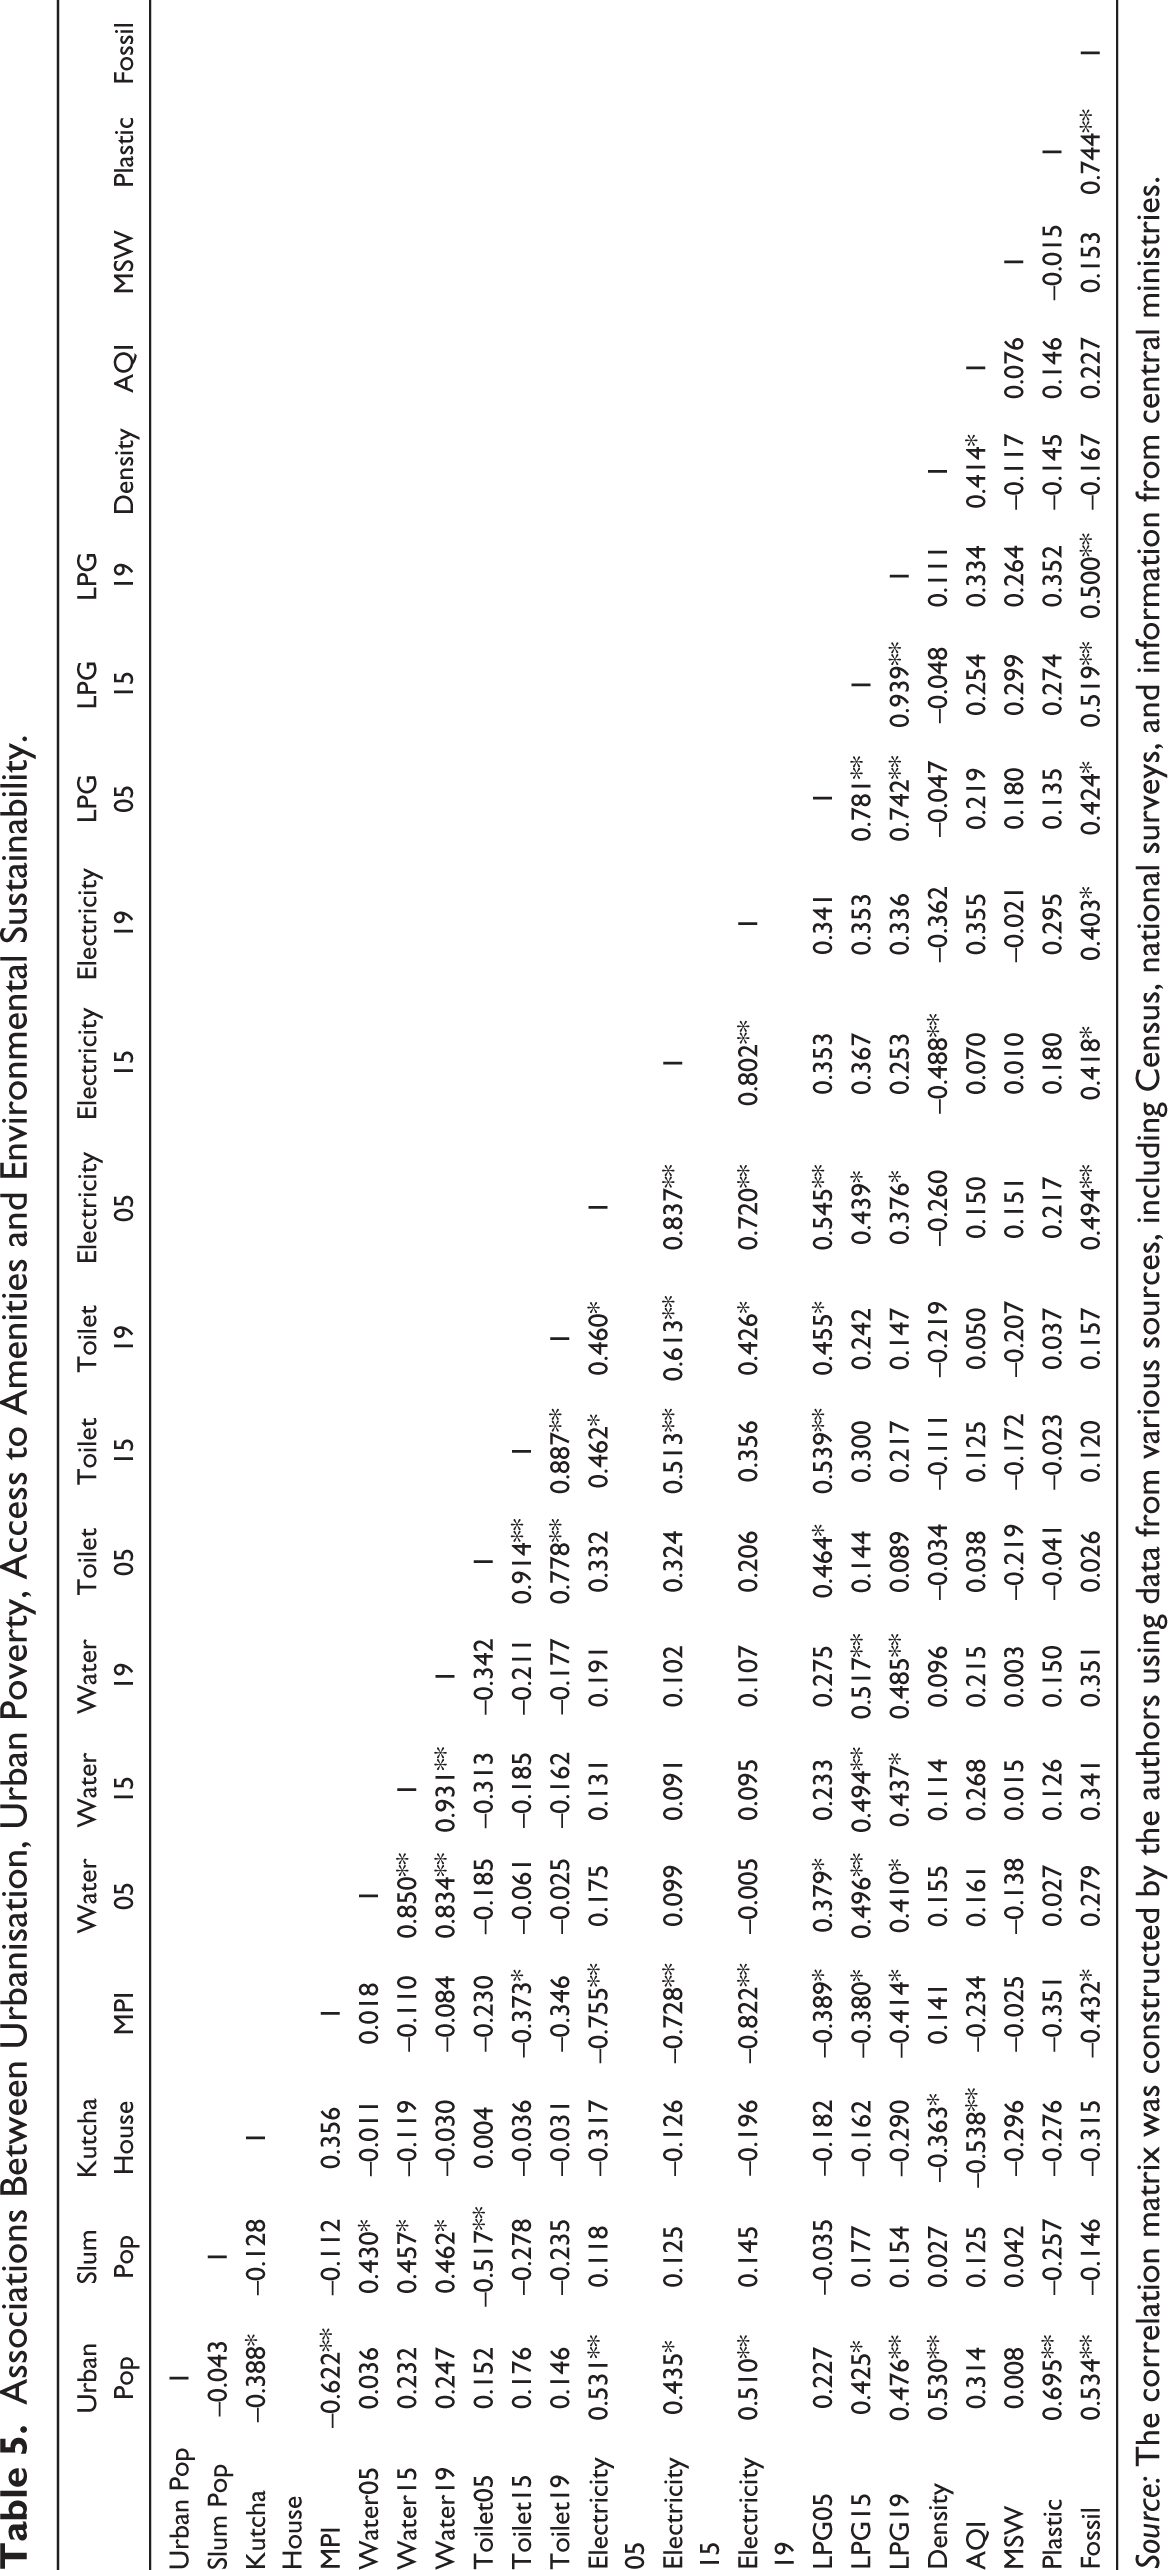
Source: The correlation matrix was constructed by the authors using data from various sources, including Census, national surveys, and information from central ministries.
These underline the need for more comprehensive environmental planning to address the challenges posed by high levels of urbanisation, particularly the concentration of people and economic activities in large metropolitan agglomerations.
Do urban poor and their lack of access to municipal basic amenities contribute to environmental degradation? State-level data do not support this hypothesis. It is, nonetheless, true that the states with high multidimensional poverty and high percentage of slum population tend to have low access to basic services. Specifically, the less developed states, such as Bihar, Uttar Pradesh, Jharkhand, Meghalaya, Madhya Pradesh, Uttarakhand, and Assam, record a high percentage of slum population, high multidimensional urban poverty, and low coverage of households through basic amenities. Notably, the correlations of the access to facilities like toilets, electricity, and LPG with urban poverty are negative and significant. These suggest high deficits for the poor not only in terms of income but also access to basic services, resulting in a dismal quality of life. The coverage of households through improved drinking water, however, does not go down with increase in poverty or slum population as its provisioning often gets determined through court orders and electoral compulsions. This, however, does not seem to happen as much in case of other amenities.
Happily, the analysis does not show any positive correlation between multidimensional poverty, slum population, kutcha housing, and so on with environmental stress. In fact, these generally turn out as negative. One would infer that the states with significant slum populations and high multidimensional poverty experience low environmental stress, suggesting that socioeconomic deprivations and substandard living conditions, including lack of access to improved basic amenities and energy resources, are not the significant contributors to environmental degradation or increased carbon emission.
The data reveal that the slum populations do not place much pressure on urban land and energy as compared to skyrocketing structures and the lifestyle of the people residing there. The demand of the latter for land and electricity for commercial, recreational, and mobility purposes work out as very high. The correlations of population density with the indicators of poverty, slums, kutcha housing, and so on work out as negative in contrast to its positive relations with indicators of urbanisation and concentration of urban population in large cities. The low correlation between the percentage of urban poor and environmental stress implies that their presence in cities and towns does not pose a challenge to environmental sustainability.
Issues of environmental degradation and inequity in access to basic services are undeniably important areas of concern in urban contexts. The manifestations of the problem, nonetheless, are serious in the highly urbanised states of the country where a few large cities account for much of the urban population. These states are able to provide basic amenities of reasonable quality to their urban dwellers, but here, the proportions of poor are relatively low, and they live in segmented pockets and peripheries. In contrast, urban poverty and multidimensional deprivation are high in less developed states and smaller towns, where indicators of basic amenities show high deficits, but environmental stress levels are comparatively less. However, keeping the poor and slum population in dehumanised living conditions without access to basic amenities poses moral as well as legal issues. Addressing the problems related to slum populations and multidimensional poverty, therefore, holds the key to fostering a more environmentally sustainable and equitable urban society as envisaged in the Constitution of India and stipulated in the SDGs.
Conclusion
India’s journey of planned development over the past seven and a half decades has resulted in marked changes in the landscape and morphology of urban development. As the process continues, we see unfolding of multifaceted challenges and opportunities. The availability of basic amenities at national and state level and their access to bottom segments of urban population and slum dwellers have shown significant improvements during the past one and a half decades, reflecting a movement in the right direction. Despite these, access of the poor to toilet facilities and clean cooking fuel emerges as an area of policy concern. This requires targeted policy interventions to bring about greater equity of access across households in different economic brackets and ensure that struggle of the poor for survival does not lead to excessive use of non-renewable resources, resulting in environmental degradation at micro level. The analysis of the trends and pattern of urbanisation, access to amenities and the governance systems provides insights into the complex interplay among these and helps to identify the directions of solution for environmental sustainability.
An analysis of the relationship between urbanisation and sustainability reveals that with the current process of urbanisation, the problem of unequal access of the poor to basic amenities and environmental degradation linked with high density, poor air quality, excessive use of plastics, and deficits in treatment of municipal waste have become critical. Large cities in highly urbanised states, that have seen a decline in the share of the poor, due to exclusionary urbanisation, emerge as significant contributors to the environmental stress. The less urbanised states, with large segments of their urban population residing in small and medium towns, on the other hand, have fewer problems on the environmental front. However, here, a large section of urban households, particularly the poor, get left out of the coverage of basic amenities. This underlines the need for comprehensive environmental policies in the context of providing basic services.
Contrary to the expectation that urban poverty and denial of access to amenities to the slum dwellers contribute to environmental degradation, the analysis indicates that the states with high urban multidimensional poverty and large slum populations do not exhibit high environmental stress. This suggests that given the present urban morphology, the presence of the poor in cities and towns is not creating problems of environmental degradation that cannot be instantly addressed, provided their deficits in amenities are covered. This emerges as a solution for the twin problems of equity and sustainability in urban development.
The study further reveals that there has been notable progress in improving access to basic amenities in backward states and to the households in the bottom 20 per cent of the asset category. Substantial deficits still exist, particularly in access to toilet facilities and clean cooking fuel. The Swachh Bharat Mission and the Pradhan Mantri Ujjwala Yojana have been important interventions towards meeting the deficits. Although the coverage of households has gone up significantly, quality, affordability, and maintenance remain the problems for the poor.
India’s journey of sustainable urbanisation cannot be that of progress in linearity. The policymakers would have to pause, rethink, and redesign the strategies to bring in appropriate course corrections at this critical juncture. Although there has been commendable progress in increasing the coverage of basic amenities in recent years, there are emerging challenges of reaching out to the poor and vulnerable, and of sustainability. As India strives to remain one of the fastest growing economies of the world till 2050, reaching the threshold of 50 per cent urbanisation, there must be comprehensive strategies to provide equitable working and living space to one and all, by improving the coverage and quality of basic amenities along with livelihood opportunities. This alone can pave the way for a more inclusive and sustainable urban future.
Footnotes
Declaration of Conflicting Interests
The authors declared no potential conflicts of interest with respect to the research, authorship and/or publication of this article.
Funding
The authors received no financial support for the research, authorship and/or publication of this article.