
Abstract
This study investigates the extent of regional concentration and global interconnectedness in international tourism flows using network science analytical tools. To this end, we algorithmically detect international tourism communities and investigate whether tendencies toward regionalization and globalization differ across different communities and groups of countries. A cross-country dataset consisting of 190 origin and destination countries over the period 1995 to 2021 is used for the empirical analysis. The results show that the international tourism network is predominantly regionally concentrated, and this pattern has strengthened over time. Our findings highlight that mesoscale network structures in tourism can serve as a foundation for predicting future tourism trends. This challenges the notion that this sector is primarily driven by globally interconnected factors. Policies promoting international destination marketing on a regional basis and collaboration in marketing regional tourism destinations can help countries gain a competitive edge, such as reaching a wider audience.
Introduction
Is tourism truly global? Has tourism become more global over time? At first glance, the answers to these questions might seem straightforward and obvious. On the one hand, travelers often pick nearby destinations due to their geographical and cultural proximity (McKercher et al., 2008; L. E. Okafor et al., 2018), suggesting that tourism patterns are likely to be regionally concentrated. On the other hand, many view tourism as a primary beneficiary of globalization, as higher incomes, cheaper flights, and digital platforms appear to make travel increasingly “borderless” (Song et al., 2018). These two forces point in different directions. If most travel is short-haul, tourism may be regionally clustered. Yet if globalization drives travel, long-distance links should dominate. Thus, whether tourism is globally interconnected as commonly assumed or whether regional patterns dominate remains an open empirical question that has not been addressed in the extant literature. With international tourist arrivals expected to grow over the years, the answers to the above-mentioned questions are not only relevant from an academic perspective but also important from a policy and managerial perspective. Understanding the patterns of tourism flows can help policymakers and managers alike to allocate resources effectively and maximize the economic and social benefits of travel. It can help guide decisions on infrastructure spending, marketing budgets, airline route planning, regional cooperation agreements, and sustainability measures.
From a theoretical perspective, one can argue that the forces of globalization significantly contribute to an increasingly interconnected tourism landscape, where advancements in transportation, communication, and digital platforms have made distant destinations more accessible and desirable (see, e.g., Doorly, 2020). This perspective aligns with the idea that as global connectivity expands, so does the potential for tourism to become a truly borderless phenomenon, encouraging a global flow of tourists not limited by regional limitations.
Evidence from the literature suggests that tourism is also driven by cultural similarity, linguistic and geographic proximity, and shared historical ties (see Gidebo, 2021; Park et al., 2023; Zhou & Zhou, 2022). This implies that tourists often prefer destinations with familiar linguistic, cultural, and culinary elements. These preferences create regional clusters within the broader global tourism network, where travelers exhibit tendencies to favor nearby or culturally similar destinations. This duality—where globalization facilitates long-distance travel, yet regional affinities shape tourism patterns—indicates that tourism might be both a global and a regional phenomenon, warranting further empirical investigation to understand the relative influence of each force on international tourism flows.
Understanding the real nature of international tourism flows—whether they are regionally concentrated or globally distributed—is also crucial from a policy perspective. Tourism is widely recognized by governments, development agencies, and key stakeholders as a key driver of regional growth and economic development. Consequently, funds are frequently allocated to support tourism initiatives, including infrastructure development, brand marketing, and the creation of collaborative networks, all designed to enhance a destination’s competitive edge (Calero & Turner, 2020; Telfer, 2014; Thommandru et al., 2023). The ensuing competitive environment among different destinations is aptly described as “place wars” by Kotler et al. (1993), as the promotion of unique destination identities is fundamental to tourism, which remains inherently location-dependent. The focus of these identities can be at the international, sub-national, or local level. Accordingly, developing a distinctive and competitive place identity is central to tourism marketing and promotional efforts (Dredge & Jenkins, 2003).
Hence, erroneously assuming that globalization has homogenized tourism patterns worldwide can lead to inefficient use of scarce resources. The possibility of developing flawed plans increases significantly if relevant economic agents are unaware that tourism flows are more regionally concentrated or globally interconnected. Consequently, the structure of tourism networks has significant implications for economic development, cross-cultural engagement, and the long-term sustainability of the tourism industry. Furthermore, mapping and analyzing the structure and evolution of international tourism flows can provide insights into how tourism opportunities are globally or regionally distributed and how tourism connections might evolve in the future.
In view of the foregoing, we study the extent of regional concentration and global interconnectedness in international tourism flows by using a cross-country data consisting of 190 origin and destination countries over the period 1995 to 2021. We utilize a network approach for the empirical analysis. As discussed earlier, this investigation is critical for informing tourism development strategies. A central question in our analysis is whether tourism remains confined to tight-knit communities (i.e., regional concentration) or whether there are robust long-distance tourism links that act to bridge international tourism communities across the globe (i.e., global interconnectedness).
The investigation of network structures in the global tourism network is conducted at two levels of analysis, namely the whole network level and the mesoscale network level. That is, we capture the structures and time dynamics both in the international tourism network and in the individual tourism communities. At the mesoscale level, we examine whether the regional clusters within the global tourism network align with or diverge from established geographical regions. A strong alignment with geographic regions would indicate regional concentration, whereas a significant deviation would suggest global interconnectedness. We also investigate how these network properties have evolved over time.
More specifically, at the level of individual communities of international tourism, we seek to understand whether global tourism connectivity (as discussed in the literature, e.g., Baggio et al., 2010; Chung et al., 2020) has become more evenly spread across the world or if distinct trends dominate within different communities over time. If we find that an increase in global cohesion (through bridging tourism flows) across international tourism communities has contributed to increased integration of the global tourism network over time (as reflected by larger tourism flows across communities), it would be a sign of global interconnectedness. If we find an uneven distribution of global cohesion (through bridging of tourism flows) across the global tourism network, with some communities appearing as isolated from the rest of the network at the end of our observation period, in 2021, as they were at the beginning of our observation period, in 1995, then it would be a sign of heterogeneous network structure. While not at the core of our research focus, our analysis spans nearly three decades, including the COVID-19 pandemic (years 2020–2021). This also allows us to gain insights into how the structure of the international tourism network changed during the global health crisis.
This study contributes to the literature in several ways. This is the first study to explore the extent of regional concentration and global interconnectedness in international tourism flows using large cross-country data. Our model of international tourism networks allows us to conceptualize the notions of “regionalization” and “globalization” as emergent properties of the clusters of countries and tourism flows identified in the international tourism network, and not as a priori attributions of countries in their geographical positions. Our approach, relying on an algorithm for community detection rather than predefined regional groups, reveals how results can differ when assumptions about regional groupings are relaxed. For similar arguments in the context of trade networks, see Russo et al. (2023).
This study adds to the strand of literature that deals with the distance-tourism nexus. For instance, McKercher et al. (2008) show that 80% of international travel takes place between country pairs within 1,000 km apart. Similarly, McKercher and Mak (2019) document that the share of travel to land neighbors accounts for 53% of outbound travel. Using network science analytical tools, this study builds on the distance-tourism strand of literature by considering whether tourism is global or regional. Unlike studies investigating the impact of distance on international tourism demand or flows, we focused on examining whether the international tourism network is more regionally or globally concentrated over time and considering both global- and meso-level patterns of the international tourism network.
Furthermore, while some studies argue that tourism is regional from a distance perspective (McKercher et al., 2008; McKercher & Mak, 2019), evidence from extant literature suggests that tourism can be both global and regional. For instance, theoretical conjectures suggest that rapid improvements in transportation networks, digital platforms, and communication have contributed to lower costs of tourism services, and thus promote travel to distant countries (Doorly, 2020). Similarly, drivers of globalization such as increasing incomes, reduced trade barriers, consumerism, international education, employment opportunities abroad, the spread of regional free trade agreements, population increase, among others, can act to increase travel to distant destinations (Dwyer, 2015). In contrast, there is some evidence that tourists are influenced by cultural affinity, shared historical connections, language, and geographical closeness (Gidebo, 2021; Park et al., 2023; Zhou & Zhou, 2022). This aligns with the notion that tourists tend to travel to nearby destinations due to cost, time, familiarity, and ease.
In addition, this study also extends the literature that relates to tourism networks. For instance, Chung et al. (2020) use cross-country data for 124 countries over the period of 2000 and 2013 to document that tourism networks at the global level have become greatly consolidated over time. However, their study focuses on the number of communities over time and differs in scope from the present study. Similarly, Shao et al. (2020) use network analysis of tourism flows for 221 countries/regions over the period of 1995 to 2018, with a focus on node-level properties of the tourism network, that is, individual countries’ centrality measures, unlike the present study. Although relevant for ranking countries, the centrality measures do not provide information about the meso-level network structures. They find that the tourism network has become denser overall, but it still does not inform us whether this is equally distributed or whether it is globalized or localized in particular regions/communities. Additionally, Xu et al. (2022) and Liu et al. (2025) focus on detecting communities in two regional case studies, that is, in the Yangtze River Delta urban agglomeration and Tibet, respectively, but without considering the extent of internal or external ties at the network meso-level. Besides, Williams et al. (2017) do consider meso-level properties of a tourism network, yet their context is electronic word-of-mouth networks rather than international tourism flows.
While evidence suggests that tourism can be global and/or regional as discussed earlier, the issue of whether tourism is relatively more regional or more global and to what extent it changes over time has not been addressed in extant literature. This study contributes to the literature by addressing this gap from a network perspective. Unlike studies in extant literature, we utilized a set of tools, such as community detection and E-I indices, at two analytical levels: the whole network and the community (meso) level. Similarly, we also examined the global and meso-scale properties of the international tourism network over time to gain deeper insights. This approach enables us to consider global and local structures in a single empirical framework, which is important, as research suggests that characteristics observed at the meso-level, that is, within individual communities, can vary significantly from those of the whole network (Brito-Montes et al., 2022). By explicitly focusing on both global and meso-scale properties of international tourism flows, we answer the call from Chung et al. (2020) for more research linking global and local aspects of tourism networks.
The remainder of this study is structured as follows. Section 2 presents an overview of the theoretical debate and the related literature, followed by a description of the data and methodology in Section 3. Section 4 discusses the results of the analysis, followed by the concluding remarks.
Theoretical Background and an Overview of the Related Literature
The question of whether tourism is truly global or remains regionally concentrated relates to broader debates about globalization and regionalization, encompassing trade flows, capital movements, and both temporary (tourism) and permanent (migration) cross-border movement of individuals. Both trade and capital flows are key determinants of cross-border tourism (see, e.g., Çalışkan et al., 2019; Gopalan et al., 2024). As a result, shifts in capital and/or trade patterns tend to affect how tourists move around the globe. Below, we briefly discuss evidence in the context of both the globalization and regionalization of trade flows, capital flows, and tourist flows. This allows us to highlight how shifts in trade and capital patterns can spill over to tourism flows, followed by a theoretical explanation of why tourism may exhibit unique patterns shaped by both global and regional forces.
Trade
Research indicates a move toward regionalization in international trade, despite an overall increase in global trade. While the world trade network has become denser, with countries engaging more widely with trade partners (Kim & Shin, 2002), intraregional ties have strengthened more significantly compared to interregional ones (Kim & Shin, 2002; Maha et al., 2008). This regional integration is particularly prominent in Europe, North America, and East Asia, where trade openness is converging more rapidly within regions than globally (Chortareas & Pelagidis, 2004).
Moreover, a key factor in this shift is the rise of protectionist policies and geopolitical tensions, exemplified by the U.S.-China trade war. Baldwin and Freeman (2022) highlight how this conflict disrupted global supply chains, prompting countries to prioritize regional trade agreements like the Regional Comprehensive Economic Partnership (RCEP), to maintain economic stability within a more predictable regional framework. The strategic rivalry between the US and China, along with challenges to the World Trade Organization (WTO), may further accelerate this trend toward deglobalization (García-Herrero, 2019). However, it is crucial to recognize that globalization and regionalization are not mutually exclusive, as both intraregional and interregional trade densities have increased over time (Kim & Shin, 2002).
The COVID-19 pandemic has further propelled the shift toward regionalization, especially in trade and supply chains. The pandemic exposed the vulnerabilities of global supply chains, leading businesses to pivot toward regional supply networks to enhance resilience. Gereffi (2020) notes that companies have restructured their supply chains, opting for shorter supply routes and reduced reliance on distant markets, favoring regional partners who offer more reliable and responsive support during crises.
These shifts in global and regional trade structures have clear implications for tourism flows. Trade liberalization and regional trade agreements often coincide with relaxed visa rules, improved transport connectivity, and increased business travel, all of which stimulate cross-border tourism (Khalid, Okafor, & Burzynska, 2022). For instance, the formation of common markets such as the EU or GCC not only results in greater trade flows but also encourages greater tourist flows due to the free movement of people across member borders. In the ASEAN bloc, the formation of the ASEAN Economic Community has coincided with rapid growth in intra-ASEAN travel (Wong et al., 2011). Likewise, regional supply chain dependence can potentially lead to increased intra-regional mobility, including for leisure purposes, further reinforcing regional patterns in tourism flows.
Capital Flows
Capital flows are increasingly becoming regionally focused as investors navigate the volatility of global markets. There is a noticeable shift in investment flows favoring regional financial markets, driven by their perceived stability and familiarity (Lane & Milesi-Ferretti, 2017). This trend is reinforced by the rise of regional financial hubs, such as Singapore in Southeast Asia and Dubai in the Middle East, which have built robust infrastructures that attract and sustain regional investments. The growing concentration of capital flows within specific regions reflects a broader trend of regionalization in economic activities, where businesses and investors seek stability and growth in a more localized context.
Kaminsky et al. (2020) find that regional factors are the primary drivers of booms and busts in capital flows, challenging earlier views that emphasized global influences. The significance of regional capital flows is further underscored by Kaminsky and Reinhart (2001), who, using the Asian financial crisis as a case study, show that increased financial interdependence and deeper regional financial sector linkages are among the main determinants of cross-border shock propagation. This shift toward regional capital flows highlights the increasing importance of regional dynamics in shaping global financial landscapes.
Similar to trade, changing patterns of capital flows can significantly influence tourist flows. Empirical evidence suggests that higher bilateral FDI flows lead to greater bilateral tourism flows (Gopalan et al., 2024). Capital flows are particularly important for tourism development, as they often finance integrated hospitality infrastructure and tourism services (UNCTAD, 2007). In addition, capital flows facilitate the transmission of information about a host country’s attractions, safety, and cultural offerings, reducing psychological and informational barriers to travel (Gopalan et al., 2024). Greater capital flows can also promote political stability within a region, as governments are incentivized to maintain peace and order to retain investment (Lee & Mitchell, 2012; Mihalache-O’Keef, 2018), an outcome that indirectly benefits the tourism sector. Moreover, stable macroeconomic conditions, such as lower exchange rate volatility due to regional investment (Chakrabarti & Scholnick, 2002), enhance cost competitiveness and improve the overall travel environment. In this way, capital flows not only reflect patterns of economic regionalization but can potentially shape regional tourism networks by enabling the development and accessibility of tourism-related services and destinations.
Tourism
While tourism is often characterized as a global phenomenon, several studies have highlighted the existence of regionalization trends with an increasing density of regional tourism networks and the preference for intra-regional travel. For instance, Milne and Ateljevic (2001) explore the complex relationship between tourism and economic development, emphasizing the “glocal” dynamics at work. They advocate for new approaches that incorporate cultural influences, networks, and technological advancements to better understand tourism’s economic impact.
Furthermore, tourism has undergone a significant regional shift, largely driven by the COVID-19 pandemic’s impact on international travel. Studies indicate a clear trend toward regional and local mobility in cultural tourism, with tourists showing a stronger preference for personalized and regional experiences (Duda, 2023). This trend was especially pronounced in Europe and North America, where intra-regional travel became the preferred option. Various factors are driving this shift, including safety concerns stemming from global threats like terrorism and a growing interest in the local cultural experiences (Yavuz & Savran, 2020).
Gössling et al. (2021) note that the COVID-19 pandemic led to a surge in domestic and regional tourism, as health concerns and travel restrictions pushed travelers to choose destinations closer to home. Additionally, growing awareness of the environmental impact of long-haul flights has fueled the rise of sustainable tourism, which often emphasizes regional travel. Peeters et al. (2019) suggest that this shift mirrors a broader change in consumer behavior, with travelers increasingly seeking eco-friendly options that are typically available within their own regions. These findings suggest that the tourism industry is adapting to evolving consumer preferences by focusing on regional distinctiveness within a global framework.
Taken together, the evidence suggests that tourism flows may be mirroring the regional shift already visible in trade and capital movements. While the global connectivity continues to grow, the density of ties may be shifting inward toward regional blocs. Increased regional trade and capital flows have lowered the informational and psychological costs of short-haul travel, as discussed earlier. In addition, the changing preferences of travelers toward culturally similar and geographically proximate destinations (Gössling et al., 2021; Peeters et al., 2019) imply that international tourism is potentially becoming increasingly regional, despite the forces of globalization easing travel constraints as discussed earlier.
Conceptualizing Globalization and Regionalization in Tourism
Traditionally, tourism has been viewed as an inherently international phenomenon driven by forces of globalization, including advances in technology, transportation, and information dissemination. The International Labor Organization (2001) suggests that globalization creates favorable opportunities for the growth of the tourism industry by encouraging the liberalization of air transport, the gradual removal of trade barriers in services, economic integration, information dissemination, advancements in communication technologies, and the widespread adoption of the Internet. These factors theoretically reduce geographic and cultural barriers, promoting seamless travel across regions and encouraging a global tourism network where travelers are no longer confined by regional preferences.
According to this perspective, tourism should naturally evolve toward greater global interconnectedness as destinations worldwide become accessible and appealing to diverse populations (Cohen & Cohen, 2012; Urry, 1990). Consequently, national boundaries may become increasingly irrelevant, borders more permeable, and the distinction between “domestic” and “international” tourism—traditionally defined by these boundaries—progressively less significant (Cohen & Cohen, 2012).
In contrast, it can be argued that in an increasingly globalized world, tourism flows may not be as unrestricted as globalization implies. Despite the forces of globalization, tourism often exhibits strong regional clustering due to factors such as linguistic familiarity, shared historical and cultural backgrounds, and the relative convenience of travel within closer geographic areas (Lew & Wong, 2004; Prayag & Hosany, 2014). From this perspective, regional preferences are expected to persist even as global connectivity increases, creating distinct clusters within the global tourism network. This suggests that tourism flows may not be as globally dispersed as often assumed and could be dominated by intra-regional travel patterns.
Moreover, economic and political factors also play a substantial role in shaping the structure of tourism networks. For example, visa restrictions, economic stability, and regional trade agreements often dictate the ease with which individuals can travel between countries, thus impacting the degree of global interconnectedness in tourism (Czaika & Neumayer, 2017; Khalid et al., 2020; Khalid, Okafor, & Burzynska, 2022). Additionally, wealthier countries with strong economies and robust travel infrastructure may attract international tourists more readily, while countries with restricted access or political instability may experience more localized tourism (Dwyer, 2015; Khadaroo & Seetanah, 2008; Steiner, 2007).
The concept of “glocalization” offers additional insights, suggesting that while global forces encourage international travel, local adaptations of tourism experiences often cater to regional preferences and cultural nuances. Robertson (1995) concept of glocalization posits that while global connectivity allows international travel, local preferences and cultural ties continue to guide tourist choices, creating a tourism landscape that is simultaneously global and local. Glocalization supports the idea that tourists may embrace both distant and nearby destinations but are often influenced by familiar cultural and linguistic connections, which may shape tourism flows into patterns of regional concentration within a broader global context.
The above discussion suggests that tourism may reflect both global and regional influences. Hence, a nuanced understanding of tourism flows is required, acknowledging that globalization and regionalization may operate concurrently within tourism networks. To capture this complexity, empirical studies on tourism flows should examine not only the overall interconnectedness of destinations but also the clustering tendencies that reflect these regional preferences, which is missing in the extant literature.
In this study, we utilize network theory to examine this duality and analyze how connections between destinations form clusters (regionalization) or bridges across distant regions (globalization). In network terms, a highly interconnected tourism network with numerous cross-regional links would reflect a globalized pattern, while strong intra-regional links with minimal external connections would indicate regional concentration. Using the social network analysis techniques allows us to measure the degree of clustering and connectivity within the tourism network, shedding light on whether tourism flows reflect a global or regional structure (Baggio et al., 2010; Newman, 2010).
Data and Methodology
Data and Network Construction
Data to construct our tourism networks and perform network analysis come from UN Tourism (World Tourism Organization, 2023). The dataset contains information on tourist flows from the country of origin to the country of destination from 1995 to 2021. 1 Tourist flow is captured by the number of international visitors who arrive during a given year in a given country and who are staying at least one night. Hence, a tourist is any visitor who stays at least one night in collective or private accommodation (United Nations and World Tourism Organization, 2008). By this definition, people transiting through a country are not considered tourists.
Formally, global tourism can be represented as a weighted network consisting of nodes N = 1,. . ., n and a valued n × n matrix g (adjacency matrix), where
To allow for meaningful interpretation of the results, our study is restricted to countries that appear in every year of our study period. We end up having information on pair-wise tourism flows between 190 origin and destination countries in the period 1995 to 2021, resulting in twenty-seven 190 × 190 matrices.
Methods
To answer our research questions, we combine visualization approaches with network science analytical tools to analyze the structure of the international tourism network (Abel & Sander, 2014; Danchev & Porter, 2018; Wasserman & Faust, 1994).
Visualization
First, we use visualization approaches to illustrate the structure of the international tourism network over time. Specifically, we use Circular Plots (Abel & Sander, 2014; Xu et al., 2022) to visually quantify the direction of international tourism flows and identify their spatial patterns across different country groupings. Circular plots were first adopted by Abel and Sander (2014) to visualize migration flows. Since then, this method of visualization has been used extensively to show patterns in migration flows (Abel, 2018; Qi et al., 2017), transition patterns between scientific sub-fields (Aleta et al., 2019), and patterns in scientific collaboration (Abel et al., 2019). Most recently, Xu et al. (2022) used this method to show tourism flows between regions in China.
As most tourism studies analyze tourist flows for one country or a group of countries and rarely focus on global patterns, there is scope to present and analyze global tourist flows using new methods. While there has been an emergent interest in tourism literature in analyzing tourism flows using network analytical tools, the visualizations of the whole tourism networks, thus far, typically show a large number of nodes (countries) and a high density of links between them (tourist flows; see, e.g., Chung et al., 2020) where patterns of flows across different country groups is not easy to detect. Therefore, to first investigate the patterns of tourism flows across country groups and time, we use circular plots. We use three different country groupings: (1) based on UN geographical regions as in Abel (2018); (2) based on detailed World Bank income groups; and (3) based on the UN development groups. Plots are produced using the migest R package (Abel, 2021). The size of each line in a plot is proportional to the number of tourists between two country groups, so that thicker lines represent larger tourism flows. The arrowhead indicates the direction of the tourist flow.
Community Detection
To capture the mesoscale network structures, we first disaggregate the world tourism network of 190 countries into so-called communities. Communities are mesoscale network structures consisting of nodes with strong internal connections that are connected relatively less strongly to the other nodes of the network (Wasserman & Faust, 1994). In the context of global tourism network, tourism community is a group of countries with dense internal tourism connections but sparse tourism connections to and from other countries in the network. What defines a community in network analytical terms, therefore, is strong tourism ties (compared to the rest of the world) rather than common individual characteristics of the countries.
Community detection, as a process of identifying subgroups of highly connected nodes within a network, is a popular class of methods in network science. While many community detection algorithms exist, in practice, just a few popular algorithms are typically employed (Fortunato & Hric, 2016). We apply the most widely-used method—the Louvain method, which was developed by Blondel et al. (2008). It has been commonly used to analyze trade, migration, and corporate networks (Cho et al., 2023; Danchev & Porter, 2018; Vitali & Battiston, 2014). In the context of tourism, it was used, for example, by Xu et al. (2022) to detect tourism communities in China. Some advantages of the Louvain algorithm include the suitability to analyze large networks with good scalability properties (Vitali & Battiston, 2014), the ability to take into consideration edge weights (Akbari, 2021), and avoiding ex-ante assumptions on community size (Lancichinetti & Fortunato, 2009).
The Louvain method is based on modularity optimization (Akbari, 2021; Danchev & Porter, 2018). Modularity quantifies the density of links within communities compared to links between communities, and we optimize modularity using the Louvain algorithm to detect community structures in international tourism networks. The original Louvain algorithm is defined for undirected networks using a standard modularity function (Blondel et al., 2008). This means that our international tourism networks have to be symmetrized first before we can apply the Louvain algorithm. However, we preserve edge weights—the weights of reciprocal edges are summed into a single undirected edge. The Louvain algorithm then optimizes weighted modularity, which can better reflect the intensity of tourism connections than the unweighted version. We follow this approach for two main reasons. First, the original Louvain algorithm can work well for reciprocal networks, that is, where links are mutual (as it is often the case for tourism flows), as symmetrization is a common approach when applying the Louvain algorithm (see, e.g., Brito-Montes et al., 2022; Gorgoni et al., 2018; Williams et al., 2017). Second, this approach has also been used before in the context of tourist flows (see Xu et al., 2022).
As robustness, we also consider another community detection algorithm—Infomap—which is based on dynamics rather than optimization (Fortunato & Hric, 2016; Rosvall & Bergstrom, 2008). Specifically, it employs a flow-based, information-theoretic clustering technique known as the map equation to reveal significant structures in a network and can explicitly handle the directionality of the links (Rosvall & Bergstrom, 2008). Both Louvain and Infomap algorithms have been shown to perform better against a class of benchmark graphs (Lancichinetti & Fortunato, 2009). Following Danchev and Porter (2018), both in the main and in the robustness analyses, we exclude communities that consist of two or fewer countries.
E-I Index
To measure the extent of regional concentration and the extent of global interconnectedness among tourism communities, we calculate a series of E-I indices. This approach allows an assessment of the degree of regional concentration and global interconnectedness in tourism by measuring how much of the total tourism flows of a specific tourism community is within the community or across communities. In network science research, the E–I index is frequently used to quantify the degree of cohesion between groups, both internally (i.e., local or regional cohesion) and externally (i.e., global cohesion) (Rawlings et al., 2023). Specifically, we compute the weighted version of the E-I index introduced by Danchev and Porter (2018). Instead of migration flows, we use tourism flows as weights. We calculate:
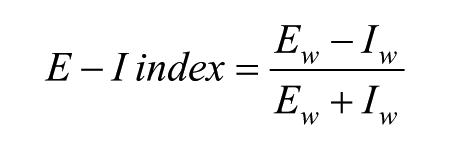
The weighted E-I index compares the size of
We calculate E-I indices at the network and community levels. At the network level, we calculate the E-I index for the whole global tourism network in each year to capture the extent of local and global cohesion given the community structures identified by maximizing multilayer modularity for our tourism network as described in the previous sub-section on “Community Detection”. At the community level, we follow the approach of Gorgoni et al. (2018) and calculate the weighted E–I index at the country level and then take the average of those for each community. As the E–I index at the group level is sensitive to the size of the group (Borgatti et al., 2022), this approach normalizes the community score by the number of countries in the community. Equipped with the E-I score for each community across years, we can investigate variations in their local and global cohesion.
Results
Visualizing Tourism Flows Across Geographical Regions and Country Groups
We visualize tourism flows across geographical regions and country groupings using circular plots. To capture any significant changes over time, we report results for five selected years, namely 1995, 2010, 2019, 2020, and 2021. In general, the topological characteristics of tourism network change quite gradually, so the selection of specific years for display does not affect the general conclusions drawn from the analysis (see similar conclusions for trade networks in Fracasso et al. (2018)). However, we purposefully report both 2020 and 2021 to take into account the potential effect of the COVID-19 pandemic that disrupted tourism at an unprecedented scale at the end of our sample period.
Figure 1 shows international tourism flows between geographical regions. Three key features stand out. First, in most of the regions, the majority of tourism flows occur between countries within the region. Specifically, that is the case for the following six regions: Europe (67.9% in 2019), Eastern Asia (84.5% in 2019), Northern America (35.5% in 2019), East Europe and Central Asia (61.6% in 2019), Western Asia (34.3% in 2019) and Africa (40.2% in 2019). Second, the minority of regions tend to attract more tourism flows from countries outside the region than inside the region. Specifically, that is the case for the following two regions: Latin America and the Caribbean (with the majority of tourism flows, 56.2%, coming from Northern America in 2019) and Oceania (with the majority of tourism flows, 42.7%, coming from Eastern Asia in 2019). Third, the patterns of tourism flows based on geographical regions have been largely stable over time. The main change in patterns in the years 1995 to 2019 relates to Africa, where at the beginning of the observation period, in 1995, most tourism flows (43.5%) originated in Europe, whereas intra-African flows already constituted a close second (with 40.3%). In subsequent years, the balance shifted toward intra-African flows and remained like that till the end of our observation period.
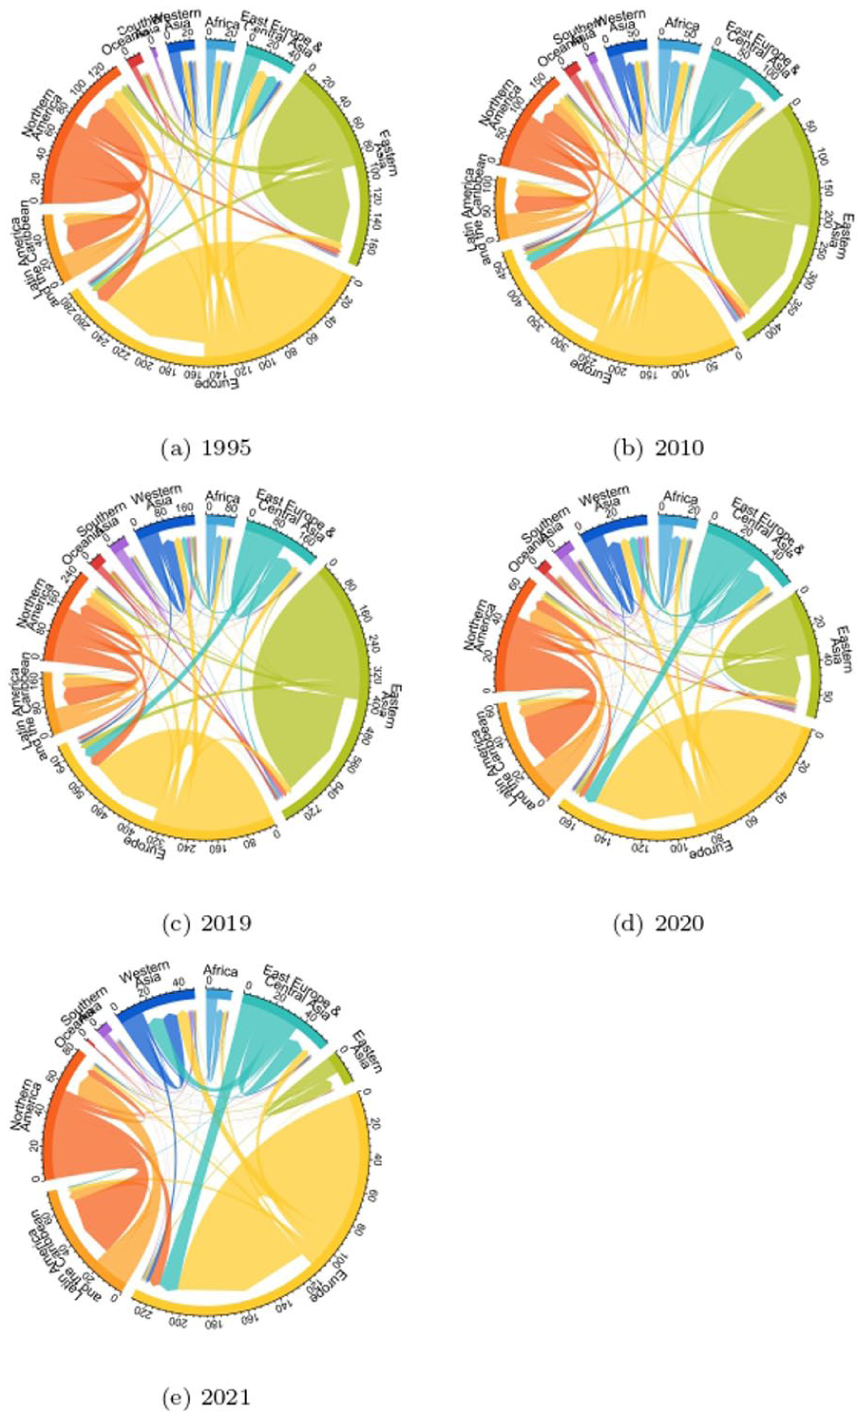
Circular plot of tourism flows between and within geographical regions in selected years. Tick marks show the number of tourists (inflows and outflows) in millions: (a) 1995, (b) 2010, (c) 2019, (d) 2020, and (e) 2021.
Other changes in patterns only happened in the last 2 years of our sample period, signaling the potential influence of the COVID-19 pandemic in those regions. Specifically, there is the rising prominence of Eastern Europe and Central Asia as a source of arrivals to Europe: they have become the second largest origin region (after intra-European flows), while Northern America has moved to third. Moreover, Latin America and the Caribbean overtook Northern America as the leading source region for Northern America. Finally, in 2021, Eastern Europe and Central Asia became the most dominant origin regions for Western Asia, pushing inflows from Western Asia itself as well as Europe to second and third place, respectively.
Figure 2 shows patterns of international tourism flows based on UN development groups. Similar to the flows based on geographical groupings, most tourism flows occur within country development groups. That is, more developed countries receive most tourism flows from countries in the more developed group (77.6% in 2019) and less developed countries receive most tourism flows from countries in the less developed group (63.8% in 2019). Only countries in the least developed group receive the most inflows from countries outside of their group—most inflows are from countries in the less developed group (73.3% in 2019). These patterns are largely persistent over the years. The only change in those patterns is at the end of our observation period, where in 2020 and 2021, we observe that less developed countries receive most tourists from more developed countries (64.5% in 2021) instead of less developed countries, as was the case in the earlier years (drop from first to second place with 33.4% in 2021).
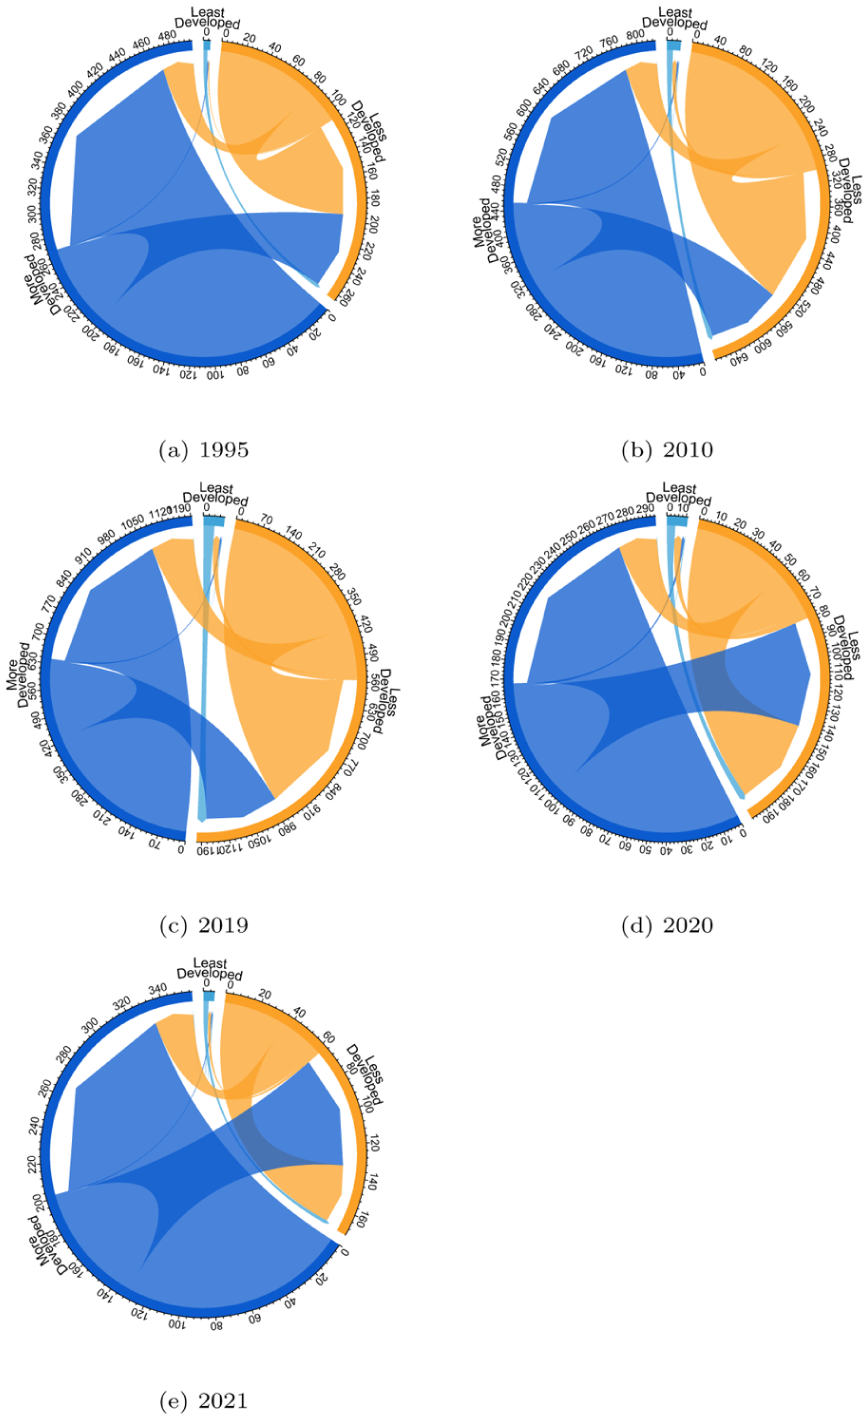
Circular plot of tourism flows between and within UN development groups in selected years. Tick marks show the number of tourists (inflows and outflows) in millions: (a) 1995, (b) 2010, (c) 2019, (d) 2020, and (e) 2021.
Figure 3 shows patterns of international tourism flows based on the World Bank income groups. High-income countries predominantly receive tourists from other high-income countries (73.1% in 2019). Upper-middle-income countries receive most tourists from high-income countries (64% in 2019). Lower-middle-income countries receive most tourists from high-income countries (41.4%). These patterns are stable over the years, including the pandemic years of 2020 and 2021. Specifically, high-income countries receive 79.3% of tourist flows from other high-income countries in 2021. Upper-middle-income countries and lower-middle-income countries receive 68.1% and 34.4%, respectively, of tourism flows from high-income countries. However, there are noticeable changes in patterns over time for the low-income group. In particular, low-income countries received the most tourists (48.3%) from high-income countries in 1995. In 2010, most tourists (44.4%) came from upper-middle-income countries. In 2019, most tourists were from lower-middle-income countries (32.6%). This pattern continued in the pandemic years. For example, 46.3% of tourist flows were from lower-middle-income countries in 2021.
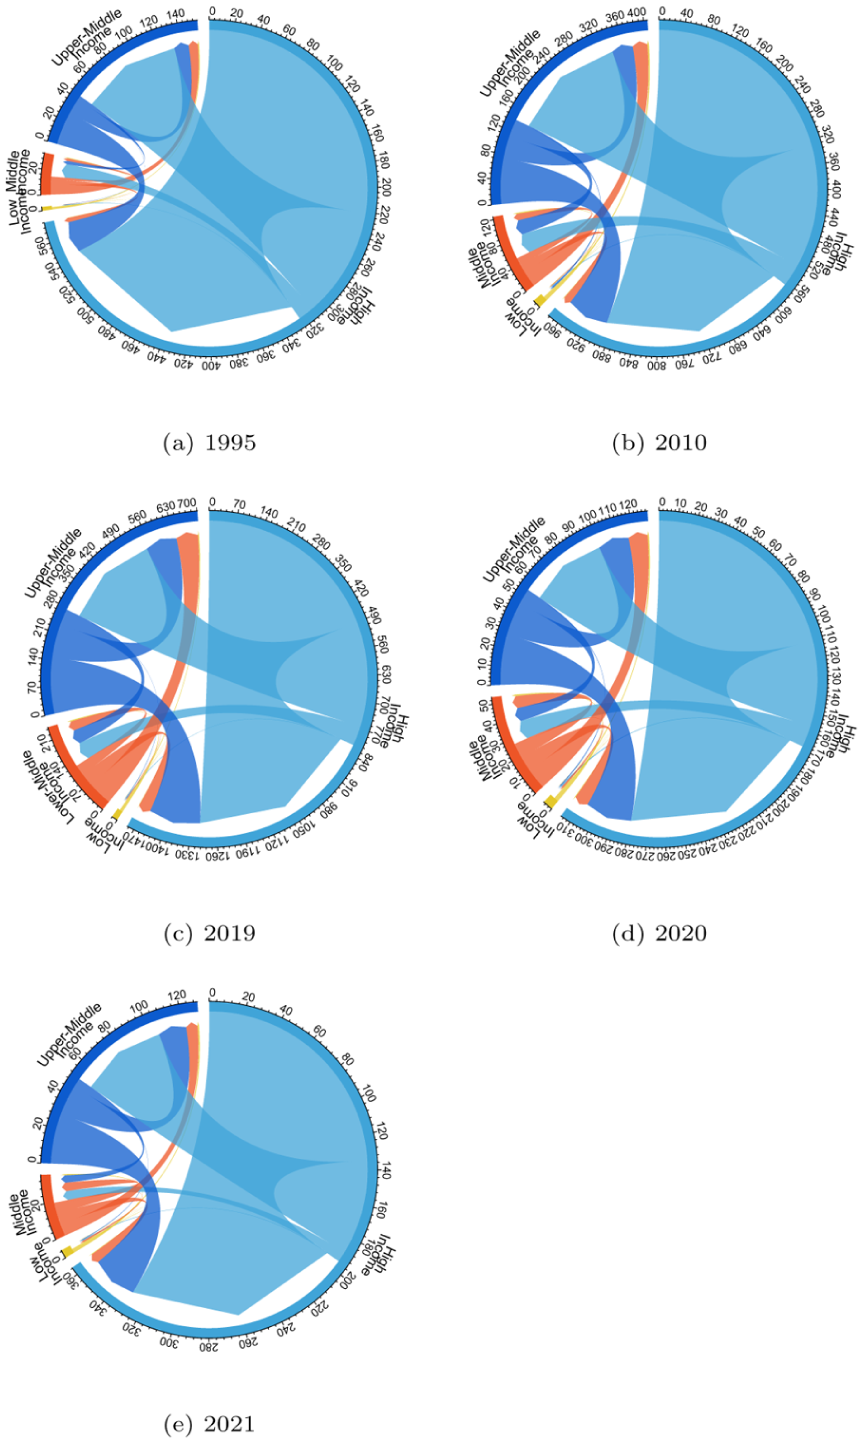
Circular plot of tourism flows between and within World Bank income group in selected years. Tick marks show the number of tourists (inflows and outflows) in millions: (a) 1995, (b) 2010, (c) 2019, (d) 2020, and (e) 2021.
Mapping International Tourism Communities
The analysis has so far focused on tourism flows within and between geographical regions and country groupings based on income and development. Overall, the analysis suggests that most international tourism flows are confined to countries within the same group, and these patterns are largely persistent across time. To further analyze the network properties of international tourism flows, we focus now on international tourism communities.
Figure 4 presents world maps of community assignments for selected years based on the Louvain algorithm. Geographic boundaries play an important role in shaping the structure of most communities in all the years. For the year 1995, we detect three cross-continental communities that overcame geographic constraints. This pattern occurs in Community 1, which includes countries in Europe and Africa; Community 2, which includes countries in Asia and Australia; and Community 5, which includes countries in Asia and Africa. Over the subsequent years, other communities, including countries from different continents, emerge (e.g., community 6 in the year 2000). In 2000, we start observing a community including both North and South America (community 4 in that year). This finding indicates that international tourism communities are not necessarily confined to the world’s continental boundaries.
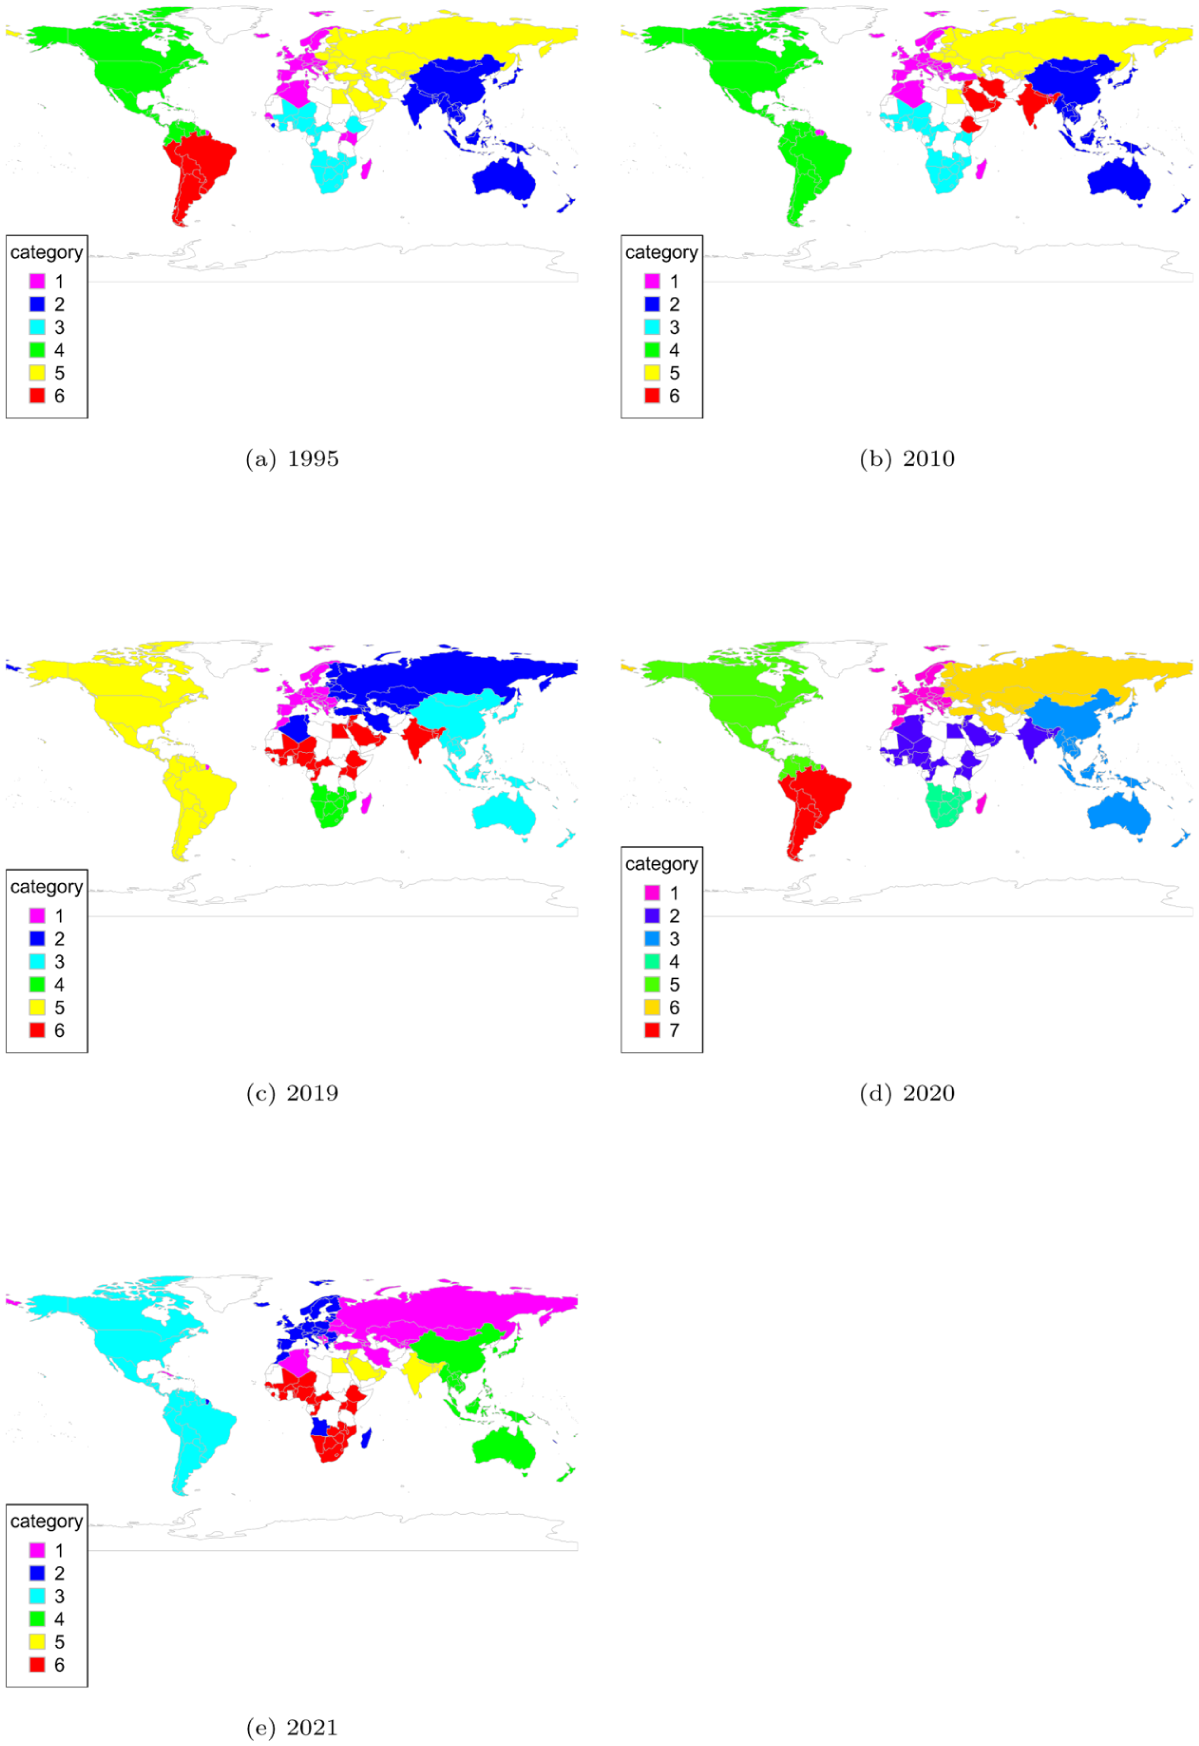
International tourism communities detected with the Louvain algorithm using a 190-country sample: (a) 1995, (b) 2010, (c) 2019, (d) 2020, and (e) 2021.
Figure 5 plots the number of detected communities over time. Overall, the number of tourism communities fluctuates between 5 and 8 communities over the sample period. We detect six international tourism communities in 1995. Afterward, the number increases to 8 in 2004, then decreases to 5 in 2010, reaches 7 in 2020, and then goes down to 6 in 2021. Overall, we do not observe a clear downward trend in the number of communities, which could suggest increasing globalization of tourism over the years. Instead, the fluctuations in the number of communities with stabilization observed in the second half of our sample period may signal underlying regionalization trends. In particular, the increase in the number of communities in the period 1995 to 2004 may suggest that tourism was becoming more regionalized at the beginning of the sample period. Then, there was a period of 2005 to 2010 with some decline in the number of communities, which could be an evidence of globalization forces becoming stronger. However, since 2011, the number of communities increased again to 7 and then stabilized at 6 (except for 2020, when there were 7 communities again, likely due to the COVID-19 pandemic). Overall, the trends in the partition of the network are not clear-cut, suggesting that over the years, both regionalization and globalization forces were at play.
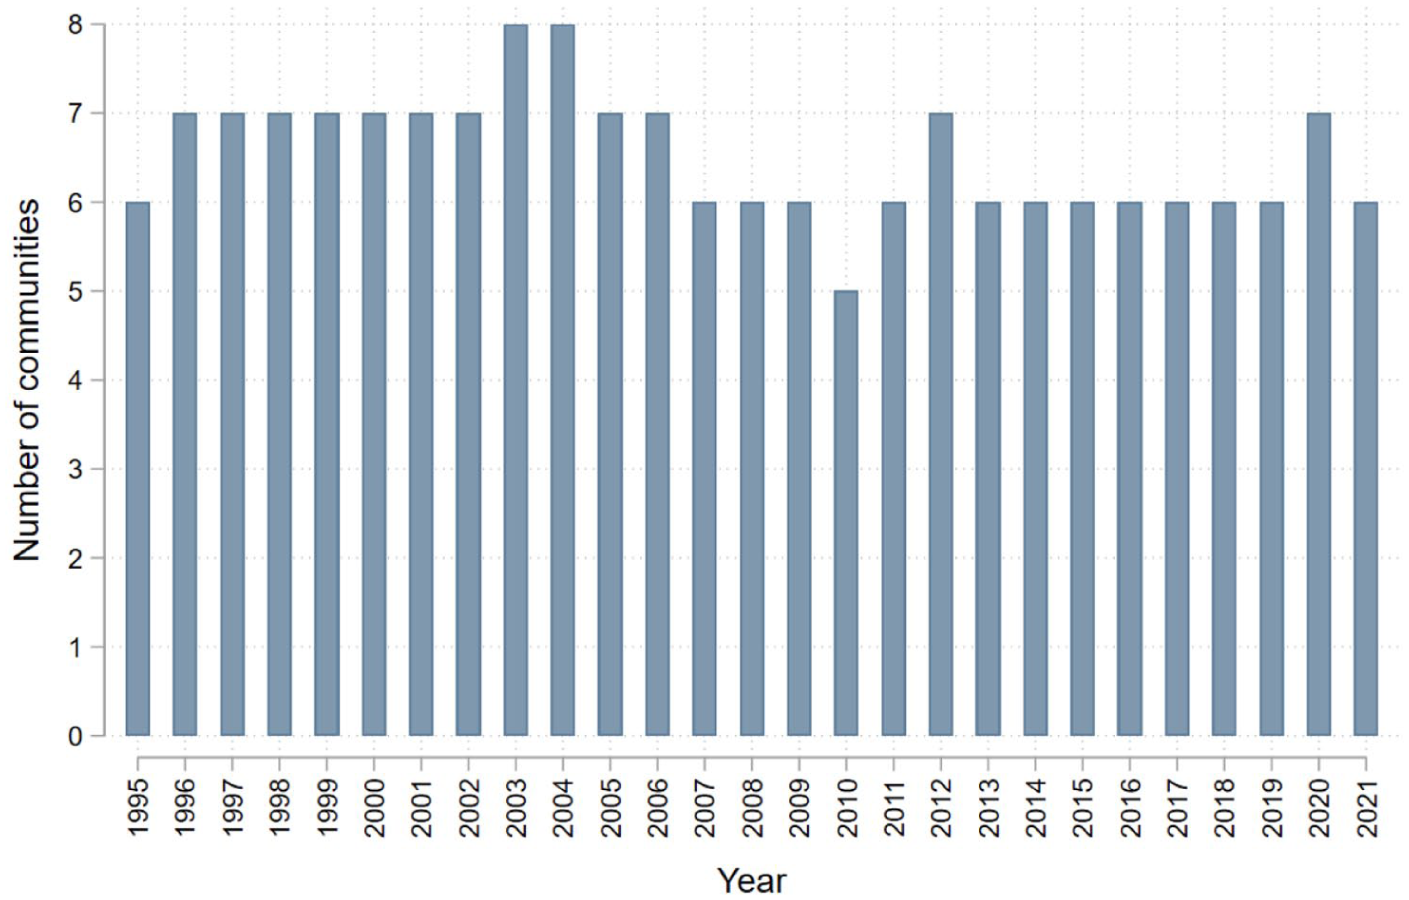
Number of international tourism communities detected with the Louvain algorithm over time.
E–I Indices at the Network Level
We now aim to more formally evaluate the level of fragmentation within the global tourism network. This allows us to ascertain whether tourism activity is confined within specific regions based on either network community structure (Communities) or country groupings based on geography (Geographic Regions), income (WB Income Groups), or development (UN Development Groups). Additionally, we examine the degree to which those patterns of global and local integration have changed over time.
The results presented in Figure 6 suggest that international tourism communities that we detected by maximizing modularity using the Louvain algorithm contain substantially more tourism flows within communities than between them. This is because in all the years, the weighted E-I index is negative. Moreover, the importance of inter-community over intra-community tourism flows has decreased during the period of 1995 to 2021, implying decreasing global connectedness and increasing regionalization in the tourism network over time. The E-I index in the communities detected by maximizing modularity using the Louvain algorithm decreases from −0.5525 in 1995 to −0.6235 in 2021. Additionally, the E-I index fluctuates over our observation period (with higher levels in the years 1997, 2005–2006, and 2008) but remains rather stable till 2019, when it decreases significantly.
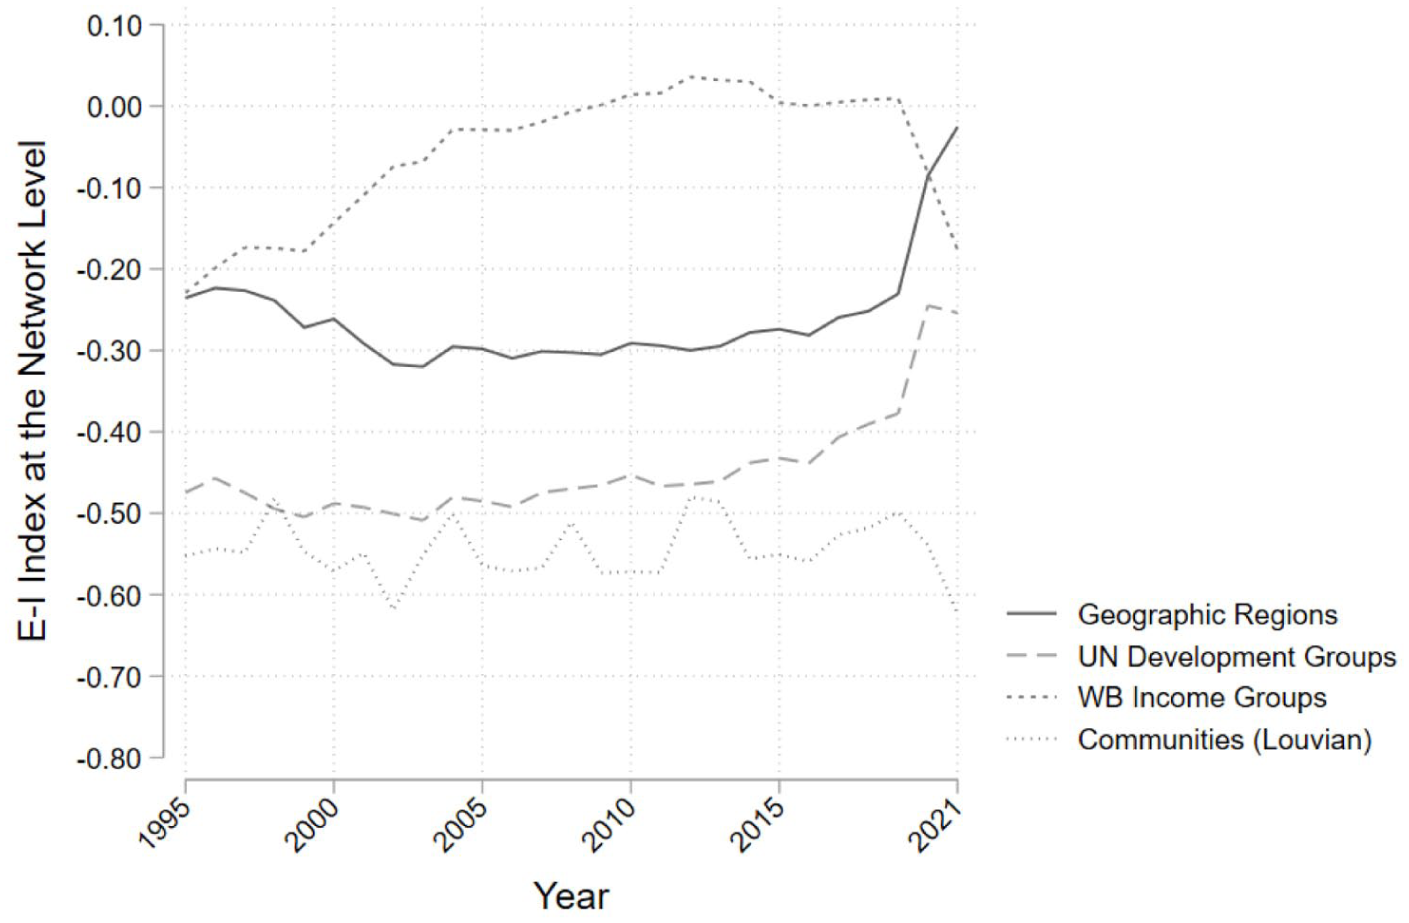
Relationship between tourism flows that are internal and external to international tourism communities detected using the Louvain algorithm and country groupings based on region, income, and development.
In contrast, the corresponding E-I indices computed using geographical regions from the UN Statistical Division indicate that the importance of inter-regional over intra-regional tourism flows has increased since 1995, in particular from 2019 onward. From 2019, we find almost as much tourism between geographical regions as within them, with the corresponding E-I index reaching a value close to zero (−0.0255 in 2021). The trend for tourism movements to operate increasingly across geographic regions rather than within them suggests that using geographical regions for delimiting tourism patterns becomes less effective over time, in particular during the COVID-19 pandemic.
The E-I indices computed using UN development groups follow the same pattern as E-I indices computed using geographical regions, that is, the importance of inter-development groups over intra-development groups in tourism flows has increased since 1995, in particular from 2019 onward. Similarly, the E-I indices computed using World Bank income groups also indicate the increasing importance of inter-income groups over intra-income groups of tourism flows. In particular, in the period 2008 to 2019, there were more tourism flows between income groups than within income groups (the corresponding E-I index was positive). There was, however, a noticeable change in the last 2 years, 2020 to 2021, with increasing importance of tourism flows within income groups and decreasing importance of tourism flows between income groups (the corresponding E-I index was negative), which can be due to the impact of the COVID-19 pandemic.
Overall, the E-I indices in Figure 6 indicate that the international tourism communities that we obtain using the Louvain algorithm contain substantially more tourism flows within communities than between them compared to established regional, income, and development country groupings. This highlights the relevance of the international tourism communities that we obtain using the Louvain algorithm in discerning tourism patterns over time. Moreover, these findings suggest fragmentation within the global tourism network, as tourism activity is, to a large extent, confined within specific tourism communities.
E–I Indices at the Community Level
Our second research aim is to examine how inward-looking ties and outward-looking ties are spread among the individual communities we identify. After detecting communities via the Louvain modularity-maximization algorithm, we calculate community-level weighted E–I indices to gauge their internal and external connectedness. The E-I indices allow us to group tourism communities into categories that display different patterns of local cohesion and global cohesion in the tourism network.
Typology for Tourism Communities
Theoretically, we can detect three types of communities: global, local, and glocal (Danchev & Porter, 2018). Local communities are characterized by negative scores for the E-I index. Global communities are characterized by positive scores for the E-I index. Glocal communities are characterized by having E-I index scores in the middle of the possible two maximum values of −1 and 1 (i.e., close to zero).
Based on our data, we detect mainly two types of communities: local and glocal. The computed E–I indices at the community level are all negative and range between −0.8195245 and −.0983215. Specifically, we consider communities with E-I indices with values below −0.25 as local and those with values between −0.25 and 0 as glocal. We find 166 local communities and 10 glocal communities (see Figure 7). Our analysis of communities based on the Louvain algorithm also indicates a lack of any global tourism communities. Therefore, there are no tourism communities that would group countries that tend to be connected to countries from other communities and contribute to the global interconnectedness of the international tourism network.
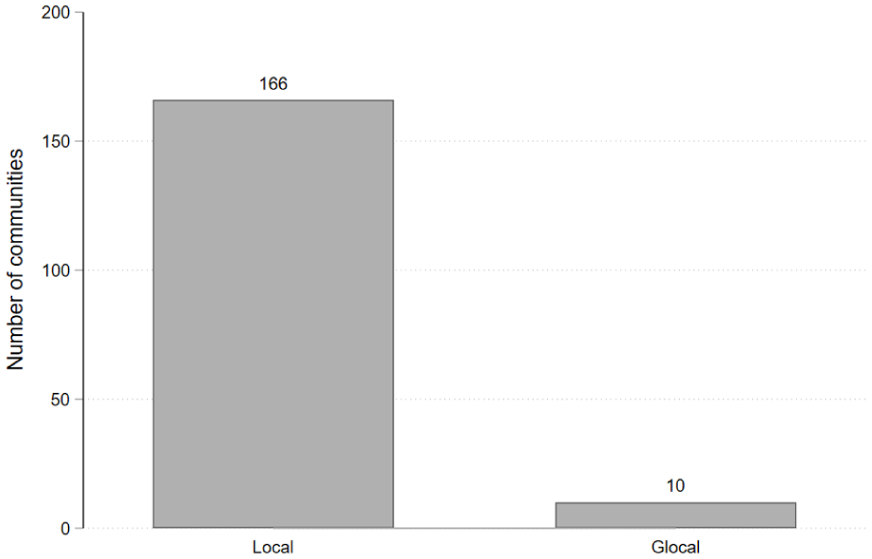
Distribution of community types detected using Louvain algorithm.
Similar patterns emerge when we consider communities detected using the Infomap algorithm. We do detect several global communities, as to be expected, given that communities detected using the Infomap algorithm are smaller and there are more of them. However, the majority of communities are still local. See Figure 12 in the Appendix.
Overall, our results indicate that the structure of international tourism consists predominantly of local communities. Movements of tourists originating from local communities are largely constrained to remain within communities due to a limited number of inter-community connections that would allow tourism flows to other communities. This also implies limited opportunities for cross-community exchanges.
How Has the Connectivity of the International Tourism Network Changed Over the Years?
To analyze how the international tourism network has changed over time, we now split our sample into two 13-year periods. Figure 8 shows that there was a statistically significant decrease in the E-I index from the first time period (1995–2008) to the second time period (2009–2021), as indicated by the even more negative values of the E-I index. The values of the E-I indices of both local and glocal communities have significantly decreased during the period. There are no global communities in either of the periods. These results suggest that the global cohesion of the international tourism network has, in fact, decreased over time. Moreover, the results suggest that there is an increasing regionalization of the tourism network over time, particularly among local communities. Therefore, the processes of decreased global interconnectedness and increased regionalization that we observe at the global network level is also local: it operates mostly in local communities. These results are qualitatively similar if we consider the Infomap algorithm instead (see Figure 13 in the Appendix).
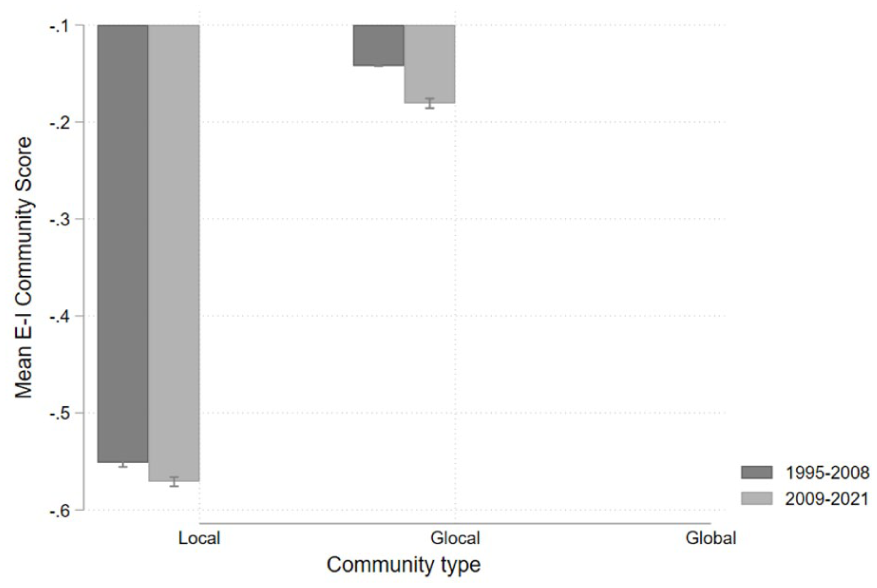
ANOVA tests examining mean differences in the E-I index at the community level across community types for the periods 1995 to 2008 and 2009 to 2021. Error bars indicate 95% confidence intervals. Communities detected using Louvain algorithm.
Robustness Analysis
Alternative Community Detection Algorithm: Infomap
We establish the robustness of our results by repeating our analysis using the Infomap algorithm (Rosvall & Bergstrom, 2008) as an alternative community detection algorithm. In contrast to the Louvain algorithm, which requires symmetrization of the network ties before implementation, the Infomap algorithm can directly handle the directionality of the links in the network (Rosvall & Bergstrom, 2008).
Overall, our main conclusions hold when using this alternative approach (see section 7 in the Appendix). Specifically, while we detect more communities using the Infomap algorithm compared to the Louvain algorithm, the overall patterns across countries as well as over time are similar to those observed when using the Louvain algorithm.
First, Figure 9 in the Appendix presents world maps of community assignments for select years from our sample period of 1995 to 2021 obtained using the Infomap algorithm. Again, geographic boundaries play an important role in shaping the community structure, but several cross-continental communities have overcome these constraints.
Second, Figure 10 in the Appendix presents the number of communities over time detected using the Infomap algorithm. The number of tourism communities has fluctuated over time, from 17 in 1995 to 13 in 2021. The year 2020 stands out with its increase in the number of tourism communities (15) compared to the years immediately before and after. Similar to our baseline results, we do not observe a strong downward trend in the number of communities, which could suggest increasing globalization of tourism over the years. Instead, the number of communities is rather stable over the years, again indicating that both regionalization and globalization forces were at play.
Third, Figure 11 in the Appendix shows E–I indices at the network level when using the Infomap algorithm to detect communities and also compares them to other country groupings. Overall, similar patterns in the E-I index at the network level can be observed when using the Infomap algorithm to detect tourism communities as when we used the Louvain algorithm. We find that in all years the E-I index is negative, indicating that international tourism communities contain substantially more tourism flows within communities than between them. Moreover, the E-I index somewhat decreases over time (from −0.42 in 1995 to −0.73 in 2021). These negative and decreasing values indicate strong and increasing regionalization in the tourism network over time.
Fourth, Figure 12 in the Appendix shows the distribution of different community types in our sample using the community topology introduced in the baseline analysis. While in this case we do detect some global communities, we still find strong dominance of local communities. The local communities constitute the majority of all community-year pairs in our sample. About 30% of the community-year pairs are local, while only 17% are global.
Figure 13 in the Appendix shows that there was a statistically significant decrease in the E-I index from the first time period (1995–2008) to the second time period (2009–2021), as indicated by the even more negative values of the E-I index in the second period. This change in patterns of connectivity is particularly driven by local communities. However, there was a statistically significant increase in global interconnectedness among glocal communities. Nevertheless, the mean of the E-I index in those communities is negative, implying that, on average, most communities are local or glocal. Finally, the E-I index in global communities was very similar in both time periods (the difference is statistically insignificant). Overall, these results suggest that the global cohesion of the international tourism network has decreased over time, in particular among local communities. These results reinforce the results obtained with the use of the Louvain algorithm.
Alternative Time Period: Excluding the COVID-19 Pandemic Period
Because all our network measures are calculated on a year-by-year basis, we can assess the effect of individual years. We therefore keep the pandemic years 2020 and 2021 in the main analysis, which lets us investigate the structure of the international tourism network before (1995–2019) and during the COVID-19 pandemic (2020–2021). However, we recognize that Section “E–I indices at the community level” provides aggregated results using the full 1995 to 2021 sample. The sample period, therefore, contains the COVID-19 pandemic period. For robustness, we conduct the same analysis excluding the COVID-19 pandemic period (years 2020–2021). The results using this smaller sample period remain robust (see Appendix B). In particular, we still find strong dominance of local communities (see Figure 14 in the Appendix), and this dominance does not decrease over the sample period. In fact, we find a statistically significant decrease in the E-I index from the first time period (1995–2007) to the second time period (2008–2019), as indicated by the even more negative values of the E-I index in the second period for both local and glocal communities (see Figure 15 in the Appendix).
Alternative Country Samples
In the main analysis, we use the largest possible sample of 190 countries where we have information that there is tourism flow between them. However, in general, tourism outflow (origin) information is more complete than inflow (destination) information. Therefore, while there is information that there is a tourism flow between the two countries, the exact flow value might be missing. Following common practice (see, e.g., Khalid, Okafor, and Sanusi, 2022), in the cases where the exact flow value is missing in the main analysis, we consider these observations as zero flow. To alleviate concerns that such practice may affect our results, we also consider two alternative ways to construct our sample.
First, we consider a smaller sample in which we restrict our analysis to countries that appear in every year of our study period and for which tourism flow information is not missing (Mahutga, 2006). In this smaller sample, we have information on actual pairwise tourism flows between 110 countries in the period 1995 to 2021. Our overall results remain robust to this change in country sample construction (see Appendix C “Subsample of 110 Countries”).
Second, following L. Okafor (2025), we utilize multiple imputation to fill in the missing data for tourism flows. This approach allows us to generate a plausible, complete dataset for tourism flows (for details, see Austin et al. (2021)). The summary statistics for the observed data and three imputed versions of the data are reported in Table 1. The imputed values look plausible given that the means of the observed data are relatively similar to the means for the three versions of the imputed data. To check the robustness of the estimates, we rerun the estimations. To this end, we use the three versions of the imputed values in lieu of the observed values of tourism flows. This approach results in a sample of 147 countries for which we have imputed or actual bilateral tourism flow information in the years 1995 to 2021.
Summary Statistics Before (M0) and After Imputations (M1, M2, and M3).
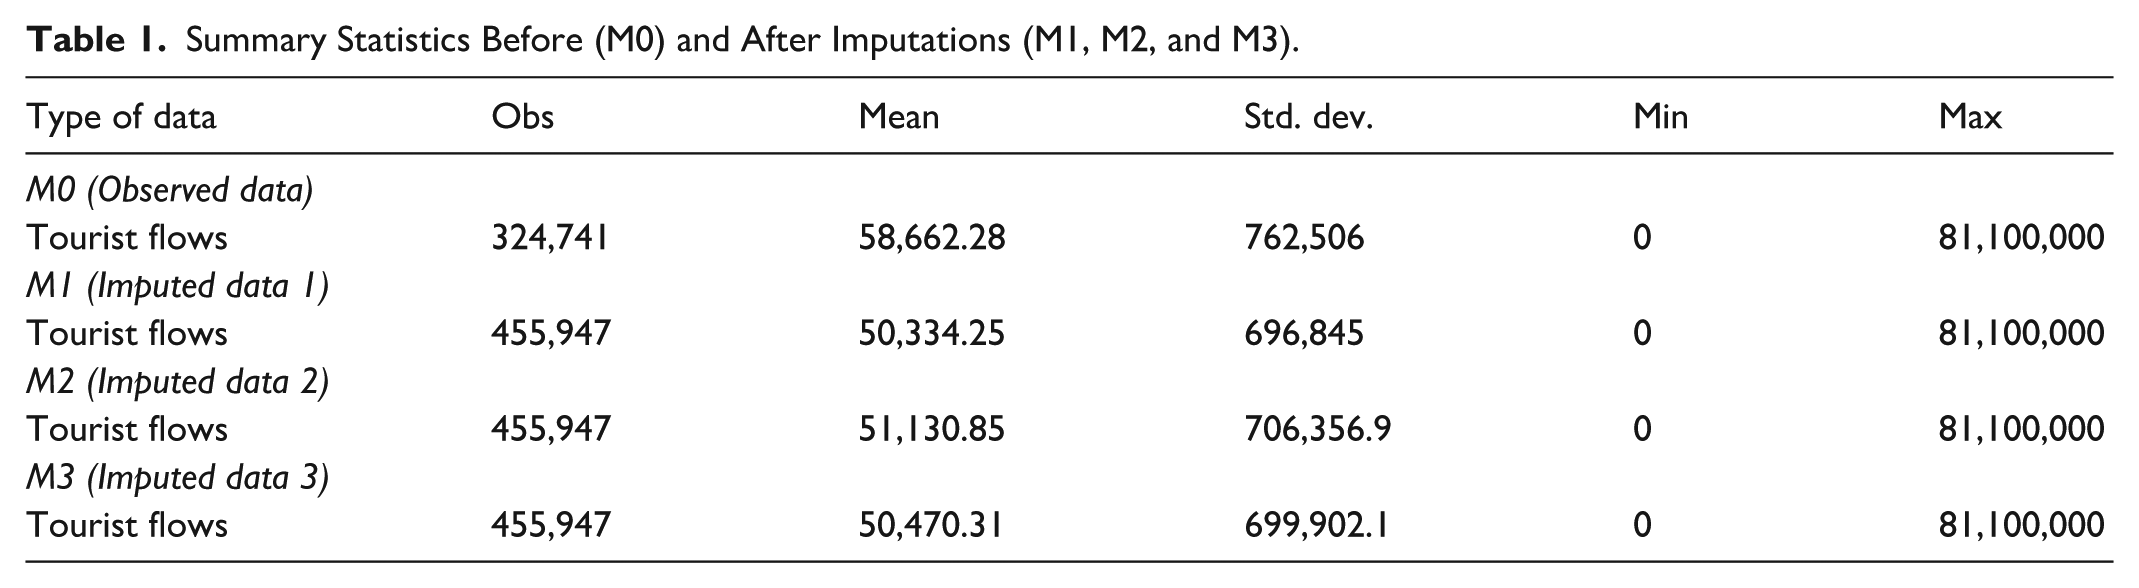
Overall, the results of the study hold when the three versions of the imputed values are used in lieu of the observed values. The results obtained using the first imputed data (M1) are reported in the Appendix (see Appendix C “Subsample of 147 Countries”). The results obtained using the remaining two versions of imputed data (M2 and M3) were qualitatively similar and are not reported to conserve space, but are available upon request.
Conclusion
This paper applies network science tools to examine the extent of regional concentration and global interconnectedness in international tourism flows using bilateral data for 190 countries from 1995 to 2021. The analysis reveals that global tourism interconnectedness has been consistently low and has declined over time, reinforcing a clear and persistent trend toward regionalization.
Community-level analysis shows that most tourism communities are local, that is, exhibit strong intra-community ties with limited inter-community connections. A smaller set of “glocal” communities displays a modest balance between local and cross-regional ties, while truly global communities are virtually absent. These structural patterns have remained stable over time, with intra-community connectivity strengthening further.
This study also finds that traditional classifications based on geography, income, and development levels are losing relevance. While distinctions among development and income groups continue to influence tourism flows to some degree, their explanatory power is diminishing. Instead, algorithmically detected communities based on actual tourism flows provide a more meaningful framework for understanding international tourism dynamics. In summary, international tourism remains fragmented and regionally concentrated. Countries are embedded in cohesive, self-reinforcing clusters that are only loosely connected to the broader global network.
The policy implications of this study are threefold. First, research on meso-scale network structures in tourism can serve as a foundation for predicting future tourism trends and contribute to discussions on tourism policy. Second, policies promoting international destination marketing at a regional level and collaboration in marketing regional tourism destinations can help countries gain a competitive edge over their competitors, such as reaching a wider audience. This suggests that promoting intra-regional collaboration and targeted marketing within network-defined communities is potentially more effective than global campaigns. Analogously, management teams and tourism managers should consider devoting a larger share of resources toward advertising their services within relevant regions to gain a competitive advantage.
Third, evidence from meso-scale tourism networks can support strategic planning and international cooperation, which are instrumental in the development of a flourishing tourism industry. Amidst strategic planning and international co-operation, interested governments or tourism stakeholders can use insights from the meso-scale tourism network to promote sustainable tourism, minimize travel barriers, and harmonize tourism policies on a regional level.
While our study provides robust evidence of the changing nature of the tourism network structure, it is not without limitations, most of which stem from data constraints. Our empirical measure of the tourism flow relies on the annual count of international arrivals, that is, visitors who cross a border and spend at least one night in the destination country. Although this indicator is widely used in literature because of its wide cross-country coverage and comparability (Khalid et al., 2020; Khalid, Okafor, & Burzynska, 2022), it does not fully reflect the intensity of the link between two nations. Using such a measure implies that a 1-day shopper and a 2-week holidaymaker have identical economic footprints, cultural engagement, and environmental impacts.
Ideally, a robust measure, such as total tourist-night stays or average length of stay, would allow us to analyze the depth as well as the breadth of cross-border ties. Unfortunately, overnight stay data are not reported on a bilateral basis and thus are not available for empirical analysis or for conducting robustness checks. Future research could combine arrival counts with auxiliary measures, for instance, hotel-occupancy records, to distinguish genuine leisure visits from brief stopovers and to weight network edges by the true scale of tourist activity when the data become available.
A second limitation is that we analyze only international movements. Domestic tourism, which often exceeds outbound flows in volume, is outside the scope of our study due to data constraints. This exclusion means that our findings relate to the global versus regional structure of cross-border travel but cannot capture how domestic tourism might amplify or dampen the regional clustering we observe. Future research could incorporate domestic tourism series, where available, to help clarify how internal mobility interacts with international tourist flows.
Footnotes
Appendix A: Robustness Analysis Using the Infomap Algorithm
Appendix B: E–I Indices at the Community Level: Excluding the Years of the COVID-19 Pandemic (2020–2021)
In our main analysis of the E-I indices at the community level, we use the full sample of 1995 to 2021. However, we recognize that our sample period covers the COVID-19 pandemic. To investigate the robustness of our results, we exclude the COVID-19 pandemic years (2020–2021) and redo our analysis.
Figure 14 reports the results, which are consistent with our main analysis. We find 155 local communities and eight glocal communities.
To analyze how the international tourism network has changed over time, we now split our sample into two 12-year periods (we exclude the years 2020–2021). Figure 15 shows that our results are robust to this change in the time periods. Same as in our main analysis, we observe a statistically significant decrease in the E-I index from the first time period (1995–2006) to the second time period (2007–2019).
Appendix C: Robustness Analysis Applying Alternative Sample Construction
Author Contributions
Katarzyna Burzynska: Conceptualization; Formal analysis; Investigation; Methodology; Visualization; Writing—original draft; Writing— review & editing. Usman Khalid: Conceptualization; Data curation; Funding acquisition; Project administration; Writing—original draft; Writing—review & editing. Luke Emeka Okafor: Conceptualization; Data curation; Writing—original draft; Writing—review & editing.
Funding
The authors disclosed receipt of the following financial support for the research, authorship, and/or publication of this article: The study is supported by the United Arab Emirates University UPAR Grant # 12B049.
Declaration of Conflicting Interests
The authors declared no potential conflicts of interest with respect to the research, authorship, and/or publication of this article.