
Abstract
This study addresses a critical gap in the literature by examining how information and communications technology infrastructure and information and communications technology penetration affect tourism efficiency across 52 countries. While existing research has discussed the general impact of information and communications technology on tourism operations, its specific impact on tourism efficiency remains unexamined on a global scale. Employing bootstrap data envelopment analysis on data from 2010 to 2019, we find that both information and communications technology infrastructure and information and communications technology penetration have a substantial impact on tourism efficiency. This unique focus on the multidimensional effects of information and communications technology contributes to a deeper understanding of how information and communications technology improves tourism efficiency.
Keywords
Introduction
The emergence of information and communications technology has significantly changed the tourism industry and impacted both inputs and outputs (Ali et al., 2019). We can think of the tourism industry as a system of inputs and outputs (Berbekova et al., 2024). Tourism businesses use a variety of inputs, including labor and capital, to produce outputs (Assaf et al., 2010; Li et al., 2018). As information and communications technology plays a key role in minimizing tourism input by reducing redundant tasks, it allows more time for employees to focus on innovative and creative work to create memorable customer experiences. Emerging newer technologies, such as Generative AI, can train new staff faster and cheaper. For instance, virtual and augmented reality simulate real hotel or tour situations so workers can practice solving problems before they happen. Besides, AI-supported generative teaching assistants offer training that is specific to the performance indicators of every single employee. Tourism operators desire better business performance in terms of higher revenue, arrivals, hotel occupancy rates, etc. (Assaf & Tsionas, 2015; Nepal et al., 2019). Information and communications technology is critical in maximizing tourism output as it allows tourism operators to reach new customer segments and often results in increased tourism revenue through digital marketing.
Although the influence of information and communications technology on tourism inputs and outputs is well known, few studies have actually measured its impact on tourism efficiency-here defined as the ability to produce maximum outputs given inputs (Assaf et al., 2010; Corne, 2015). By investigating the impact of information and communications technology on efficiency, tourism stakeholders can see exactly where technology investments yield savings or gains, adjust their strategies, and stay competitive as new tools evolve. Keeping pace with new developments of information and communications technology helps tourism operators reduce labor and capital costs while still improving visitor numbers and revenue. Moreover, comparing the digital approaches of top-performing destinations can reveal successful tactics for lower performing regions to adopt (Li & Liu, 2022). In this way, research into information and communications technology and efficiency can uncover the best practices that power leading tourism destinations around the world.
Addressing this research gap, this study investigates whether information and communications technology is a potential driver of tourism efficiency. Specifically, this study differentiates between the role of information and communications technology infrastructure and information and communications technology penetration. Using a bootstrap data envelopment analysis, the study generated in stage one the tourism efficiency scores of 52 destination countries from 2010 to 2019, along with an importance–performance analysis to consider the unique characteristics of each destination. In stage two, the study used a bootstrap truncated regression analysis to examine whether and which information and communications technology component serves as potential drivers of tourism efficiency.
The decision to conclude the dataset in 2019, before the beginning of COVID-19 and the widespread use of AI, is based on several important reasons. First, the tourism sector experienced a strong decline starting in 2020, including travel bans, shifting consumer habits, and other external shocks (Bae & Chang, 2021; Dube et al., 2021) that would have obscured the true drivers of efficiency. By concentrating on the pre-2020 period, the study sets a stable baseline against which to measure the impact of information and communications technology without pandemic-related distortions. This same cutoff also ensures that we isolate the effects of traditional information and communications technology infrastructure and penetration networks from other emerging AI technologies that gained attention later. Moreover, the 2010 to 2019 period offers a consistent, decade-long dataset suitable for robust comparisons and benchmarking across countries under normal economic conditions. Finally, it captures the period in which information and communications technology became globally important, allowing us to assess its direct contribution to tourism efficiency before AI emerged as a dominant force. This approach thus offers clear insights into how foundational information and communications technology components drive efficiency and sets the stage for future research in the post-pandemic, AI-driven era.
This study provides a novel empirical perspective on tourism efficiency by distinguishing between two critical dimensions of information and communications technology: infrastructure and penetration. Building on prior research (Chaabouni, 2019; Li & Liu, 2022), it is the first to examine multiple dimensions of information and communications technology within this context. By focusing on tourism efficiency, the study shows how different aspects of information and communications technology contribute to the overall performance at the destination level. These findings advance the broader literature on information and communications technology in tourism by identifying key efficiency drivers and their implications for both mature and emerging tourism markets.
The study also advances the resource-based view into tourism by showing that information and communications technology is a key competitive resource for destination. We find that both infrastructure and penetration improve efficiency. Given the industry’s heavy dependence of natural and community resources, understanding how information and communications technology can support better performance is essential for the industry’s future.
Literature Review
The tourism industry has experienced significant changes in recent years with the most important being the application of information and communications technology (Baggio et al., 2020). On the supply side, global distribution systems have fundamentally changed transactions between service providers, and service robots have enabled repetitive activities to be automated. This allowed employees more time to improve customer experience. Additionally, big data analytics have provided destination management organizations with the tools to better understand customer experiences, behaviors, and preferences and make more accurate tourism forecasting (Gössling, 2020).
On the demand side, mobile technology and social media have given travelers access to information and decision-making tools. Customers can use online travel agencies (OTAs) and meta-search engines to compare prices, read reviews and ratings from other travelers, and book accommodations and activities in just a few clicks (Baker & Kim, 2019; Bi et al., 2019; Piccinelli et al., 2021). Innovations in travel activities, such as AR and VR, have positively affected customer behavior, intention, destination knowledge, and attachment through perceived value and psychological responses (Alyahya & McLean, 2022; Jo & Shin, 2025; Wei et al., 2022). Continuing development of information and communications technology will shape the future of the tourism industry in the coming years.
Recent studies show that the Metaverse and ChatGPT are changing tourism in new ways. The Metaverse create immersive experiences that go far past traditional tours (Go & Kang, 2023). By using digital twins, tourism companies can explore new approaches to marketing, branding, and customer management in these virtual spaces (Buhalis et al., 2023). At the same time, ChatGPT and similar generative AI tools are poised to change how we generate and share tourism knowledge, from personalized travel advice to automated content creation. However, it is also important to recognize that both functional and psychological barriers to the adoption of generative AI in travel still exist (Seyfi et al., 2025). As more travelers rely on AI-powered conversational agents to book trips, hotels and destinations that still depend on old-style reservation systems will have to rethink their business models. At the same time, the growing dependence on AI-generated content is changing competition in the accommodation industry, helping underperforming listings to reach higher visibility and bookings (Fan et al., 2025). In short, breakthroughs like the Metaverse and ChatGPT make it essential for everyone in tourism to embrace modern technologies if they want to remain competitive and meet evolving customer expectations.
However, the influence of technology on the tourism industry is not always positive. For example, the implementation of technological solutions influence hotel departments differently (Ham et al., 2005). For example, guest-related interface applications may not have the same effect as front-office, restaurant, and banquet management systems. Moreover, price discrimination that is enabled by big data may negatively impact customers’ intention toward mobile applications due to perceived price fairness, and perceived deception (Shang et al., 2023). Additionally, there is a broken connection between tourism governance and smart initiatives (Ivars-Baidal et al., 2024). Similarly, in the hotel sector, technology investments alone do not drive productivity gains; rather, success depends on the effective use of networking and informalization capabilities (Sigala, 2003). The adoption of technology should not be seen solely as a means to reduce labor costs but as a tool for enhancing workforce productivity and service delivery. It is important to take this perspective into account by assessing not only the impact of ICT infrastructure on tourism efficiency but also how digital transformation complements human capital rather than replacing it (Wei et al., 2024).
Research on Tourism Efficiency
The tourism industry operates in a multiple input-output setting. The industry uses resources like labor, capital, land, and facilities to generate outputs such as revenue, visitor arrivals, and broader economic benefits (Assaf et al., 2010; Joppe & Li, 2016). Efficiency here means extracting the greatest output from the given inputs, yet measuring it is challenging given the heterogeneity across tourism destinations (Assaf & Tsionas, 2015; Nepal et al., 2019).
Frontier analysis is now a cornerstone for measuring tourism efficiency, mainly through two methods: parametric stochastic frontier analysis and non-parametric data envelopment analysis.
Both approaches begin by defining the decision-making units, referring to the groups of comparable units that might range from individual hotels, restaurants, or travel agencies to entire cities, provinces, or countries. By constructing an efficiency frontier, each decision-making unit’s ability to convert resources into outputs is benchmarked against its peers (Corne, 2015; Kozak, 2002; Simar & Wilson, 2007). This relative performance assessment not only highlights best performers but also suggest areas of improvements for low performing destinations.
Scholars have long recognized that a number of variables, ranging from trade openness and regional urbanization to a destination’s geographic setting affect tourism efficiency (Corne, 2015; Kozak, 2002). Recent work has studied these variables with diverse techniques. For instance, Li and Liu (2022) employ a three-stage data envelopment analysis to reveal how industry agglomeration improves provincial tourism efficiency in China. Gomez-Vega et al. (2022) using bootstrap-truncated regression, demonstrate that cultural heritage enhances tourism efficiency. Likewise, Nurmatov et al. (2021) show that beaches and natural attractions enhances efficiency across seventeen Spanish regions (2008–2018).
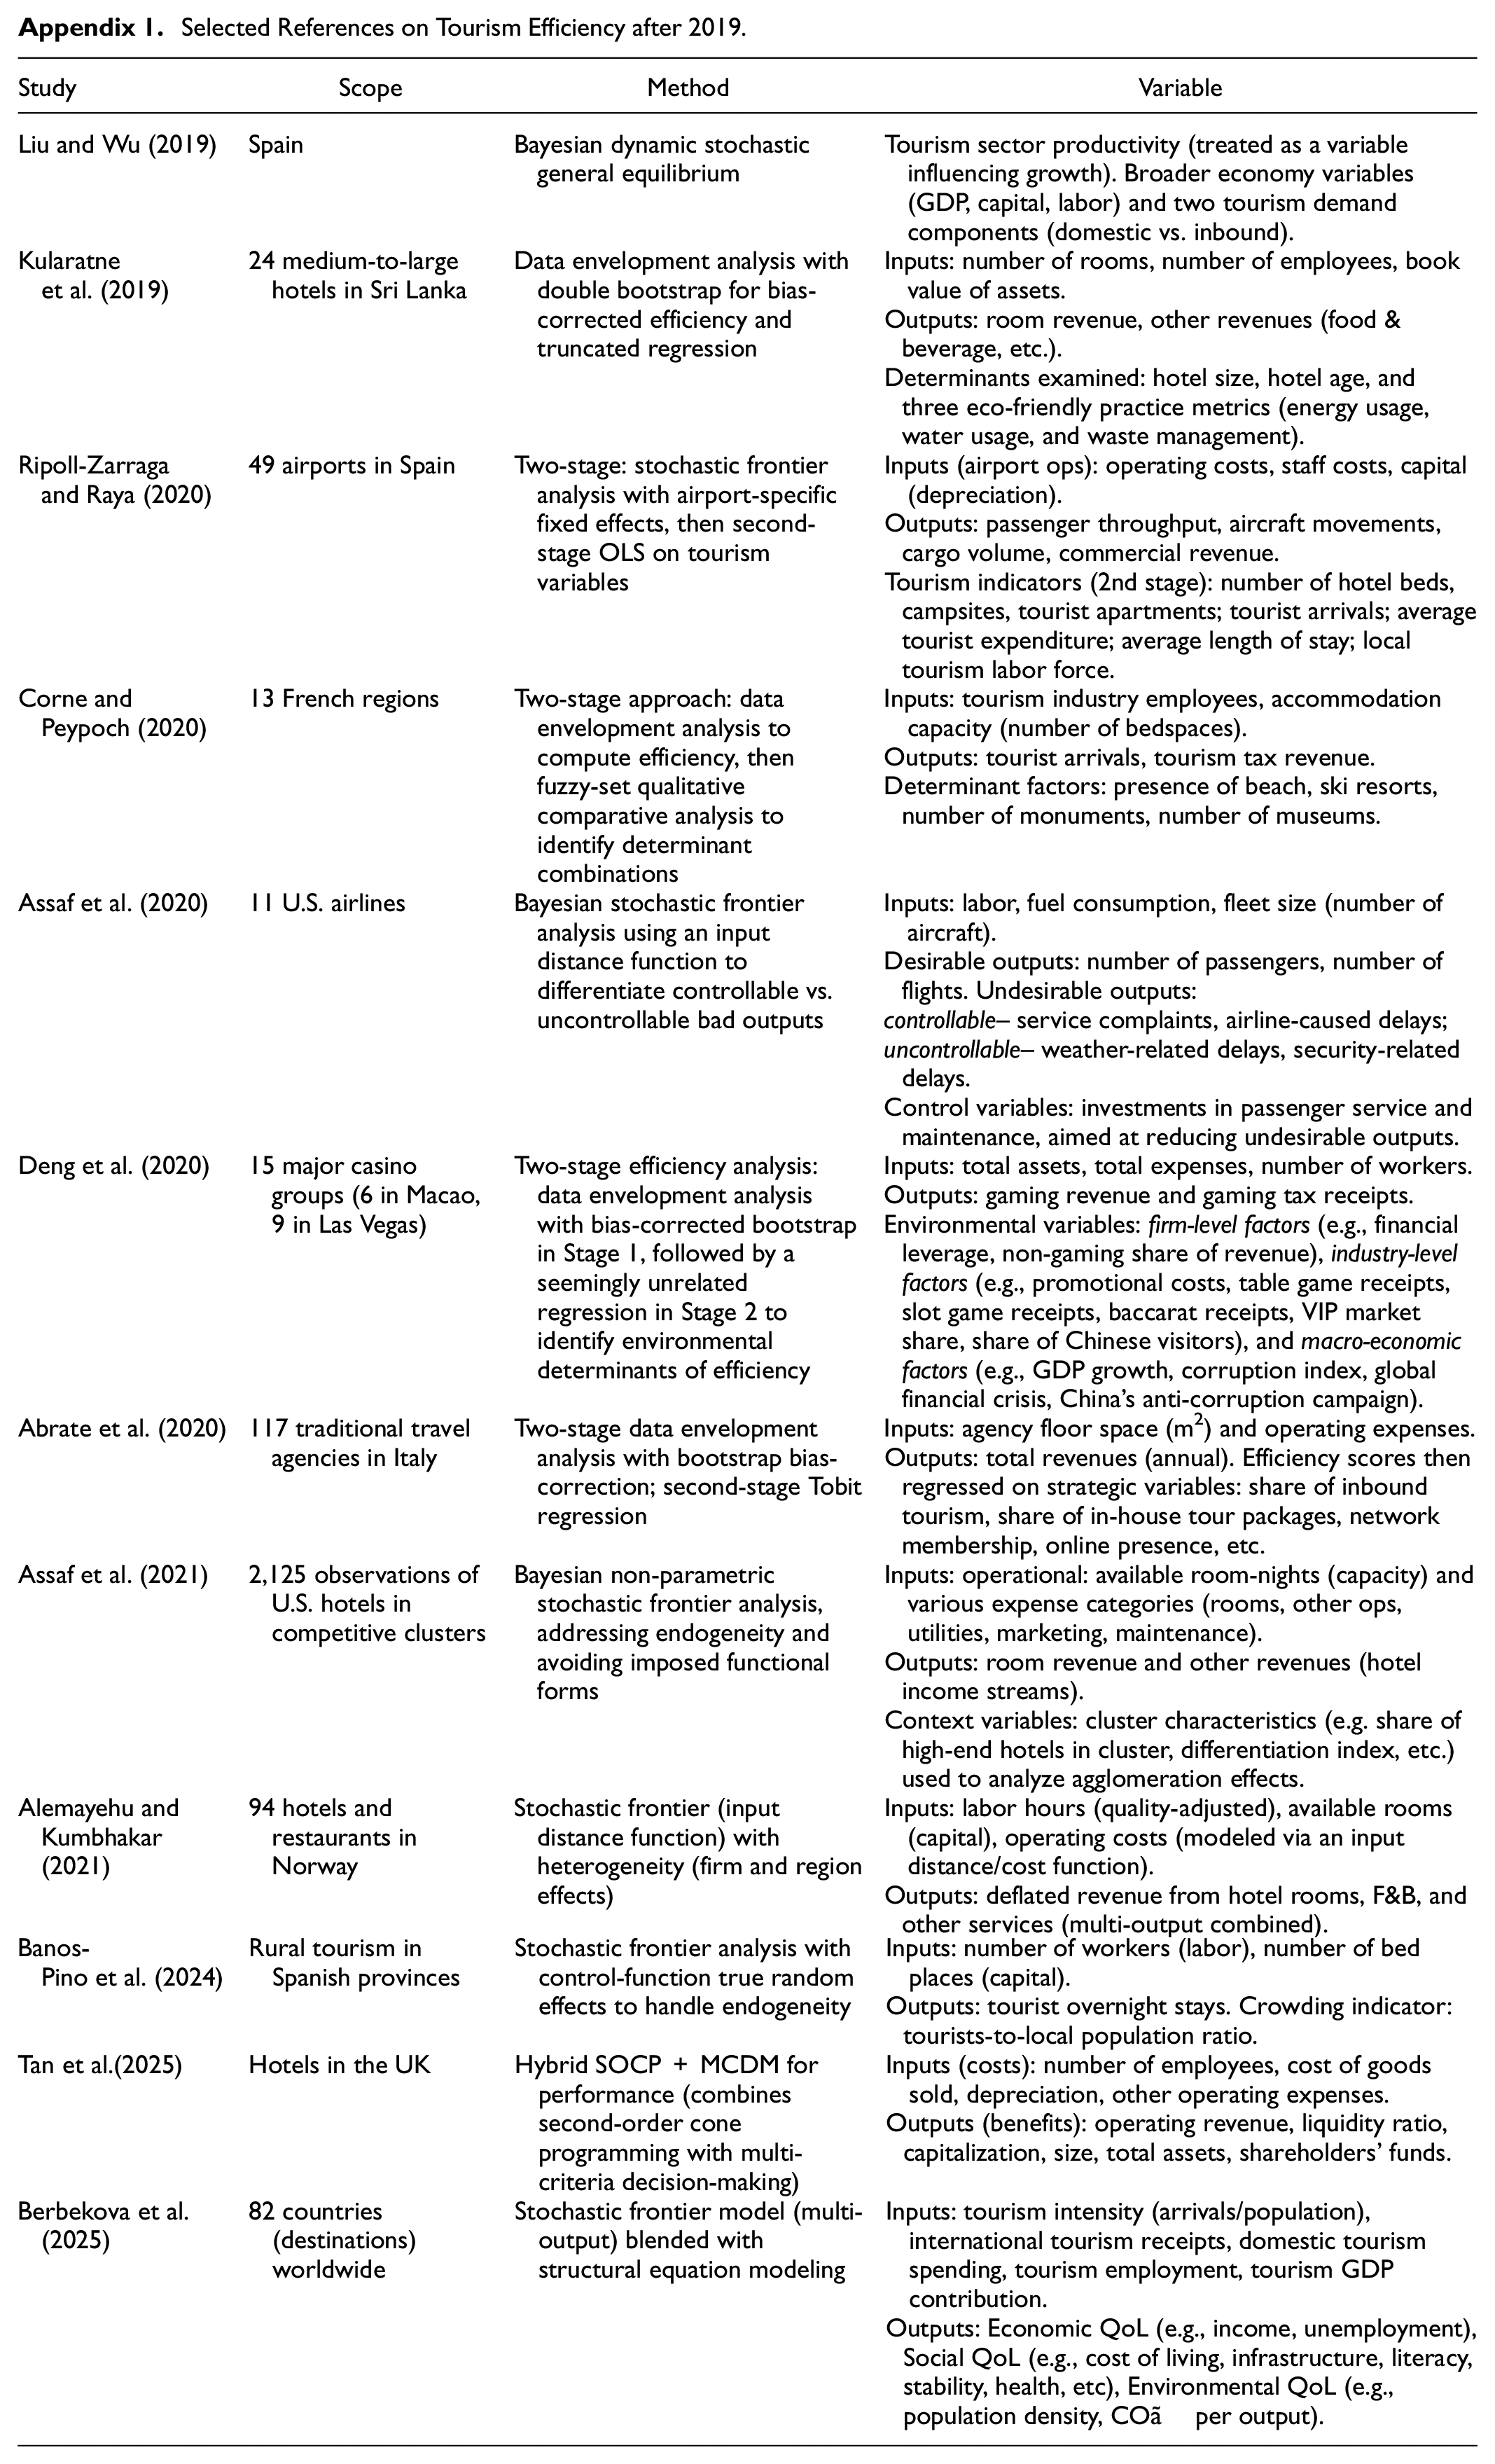
However, as noted by Corne and Peypoch (2020), research in this area has produced conflicting results and inconsistent conclusions. For example, while the beach had a positive influence on tourism efficiency in France (Barros et al., 2011), it had a negative impact in Oman (Oukil et al., 2016). Thus, improving tourism efficiency could depend on external factors. Further research is needed to gain a better understanding of the complex relationships between environmental variables and tourism efficiency. To further consolidate the latest knowledge, we have on the topic, we conducted a systematic review of empirical studies estimating tourism efficiency at both macro and micro levels since 2019. Appendix 1 highlights the diverse methodologies and key findings from prior studies on tourism efficiency, illustrating the breadth of approaches and results.
At the macro level, Liu and Wu (2019) used a Bayesian dynamic stochastic general equilibrium model for Spain to show the impact of tourism productivity gains on economic growth. Corne and Peypoch (2020) mixed data envelopment analysis with fuzzy-set comparative methods across thirteen French regions to reveal that it is a complex combination of several factors rather than any single factor that improves tourism efficiency. In the U.S. airline sector, Assaf et al. (2020) introduced a Bayesian stochastic frontier framework that separates controllable from uncontrollable “bad” outputs to obtain a more accurate and fair frontier assessment. Most recently, Berbekova et al. (2025) combined multi-output stochastic frontier analysis with structural equation modeling to show how tourism efficiency translates into broader quality-of-life improvements.
At the micro level, Kularatne et al. (2019) applied a double-bootstrap data envelopment analysis to Sri Lankan hotels, demonstrating that being environmentally responsible improves efficiency. Ripoll-Zarraga and Raya (2020) similarly showed that airports’ geographical location influences efficiency in touristic regions. In the gaming sector, Deng et al. (2020) compared casinos in Macao and Las Vegas via a two-stage data envelopment analysis coupled with seemingly unrelated regression, showing the performance of casinos in Macao relies on China's economic growth and visitor arrivals. Finally, Assaf et al. (2021) introduced a Bayesian non-parametric stochastic frontier analysis on U.S. hotels, showing the important role that hotel cluster characteristics play in driving efficiency.
Collectively, this body of work show that the use rigorous methodologies and the inclusion of external drivers is key to understanding of tourism efficiency and providing policymakers and industry leaders with concrete guidance for optimizing resource use and driving sustainable growth. Yet the choice of frontier technique carries its own trade-offs. Data Envelopment Analysis, known for its flexibility, treats every departure from the efficiency frontier as inefficiency-without a stochastic term to absorb random error-making it vulnerable to outliers and measurement noise (Lampe & Hilgers, 2015). In contrast, stochastic frontier analysis incorporates a composed error term that cleanly separates statistical noise from true inefficiency, yielding more robust and reliable efficiency estimates (Hjalmarsson et al., 1996).
Recent developments in stochastic frontier analysis have enhanced its flexibility and robustness. Notably, Bayesian formulations relax the strict distributional assumptions of traditional stochastic frontier analysis and allow researchers to model endogeneity and unobserved heterogeneity (Haider & Mishra, 2021). In these models, one can introduce multiple inefficiency components or more complex modeling structures. For example, Assaf et al. (2020) developed a Bayesian stochastic frontier analysis for U.S. airlines that disentangles inefficiency stemming from managerial control from “bad” outputs imposed by external constraints, resulting in a more balanced performance ranking. Similarly, Assaf et al. (2021) introduced a non-parametric Bayesian frontier with hotel-cluster effects to capture firm-level heterogeneity. These modern stochastic frontier analysis approaches also handle endogeneity bias in efficiency estimation.
Nevertheless, we chose to employ data envelopment analysis for this study because its non-parametric framework decreases the risks of functional-form misspecification, avoids using subjective priors, and handles multiple inputs and outputs more effectively (Iqbal Ali & Lerme, 1997; Ruggiero, 2007). In a cross-country context, where production technologies differ, data envelopment analysis minimizes modeling error. To improve the robustness of our estimates, we apply a bootstrap data envelopment analysis procedure that corrects for potential bias and produces confidence intervals around each efficiency score, thereby quantifying the uncertainty inherent in a deterministic frontier (Balcombe et al., 2008). Given its established pedigree in tourism-efficiency research, data envelopment analysis represents a good methodological choice for our international comparison. At the same time, we acknowledge that future work could extend our insights by incorporating advanced stochastic-frontier techniques, such as Bayesian stochastic frontier analysis, to explicitly account for statistical noise and endogeneity, enriching the methodological robustness.
Information and Communications Technology as a Driver of Tourism Efficiency
Many fields have examined how information and communications technology improves productivity and efficiency: including manufacturing (Castiglione, 2012), public service (Seol et al., 2008), education (Aristovnik, 2012), innovation (Cai, 2011), museum performance (Guccio et al., 2020), and hotel productivity (Sigala et al., 2004). Yet studies that focused specifically on hospitality and tourism remain scarce. Sigala et al. (2004) looked at three-star hotels in the UK and showed that simply investing in information and communications technology does not automatically raise productivity. The full exploitation of information and communications technology networking capabilities is necessary. For example, Guccio et al. (2020) split information and communications technology investment into on-site and online categories for Italian museums. They found that that on-site play the bigger role in improving performance.
The resource-based view holds that competitive edge comes from how unique assets are deployed (Barney & Arikan, 2005). These assets, whether tangible (like proprietary databases and CRM platforms) or intangible (such as brand reputation), must be valuable, rare, hard to copy, and difficult to replace if they are to create lasting advantage. In the tourism context, information and communications technology tools (online booking engines, customer-relationship software, real-time analytics, and digital marketing channels) have become strategic assets in their own right. However, simply owning these technologies is not enough. Destinations must integrate them into everyday operations, align them with overarching goals, and train their teams to use them effectively (Baggio et al., 2020; Bharadwaj, 2000). When information and communications technology is fully integrated, it sharpens resource allocation, improves service delivery, and enables more personalized guest experiences (Lioukas et al., 2016). Hence, destinations that excel in information and communications technology deployment and integration are better positioned to enhance tourism efficiency.
We operationalized the information and communications variable into two dimensions: information and communications technology penetration, assessed through internet users, and information and communications technology infrastructure, gauged by the presence of secure internet servers. We selected the dimensions of information and communications technology penetration and information and communications technology infrastructure because these two dimensions provide a comprehensive view of information and communications technology progress (Adeola & Evans, 2020; Arvin et al., 2021). Information and communications technology penetration captures the extent to which relevant services are accessible to the population. A greater information and communications technology penetration increases accessibility and usage of digital services, thereby enhancing efficiency and customer engagement in tourism destinations. Information and communications technology infrastructure assesses the underlying technological backbone supporting these services. A robust information and communications technology infrastructure supports efficient service delivery and innovative customer interactions. Together, they cover both the reach and the quality of information and communications technology. Based on the above discussion, we developed the following hypotheses:
H1: The higher the level of information and communications technology penetration, the higher the level of tourism efficiency.
H2: The higher the level of information and communications technology infrastructure, the higher the level of tourism efficiency.
In summary, while a rich body of work has examined how external variables influence tourism efficiency and have documented technology’s transformative role in travel, surprisingly little attention has been paid to linking information and communications technology directly with tourism efficiency. Prior research on hotels and museums focused on the micro level. It is important to consider the macro-level impact of information and communications technology on the tourism industry. This omission matters, because tourism already accounts for 7.6% of global GDP and supported 22 million new jobs in 2022 (WTTC, 2023), while information and communications technology usage has increased from 7% of the world’s population online in 2000 to 63% in 2021 (World Bank, 2022). The ripple effects of information and communications technology in tourism extend well beyond any single destination or hotel chain, offering the promise of a more efficient, sustainable, and inclusive industry (Roodbari & Olya, 2024). To fill this gap, our study investigates whether and how information and communications technology drive improvements in tourism efficiency.
Method
Data Collection
This study utilizes a panel dataset consisting of data from 52 destination countries spanning the years 2010 to 2019 (52 × 10 = 520 observations). The research aims to explore the research questions at a global-level; however, data availability was a significant challenge. We were able to obtain a complete dataset for the variables of interest from 52 countries across Asia (n = 20), Europe (n = 16), the Americas (n = 10), Oceania (n = 2), and Africa (n = 4). These countries accounted for 58.34% of total international arrivals and 75.31% of the global GDP in 2019, providing a comprehensive view of major tourism performance and trends at the global level. Table 1 provides information about the input and output indicators used in this study. The selection of variables for this study is based on the current literature and data availability.
The Input and Output Indicators.
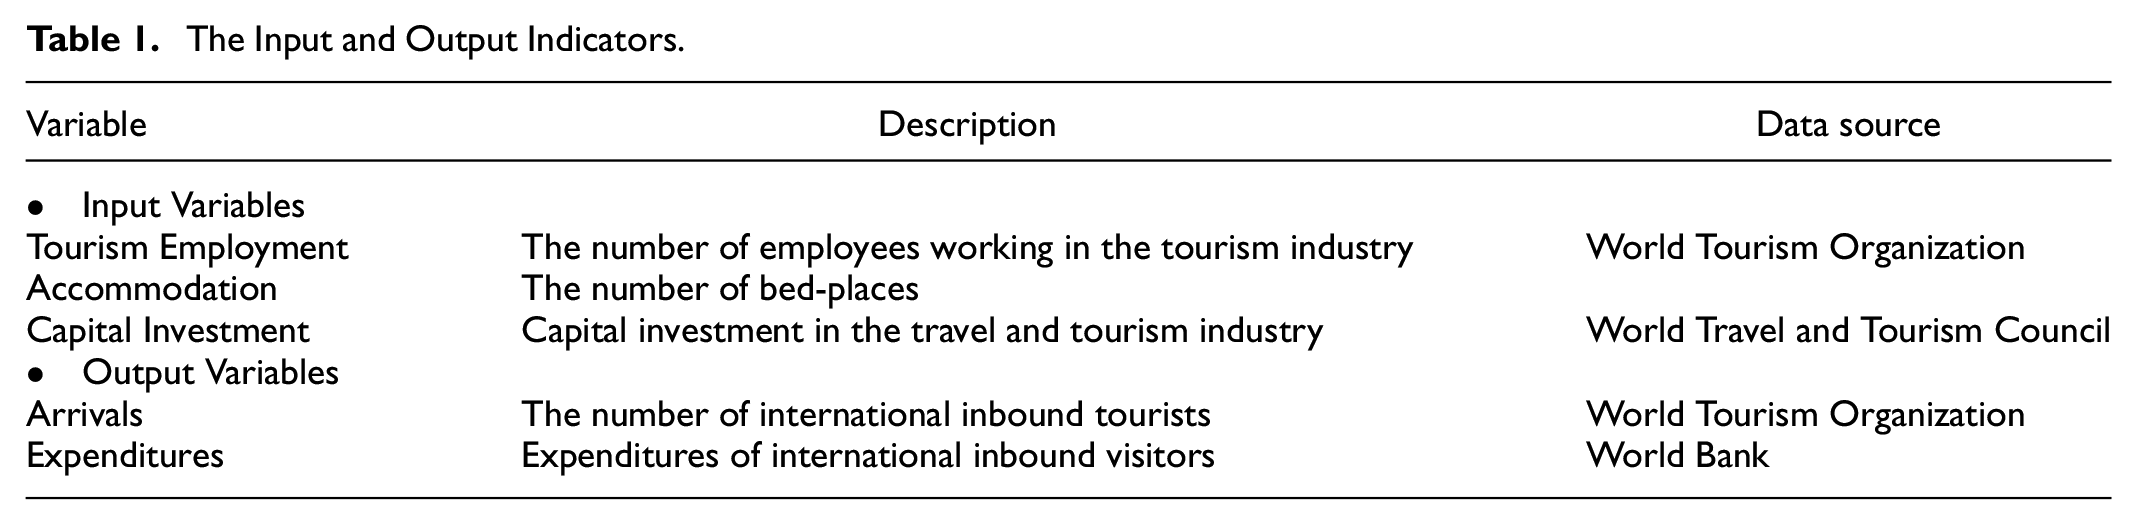
The input variables include the number of employees working in the tourism industry, the number of bed-places in each destination for the specific year obtained from the World Tourism Organization, and the capital investment of the destination in the travel and tourism industry collected from the World Travel and Tourism Council. The three input variables reflect the nature of capital and labor of input of tourism resources (Assaf et al., 2010; Joppe & Li, 2016; Li et al., 2018). The output variables consist of two variables. The first output variable is “arrivals,” measured by the number of international inbound tourists, obtained from the World Tourism Organization. The second variable is “expenditure,” obtained from the World Bank, represents the total revenue a country earns from international inbound visitors, including payments for goods and services during their stay. Overall, these input and output variables are commonly used in tourism performance studies to represent the consumption and production of the tourism industry (Assaf & Tsionas, 2015; Nepal et al., 2019).
Data Analysis
This study uses a bootstrap data envelopment analysis to calculate the tourism efficiency scores of 52 destination countries. We then use a bootstrap truncated regression analysis to explore whether and how information and communications technology can impact tourism performance at the global level.
Bootstrap Data Envelopment Analysis
As mentioned, in the current literature, there are two major methods of frontier analysis used for calculating tourism efficiency scores: parametric stochastic frontier analysis and non-parametric data envelopment analysis. For this study, we select data envelopment analysis to address our research questions for two main reasons. First, it avoids one source of error in statistical analysis by not making assumptions about functional form. Second, it can handle multiple inputs and outputs more effectively.
We also apply the bootstrap approach to data envelopment analysis. The bootstrap method is commonly used to improve the precision of critical value statistics and the estimation of confidence intervals (Efron & Tibshirani, 1994). It has also been applied to measure statistical properties of efficiency scores, referred to as the bootstrap data envelopment analysis method. By repeatedly resampling our data and re-running the data envelopment analysis, we correct for any bias in the raw efficiency estimates and generate confidence intervals around each score. This bootstrap data envelopment analysis not only delivers bias-corrected efficiency measures but also quantifies their uncertainty, something the simple data envelopment analysis cannot do. As the bootstrap method is well established in the literature, we do not repeat it here. We refer the reader to Simar and Wilson (2007) for more details.
Bootstrap Truncated Regression Analysis
After calculating the tourism efficiency scores for 52 nations, our goal was to explore whether information and communications technology could be the potential antecedent of these scores using bootstrap truncated regressions with 2,000 bootstrap replications. We selected truncated regression because tourism efficiency scores, the dependent variable in this study, are censored data ranging from 0 to 1. The regression model specification is shown below:
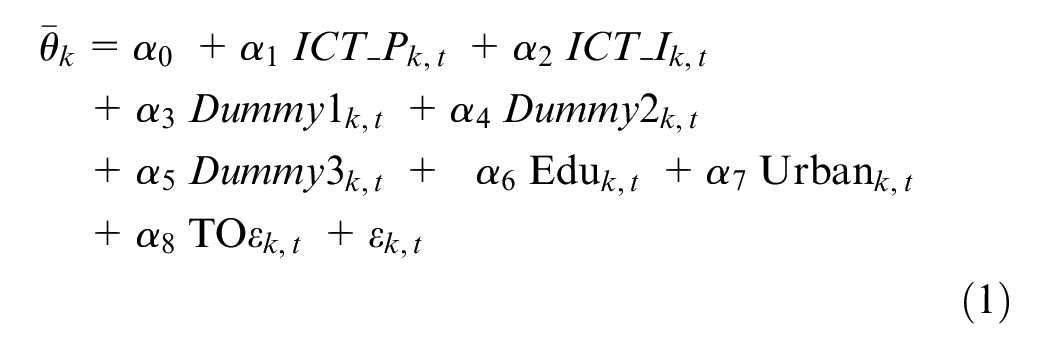
Equation (1) represents the regression model specification, where
We control for the broad geographical region of each destination by using continent dummies to capture structural and developmental differences that can affect tourism efficiency. Tourism industries in different regions often operate under distinct conditions. Such differences can lead to variation in efficiency scores across regions. By including continent fixed effects, we absorb unobserved regional factors (climate, culture, regulatory environment, market maturity, etc.) that are not our primary focus but nonetheless influence how efficiently tourism resources are used.
Education, measured by average years of schooling, is included as a proxy for the human capital of a destination’s workforce. Theoretical frameworks in productivity and efficiency often highlight human capital as a key driver of performance (a well-educated labor force can adopt new technologies faster, innovate in service delivery, and generally operate more productively). We selected education as a control because prior empirical research indicates that human capital is an important determinant of tourism performance (Assaf & Josiassen, 2012). In the tourism sector, higher education levels can improve service quality and managerial capability, potentially boosting how efficiently inputs are turned into tourism outputs. Education also aligns with our information and communications technology focus since an educated workforce can better leverage information and communications technology tools and infrastructure, complementing the technological driver of efficiency.
We include urbanization, the share of urban population, as a control variable because the degree of urban development in a country can significantly shape tourism efficiency. Urbanization reflects the concentration of population and infrastructure in cities, which has mixed potential impacts on tourism operations (Balsalobre-Lorente et al., 2023; Luo et al., 2016). On the one hand, a higher urbanization rate often means better access to transportation, communication networks, and hospitality infrastructure, which can improve operational efficiency and access to larger tourist markets. On the other hand, extreme urban concentration might introduce challenges like congestion, higher costs, or over-utilization of resources, which could diminish efficiency. Thus, the net effect of urbanization on tourism efficiency needs to be controlled rather than assumed to isolate our information and communications technology effects.
Trade openness, measured as the ratio of trade to GDP, is incorporated to capture a country’s level of integration into the global economy. For tourism specifically, a more open economy tends to facilitate international travel and investment: it often coincides with liberal visa regimes, better connectivity (flights, etc.), and a business environment that encourages efficient services. Trade openness can also serve as a proxy for overall economic openness and dynamism, which may spill over to higher tourism efficiency through improved infrastructure and competition among service providers (Tang, 2021).
Results
Results of Bootstrap Data Envelopment Analysis
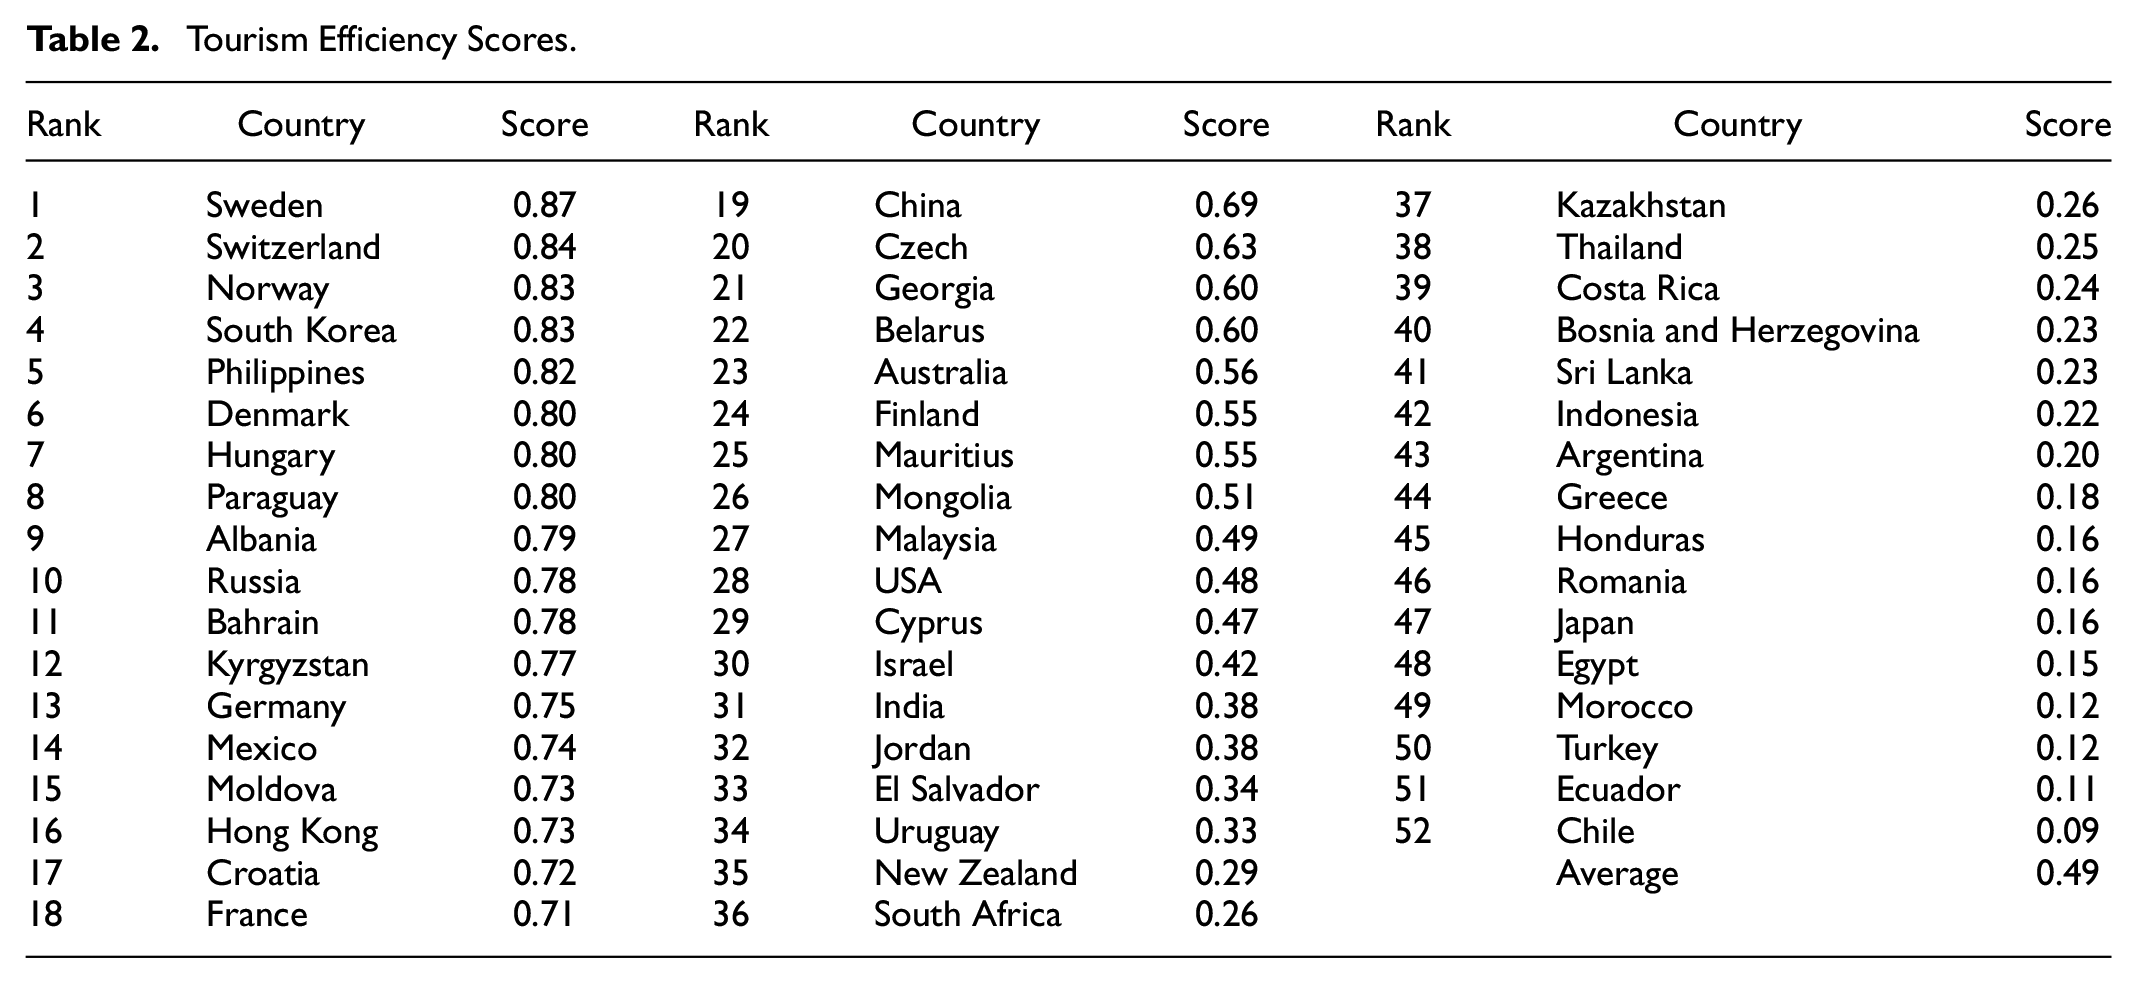
First, we present a ranking of 52 countries based on the tourism performance scores calculated using the bias-corrected bootstrap data envelopment analysis scores in Table 2. The average global tourism efficiency score during the sample period was 0.49. The results also show that tourism efficiency scores varied across different nations. The top performers, including Sweden, Switzerland, Norway, South Korea, and the Philippines, had tourism efficiency scores above 0.8. Most of these countries are developed economies with well-established tourism infrastructures and are frequently ranked high in destination performance. On the other hand, low-performing countries like Greece, Honduras, Romania, Japan, Egypt, Morocco, Turkey, Ecuador, and Chile exhibited tourism efficiency values below 0.2. Overall, our findings highlight the importance of improving tourism efficiency and optimizing tourism resource utilization to enhance tourism performance in both high-performing and low-performing countries.
Tourism Efficiency Scores.
While data envelopment analysis assumes that benchmarking comparisons should come from a similar setting, it is important to consider the heterogeneity of tourism destinations. Instead of using the rank of tourism efficiency arbitrarily, we conducted an importance–performance analysis by considering the unique characteristics of each destination. Importance-performance analysis is a simple yet effective tool that combines the attributes of importance and performance into a two-dimensional grid to derive practical implications (Martilla & James, 1977; Oh, 2001). In this analysis, the dimension of performance (x-axis) is measured by the tourism efficiency scores generated from the bootstrap data envelopment analysis. The dimension of importance (y-axis) is measured by the tourism expenditure per capita, calculated as the ratio of tourism expenditure to the number of arrivals (Figure 1).
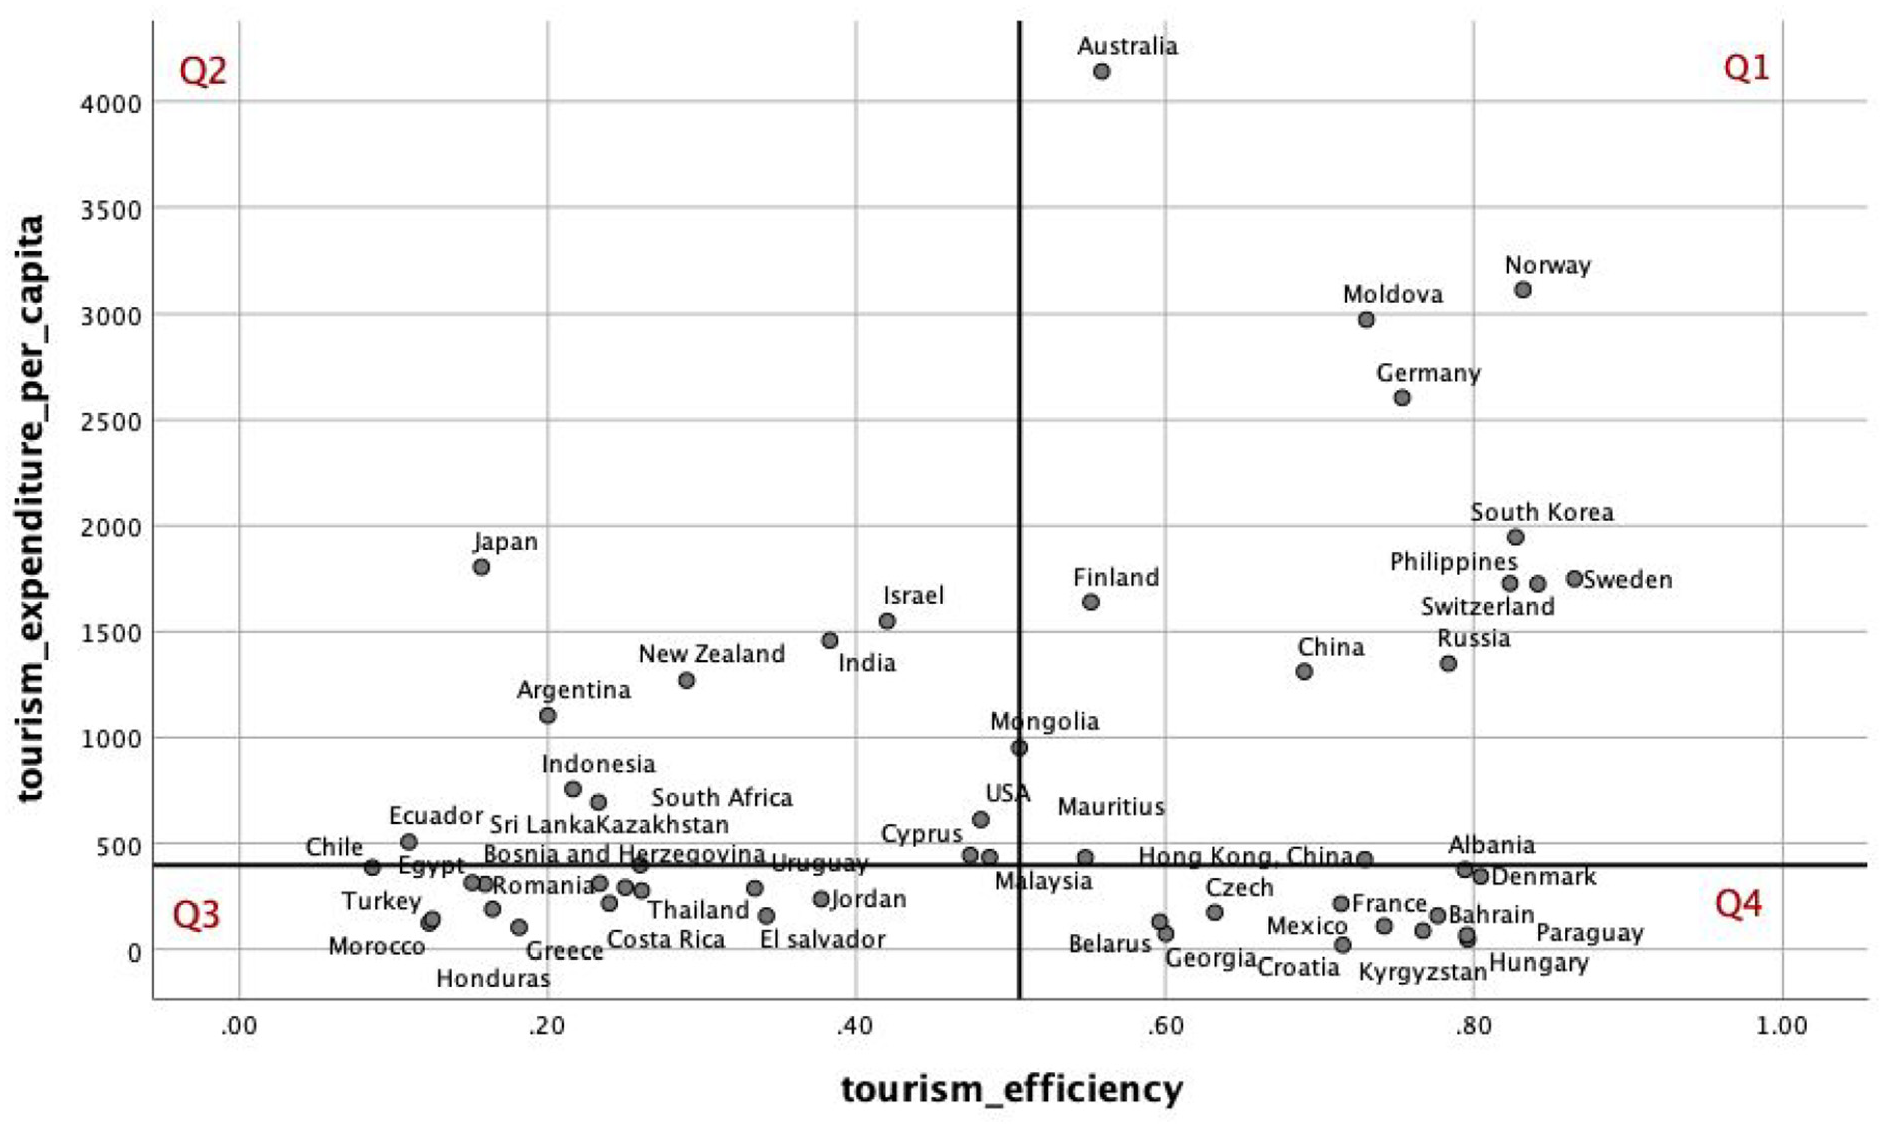
Results of importance–performance analysis (IPA).
We acknowledge that other macro-indicators, such as the ratio of tourism GDP to overall GDP or the proportion of tourism expenditure to national GDP, might also measure the relative economic significance of tourism. But from a technical perspective, focusing on per capita tourism expenditure provides a more comparable ground between nations than macro measures since it accounts for variations in the number of incoming visitors and reflects more realistically the variations in average expenditure per visitor between locations. Furthermore, a comparison of these per capita expenditures with data envelopment analysis-estimated efficiency scores enables us to identify groups of destinations that are comparatively efficient but attract lower-spending tourists or, conversely, attract higher-spending tourists but exhibit lower efficiency.
Quadrant 1 (Q1) includes a group of 14 destinations that excel both in per-capita tourist spending and in tourism efficiency, marking them excellent examples of sound management and operational best practices. These high-performers serve as benchmarks for peers aiming to elevate their own efficiency. Quadrant 2 includes 11 destinations, such as Japan, that invest heavily in tourism resources. Japan ranks higher than the sample average in terms of number of tourism employees, number of bed-places, and tourism capital investment but underperforms on average arrivals, signaling a misalignment between inputs and outputs. Despite Japan’s renowned hospitality and service excellence (Kang et al., 2004), our findings suggest that adding volume of resources alone does not guarantee efficiency. We therefore advocate for future research to integrate service-quality and customer-satisfaction metrics into efficiency models, showing that embedding guest experience indicators in data envelopment analysis enriches performance assessment. Going further, integrating real-time data analytics and AI-driven customer feedback into efficiency models can provide a more comprehensive performance assessment.
Quadrant 3 (Q3) includes 15 destinations that underperform on both per-capita spending and overall tourism efficiency. Turkey exemplifies this profile: although it receives above the world average in international arrivals, it captures only 35.31% of the average global tourism receipts. This gap largely reflects Turkey’s reliance on nearby source markets—such as Russia, Germany, Bulgaria, the UK, and Iran—whose visitors typically take shorter flights and stay fewer nights, resulting in lower total spending per trip (Republic of Türkiye Ministry of Culture and Tourism, 2023). To better assess tourism performance, it is recommended that international tourism bodies adopt expenditure per night (i.e., total spending divided by length of stay) as a standard key performance indicator (KPI). This would offer a more nuanced understanding of tourism value generation beyond arrival counts alone.
Quadrant 4 includes 12 destinations achieving strong efficiency despite modest per-capita spending. France is an example: it led the world in visitor arrivals in 2019 yet lagged in average spend per tourist. This reflects France’s exceptional ability to convert limited resources into high visitor throughput but also signals missed revenue opportunities. We recommend French destination management organizations to deploy targeted measures to encourage longer stays and streamline purchase procedures to generate more tourism revenue without sacrificing operational efficiency.
Figure 2 displays the average tourism efficiency of four continents during the sample period. All four regions and the global level demonstrate a relatively stable trend in their corresponding range of efficiency scores. The level of tourism efficiency in different continents is related to the level of economic development. For example, Europe, which mainly consists of developed economies, exhibited the highest efficiency score (from 0.55 to 0.67) across the sample period. In contrast, Africa, which primarily consists of developing economies, exhibited the lowest values (from 0.22 to 0.34) over the same decade. Overall, the results suggest a positive relationship between economic development and tourism efficiency, with more developed regions generally exhibiting higher efficiency scores. This underscores the importance of investing in tourism infrastructure and development in developing regions to enhance tourism efficiency and performance.
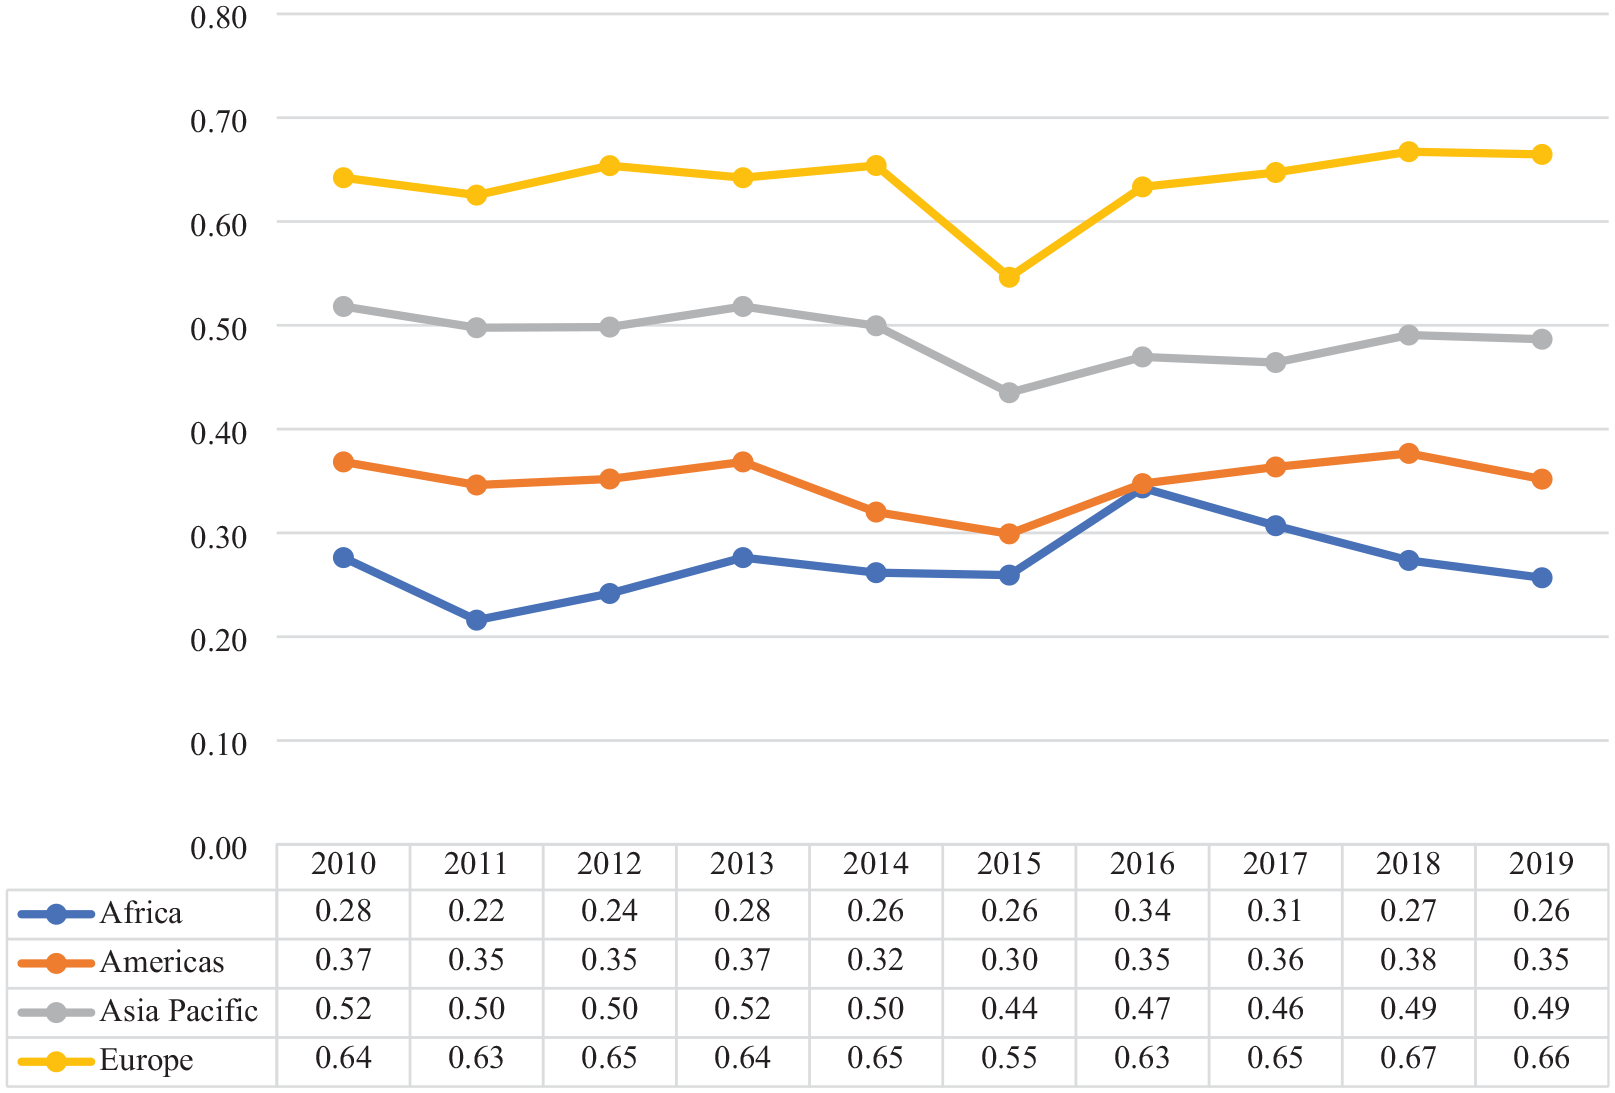
The average tourism efficiency scores of different continents.
Regressing Efficiency on Information and Communications Technology Variables
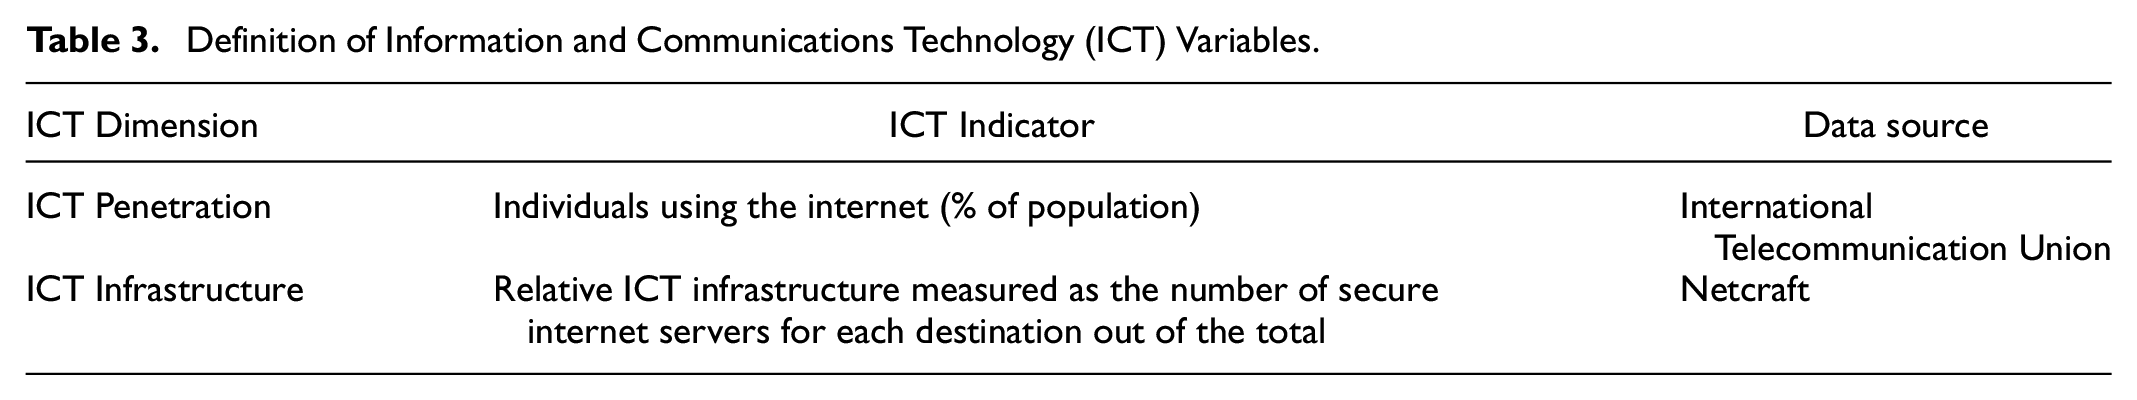
We collected data on information and communications technology variables to represent the development and connectivity of information and communications technology in a destination. Although there are existing indexes, such as information and communications technology readiness and network readiness, that could be used for this purpose, we faced challenges finding complete data for these indicators. Therefore, we decided to construct the information and communications technology variable. We divided the information and communications technology variable into two dimensions: information and communications technology penetration, measured by internet users, and information and communications technology infrastructure, measured by secure internet servers. Information and communications technology penetration, measured by internet users, reflects the extent to which individuals, including local tourism and hospitality employees, are connected and actively using digital tools. 1 A digitally connected workforce can enhance service quality, streamline operations, and improve interactions between tourists and service providers (Minor et al., 2024). Meanwhile, information and communications technology infrastructure, a relative measure of the number of secure internet servers for each destination, represents the technological backbone that ensures reliable and secure digital transactions, online bookings, and real-time information exchange (Wei et al., 2024). This infrastructure is essential for facilitating seamless interactions in tourism services (Buhalis, 2019), especially for visitors who rely on digital platforms for trip planning, navigation, and transactions. By incorporating information and communications technology penetration and infrastructure, our model captures both the demand-side (user engagement) and supply-side (technological readiness) aspects of the role of information and communications technology in tourism efficiency. Further information can be found in Table 3.
Definition of Information and Communications Technology (ICT) Variables.
Before conducting a regression analysis, we assessed the separability condition, which requires that environmental variables, such as the information and communications technology variables in this study, only affect the distribution of efficiency and not the frontier (Assaf & Tsionas, 2019). If this assumption is violated, the second-stage results and first-stage efficiency scores may not be reliable for testing hypotheses and drawing scientific conclusions (Daraio et al., 2018; Simar & Wilson, 2011). To examine the separability condition, we used the bootstrap test with sample splits, developed by Simar and Wilson (2020). Our results indicate that the separability assumption holds across the period analyzed. 2
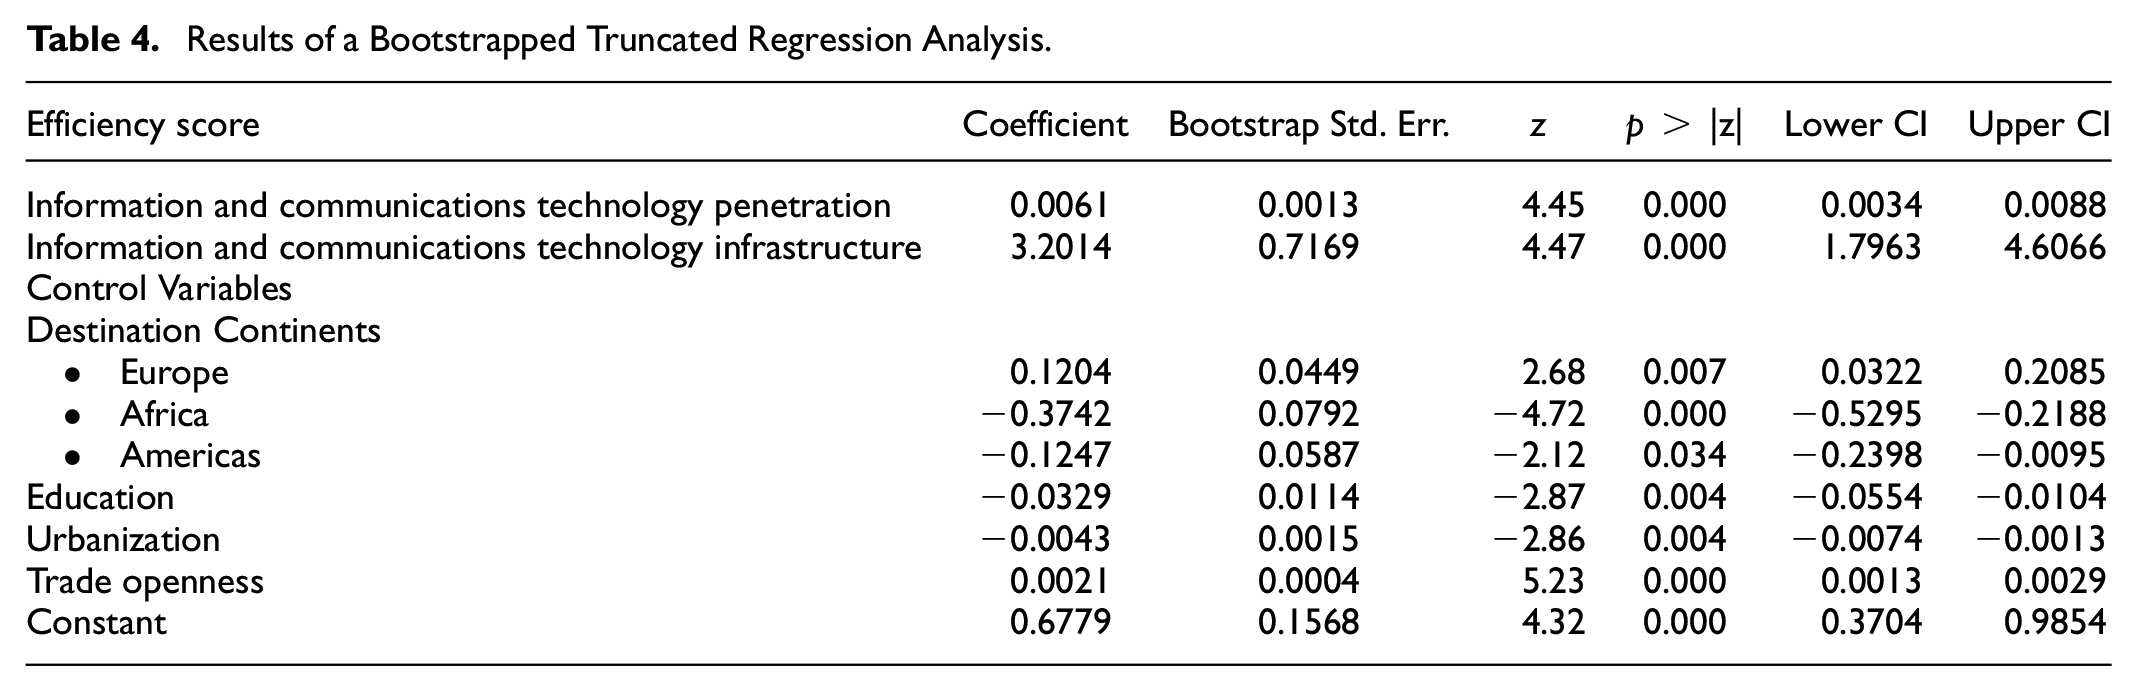
Table 4 presents the results of a bootstrap truncated regression analysis examining the relationship between tourism efficiency scores and information and communications technology variables, including information and communications technology penetration and information and communications technology infrastructure. The study utilized a sample of 52 countries from 2010 to 2019. The analysis revealed that the coefficient for the information and communications technology penetration was 0.0061 with a standard error of 0.0013 and p-value = .000, while the coefficient for the information and communications technology infrastructure was 3.2014 with a standard error of 0.7169 and p-value = .000, holding all other variables constant. We concluded that both information and communications technology indicators are statistically significant predictors of tourism efficiency scores. Thus, H1 and H2 are supported.
Results of a Bootstrapped Truncated Regression Analysis.
While both are significant, we believe that information and communications technology infrastructure serve as the foundation for improving information and communications technology penetration. The availability of internet servers has spurred the development of smart communities. Internet servers have brought benefits to both tourism operators (e.g., digital marketing and financial transactions) and travelers (e.g., information search and staying connected). Therefore, we suggest that tourism companies may need to recognize the critical role of the information and communications technology infrastructure in tourism development, as it enables businesses and destinations to communicate, promote their offerings, and facilitate transactions. Overall, while the development and accessibility of information and communications technology have been recognized as critical determinants to enhance efficiency in sectors such as banking, education, pharmaceuticals, and manufacturing, this is the first study providing empirical evidence that the development and connectivity of information and communications technology can significantly increase tourism efficiency at the global level.
As mentioned, we examined the effects of four control variables on efficiency scores. Regarding continental effects, with Asia Pacific as the reference group, Europe (Coeff = 0.1204, Std. Error = 0.0449, p-value = .007), Africa (Coeff = −0.3742, Std. Error = 0.0792, p-value = 0.000), and the Americas (Coeff = −0.1247, Std. Error = 0.0587, p-value = .034). This suggests that only European destinations tend to have higher efficiency scores relative to Asia Pacific destinations. Education (Coeff = −0.0329, Std. Error = 0.0114, p-value = .004) has a surprisingly significant negative influence on efficiency scores, suggesting that higher levels of education in the destination are associated with lower efficiency. Urbanization (Coeff = −0.0043, Std. Error = 0.0015, p-value = .004) also exhibits a negative effect on efficiency. In contrast, the level of trade openness has a positive and significant effect on efficiency (Coeff = 0.0021, Std. Error = 0.0004, p-value = .000), indicating that countries with higher levels of trade openness tend to achieve higher efficiency scores. This positive relationship between trade openness and efficiency has been widely observed in previous literature (Chaabouni, 2019; Shahbaz et al., 2017; Wong & Tang, 2010), as international trade activities can enhance the diversity of products, lower prices, and reduce transaction costs between countries, thereby attracting more international engagement and improving overall efficiency.
To strengthen the conclusions regarding the positive effect of information and communications technology on tourism efficiency, we also conducted a post-hoc sensitivity analysis using arrivals and expenditures separately as dependent variables. In this stage, we regressed information and communications technology variables on these variables and examined the impact of information and communications technology. Overall, the results strongly align with the DEA, 3 that both information and communications technology infrastructure and penetration play a significant role in driving tourism performance. This reiterates our conclusion and underscores the importance of information and communications technology infrastructure and components in the global development of the tourism industry.
Discussion and Conclusion
Overall, our findings indicate that both information and communications technology indicators, information and communications technology penetration and information and communications technology infrastructure, are statistically significant determinants that positively drive tourism efficiency. Both H1 and H2 are supported. Furthermore, the results of the post-hoc sensitivity analysis using arrivals and expenditures as dependent variables further confirmed our conclusion of the significantly positive impact of information and communications technology infrastructure on tourism performance.
Information and communications technology has significantly changed the tourism industry (Chu et al., 2020; Nusair, 2020). By automating routine, tasks such as processing reservation requests and managing check-ins/check-outs, information and communications technology allows staff to devote their energy to more creative and higher-value activities that enhance the guest experience. Yet, despite widespread recognition of information and communications technology on tourism inputs and outputs, rigorous empirical evidence remains scarce on its effect on tourism efficiency.
To bridge this gap, our study applies a two-stage data envelopment analysis to derive efficiency scores for 52 destination countries over 2010 to 2019, complemented by an importance–performance analysis to analyze each country’s unique profile. In the second stage, we use bootstrap truncated regression to test whether information and communications technology variables affect efficiency. The results reveal that both penetration and infrastructure of information and communications technology have significant, positive effects on tourism efficiency. A post-hoc sensitivity analysis further validates the substantial positive impact of information and communications technology on tourism performance.
This study provides a novel empirical perspective on tourism efficiency by differentiating the impacts of information and communications technology (ICT) infrastructure and ICT penetration. Building on previous work (Chaabouni, 2019; Li & Liu, 2022), this research is one of the first to consider multiple dimensions of ICT simultaneously. By focusing on tourism efficiency, it sheds light on how these distinct ICT dimensions enable destinations to optimize resource allocation and improve overall performance. The findings contribute to the broader literature on ICT in tourism by identifying critical efficiency drivers and discussing their significance for both established and emerging tourism markets.
By examining the impact of information and communications technology through a multidimensional lens on tourism efficiency, this study extends on prior research. In an industry known for its heavy dependence on natural and social assets, leveraging information and communications technology to improve efficiency offers a powerful tool for reducing environmental footprints while building resilient tourism that benefit both visitors and residents. Our findings highlight the efficiency gains achieved through enhanced information and communications technology penetration and infrastructure.
Furthermore, this research makes a substantive contribution to the resource-based view by positioning information and communications technology infrastructure and penetration as strategic resources within the tourism context. The results extend the resource-based framework by showing that competitive advantage emerges not merely from possessing rare assets but from integrating them into an organization’s operational framework. In addition, higher information and communications technology penetration allows local tourism professionals to stay digitally connected, enabling them to respond to travelers’ requests promptly and engage in real-time marketing demands.
In terms of practical implications, destination management organizations should place information and communications technology development as a top strategic priority to drive efficiency and competitiveness while minimizing environmental problems. In addition, by investing in information and communications technology infrastructure, destinations can continuously monitor and manage resources, streamline operations, and offer personalized experiences for tourists. These digital foundations also provide destination management organizations with rich, real-time data insights to refine marketing campaigns and broaden their appeal to new visitor segments. The COVID-19 pandemic highlighted the information and communications technology infrastructure’s vital role in keeping tourism alive amid lockdowns and travel bans; as the industry rebuilds, the role of information and communications technology infrastructure capabilities will be essential for achieving a more resilient, sustainable future.
Despite our efforts to provide a broad international perspective, this study suffers from several limitations. Firstly, we relied on data from 52 destination countries over 2010 to 2019 as these destinations have consistent data. Importantly, two major European markets, Spain and Italy, were excluded from the sample. Spain lacked World Bank data on international tourism receipts, and Italy’s receipts data for 2008 to 2014 were incomplete. Excluding these two countries may limit the generalizability of our results, particularly within Europe. 4 Future research should revisit these destinations once more comprehensive data become accessible and consider extending the sample to additional emerging and established markets. Secondly, although the occupancy rate is a key indicator of tourism performance, it was excluded from our efficiency model because complete information and communications technology and occupancy data existed for only 35 of the 52 countries. To maintain consistency and sample size, we focused on revenues and arrivals as outputs. As data coverage improves, subsequent studies should incorporate occupancy rates, and other relevant metrics, to provide a richer, multidimensional assessment of tourism efficiency.
Thirdly, by concentrating solely on information and communications technology infrastructure and penetration, this study overlooks other important dimensions, such as social media platforms, mobile application ecosystems, and other tools like virtual and augmented reality that likely influence tourism efficiency in important ways. Incorporating these additional information and communications technology dimensions or suitable proxies (e.g., social engagement metrics, app-download rates, or VR-based service usage) would offer a better understanding of how digital technologies influence tourism efficiency. Finally, our analysis examines only the direct influence of information and communications technology on tourism efficiency. Future research should consider analyzing the indirect channels through which information and communications technology affects efficiency.
In conclusion, this study addresses an important gap in the tourism-efficiency literature by offering the first comprehensive and global analysis that both confirms the positive impact of information and communications technology. By deconstructing information and communications technology into infrastructure and penetration and framing our findings within the resource-based view, our results translate directly into strategic guidance: prioritizing targeted information and communications technology investments can unlock efficiency gains across different destinations. Altogether, these insights deepen our understanding of how digital resources drive tourism performance and create a clear path for future research to uncover the broader, long-term effects of technology on sustainable tourism development.
Footnotes
Appendix
Selected References on Tourism Efficiency after 2019.
| Study | Scope | Method | Variable |
|---|---|---|---|
| Liu and Wu (2019) | Spain | Bayesian dynamic stochastic general equilibrium | Tourism sector productivity (treated as a variable influencing growth). Broader economy variables (GDP, capital, labor) and two tourism demand components (domestic vs. inbound). |
| Kularatne et al. (2019) | 24 medium-to-large hotels in Sri Lanka | Data envelopment analysis with double bootstrap for bias-corrected efficiency and truncated regression | Inputs: number of rooms, number of employees, book value of assets. Outputs: room revenue, other revenues (food & beverage, etc.). Determinants examined: hotel size, hotel age, and three eco-friendly practice metrics (energy usage, water usage, and waste management). |
| Ripoll-Zarraga and Raya (2020) | 49 airports in Spain | Two-stage: stochastic frontier analysis with airport-specific fixed effects, then second-stage OLS on tourism variables | Inputs (airport ops): operating costs, staff costs, capital (depreciation). Outputs: passenger throughput, aircraft movements, cargo volume, commercial revenue. Tourism indicators (2nd stage): number of hotel beds, campsites, tourist apartments; tourist arrivals; average tourist expenditure; average length of stay; local tourism labor force. |
| Corne and Peypoch (2020) | 13 French regions | Two-stage approach: data envelopment analysis to compute efficiency, then fuzzy-set qualitative comparative analysis to identify determinant combinations | Inputs: tourism industry employees, accommodation capacity (number of bedspaces). Outputs: tourist arrivals, tourism tax revenue. Determinant factors: presence of beach, ski resorts, number of monuments, number of museums. |
| Assaf et al. (2020) | 11 U.S. airlines | Bayesian stochastic frontier analysis using an input distance function to differentiate controllable vs. uncontrollable bad outputs | Inputs: labor, fuel consumption, fleet size (number of aircraft). Desirable outputs: number of passengers, number of flights. Undesirable outputs: controllable– service complaints, airline-caused delays; uncontrollable– weather-related delays, security-related delays. Control variables: investments in passenger service and maintenance, aimed at reducing undesirable outputs. |
| Deng et al. (2020) | 15 major casino groups (6 in Macao, 9 in Las Vegas) | Two-stage efficiency analysis: data envelopment analysis with bias-corrected bootstrap in Stage 1, followed by a seemingly unrelated regression in Stage 2 to identify environmental determinants of efficiency | Inputs: total assets, total expenses, number of workers. Outputs: gaming revenue and gaming tax receipts. Environmental variables: firm-level factors (e.g., financial leverage, non-gaming share of revenue), industry-level factors (e.g., promotional costs, table game receipts, slot game receipts, baccarat receipts, VIP market share, share of Chinese visitors), and macro-economic factors (e.g., GDP growth, corruption index, global financial crisis, China’s anti-corruption campaign). |
| Abrate et al. (2020) | 117 traditional travel agencies in Italy | Two-stage data envelopment analysis with bootstrap bias-correction; second-stage Tobit regression | Inputs: agency floor space (m2) and operating expenses. Outputs: total revenues (annual). Efficiency scores then regressed on strategic variables: share of inbound tourism, share of in-house tour packages, network membership, online presence, etc. |
| Assaf et al. (2021) | 2,125 observations of U.S. hotels in competitive clusters | Bayesian non-parametric stochastic frontier analysis, addressing endogeneity and avoiding imposed functional forms | Inputs: operational: available room-nights (capacity) and various expense categories (rooms, other ops, utilities, marketing, maintenance). Outputs: room revenue and other revenues (hotel income streams). Context variables: cluster characteristics (e.g. share of high-end hotels in cluster, differentiation index, etc.) used to analyze agglomeration effects. |
| Alemayehu and Kumbhakar (2021) | 94 hotels and restaurants in Norway | Stochastic frontier (input distance function) with heterogeneity (firm and region effects) | Inputs: labor hours (quality-adjusted), available rooms (capital), operating costs (modeled via an input distance/cost function). Outputs: deflated revenue from hotel rooms, F&B, and other services (multi-output combined). |
| Banos-Pino et al. (2024) | Rural tourism in Spanish provinces | Stochastic frontier analysis with control-function true random effects to handle endogeneity | Inputs: number of workers (labor), number of bed places (capital). Outputs: tourist overnight stays. Crowding indicator: tourists-to-local population ratio. |
| Tan et al.(2025) | Hotels in the UK | Hybrid SOCP + MCDM for performance (combines second-order cone programming with multi-criteria decision-making) | Inputs (costs): number of employees, cost of goods sold, depreciation, other operating expenses. Outputs (benefits): operating revenue, liquidity ratio, capitalization, size, total assets, shareholders’ funds. |
| Berbekova et al. (2025) | 82 countries (destinations) worldwide | Stochastic frontier model (multi-output) blended with structural equation modeling | Inputs: tourism intensity (arrivals/population), international tourism receipts, domestic tourism spending, tourism employment, tourism GDP contribution. Outputs: Economic QoL (e.g., income, unemployment), Social QoL (e.g., cost of living, infrastructure, literacy, stability, health, etc), Environmental QoL (e.g., population density, COã per output). |
Author Contributions
Declaration of Conflicting Interests
The author(s) declared no potential conflicts of interest with respect to the research, authorship, and/or publication of this article.
Funding
The author(s) received no financial support for the research, authorship, and/or publication of this article.