
Abstract
Previous methods for destination competitiveness improvement have mainly focused on identifying and prioritizing competitive disadvantages of destinations. Although effective, this approach may not be optimal as it may require more change than improving combinations of other competitive disadvantages. Furthermore, these methods neglect the differing foci of travel experiences between tourist groups and have been unable to identify targeted competitiveness improvement strategies for different tourist groups. This study addresses these research gaps by developing an analytical framework that can identify targeted strategies that entail minimal changes to improve the competitiveness of destinations for different tourist groups, based on user-generated data, aspect-level sentiment analysis, and the optimization-based causal counterfactual Al algorithm. The application of the framework is demonstrated through a case study involving four destinations in Australia. The proposed analytical framework and findings are valuable in assisting destinations to improve their competitiveness in today’s increasingly competitive experiential tourism market.
Keywords
Introduction
Achieving a high level of competitiveness is important for tourist destinations to obtain a favorable market position (Abreu-Novais et al., 2016; Dwyer & Kim, 2003), which contributes not only to the economic development but also to the social and environmental development of tourist destinations (Ritchie & Crouch, 2003). Given its importance, a considerable amount of academic effort has been devoted to understanding the competitive position of destinations around the world and exploring knowledge that may help destinations improve their competitiveness (Crouch, 2011; Y. R. Kim et al., 2022). These existing studies typically identify potential directions for destinations to improve their competitiveness by applying established competitiveness evaluation models (e.g., Crouch & Ritchie, 1999) to capture competitive disadvantages (Andrades & Dimanche, 2017; Ayikoru, 2015; Mustafa et al., 2020). Due to constraints such as resource limitations and policy restrictions, destinations are often unable to address all competitive disadvantages simultaneously. Consequently, some initial studies (e.g., Cracolici & Nijkamp, 2009; Sánchez & López, 2015) have explored methods to prioritize competitive disadvantages (e.g., importance performance analysis). In this way, destination managers can focus on addressing the most pressing disadvantages to improve their destinations’ competitiveness.
Although prioritizing competitive disadvantages is an important extension to applying established competitiveness evaluation models to guide destinations in making informed decisions to improve their competitiveness, there are still some limitations in these existing approaches that deserve further investigation. Firstly, focusing on the most concerning competitive disadvantages may not always be optimal, as addressing them may require more changes than addressing a combination of other disadvantages to achieve the desired level of competitiveness. Suppose that the competitive disadvantages of a destination are “ticket prices,”“transport” and “accommodation” experiences, and the disadvantage that tourists are most concerned about is the “accommodation” experience. Improving the “accommodation” experience (e.g., refurbishing all the hotels) may require substantially more changes than simultaneously enhancing the “transport” experience and “ticket prices” (e.g., providing free shuttle buses and reducing ticket prices) or simultaneously ameliorating the experiences of “accommodation” and “transport” (e.g., refurbishing a small number of hotels and providing free shuttle buses) to raise the destination’s competitiveness to the desired level. To the best of our knowledge, no efforts have been made to help destinations identify optimal strategies that entail minimal changes to improve their competitiveness to a desired level, likely due to the absence of an available method for completing this task.
Second, existing studies typically assume that tourists in a destination are homogeneous, and thereby focus on identifying the same set of changes (e.g., providing free shuttle buses) to improve the competitiveness of a destination for all tourists (Ayikoru, 2015; Mustafa et al., 2020). However, the changes necessary to improve the competitiveness of a destination may vary for different tourist groups (i.e., segments), as their focus on the travel experience differs (Neto et al., 2020). Changes to the experience dimension that are irrelevant to a particular tourist group will not contribute to improving the competitiveness of a destination for that group. Suppose that tourist group A focuses more on the “transport” experience and tourist group B focuses more on the “accommodation” experience. Changes in “accommodation” will increase the competitiveness of the destination for tourist group B, but not for tourist group A, as they value the “transport” experience more. So far, there is no method available to help managers develop such targeted strategies to improve the competitiveness of destinations for different tourist groups.
To address these limitations and fill the research gap regarding optimal (i.e., minimal change in competitive disadvantages) and targeted strategy formulation for improving destination competitiveness, this study proposes framing the improvement of destination competitiveness as an optimization problem. We introduce a destination competitiveness improvement strategy identification framework drawn from aspect-level sentiment analysis, k-means clustering, optimization-based AI methods and online user-generated data. The foundation of this analytical framework (i.e., method) is the causal counterfactual AI algorithm (Xia et al., 2023), which identifies the strategy that entails the most minimal change in tourist touchpoint (De Keyser et al., 2020) and experience dimensions to improve a destination’s competitiveness for different tourist groups by solving an elaborate counterfactual optimization problem. The questions this study aims to answer through the proposed analytical framework are: (1) What minimal change strategies could a destination adopt to improve its competitiveness for different groups of tourists to a desired level? (2) What is the required change for each item in the identified strategy? (3) What is the required total change in each dimension of a destination to improve its competitiveness? The application of the framework is demonstrated through a case study involving four tourist destinations in Australia. The results provide detailed insights that can help the studied destinations make informed decisions to improve their competitiveness in today’s increasingly competitive and complex experiential tourism market.
Literature Review
This section first briefly reviews the definition of destination competitiveness and its evaluation methods, which form the theoretical basis of this study. It then reviews the literature on destination competitiveness improvement and the causal counterfactual AI-based strategy formulation that underpins the methodology of this study.
Destination Competitiveness Evaluation
Destination competitiveness is a multifaceted concept that has been conceptualized and evaluated differently in the literature (Abreu-Novais et al., 2016; Mazanec et al., 2007). Some researchers define destination competitiveness from a supply perspective, relying on expert evaluations of determinants from established models (e.g., Crouch & Ritchie, 1999; Ritchie & Crouch, 2003) or economic indicators to evaluate destination competitiveness (e.g., Croes, 2011; Song et al., 2023). Other researchers define destination competitiveness from a demand perspective and rely on tourist evaluations (e.g., Andrades-Caldito et al., 2014; Neto et al., 2020), or tourist satisfaction (Song et al., 2012) to appraise it.
This study follows the demand perspective, arguing that destination competitiveness can be measured based on tourists’ satisfaction at key touchpoints—the interactions between tourists and destinations—that are important to their travel experience (Stein & Ramaseshan, 2016). We adopt this demand perspective, with an emphasis on tourists’ satisfaction at touchpoints that are important to their experience, because the tourist experience is the only product in the tourism industry and there has been a consistent call for more research from this perspective (Neto et al., 2020; Shoval & Birenboim, 2019; Xia et al., 2024). The theoretical underpinning of our method is touchpoint theory in the customer experience management literature (Holmlund et al., 2020), which conceptualizes and evaluates customer experience through customer satisfaction with direct or indirect interactions (i.e., touchpoints) between customers and organizations (De Keyser et al., 2020). As positive customer experiences lead to positive consumer behavior such as revisiting and loyalty (Srivastava & Kaul, 2016), this research argues that touchpoints with high tourist satisfaction, which indicates positive experiences, can then represent the competitive advantages of a destination and vice versa (H. Kim & Fung So, 2024).
Destination Competitiveness Improvement
Numerous empirical studies have explored ways in which destinations can improve their competitiveness. A typical approach in these studies is applying established competitiveness evaluation models (Dwyer & Kim, 2003; Ritchie & Crouch, 2003) to identify competitive disadvantages that destinations can improve (Gomezelj & Mihalič, 2008). The knowledge identified in this line of research usually includes a set of disadvantages that a destination needs to change to improve its competitiveness, such as foreign direct investment, human resource development, and tourism information dissemination (Chens et al., 2008).
As destinations are often unable to improve all their competitive disadvantages simultaneously due to resource and other constraints, studies therefore go a step further to identify the priority of competitive disadvantages so that destinations can focus on improving the most concerning (i.e., important) disadvantages (Albayrak et al., 2018; Enright & Newton, 2004, 2005). Several methods have been used to identify the priority of competitive disadvantages, such as interviewing stakeholders (Ayikoru, 2015; Azzopardi & Nash, 2016), calculating importance coefficients (Cracolici & Nijkamp, 2009; Sánchez & López, 2015) and applying importance performance analysis (Albayrak et al., 2018; Mustafa et al., 2020). Among them, applying importance performance analysis is the most common. The method provides a prioritization of competitive disadvantages by plotting their performance and importance on a two-dimensional grid (Abreu-Novais et al., 2016).
Focusing on the most concerning disadvantages is undoubtedly a straightforward strategy for destinations to improve their competitiveness within practical constraints. However, this may not always be the most optimal approach. Addressing the most concerning disadvantages could require substantially more changes than improving multiple disadvantages collectively to achieve the desired level of improvement in destination competitiveness. Additionally, targeting only the most concerning disadvantages may be insufficient due to complex interactions between competitive disadvantages.
Moreover, many existing methods implicitly assume that tourists are homogeneous, suggesting that the same set of changes can improve the competitiveness of a destination for all tourists (e.g., Mustafa et al., 2020). However, as indicated in recent literature, destination competitiveness is a “dynamic concept” and different tourist groups (i.e., segments) have varying perceptions about the competitiveness of a destination (Neto et al. 2017, 2020). This means that targeted strategies for different tourist groups are required to effectively improve the competitiveness of a destination for them, as improvement strategies that are effective for one tourist group may not be effective for another (Kumar & Dhir, 2020). To overcome these limitations, this study develops an analytical framework that identifies strategies requiring minimum changes to improve a destination’s competitiveness for various groups of tourists by formulating an elaborate counterfactual optimization problem. The foundation of this framework is the causal counterfactual AI algorithm, which is detailed in the following subsection.
Counterfactuals and Related AI Algorithms for Strategy Formulation
Counterfactuals refer to hypothetical scenarios that explore what would have happened if certain factors had been altered, and they represent a form of causal judgment technique commonly used in everyday human life (Pearl & Mackenzie, 2018). This approach to causal judgment is concluded as causal counterfactual theory (Hannart et al., 2016), which states that an event Y is causally dependent on another event X, if and only if X and Y occur simultaneously in the actual and counterfactual scenarios. If X had not occurred in one scenario, Y would not have occurred either (Lewis, 1973). Causal counterfactual theory holds that the cause of an event always produces different outcomes from what would happen in its absence (Lewis, 1973). For example, if a tourist group’s dissatisfaction stems from an old car park, a scenario with new car parks might meet their expectations. However, if there is no substantial improvement in their experience, then the old car park is not the cause of their dissatisfaction.
This causal judgment approach has been widely used in management research to support strategy formulation because managerial decisions often involve causal reasoning (Durand & Vaara, 2009; McGill, 2000; T. Yang, 2020). A major challenge in counterfactual-based strategy formulation is constructing counterfactuals for complex events, which often have numerous potential causes (e.g., low competitiveness). The interaction between these causes requires the construction of many counterfactuals (i.e., combinations of causes) for potential outcome comparisons (Xia et al., 2023). However, this process is labor-intensive and often impractical for humans, which hinders the use of this strategy formulation approach for complex events. Recently proposed causal counterfactual AI algorithms (Sharma & Kiciman, 2020; Verma et al., 2020) have addressed this challenge by transferring the complexity of counterfactual construction and outcome estimation from humans to algorithms through constructing optimization problems (Huenermund et al., 2022), providing efficient decision-making tools for tourism research (Xia et al., 2023).
Compared to existing methods for destination competitiveness improvement (Albayrak et al., 2018; Enright & Newton, 2004), the causal counterfactual AI algorithm is more cost-effective because it can be applied to easily collected tourism big data and does not require implementation of changes, which usually require extensive resources (Xia et al., 2023). More importantly, the causal counterfactual AI algorithm is able to identify the minimal changes that may cause different outcomes from reality, thus enabling destination managers to identify optimal strategies (i.e., strategies entail minimal changes in tourist touchpoints and experience dimensions) to improve the competitiveness of their destinations to a desired level, which existing methods that focus on identifying all or the most concerning disadvantages cannot achieve.
Methodology
This section details the analytical framework developed to identify the most optimal and targeted strategies to help destinations improve their competitiveness for different groups of tourists based on user-generated data and AI methods (Figure 1). The framework consists of three steps: (1) user-generated data collection, where user-generated data in the form of tourist reviews and ratings are collected; (2) destination competitiveness analysis, where aspect-level sentiment analysis and k-means clustering are used to quantify the competitiveness of the destination and the experiences of different groups of tourists at key touchpoints important to their travel experience; (3) counterfactual-based competitiveness improvement strategy identification, where targeted strategies entailing minimum changes that destinations can adopt to improve their competitiveness for specific groups of tourists are identified through the causal counterfactual AI algorithm and qualitative coding. The detailed processes involved in these steps are visualized in Appendix 1.
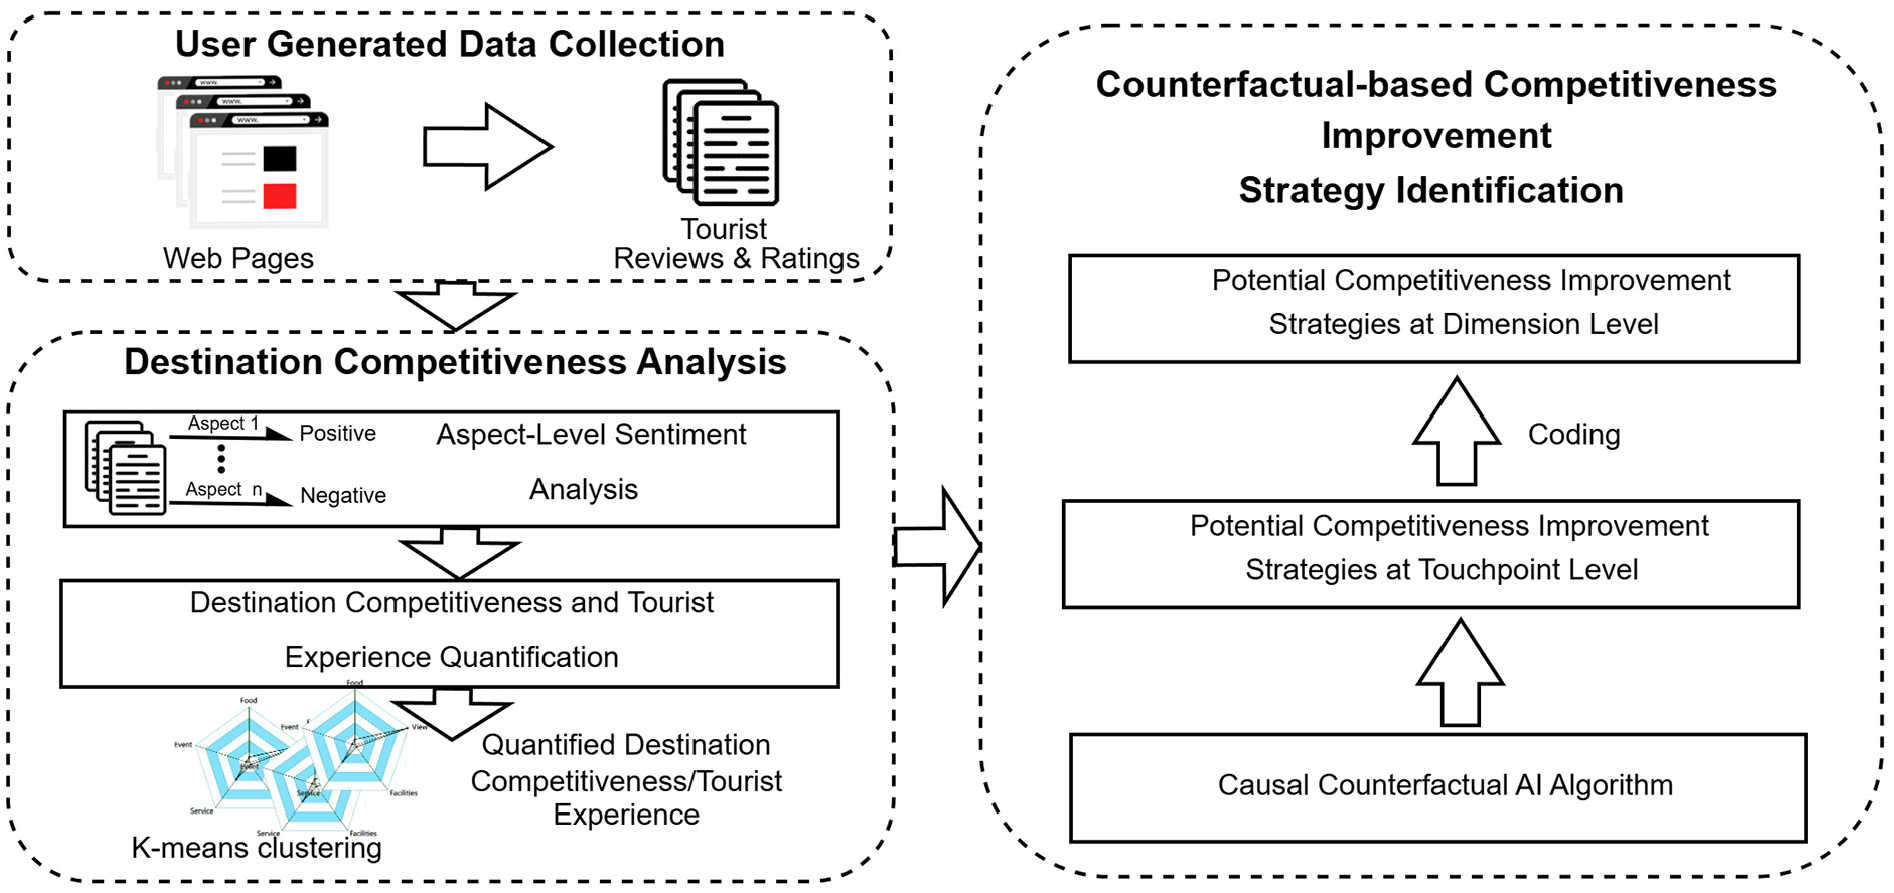
Overview of the proposed competitiveness improvement framework.
User Generated Data Collection
In recent years, user-generated data, in the form of online reviews and ratings, have emerged as an important source of tourist experience big data in tourism research due to advantages such as large-scale availability and non-intrusiveness to human participants (Xia et al., 2023). Examples of platforms containing such user-generated data include TripAdvisor (https://www.tripadvisor.com/), Yelp (https://www.yelp.com/), Agoda (https://www.agoda.com/), and Google Maps (https://www.google.com/maps/). In order to collect tourist reviews and ratings from these online platforms to conduct destination competitiveness analysis, our first step is to identify the tourism service providers (e.g., hotels and attractions) within the target destinations. This can be done by using the search or location features of these platforms. After that, the review page of each tourism service provider is browsed to collect all tourists’ reviews, ratings and overall service ratings. Tourism service providers that do not have this information are excluded. Only English reviews are collected due to their predominant use in Google Maps, and reviews with fewer than 10 words are excluded for insufficient information. Finally, we assign a label to each tourist to indicate their overall satisfaction with their travel experience in the destination based on their ratings. Tourists who give ratings lower than the overall service rating of the provider are labeled “0,” indicating dissatisfaction; otherwise, they are labeled “1,” indicating satisfaction.
Destination Competitiveness Analysis
The objective of destination competitiveness analysis is to accurately measure the satisfaction of different groups of tourists at key touchpoints that are integral to their experience and the competitiveness of destinations at these touchpoints. This involves identifying these key touchpoints and quantifying tourist satisfaction in response to them. The techniques of aspect-level sentiment analysis (Li et al., 2023) and k-means clustering (Frochot, 2005) are employed. Aspect-level sentiment analysis is a type of fine-grained sentiment analysis technique that aims to extract the aspects discussed in a sentence and identify the sentiment toward those aspects (H. Yang et al., 2021). It has been confirmed as an effective technique for capturing tourists’ perceptions of touchpoints that are important to their travel experience (Gao et al., 2024). For an example review, “The staff is friendly, but the car park is too small!”, aspect-level sentiment analysis focuses on extracting the aspects (touchpoints) of “staff” and “car park” discussed by tourists and identifying the sentiment (i.e., positive, negative or neutral) toward these two aspects (touchpoints), namely, “friendly” as “positive” and “too small” as “negative.”
There are several open-source toolkits for aspect-level sentiment analysis. We chose the one provided by H. Yang et al. (2021) due to its strong performance and thorough documentation.
1
Once the aspects in all tourists’ reviews and the sentiments toward these aspects have been extracted by the aspect-level sentiment analysis technique, a post-processing process is applied to identify the key touchpoints that tourists value in their experiences at a destination. First, all aspects are converted to lowercase, typographical errors and sentiments of aspects are checked, and aspects in the form of stop words such as “is” and “the” are filtered out. Second, part-of-speech tagging is performed to filter out non-noun aspects and leave noun aspects as the touchpoints (and their sentiments) for subsequent analysis. Finally, a user-specified touchpoint frequency threshold
Let
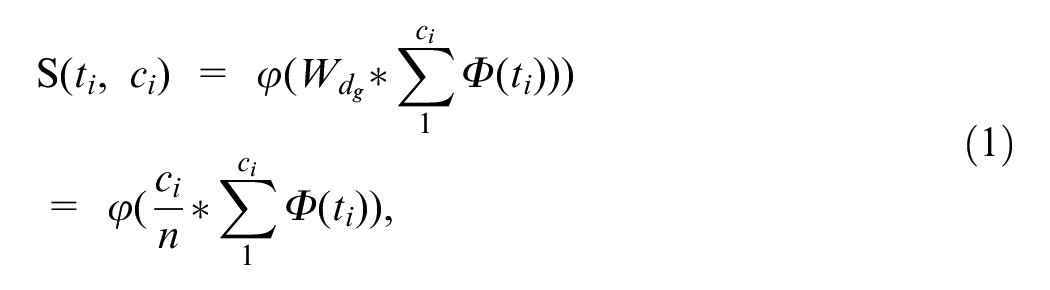
where
A higher normalized group touchpoint opinion score (close to 1) at the touchpoint
After this quantification, the most widely used algorithm in the segmentation literature—k-means—is used to identify tourist groups according to their experience vector
Counterfactual-Based Competitiveness Improvement Strategy Identification
This step identifies the optimal strategies entailing minimal changes that destinations could adopt to improve their competitiveness for different groups of tourists, based on quantified experiences (
Let

where
One challenge in solving the counterfactual optimization problem of Equation 2 is that the

Considering that not all touchpoints focused by tourists are changeable (e.g., location), a one-hot mask vector

where ⊙ is the Hadamard product (Horn & Yang, 2020) that eliminates the changes to the unchangeable touchpoints in
Recognizing that different tourist touchpoints might address the same dimension of a destination, such as “breakfast” and “lunch” experiences both indicating the food quality of the destination, and changes in these dimensions are informative for managers to obtain an overview of the changes required to improve the competitiveness of their destination. Two of the authors therefore independently coded the dimensions of the identified touchpoints to obtain the changes at the dimension level. Disagreements on codes were discussed and resolved within the authoring team. The cumulative changes across unique touchpoints within the same dimension are summarized as the dimension change.
Case Study: Application in Four Australian Destinations
This section presents a case study to demonstrate the application of the developed analytical framework in formulating strategies entailing minimal changes to improve the competitiveness of destinations for different groups of tourists. The data collection is presented first, followed by the analysis of the competitive advantages and disadvantages of the destinations and the strategies to improve competitiveness.
Data Collection
Our proposed framework can be adapted to any online tourism platform that has user-generated data in the form of tourist reviews and ratings. In this study, we use Google Maps for demonstration purposes due to its global popularity as a review platform, the widespread public availability of reviews and its frequent use in tourism studies (Mathayomchan & Taecharungroj, 2020). Four tourist destinations in Australia were selected for analysis: the Great Ocean Road, Phillip Island Nature Park, Cradle Mountain and Rottnest Island (Bilbytravel, 2024). These destinations were chosen for demonstration because they have a relatively high percentage (over 24%) of tourists reporting low satisfaction with their travel experiences (i.e., labeled 0). This indicates the need for these destinations to formulate strategies to improve their competitiveness in providing tourists with more satisfactory experiences, which is the focus of this study.
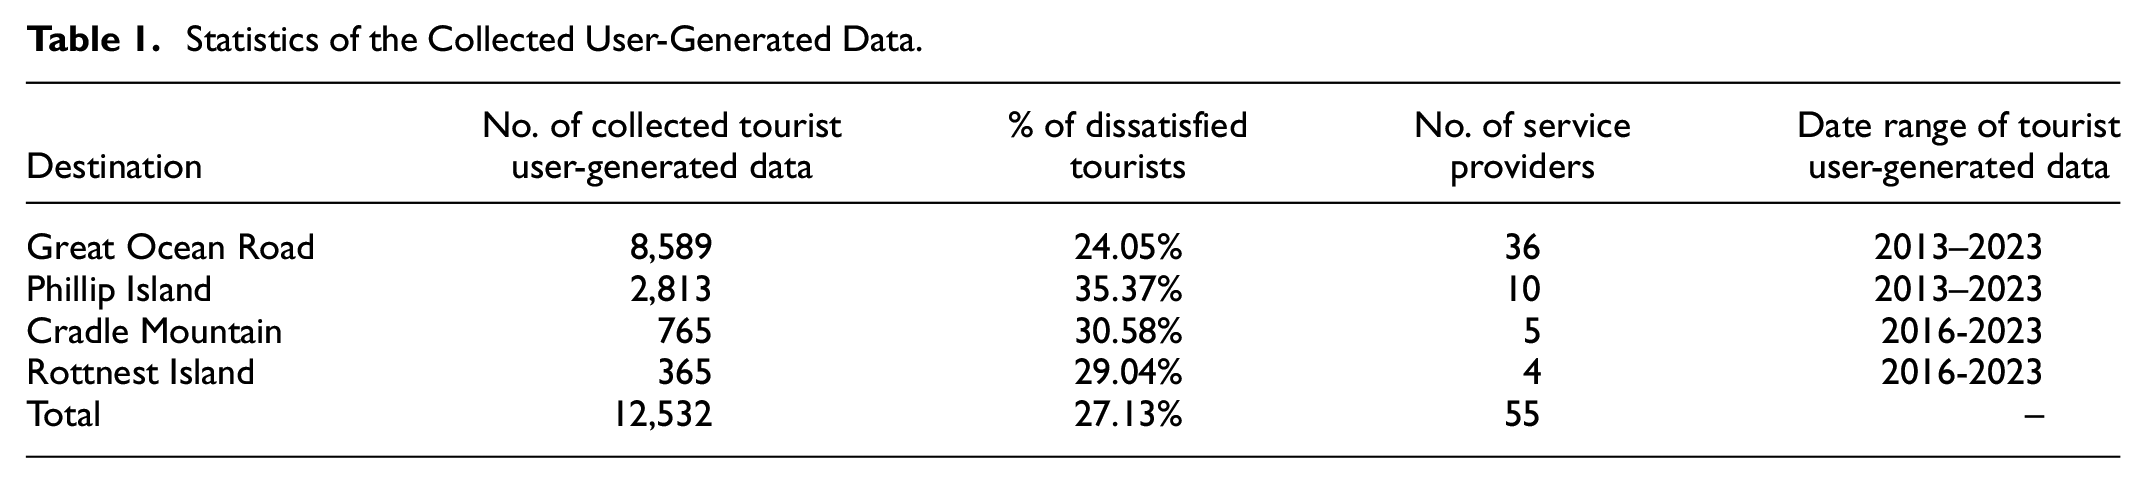
The search terms “Great Ocean Road Itinerary,”“Phillip Island Tour,”“Cradle Mountain Tour” and “Rottnest Island Tour” were used in Google Maps to retrieve relevant tourism service providers in these destinations for data collection. Following the method described in Section 3.1, we collected a dataset of 12,532 tourist user-generated data in July of 2023. Details of the number of service providers, the number of data collected, the percentage of dissatisfied tourists and the date range of the data for each destination are shown in Table 1.
Statistics of the Collected User-Generated Data.
Key Touchpoint Discovery
The collected reviews were analyzed using the process presented in Section 3.1 to identify key touchpoints that are important to the tourist travel experience. Following the aspect-aware recommendation literature (e.g., J. Tan et al., 2021), the touchpoint frequency threshold
The Identified Key Touchpoints That Comprise Tourists’ Experiences and Their Statistics.
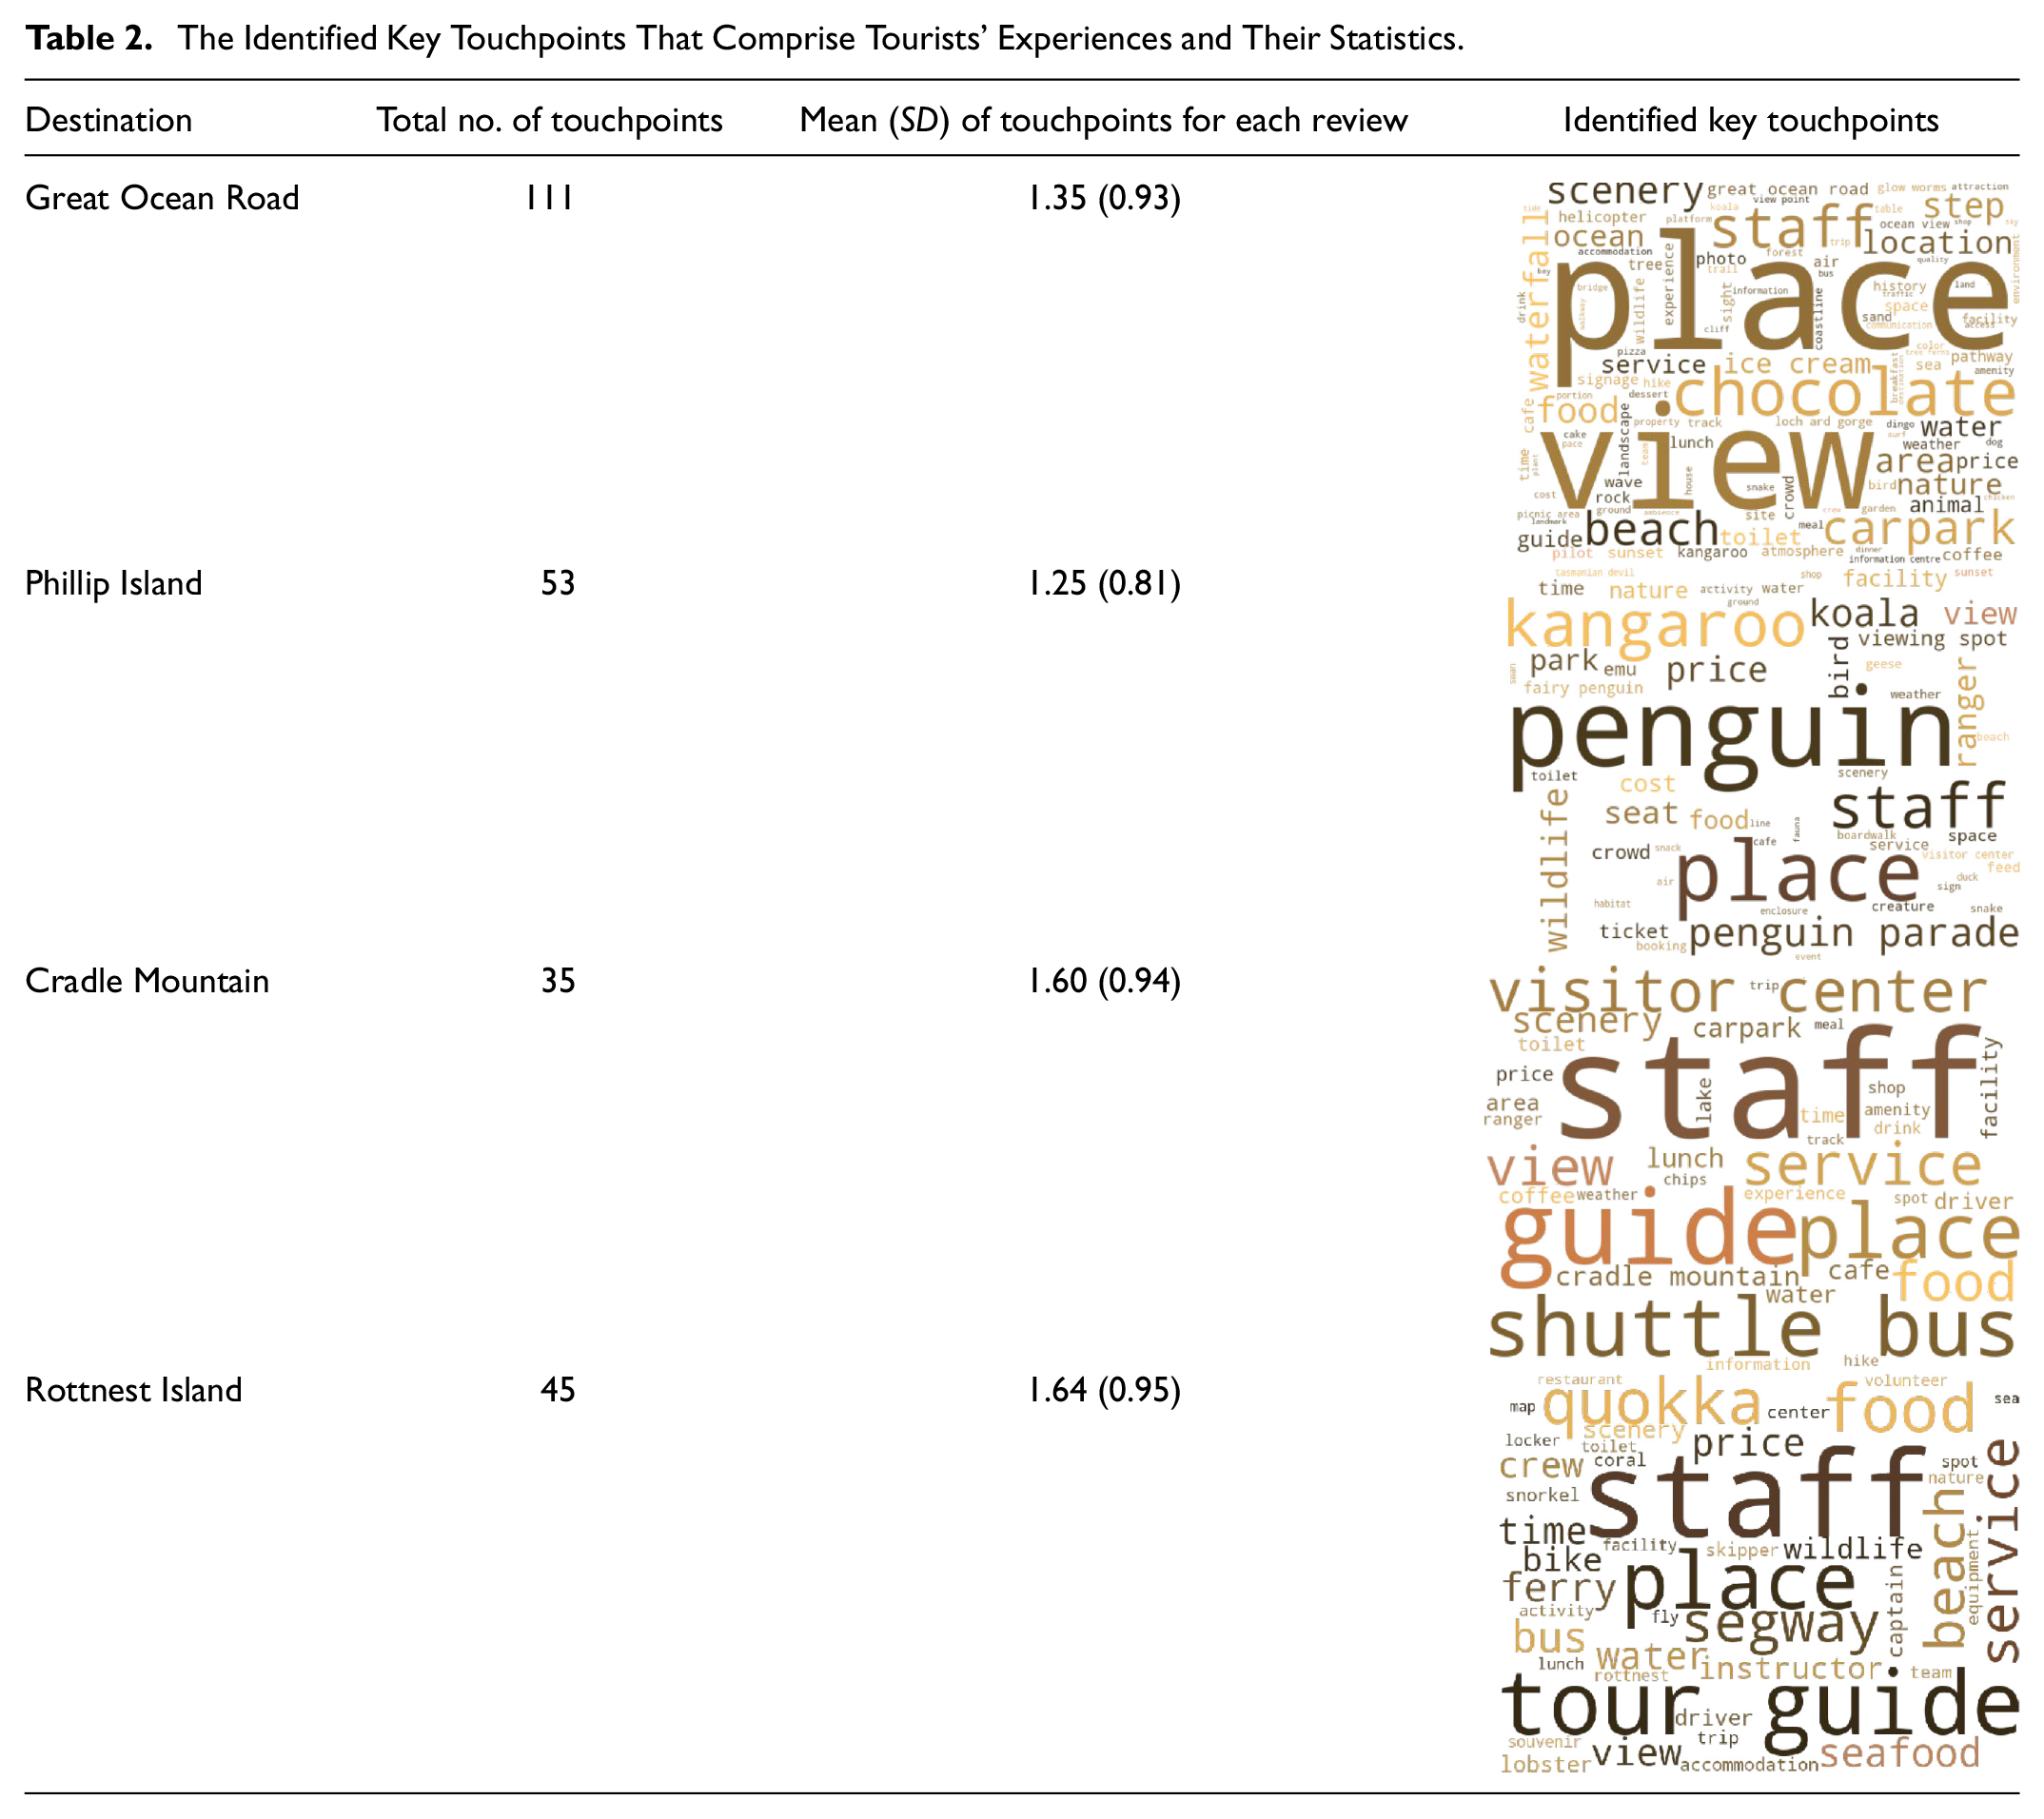
The popular key touchpoints that tourists focus on in the Great Ocean Road include “place” (i.e., the “place” aspect extracted from reviews, indicating the place that tourists visit in the destination), “view,”“scenery,” and “beach.” Consistent with the fact that tourists are deeply impressed by the stunning beach views of the Great Ocean Road. For Phillip Island, key touchpoints of “penguin,”“kangaroo,”“koala,”“penguin parade” and “wildlife” stand out. Consistent with the fact that wildlife on Phillip Island, particularly penguins, kangaroos and koalas, attracts substantial attention from tourists (Bilbytravel, 2024). The key touchpoints that stand out are “guide,”“staff,”“shuttle bus” for Cradle Mountain, and “tour guide,”“quokka,”“staff,”“segway,” for Rottnest Island respectively. These touchpoints align with the unique experiences each destination offers to tourists (Kentish, 2024; Wadjemup Rottnest, 2024).
Competitive Advantage and Disadvantage Identification
The normalized group touchpoint opinion score of the identified key touchpoints was calculated to quantify the tourist experience and understand the competitive advantages and disadvantages of the four destinations studied. As shown in Figure 2, the presence of touchpoints with high normalized group touchpoint opinion scores (close to 1) indicates that these destinations have unique competitive advantages that attract tourists. Meanwhile, the presence of touchpoints with low normalized group touchpoint opinion scores (below 0.5) indicates that there is room for improvement in the overall competitiveness of these destinations.
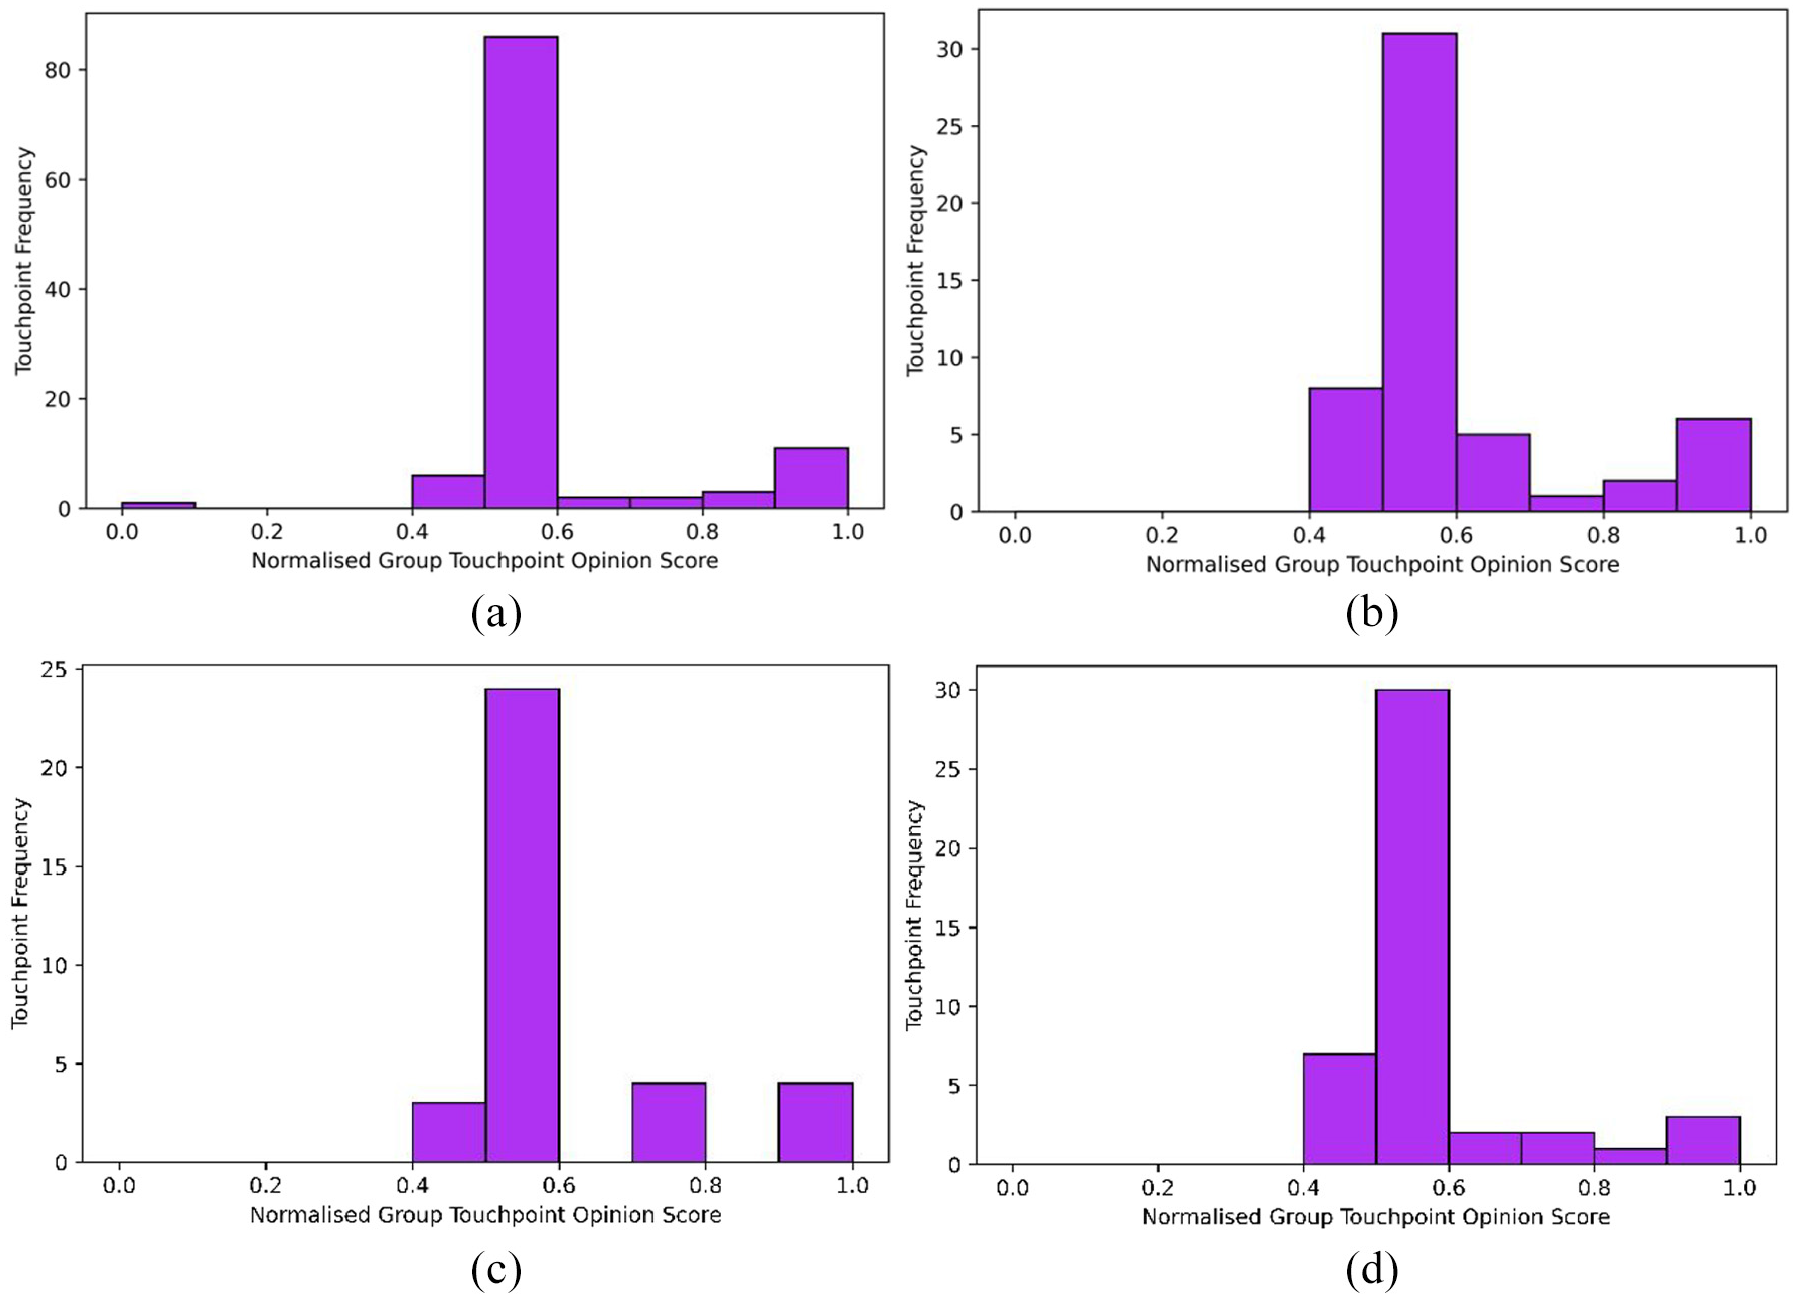
Normalized group touchpoint opinion score distribution of the four destinations at identified key touchpoints: (a) Great Ocean Road, (b) Phillip Island, (c) Cradle Mountain, and (d) Rottnest Island.
To demonstrate the identified competitive advantages and disadvantages of these four destinations, Table 3 shows the top five and last five touchpoints, ranked by the normalized group touchpoint opinion score for each destination. The most unique competitive advantages of the Great Ocean Road (i.e., the top five touchpoints) include the “view,”“place,”“scenery,”“chocolate” and “staff” touchpoints, reflected in its stunning views and famous chocolate factories (e.g., Great Ocean Road Chocolaterie & Ice Creamery 4 ). The most unique competitive disadvantages (i.e., the last five touchpoints) of the Great Ocean Road are the “toilet,”“crowd,”“snake,”“bus” and especially “step” touchpoints. This is probably because the prevalence of steps at Great Ocean Road attractions makes it difficult for some tourists to visit, especially in bad weather when the steps become wet and slippery.
Top Five and Last Five Touchpoints Ranked by Normalized Group Touchpoint Opinion Score for Each Destination.
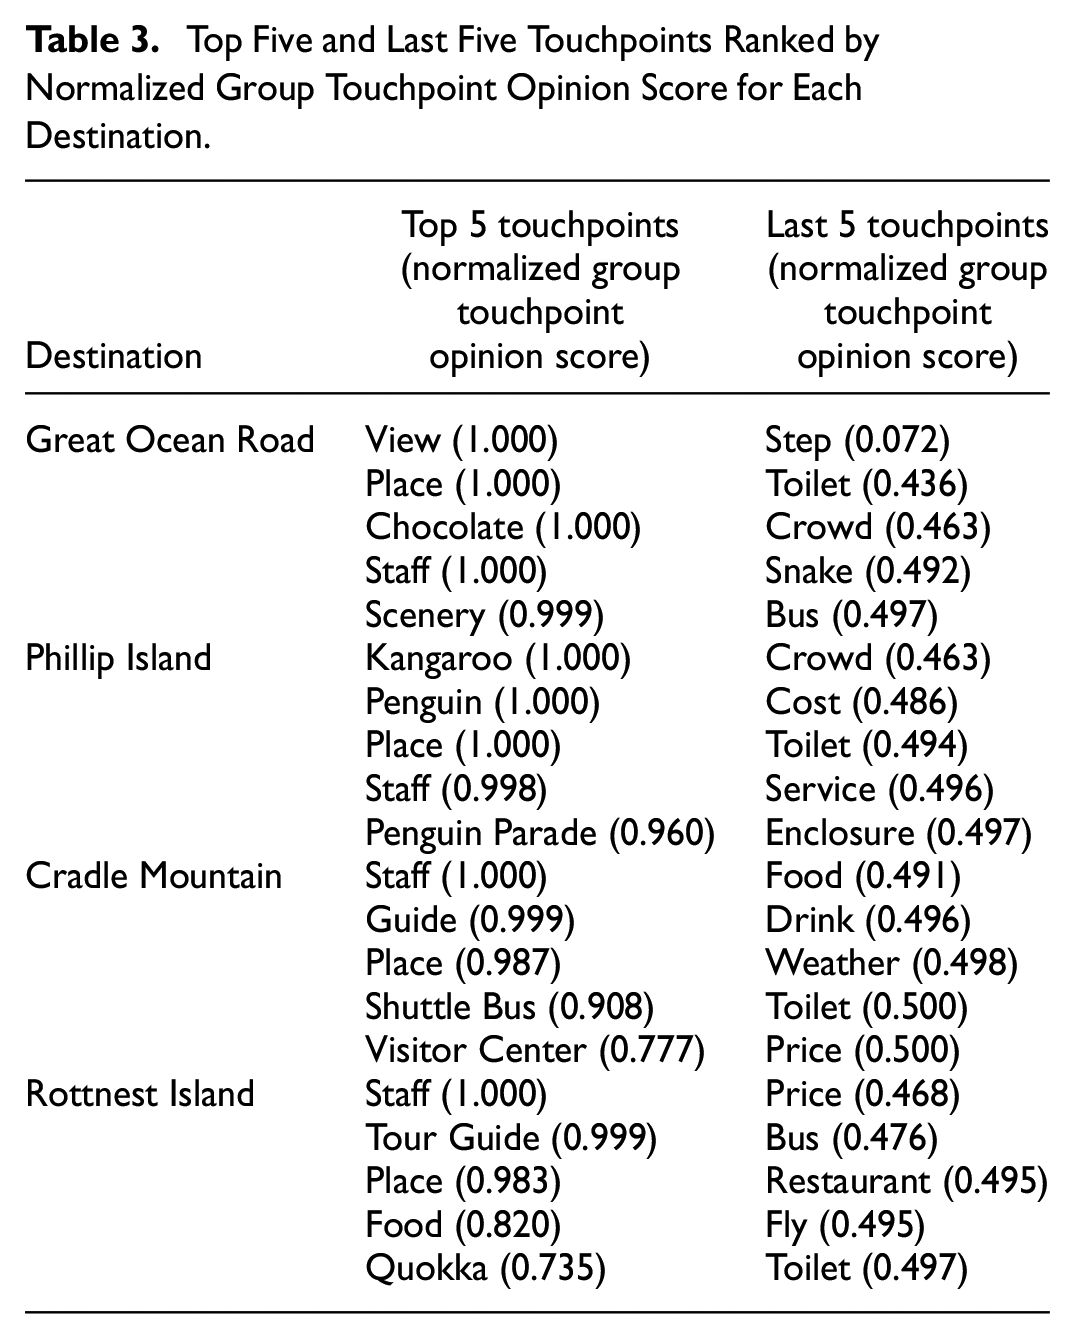
Phillip Island’s most unique competitive advantages are its “kangaroo,”“penguin,”“place,”“staff,” and “penguin parade” touchpoints, reflected in its popularity as a wildlife destination with a variety of Australian wildlife, such as penguins and kangaroos (Bilbytravel, 2024). Its unique competitive disadvantages lie in the “cost,”“toilet,”“service,”“enclosure,” and especially “crowd” touchpoints. This is probably because the destination has attracted too many tourists, and the crowds of tourists have reduced the quality of services and the availability of facilities, such as toilets. For Cradle Mountain, its unique competitive advantages lie in the “staff,”“guide,”“place,”“shuttle bus” and “visitor centre” touchpoints, reflected in its fantastic, guided tour and convenient shuttle bus service (Kentish, 2024). However, its competitive disadvantages are the “toilet,”“price,”“weather,” particularly the “food” and “drink” touchpoints. For Rottnest Island, its key competitive advantages include the “staff,”“tour guide,”“place,”“food” and “quokka” touchpoints. Its competitive disadvantages, however, are the “restaurant,”“fly,”“toilet,”“bus” and especially the “price” touchpoints, as reflected in tourists’ perceptions of higher travel/service costs (Tripadvisor, 2024).
Competitiveness Improvement Strategies Formulation
Changeable Touchpoints and Dimensions
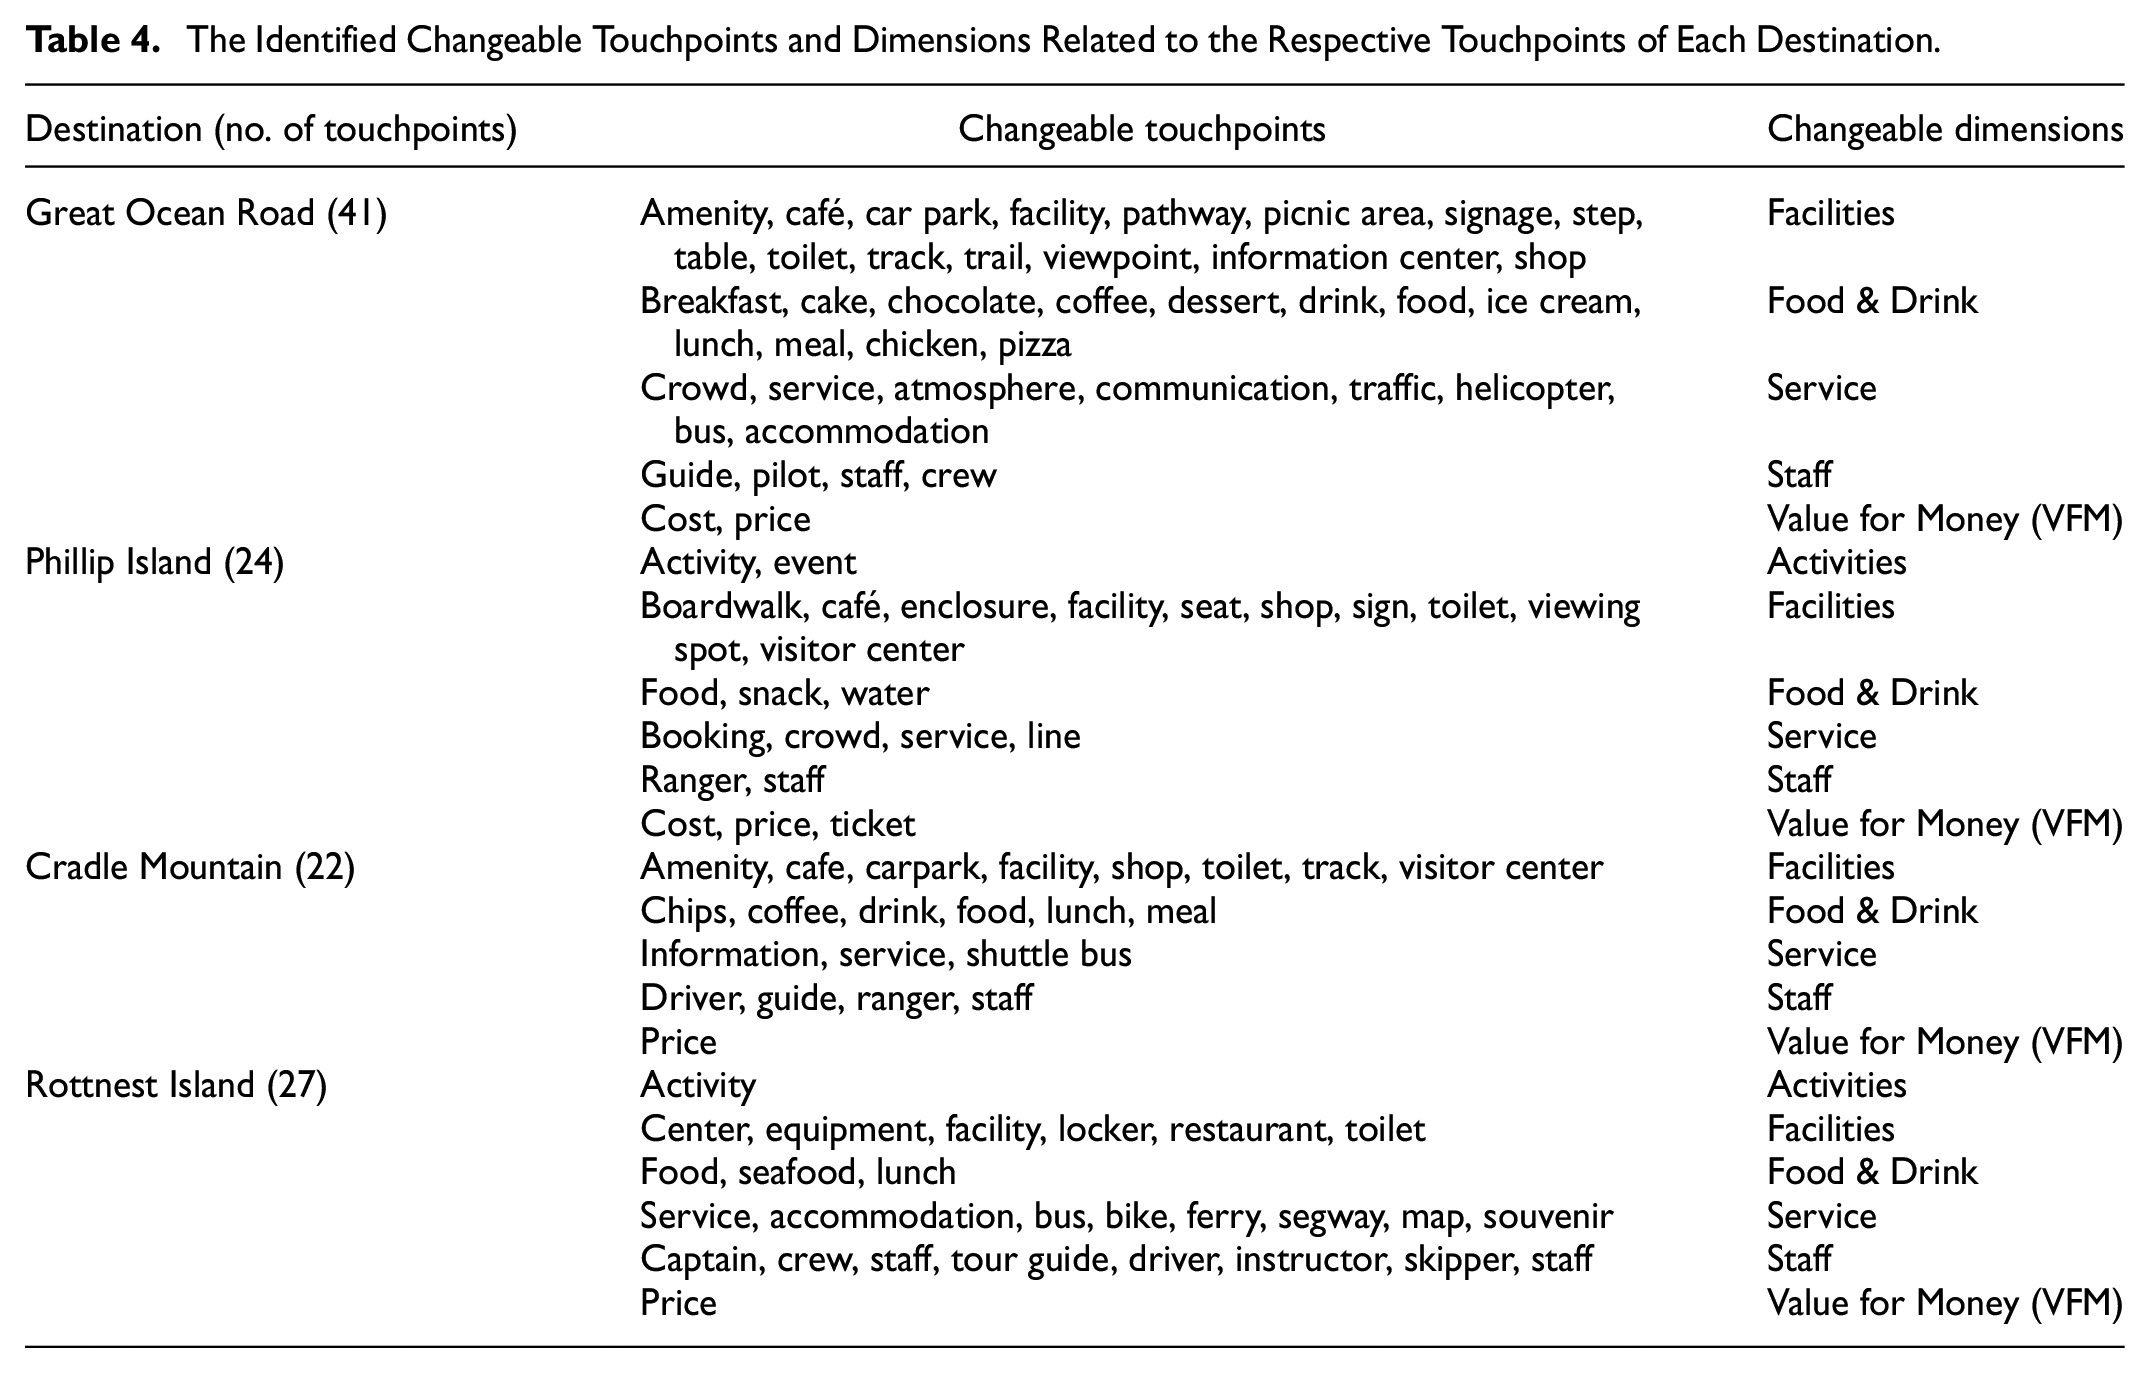
Table 4 presents the identified changeable touchpoints that could be considered in strategy formulation for each of the destinations, along with their respective dimension. The Great Ocean Road and Cradle Mountain have 41 and 22 changeable touchpoints, respectively, grouped into five dimensions: “facilities,”“food & drink,”“service,”“staff” and “value for money (VFM).” Phillip Island and Rottnest Island have 24 and 27 changeable touchpoints, respectively, grouped into six dimensions, of which “activities” is an additional dimension.
The Identified Changeable Touchpoints and Dimensions Related to the Respective Touchpoints of Each Destination.
Tourist Clustering and Strategy Generation Performance
The quantified experience vectors obtained in the previous section were fed into the k-means algorithm to cluster tourists with unsatisfactory experiences according to their satisfaction (i.e., normalized group touchpoint opinion score) at destination touchpoints. Only tourists with unsatisfactory experiences were selected for this step, as the main focus of this study is to help destinations formulate strategies to improve their competitiveness in providing satisfactory experiences to these tourists. Following the existing literature, the elbow method (Sánchez-Rivero et al., 2023) was used to determine the number of clusters k. Figure 3 illustrates the variation of the within-cluster sum of squares against the number of clusters for the k-means clustering of unsatisfied tourists in the four destinations. Analysis of the “elbow” points in Figure 3 reveals five distinct clusters for the Great Ocean Road and four distinct clusters for Phillip Island, Cradle Mountain and Rottnest Island.
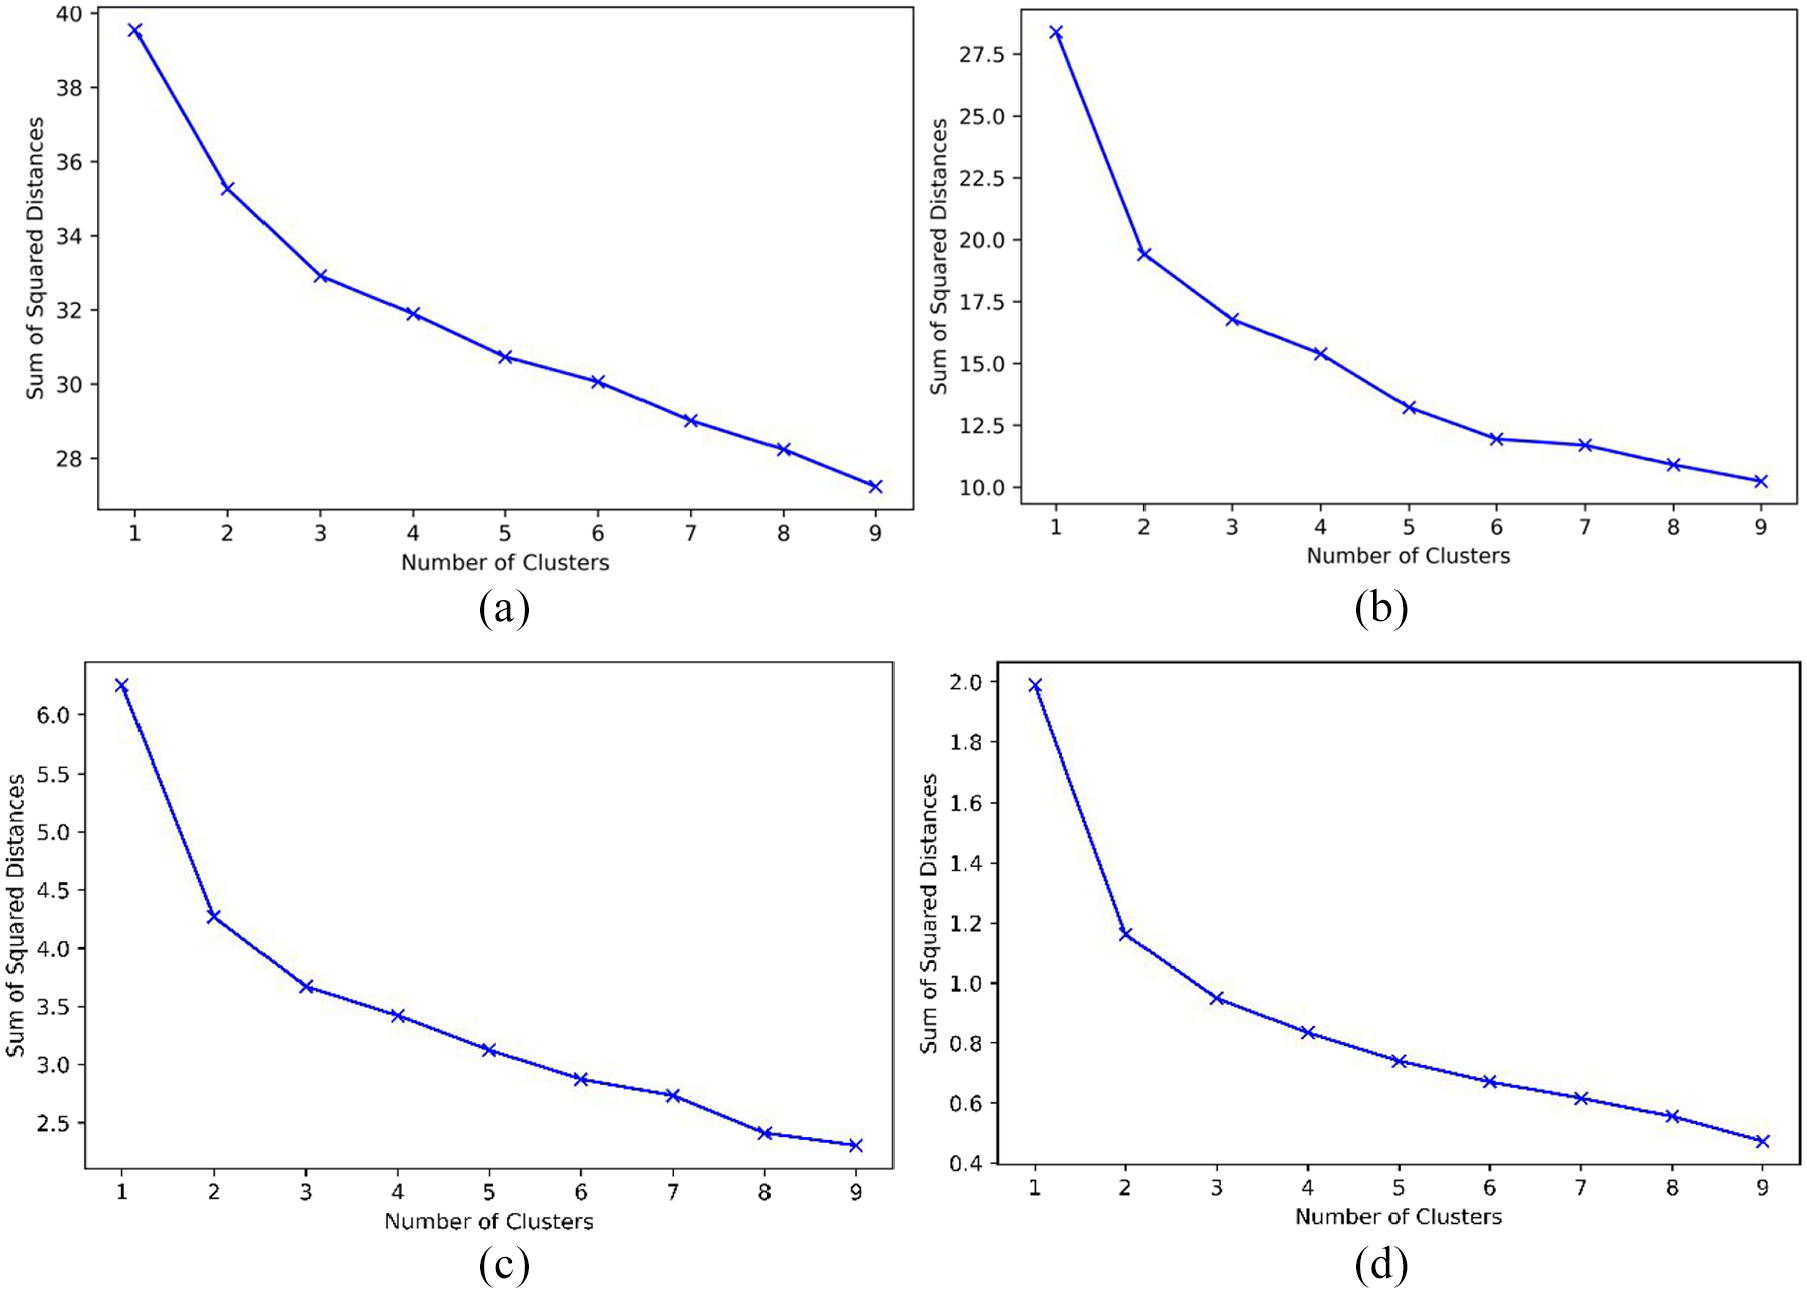
The variation of the within-cluster sum of squares against the number of clusters for unsatisfied tourists: (a) Great Ocean Road, (b) Phillip Island, (c) Cradle Mountain, and (d) Rottnest Island.
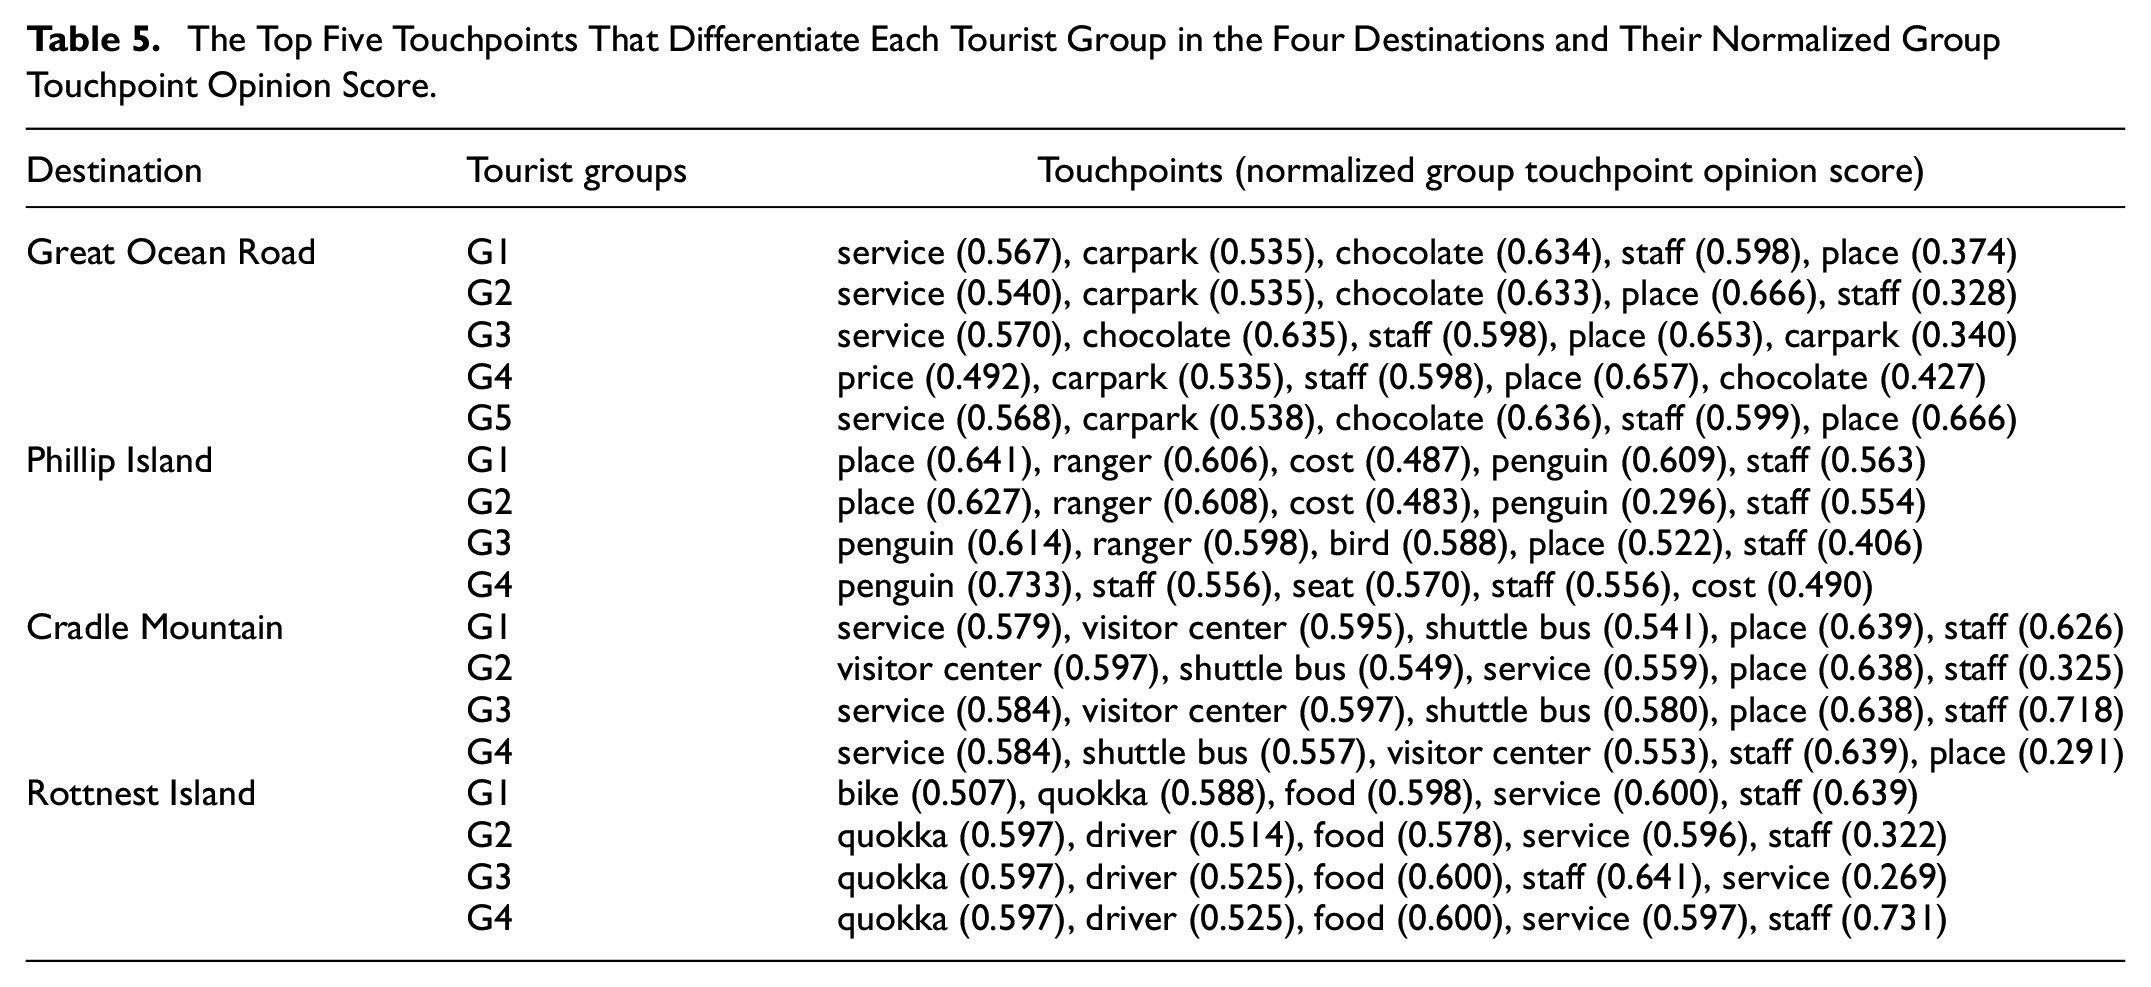
Table 5 presents the top five touchpoints that can best differentiate each tourist group and their normalized group touchpoint opinion score in the four destinations. These touchpoints were identified by summarizing the pairwise absolute difference between each group’s normalized group touchpoint opinion score and those of the other groups. The results show distinct normalized group touchpoint opinion scores between tourist groups, and even different touchpoints for some groups, highlighting the need for targeted strategies to improve the perceived competitiveness of the destination for each tourist group.
The Top Five Touchpoints That Differentiate Each Tourist Group in the Four Destinations and Their Normalized Group Touchpoint Opinion Score.
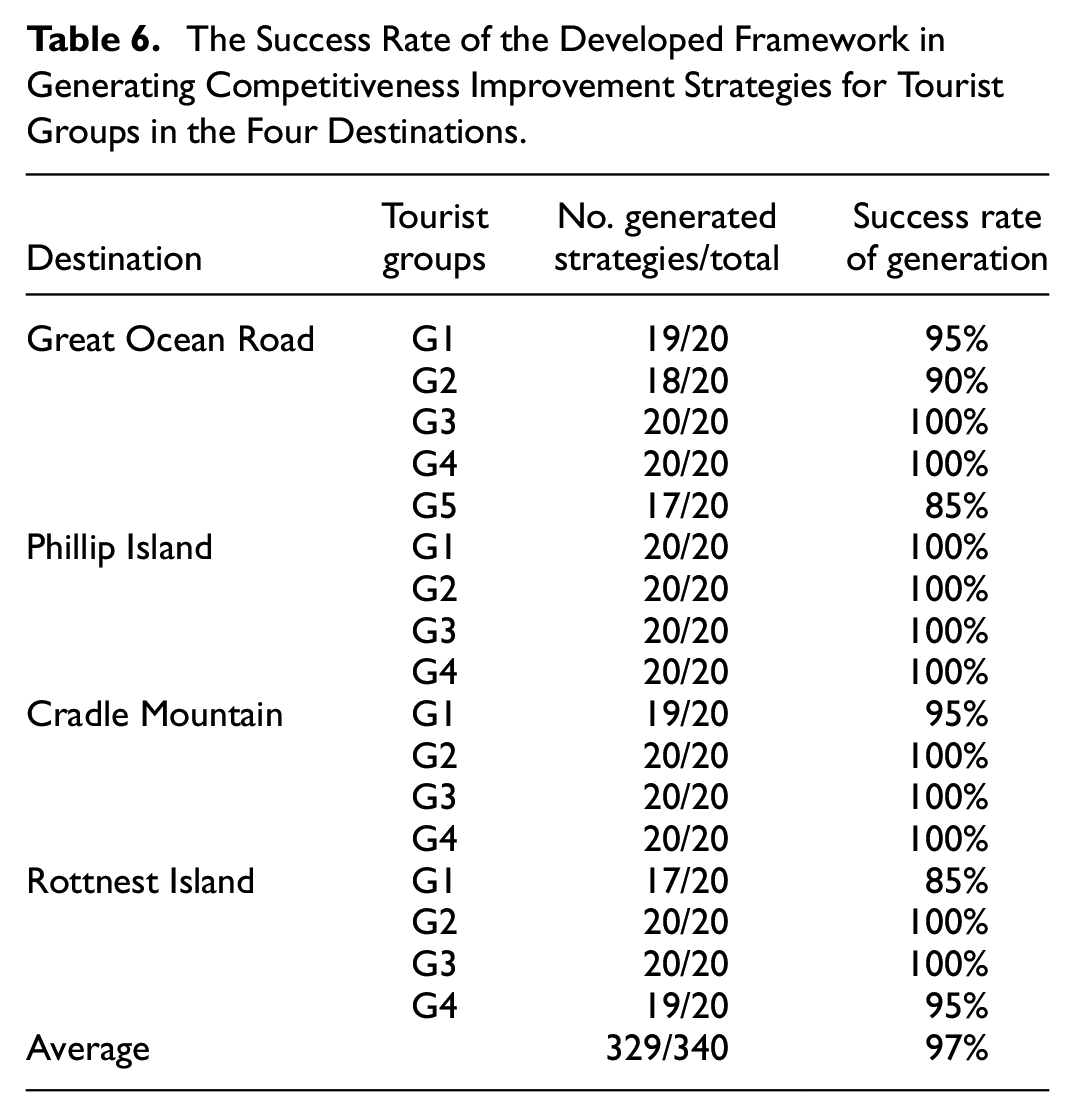
Having identified tourist groups, a counterfactual strategy identifier based on a three-layer neural network was developed to predict whether tourists were satisfied or not with their experience and to identify the corresponding improvement strategies (i.e.,
The Success Rate of the Developed Framework in Generating Competitiveness Improvement Strategies for Tourist Groups in the Four Destinations.
Competitiveness Improvement Strategies
This study assumes that destinations prefer strategies that address the most negative changeable touchpoints of each tourist group and of the destination while minimizing the number of touchpoints changed and the total change. The results of the identified strategy according to this assumption for each tourist group are presented in Table 7. The number in parentheses indicates the required change in terms of the normalized group touchpoint opinion score for each touchpoint to effectively improve the competitiveness of the destination for each tourist group. This number provides managers with an overview of the extent to which a touchpoint needs to be changed to improve their destination’s competitiveness. For tourist groups of the Great Ocean Road, our identified strategies suggest that changes to the “crowd” touchpoint (G1); the “toilet” touchpoint (G2); the “bus” touchpoint (G3); the “crowd” and “step” touchpoints (G4); and the “bus” touchpoint (G5), respectively, can effectively improve the perceived competitiveness of each tourist group. Furthermore, the identified strategies emphasize a greater need to change the “step” touchpoint for tourist group G4.
Touchpoint-Level Competitiveness Improvement Strategies for Tourist Groups in the Four Destinations.
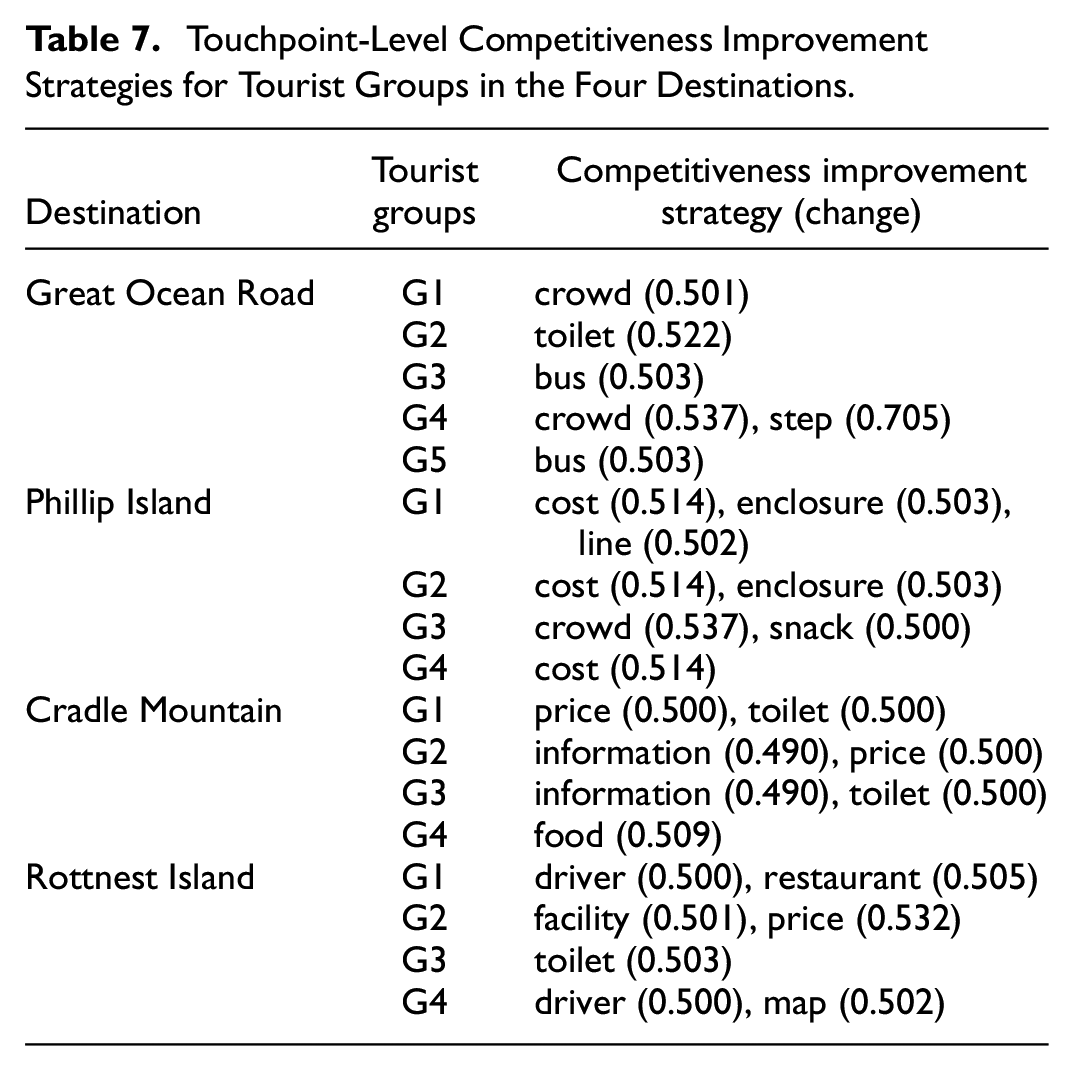
For tourist groups of Phillip Island, our identified strategies suggest that changes to the “cost,”“enclosure” and “line” touchpoints (G1); the “cost” and “enclosure” touchpoints (G2); the “crowd” and “snack” touchpoints (G3); and the “cost” touchpoint (G4) can effectively improve the perceived competitiveness of each tourist group. The touchpoint requiring more change is “cost” for tourist groups G1 and G2, and “crowd” for tourist group G3. For tourist groups of Cradle Mountain, our identified strategies suggest that changes to the “price” and “toilet” touchpoints (G1); the “information” and “price” touchpoints (G2); the “information” and “toilet” touchpoints (G3); and the “food” touchpoint (G4), respectively, can elevate the perceived competitiveness of each tourist group. The touchpoint requiring more change is “price” for tourist group G2 and “toilet” for tourist group G3. For tourist groups of Rottnest Island, our identified strategies suggest that changes to the “driver” and “restaurant” touchpoints (G1); the “facility” and “price” touchpoints (G2); the “toilet” touchpoint (G3); and the “driver” and “map” touchpoints (G4), respectively, can improve the perceived competitiveness of each tourist group. The touchpoint requiring more change is “restaurant” for tourist group G1, “price” for tourist group G2 and “map” for tourist group G4.
Unlike the strategies identified through existing methods, which focus on identifying several most concerning competitive disadvantages (i.e., touchpoints), the strategies identified in this study include a combination of touchpoints that entails minimal changes for each tourist group and required changes for each touchpoint, which is more informative to help managers make informed decisions to improve the competitiveness of their destinations to the desired level. As minimal changes indicate that these strategies require the least effort to improve the competitiveness of destinations, while targeting specific tourist groups allows managers to address the unique needs of each tourist group to improve the competitiveness of destinations for them.
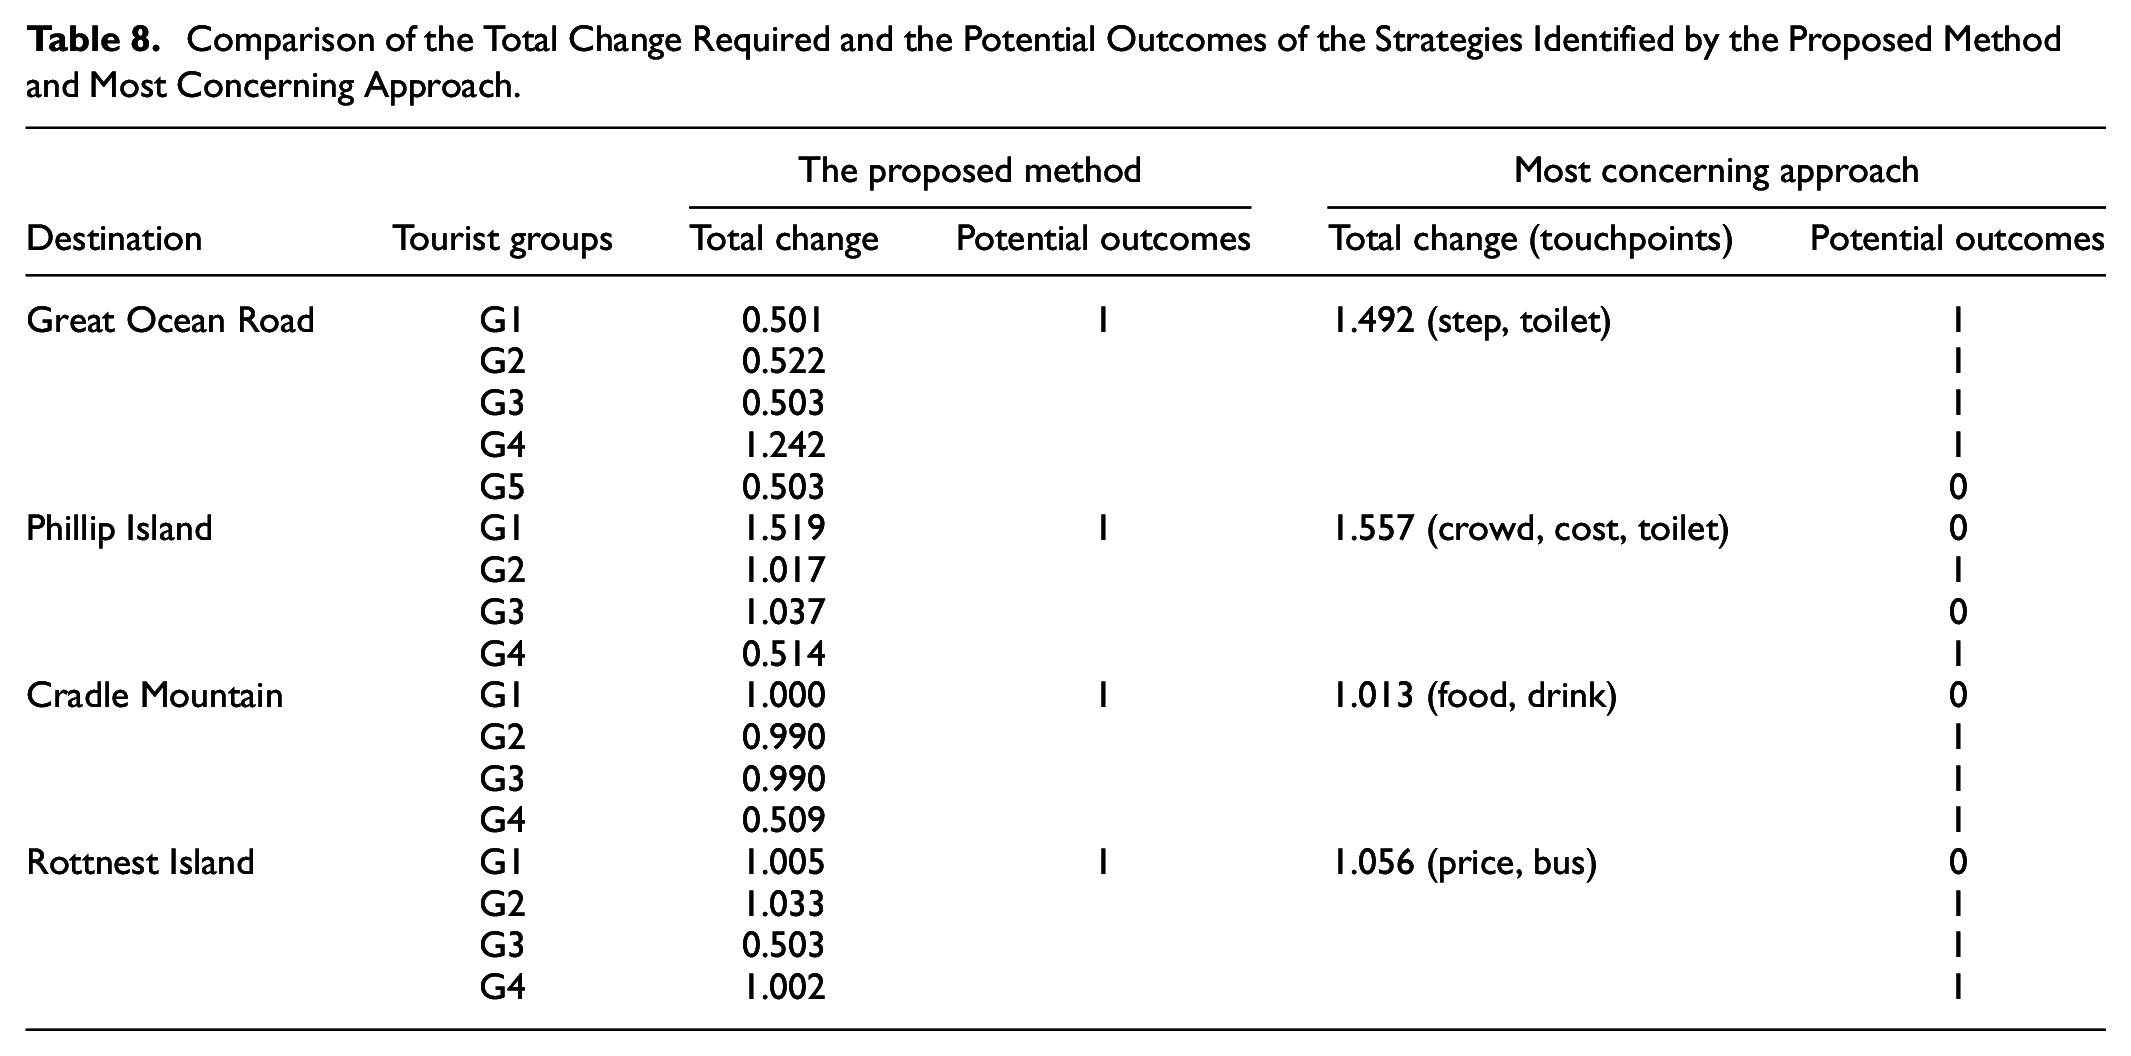
Table 8 presents a comparison of the total required changes and potential outcomes of the strategies identified by our proposed framework versus the most concerning approach at the touchpoint level. The total required change for the strategies identified by our proposed method is calculated by summing the changes outlined in Table 7. In contrast, the total change for the most concerning approach is determined by summing the changes required to improve the
Comparison of the Total Change Required and the Potential Outcomes of the Strategies Identified by the Proposed Method and Most Concerning Approach.
Based on the touchpoint-level strategies identified in Table 7, the dimension-level changes that the four destinations could make to improve their competitiveness for different tourist groups are examined and presented in Table 9. For tourist groups G1, G3 and G5 of the Great Ocean Road, our results suggest changes to the “service” dimension to improve their perceived competitiveness. For tourist groups G2 and G4 of Great Ocean Road, our results suggest changes to the “facilities” dimension; and both the “service” and “facilities” dimensions, to improve their respective perceived competitiveness, and the dimension that requires more change for tourist group G4 is “facilities.” For tourist groups G1, G2, G3 and G4 of Phillip Island, our results recommend that changes to the “value for money (VFM),”“facilities,” and “service” dimensions; the “value for money (VFM)” and “facilities” dimensions; the “service” and “food” dimensions, and the “value for money (VFM)” dimension, respectively, can improve the perceived competitiveness for each tourist group. The dimension requiring more change for tourist groups G1 and G2 is “value for money (VFM),” and, for tourist group G3, it is “service.”
Dimension-Level Competitiveness Improvement Strategies for Tourist Groups in the Four Destinations.
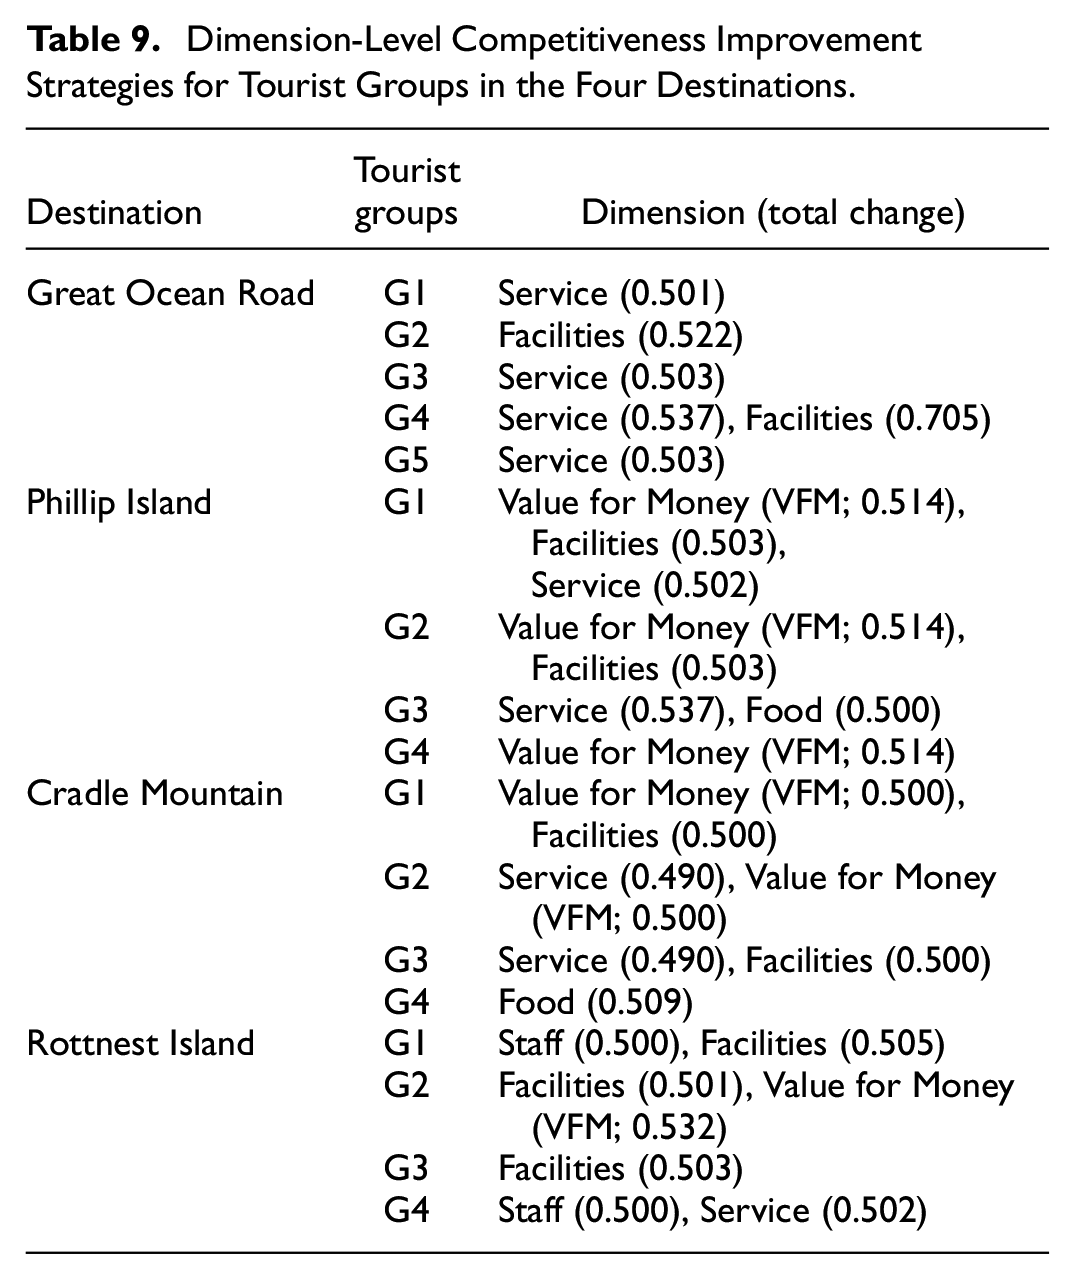
For tourist groups G1, G2, G3 and G4 of Gradle Mountain, our results suggest that changes to the “value for money (VFM),” and “facilities” dimensions; the “service” and “value for money (VFM)” dimensions; the “service” and “facilities” dimensions; and the “food” dimension, respectively, can improve the perceived competitiveness for each tourist group. The dimension requiring more change is “value for money (VFM)” for tourist group G2 and “facilities” for tourist group G3. For tourist groups G1, G2, G3 and G4 of Rottnest Island, our results suggest that changes to the “staff” and “facilities” dimensions; the “facilities” and “value for money (VFM)” dimensions; the “facilities” dimension; and the “staff” and “service” dimensions, respectively, can improve the perceived competitiveness for each tourist group. The dimension requiring more change is “facilities” for tourist group G1, “value for money (VFM)” for tourist group G2 and “service” for tourist group G4. These dimension-level strategies offer detailed insights into the accurate dimensions that require change to improve the competitiveness of the studied destinations for each tourist group, which is valuable in guiding overall resource allocation decisions for targeted competitiveness improvement.
Figure 4 provides an overview of the total changes required in each dimension to improve the competitiveness of the four destinations, calculated by summing up the corresponding touchpoint changes in each dimension. The maximum changes of the same touchpoints are used as the touchpoint change during the summation. For the Great Ocean Road, the dimension requiring the greatest number of changes to improve competitiveness is “facilities,” followed by the “service” dimension. For Phillip Island, the dimension that requires the greatest number of changes to improve competitiveness is “service,” followed by the dimensions of “value for money (VFM),”“facilities” and “food.” For Cradle Mountain, the dimension that requires the most changes to improve competitiveness is “food,” followed by “value for money (VFM),”“facilities” and “service.” For Rottnest Island, the dimension requiring the most changes to improve competitiveness is “facilities,” followed by “value for money (VFM),”“service,” and “staff.”
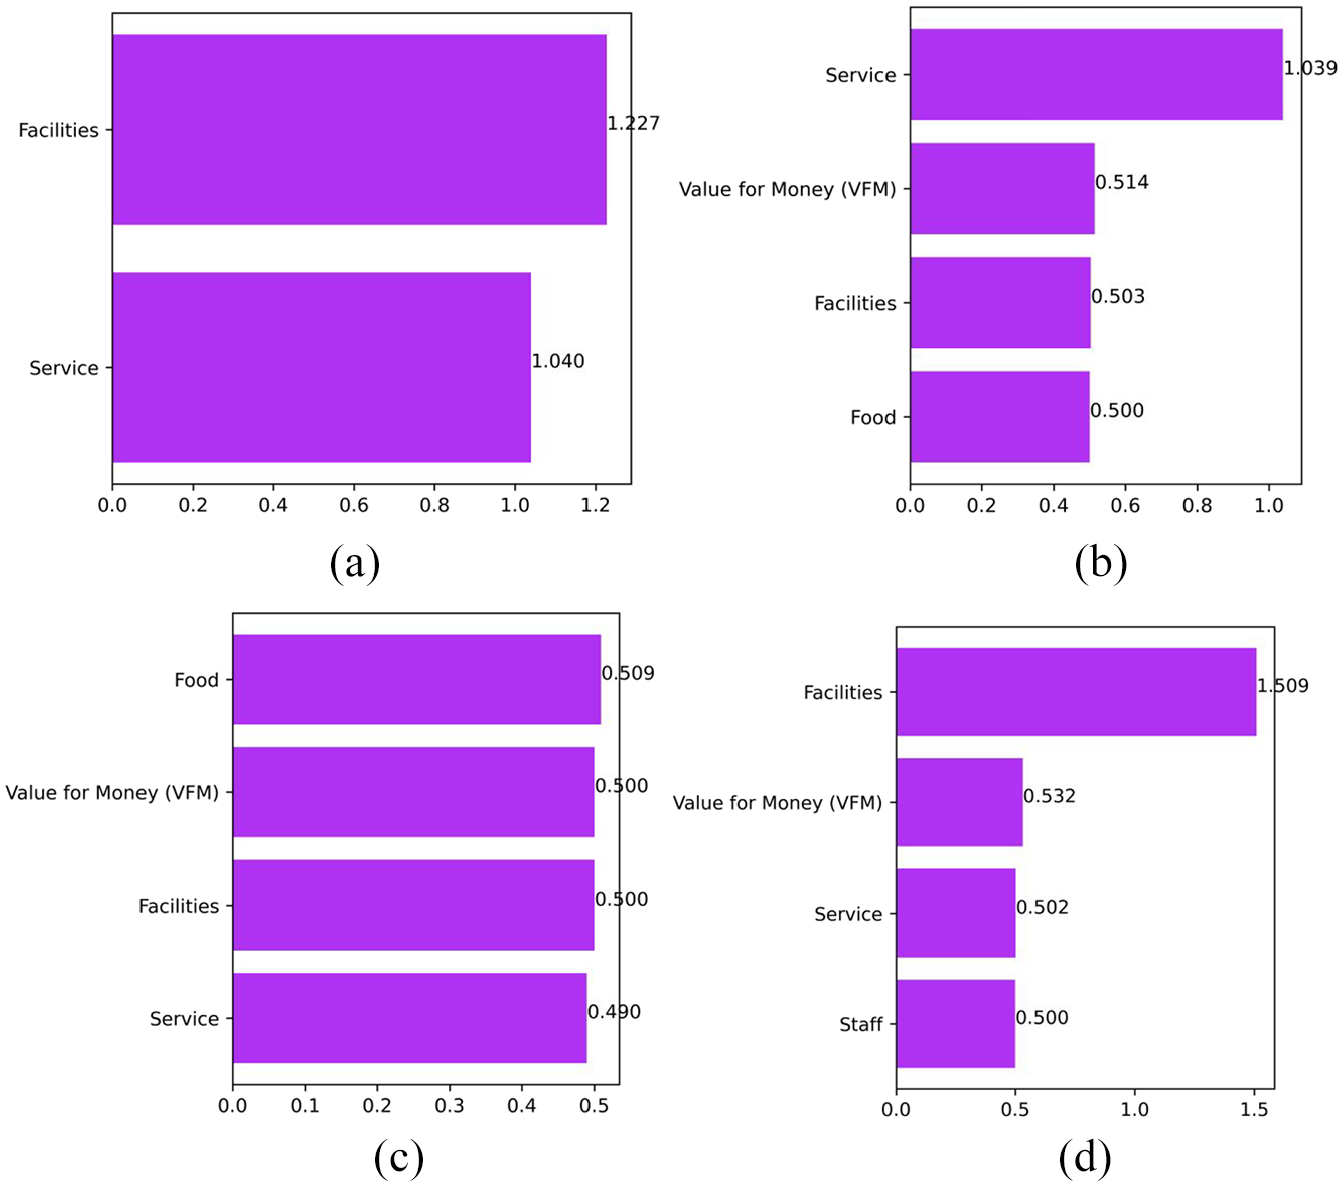
Overview of the dimension-level changes to improve the competitiveness of the four destinations: (a) Great Ocean Road, (b) Phillip Island, (c) Cradle Mountain, and (d) Rottnest Island.
Discussion and Implications
With the proposed framework and results, this study makes several contributions to the existing literature. First, this study extends the methodology of destination competitiveness improvement. Unlike methods such as importance performance analysis (Albayrak et al., 2018; Mustafa et al., 2020) and calculation of importance coefficients (Sánchez & López, 2015), which focus on prioritizing competitive disadvantages (i.e., touchpoints/dimensions) to improve destination competitiveness, our framework is able to identify the most optimal touchpoints/dimensions combinations that entail minimal changes to improve destination competitiveness using AI methods. The proposed framework serves as an initial attempt to improve existing destination competitiveness improvement methods by integrating optimization-based AI decision analytic techniques. These techniques have attracted considerable attention in the recent information systems literature (Ara et al., 2024), yet they remain underexplored in the context of destination competitiveness. Furthermore, unlike existing methods that recommend a set of improvement strategies for all tourists (Ayikoru, 2015; Azzopardi & Nash, 2016), our framework captures differences between tourist groups to identify tailored competitiveness improvement strategies for each group. To the best of our knowledge, this is the first study to develop an analytical framework to identify group-specific competitiveness improvement strategies.
The proposed analytical framework also extends the methodology of AI-based analysis in the tourism literature. Currently, most AI methods used in the tourism literature are association based, such as descriptive AI methods (e.g., associate rule mining; Vu et al., 2018), which aim to capture the patterns in data to help researchers understand complex phenomena, and predictive AI methods (e.g., long short-term memory neural networks; Zhang et al., 2021), which use historical data to make predictions. While these methods have contributed substantially to the understanding of a wide range of tourism problems, the inability of these methods to capture causality and estimate potential outcomes of strategies limits their capacity to formulate more effective strategies to support decision-making (Choudhury et al., 2021). This study is one of the first attempts to explore the use of causal (i.e., prescriptive) AI methods (Langen & Huber, 2023) to support decision-making in the tourism context. Given that tourism management practice often involves interventions (i.e., changing something) and estimating outcomes for decision-making, we call for future studies to explore the use of causal AI methods (Huenermund et al., 2022) to advance tourism management research and practice.
Second, this study has enriched the theoretical underpinnings of the destination competitiveness improvement literature. To the best of our knowledge, this is the first study to challenge the most concerning/important view of strategy identification for improving destination competitiveness and the first to propose the minimal change view of strategy identification by formulating an optimization problem. The main argument of this study is that focusing on the most concerning touchpoints/dimensions may not be the optimal way to identify directions in which to improve destination competitiveness. This is because the touchpoints/dimensions most concerning to tourists may be difficult to change (e.g., “place” for G1 on the Great Ocean Road, in Table 5), and improving the combination of touchpoints/dimensions may require fewer changes to achieve the desired improvement in destination competitiveness (see Table 8). This new perspective on strategy identification opens new avenues for destination managers to take advantage of novel optimization-based AI methods to support strategy development for the improvement of destination competitiveness.
Furthermore, this study is one of the initial attempts to enrich destination competitiveness improvement literature using theoretical underpinnings from the market segmentation literature (Floyd & Gramann, 1997; Prayag et al., 2021). Most previous studies have assumed that tourists in a destination are homogeneous and, therefore, that the same changes can be applied to improve a destination’s competitiveness for all tourists (Ayikoru, 2015; Chens et al., 2008; Chin, 2022). However, as the tourism industry enters the customized experiential era, it is essential to explore the differences between different tourist groups and to develop targeted strategies to improve destination competitiveness (Neto et al., 2020; Peng & Tzeng, 2012). Our study responds to this need, and our results provide detailed strategies that the studied destinations can adopt to improve their competitiveness for different tourist groups, which has not been explored in the literature.
Identifying a comprehensive list of touchpoints that determine tourist experiences (Table 2), this study also lays theoretical foundations for future research to conceptualize and analyze destination competitiveness from the perspective of tourist experience. Currently, most studies conceptualize and analyze destination competitiveness based on established models that include a wide range of pre-defined factors (Dwyer & Kim, 2003; Ritchie & Crouch, 2003). Despite its popularity, one limitation of this approach is that it does not allow for the identification of unique aspects of the product (i.e., the tourist experience) that make a destination competitive in the tourism market. The touchpoint theory adopted in this study provides researchers with the opportunity to understand the unique touchpoints of the tourist experience that compose the competitive advantages and disadvantages of destinations. The analysis conducted in this study also echoes Shoval and Birenboim’s (2019) call for using disaggregated tourist experiences rather than an aggregated satisfaction score to understand destination competitiveness. The changeable touchpoints and dimensions identified also provide detailed insights into what can be changed at the touchpoints (i.e., the micro) level and dimension (i.e., meso) level to improve destination competitiveness, which forms the knowledge base for subsequent studies to improve destination competitiveness from the perspective of tourist experience.
Third, this study also has several practical implications. To begin with, our results reveal the competitive advantages and disadvantages of the destinations studied, which can help managers understand their destination’s unique competitive position. For example, our results indicate that the unique competitive advantages of the Great Ocean Road lie in its scenery-related touchpoints, while the unique competitive advantage of Phillip Island can be identified as its wildlife-related touchpoints. Furthermore, our results provide managers of the studied destinations with detailed insights into what could be changed to improve the competitiveness of their destination for different tourist groups at the touchpoint level and the dimension level, while outlining the required changes at each level. These insights are useful for helping managers allocate budgets and make informed decisions to improve the competitiveness of the studied destinations in the tourism market.
Conclusions
Due to the importance of high levels of competitiveness for destination prosperity, existing studies have devoted extensive efforts to explore knowledge that may help destinations improve their competitiveness (Assaker et al., 2014; Y. R. Kim et al., 2022). Most of these studies have directly applied competitiveness evaluation models to identify competitive disadvantages that destinations need to change to improve their competitiveness. However, as destinations cannot change all their competitive disadvantages, some initial studies have focused on prioritizing these factors and recommending improvements to the most concerning ones. Despite the contributions, this approach may not be optimal, as the most concerning competitive disadvantages may be difficult to change and may require more changes than a combination of developments to other disadvantages would to improve a destination’s competitiveness to a desired level. Furthermore, most existing methods assume that tourists are homogeneous and are therefore unable to capture the differences between tourist groups to identify targeted strategies that will improve the competitiveness of destinations for different tourist groups. However, as suggested in recent studies, destination competitiveness is a dynamic concept, and it is perceived differently by different tourist groups (Neto et al., 2017, 2020); hence, there is a need to identify targeted strategies for individual tourist groups.
To address the limitations of these existing methods, this study developed an analytical framework based on optimization-based AI methods and online user-generated data for identifying strategies to improve destination competitiveness. The framework can take advantage of the interaction of competitive disadvantages and capture the differences between different tourist groups to identify optimal strategies that entail minimal changes to improve the perceived competitiveness of a destination for particular tourist groups. The application of the proposed framework is demonstrated through a case study involving four tourist destinations in Australia. The results reveal detailed touchpoint- and dimension-level strategies that the four destinations could adopt to improve their competitiveness for different groups of tourists, which has not been explored in the existing literature.
Similar to other studies, this study has several limitations that could serve as a starting point for future studies. To begin with, the strategies identified in our framework are derived from computer simulations. Although the simulation results of the causal counterfactual AI algorithm used can identify optimal strategies that entail minimal changes to improve destination competitiveness for different tourist groups, how the resulting strategies can be effectively integrated into destination management practice still needs further investigation. Future research could build on our study by employing experimental designs to identify the detailed steps and the best practices for integrating AI algorithms with the managerial expertise of managers to improve destination competitiveness. Furthermore, the dimension-level competitiveness analysis conducted in this study may not be applicable to other destinations, as these dimensions were derived based on our understanding of the touchpoints. Future studies can explore different dimensions according to their research purpose and the expertise of the researchers involved. Finally, our data only include reviews and overall ratings; future studies could extend this research by exploring the use of aspect ratings in travel platforms and integrating reviewers’ profiles to examine the demographic characteristics of different tourist groups.
Footnotes
Appendix
Declaration of Conflicting Interests
The author(s) declared no potential conflicts of interest with respect to the research, authorship, and/or publication of this article.
Funding
The author(s) disclosed receipt of the following financial support for the research, authorship, and/or publication of this article: This research is supported by an Australian Government Research Training Program (RTP) Scholarship