
Abstract
Recent research suggests that some deficiencies in the insurance industry might be associated with tourists’ lack of knowledge. However, the literature does not present a tool that captures objective knowledge of travel insurance literacy. This research presents a comprehensive, multi-step scale development process resulting in a 15-item scale, which measures objective knowledge about travel insurance terms, regulations, and processes. The results show that travel insurance literacy is associated with trust in sellers. Although no relationship was found between travel insurance literacy and perceived travel risks, these two constructs influence purchase intention. The results also show that there is no relationship between subjective knowledge (self-assessment literacy) and objective knowledge (ratings on the scale). Hence, the research presents a new measurement tool that differs from self-assessment scales prevailing in the tourism literature, opening new opportunities for literacy constructs in the field. Finally, the findings present key managerial implications for the insurance industry.
Introduction
Academics and managers agree that recent years have brought crises to the tourism industry (Assaf et al., 2022; Kim et al., 2021). The war in Ukraine and the COVID-19 pandemic might have increased consumers’ consciousness toward travel risks (Choe et al., 2022). However, travelers were underinsured before the pandemic, an issue that will most likely continue in the future, due to travelers’ misunderstanding of risks and perceived immunity (Caponecchia & Tan, 2019). In addition, these crises altered insurers’ capabilities to cover some incidents (e.g., unexpected flight changes due to new country regulations), which caused some uncertainty in the market (Tan & Caponecchia, 2021). Thus, experts are not optimistic about how the current juncture is increasing consumers’ awareness, and the impact on companies that offer travel insurance.
Travel insurance is a protection plan that covers potential negative incidents during trips, and financially supports tourists when they need to resolve issues (Kerr & Kelly, 2019). It can cover medical treatments, lost luggage, and canceled flights, among other incidents (Choe et al., 2022). From the consumer perspective, acquiring travel insurance has become an independent decision. Nowadays, many consumers believe that packaged-tours—which generally include travel insurance—are not needed any longer. This is due to the increasing trend of the “do-it-yourself” approach when tourists organize their own trips (Sarman et al., 2019). Consequently, many tourists decide whether to get travel insurance without assistance.
In addition, the perceived need for travel insurance differs among traveler segments (Kerr & Kelly, 2019), including consumers from different countries (Kai et al., 2021). For example, while the demand is increasing in some countries in Europe (Global Market Size, 2020), China’s travel insurance market is not consistent with this growth: the penetration in China is only 0.36‱ and the average expense on premium insurance is very low (Kai et al., 2021).
Research has been conducted to shed some light on the differences among specific traveler segments. Studies in this direction are not only limited in the literature (Choe et al., 2022), but also show some mixed results. For instance, while some studies suggested that female tourists with a higher level of education and income are more likely to acquire travel insurance (Lo et al., 2011), other studies showed that male consumers are more likely to do so (Lau et al., 2007). Hence, some authors indicated that little is known about the variables that explain tourists’ decisions in this context, and more research is needed to reveal the effect of key constructs associated with consumers’ attitudes and behavior toward travel insurance (Choe et al., 2022; Sarman et al., 2019; Tan & Caponecchia, 2021).
Prior research has focused on tourists’ perceptions, including perceived risks (Choe et al., 2022) and uncertainty (Yu & Chen, 2018), the perception of insurance based on reviews (Kai et al., 2021), and perceived benefits (Kerr & Kelly, 2019). Pearson and Liu-Thompkins (2012) indicated that consumer perception of complex products, such as an insurance policy (Caponecchia & Tan, 2019), often rely on generic terms, without understanding their meaning properly. Consequently, many consumers make subjective assessments. Viswanathan et al. (2021) added that, when consumers lack knowledge, they engage in concrete thinking (i.e., immediate evaluation of a product based on first impressions), and form perceptions based on isolated pieces of information. This surface-level knowledge can lead to consumers’ dissatisfaction with purchase-related decisions (Adkins & Ozanne, 2005; DelVecchio et al., 2019).
Therefore, for some industries, the role of literacy is key (Adkins & Ozanne, 2005; Bolton et al., 2011, 2015; Mende et al., 2015; Viswanathan et al., 2021). As noted by Mende et al. (2015), a high percentage of consumers show low levels of literacy in particular markets, such as healthcare and financial markets. The authors suggested that this might be the case for other industries as well, issuing a call for investigations in other sectors to observe consumer behavior outcomes. Some authors also indicated the importance of literacy to understand consumer spending (Fernandes et al., 2014; hence, tourists’ spending), with corresponding impact on market-related outcomes (Sarial-Abi et al., 2021). Precisely, consumers’ literacy is associated with setting spending goals (Fernandes et al., 2014), which affects planned (vs. impulsive) spending (Sarial-Abi et al., 2021). These prior findings suggest that literacy might be key to understanding spending in the context of travel insurance, since few consumers acquire insurance impulsively (Saraf & Baser, 2023). Therefore, a lack of planned spending in the context of travel insurance might be explained by an absence of consumers’ knowledge about the types of policies available, the processes, and their benefits.
In connection with the above, some authors recently argued that travel insurance market inefficiencies might be explained by consumer disinformation and unawareness of the intricacies that these products offer (Caponecchia & Tan, 2019; Tan & Caponecchia, 2021). Companies bear the responsibility to support “market illiterates” (Santos et al., 2015) and, to this end, researchers must offer tools to measure consumers’ knowledge (Mende et al., 2015). However, the literature does not present a scale that measures travel insurance literacy and, consequently, no prior research has empirically examined the effects of objective knowledge on tourists’ perceptions and intentions toward travel insurance.
To fill the above-mentioned gaps, this research presents the measurement of a new construct that can explain key consumers’ perceptions and intentions toward travel insurance. The studies followed the generally accepted methodological steps for scale development (Kock et al., 2019). In addition, we examined the relationship of this construct with consumers’ trust in insurance providers and the intention to purchase travel insurance. We also compared the effects of objective and subjective knowledge on these variables. Finally, we tested the interaction of travel insurance literacy with other constructs previously examined in the literature, including perceived travel risks.
Literature Review
The literature review is structured as follows. To begin, (a) prior research on consumer literacy is discussed, (b) highlighting the difference between subjective and objective knowledge, and (c) connecting with key topics and measures in tourism. (d) A review of prior research on travel insurance follows, focused on constructs commonly examined, highlighting the importance of knowledge and the gaps in the literature. Finally, (e) the review focuses on the theoretical reasoning that supports the research hypotheses.
Consumer Literacy
The consumer literacy literature examines numerous different types of literacy. Due to its impact on well-being, several studies have examined financial literacy (e.g., Bolton et al., 2011; Collins & O’Rourke, 2010; Fernandes et al., 2014). Other research investigated market (Viswanathan et al., 2021), service (Mende et al., 2015), health (Bolton et al., 2015), carbon (Horng et al., 2013), genetics (Pearson & Liu-Thompkins, 2012), culture (Hsieh & Hsieh, 2015), digital, and geographic literacy (Chang et al., 2019), as well as consumer aliteracy (DelVecchio et al., 2019).
These studies showed that literacy positively impacts marketplace functioning, with benefits for companies, due to consumers’ proper use of products (Mende et al., 2015), rational spending (Fernandes et al., 2014; Sarial-Abi et al., 2021), and increased sales (Mende et al., 2015). From the consumer perspective, it helps buyers identify the right price and assess quality (Viswanathan et al., 2021). Literacy also fosters the skill to assertively acquire information and protect oneself from deception (Pearson & Liu-Thompkins, 2012). Other benefits of literacy include increased self-efficacy (Bolton et al., 2011), and the ability to make better decisions independently (Pearson & Liu-Thompkins, 2012).
Conversely, when consumers lack literacy, they engage in concrete thinking, and form impressions by processing isolated pieces of information (e.g., buying the least expensive product), instead of abstracting information across product attributes to assess overall value (Viswanathan et al., 2021). This sequence occurs due to the (lack of) ability to process information in a choice setting, and the time devoted to make decisions (DelVecchio et al., 2019).
Although prior studies have applied different methods to assess literacy, including capturing the level of education, and manipulated literacy (i.e., increased literacy due to interventions), the most common method is the use of psychometric scales (Fernandes et al., 2014). The literature presents two types of scales, namely, (a) self-assessment literacy scales (e.g., Mende et al., 2015; Viswanathan et al., 2021), and (b) multiple-choice questions that evaluate consumers’ knowledge (i.e., right/wrong answers; e.g., Fernandes et al., 2014; Pearson & Liu-Thompkins, 2012). The former type measures subjective knowledge (i.e., what consumers believe they know) whereas the latter measures objective knowledge, which is known to be the most effective method to capture literacy (Fernandes et al., 2014). This is because a scale that measures objective knowledge does not reflect individuals’ beliefs; it captures real expertise on a specific field or topic. In addition, measuring subjective knowledge can lead to individuals’ overconfidence and knowledge miscalibration (Pearson & Liu-Thompkins, 2012).
From Subjective to Objective Knowledge
During the 1990s, scholars established the basis of knowledge (mis)calibration (i.e., (dis)agreement between objective and subjective assessments of the validity of information, particularly regarding information used in decision-making) (Keren, 1991; Park et al., 1994). This body of work indicates that knowledge accuracy reflects what consumers know; confidence reflects what they think they know; and calibration reflects their correspondence. This research first noted that correspondence between objective and subjective knowledge (e.g., factual tests vs. self-reported expertise) is usually low among consumers.
Building on this prior research, Alba and Hutchinson (2000) investigated in depth “what consumers know and what they think they know,” and confirmed that “consumers are overconfident—they think they know more than they actually do” (p. 124). Among other findings, the authors pointed out that many individuals usually express higher levels of confidence when they are incorrect than when they are correct.
Research on literacy shows a potential danger of knowledge miscalibration, since some consumers’ decisions are based on what they think they know about a product rather than on genuine knowledge (Pearson & Liu-Thompkins, 2012). This phenomenon is also known in the literature as the “illusion of knowing,” which is associated with overconfidence. Overconfident consumers are more likely to limit their search for information and tend to misunderstand potential harms (Pearson & Liu-Thompkins, 2012). Recent research has indicated that consumers’ lack of knowledge and overconfidence about travel risks can affect the tourism industry in general and, particularly, the travel insurance industry (Tan & Caponecchia, 2021).
Tourist Literacy: Topics and Measures
The literature presents several literacy constructs in tourism research. The constructs most commonly examined in tourism are carbon literacy, adult literacy, and technological literacy (e.g., Horng et al., 2013; Johnson et al., 2019). The review shows the effect of different types of literacy constructs on a series of variables, including a positive association between information literacy and online learning among students in tourism (Peng et al., 2022), and the effect of geographic literacy on perceived risk (Chang et al., 2019) (for a complete overview of research on literacy in tourism, see Supplemental Table A1 and Figure A1 in Appendix 1).
It is worth noting that not all the studies on literacy in tourism used scales. For instance, studies on technological literacy, ocean literacy, digital literacy, cultural literacy, and multicultural literacy did not use scales to measure how much tourists or students knew about the topics. Instead, some employed methods such as literature reviews and content analysis. Studies on information literacy applied a different approach, which did not measure literacy, but rather the effectiveness of information resources on students’ learning desires (e.g., Course information has rich online links; Course information has good content; Course information is easy to obtain; Peng et al., 2022). Similarly, none of the articles that focused on adult literacy used a scale. Instead, they relied on other variables that can be indicators of education levels. Regarding literacy scales in prior tourism research, these did not measure objective knowledge, but rather self-assessment literacy (see examples in Table 1).
Characteristics of the Scales That Measure Literacy Constructs in Tourism.
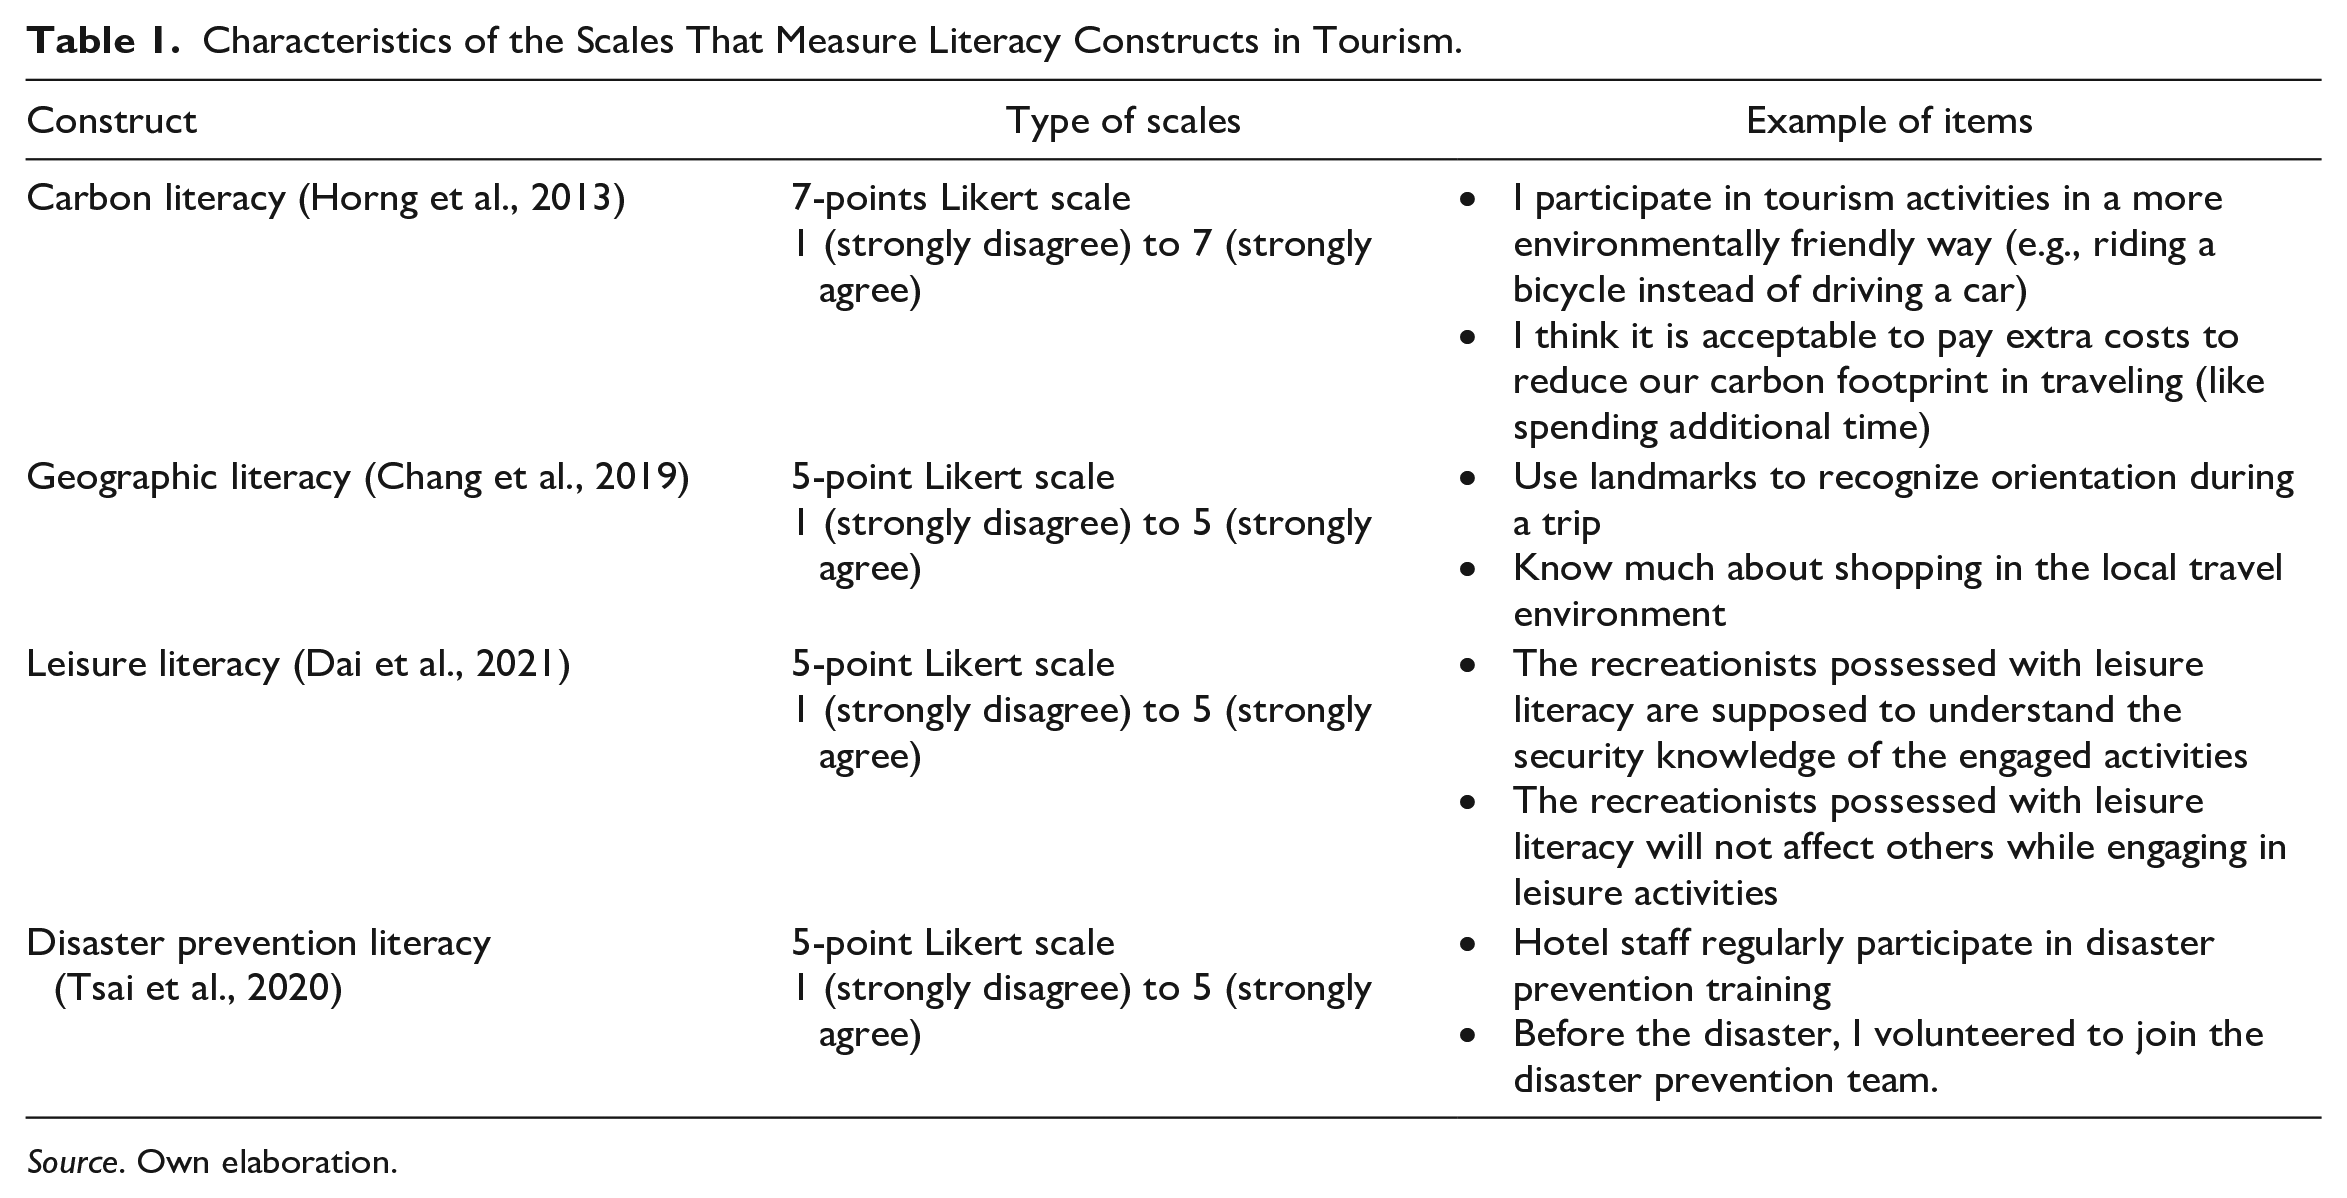
Source. Own elaboration.
After an in-depth review of prior research (see all the papers reviewed in Supplemental Appendix 1), we conclude that no prior research in tourism measured objective knowledge. These differ from scales with a long tradition in the measurement of consumers’ literacy, such as financial, health, nutrition, or genetic literacy (see examples in Table 2).
Examples of Literacy Scales in Other Fields.
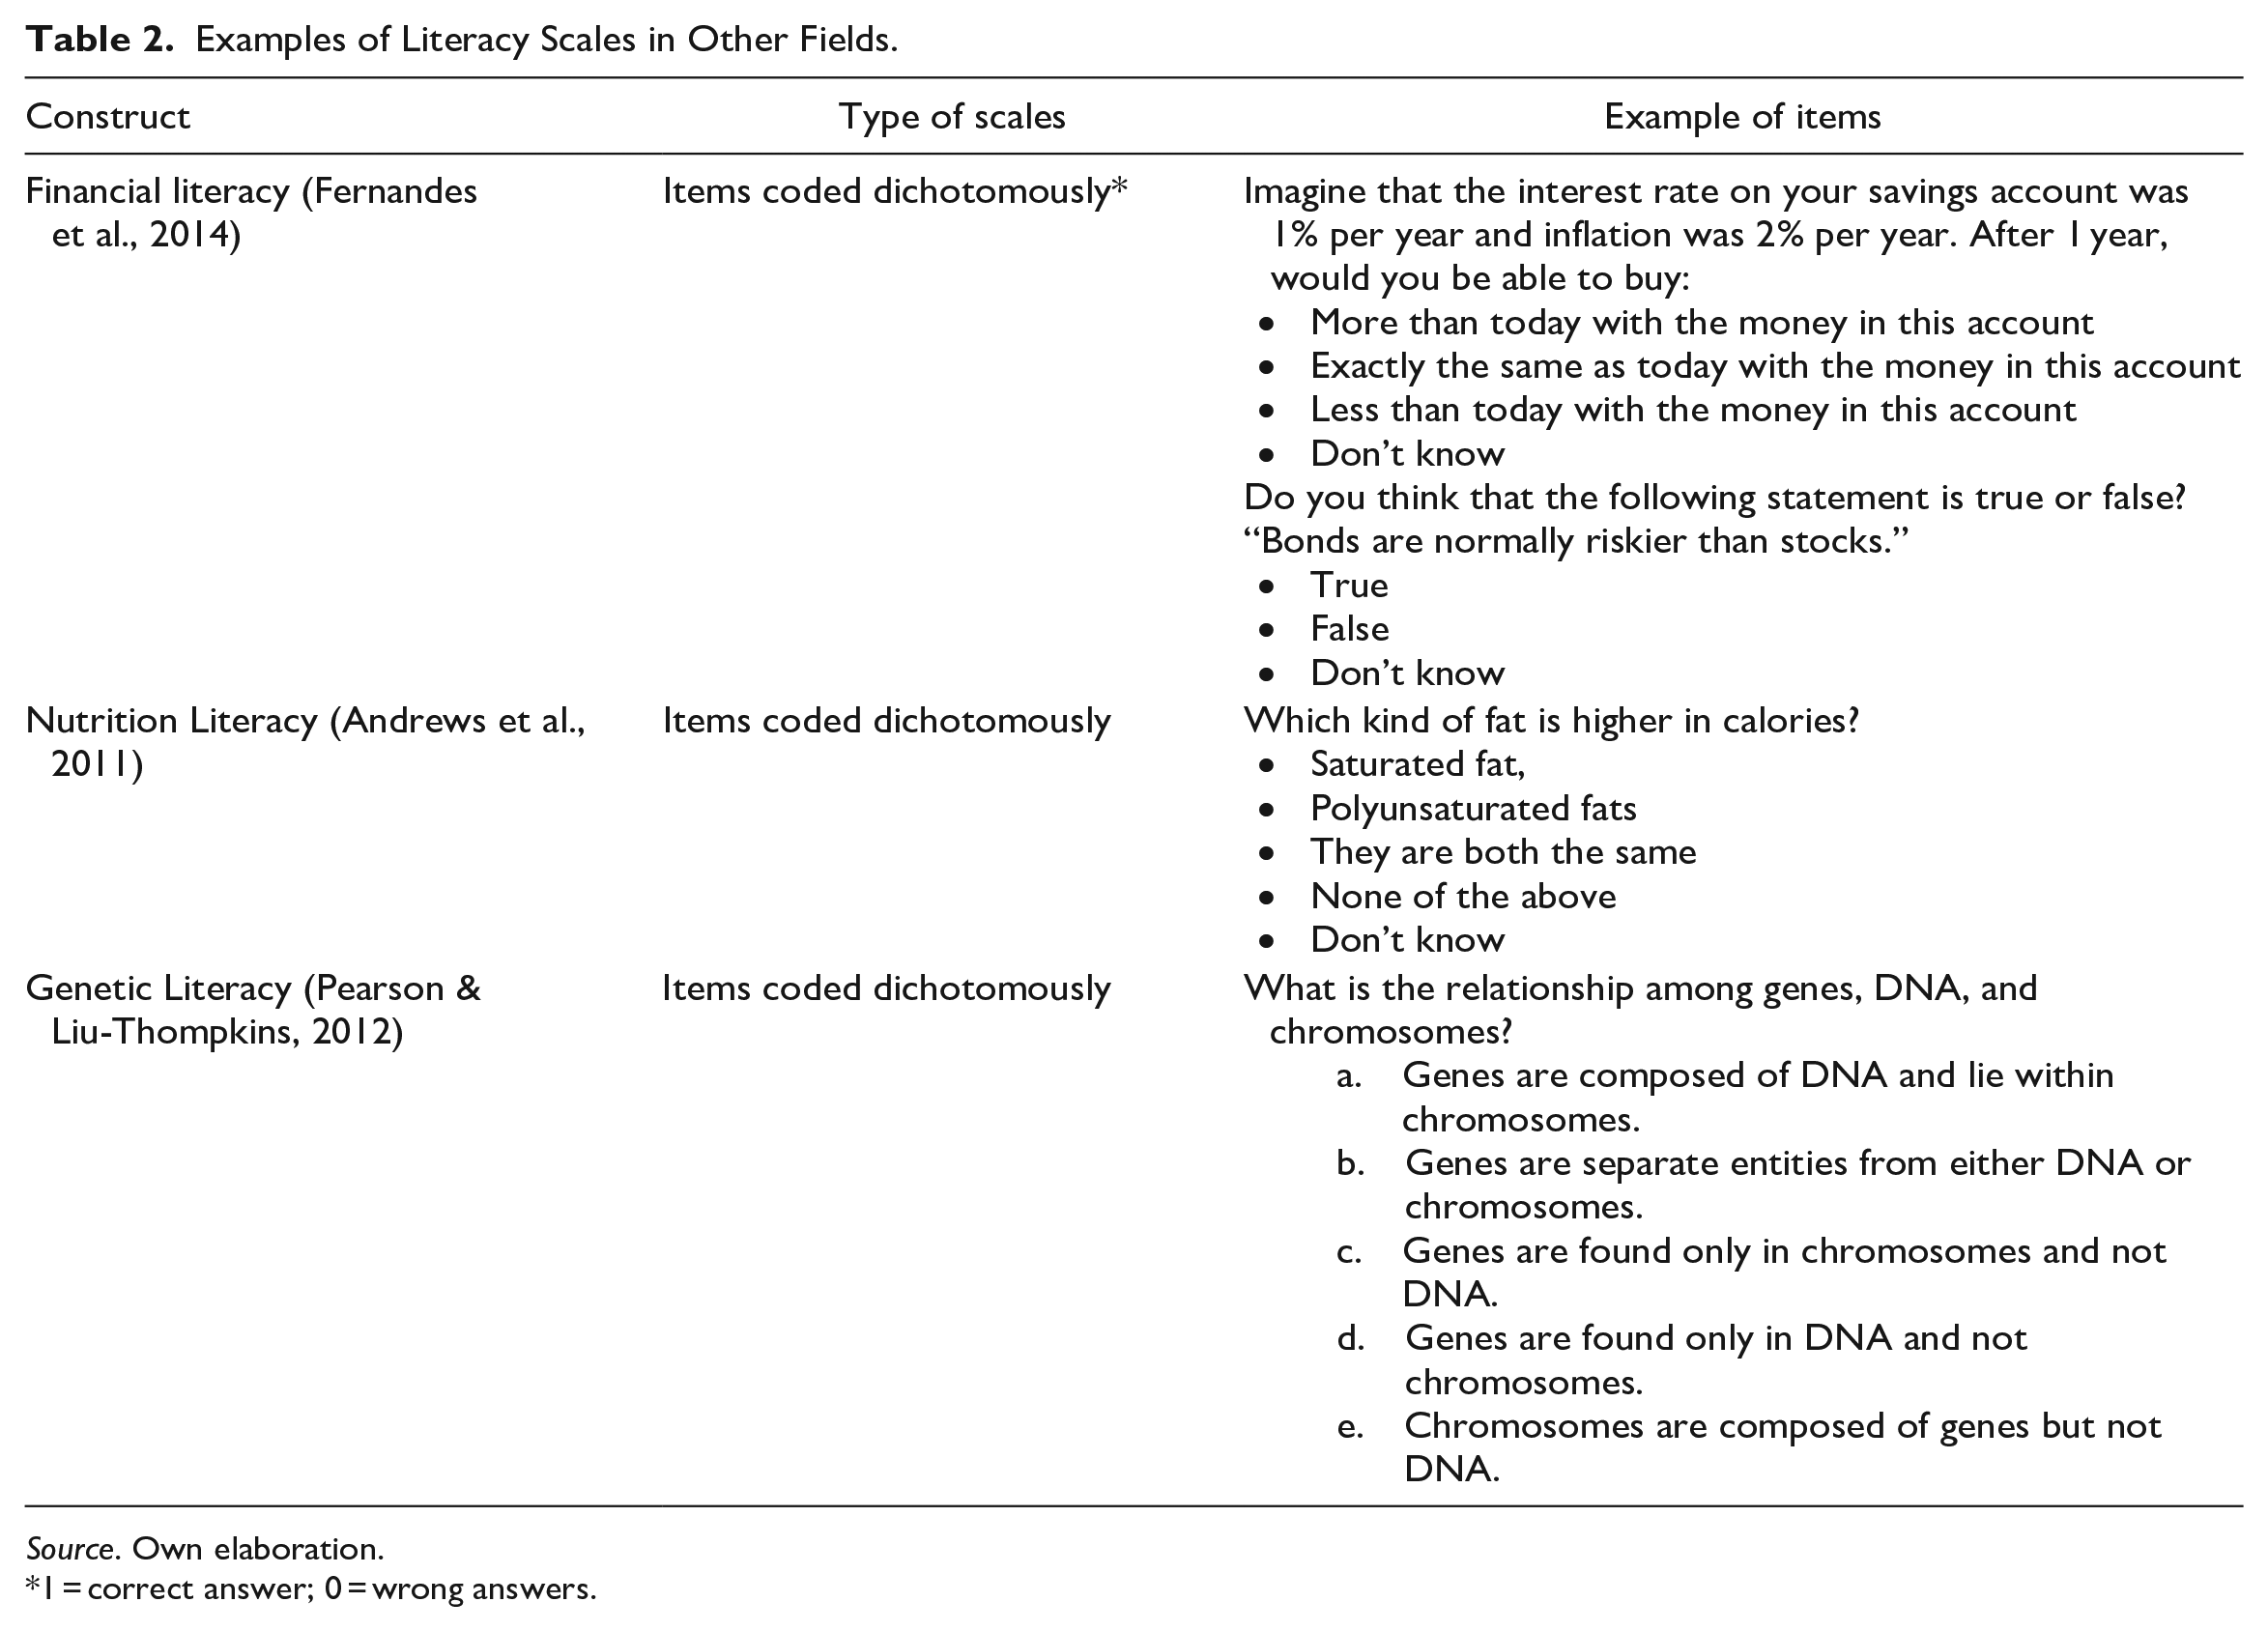
Source. Own elaboration.
1 = correct answer; 0 = wrong answers.
Building on these prior findings and methodological approaches, the first goal of this research is to develop a scale that measures consumers’ objective knowledge about travel insurance. To provide the theoretical framework for the characteristics of the scale and the expected consumer outcomes, the next subsections of the review focus on prior research on travel insurance.
Research on Travel Insurance
Several studies have examined tourists’ intentions and behavior toward travel insurance (Dall’Olmo Riley et al., 2009; Kai et al., 2021; Kerr & Kelly, 2019; Lo et al., 2011; Sarman et al., 2019; Yu & Chen, 2018). This prior research showed that the decision to purchase travel insurance depends on perceived risks. Perceived risk theory conceives this construct as multidimensional, and includes the physical, psychological, social, financial, performance, and timing dimensions (Kerr & Kelly, 2019). The effect on intention to purchase insurance depends on tourists’ perception of these dimensions when they travel (Kerr & Kelly, 2019; Yu & Chen, 2018).
Likewise, some prior research in tourism focused on the theory of expected utility (Kerr & Kelly, 2019). This theory indicates that consumers make some decisions considering an uncertain loss (e.g., an injury while traveling) and a certain loss (e.g., paying for insurance; Schneider, 2004). The higher the perceived likelihood to suffer the uncertain loss—and its perceived value—, the higher the intention to acquire travel insurance (Kerr & Kelly, 2019). Based on these theories, some authors have recently examined consumers’ willingness to pay for travel insurance after the COVID-19 pandemic (Choe et al., 2022), and their intention to acquire travel insurance online (Yu & Chen, 2018). The latter studies found risk perception and perceived uncertainty as the most important antecedents. Thus, conclusions are similar to prior findings.
The perception of risk might depend on individuals’ differences as well, such as travelers’ personalities. Aside from neuroticism, which is associated with higher perceived risk, travel conscientiousness (i.e., tendency to organize, control, and plan the trip) increases insurance purchase behavior (Sarman et al., 2019). Conscientiousness is a personality trait highly associated with individuals’ learning motivation and, as a result, the acquisition of new knowledge (Colquitt & Simmering, 1998). Hence, individual differences might influence variations in knowledge in this context and, as a result, travelers’ intentions and behavior.
Regarding other variables that influence buying intention, prior findings revealed that most travelers prefer face-to-face interactions with the service provider to make the decision, and that there is a preference for buying this service from a familiar provider (Dall’Olmo Riley et al., 2009). Building on these findings, Yu and Chen (2018) indicated that trust is a variable of great importance for the acquisition of travel insurance. Some of these studies include the effect of travelers’ previous experience (Dall’Olmo Riley et al., 2009; Kerr & Kelly, 2019; Lo et al., 2011). Prior experience is associated with knowledge and familiarity (Lo et al., 2011). Hence, besides the consumers’ personality (Sarman et al., 2019), prior experience can lead to variations in knowledge. Supplemental Table A2 in the Appendix provides a comprehensive overview of research on travel insurance. The next subsection focuses on key insights from this prior research but in connection with the goals of the present study.
Travel Insurance Literacy: Knowledge, Trust, and Purchase Intention
In the context of travel insurance, consumers need to know about the processes to make claims, understand legal concepts, become knowledgeable about the risks that policies cover, among other issues. This leads to a need for knowledge to make accurate decisions (Caponecchia & Tan, 2019). Problems in communicating, using, and understanding the exclusions and conditions of insurance products are one of the major problems for the travel insurance industry (Tan & Caponecchia, 2021).
An important conclusion of this review is that some of the variables examined might be associated with consumers’ acquisition of knowledge (e.g., personality, prior experience), which can explain the effect on other outcomes, such as buying behavior (Sarman et al., 2019). Another key insight is that, while the construct most commonly associated with purchase behavior is perceived risk, a reason why many tourists do not acquire travel insurance might be due to a misunderstanding of such risks (Tan & Caponecchia, 2021), and how travel insurance can help to cover them (Caponecchia & Tan, 2019).
Precisely, Caponecchia and Tan (2019) “view the current state of the travel insurance market as inefficient as consumers are deemed generally misinformed and unaware of the intricacies of the products on offer” (p. 343). Although the authors did not empirically test these relationships, they suggest that knowledge might be the key to understanding consumer behavior in this context, in the sense that more knowledgeable consumers will be more likely to acquire travel insurance.
In connection with the above, Pearson and Liu-Thompkins (2012) suggested that many consumers simply avoid products for which they lack information, and functions they do not fully understand. Viswanathan et al. (2021) indicated that many consumers face constraints due to a lack of knowledge and, consequently, avoid unfamiliar products. Thus, the relationship between consumers’ lack of knowledge and lower buying intention can be hypothesized. Upon developing a scale to measure the construct, we expect to find a direct, positive relationship between travel insurance literacy and purchase intention.
H1: Travel insurance literacy increases tourists’ intention to purchase travel insurance.
Another main conclusion in this review is that tourists seek insurance providers they trust (Dall’Olmo Riley et al., 2009; Yu & Chen, 2018). Once they trust a seller, they are more likely to acquire insurance (Yu & Chen, 2018). Prior findings indicate that product knowledge increases consumers’ trust in companies (Sheth & Parvatiyar, 1995). In fact, “Someone with a high level of product knowledge would probably be more likely to trust the salesperson than would the individual with little prior knowledge of the product” (Kennedy et al., 2001, p. 77). The positive relationships between consumers’ knowledge with trust have been indicated in other contexts, such as green products and online shopping (Roh et al., 2022). As mentioned in these studies, a buyer with higher knowledge tends to trust the seller (Roh et al., 2022). Therefore:
H2: Travel insurance literacy increases trust in travel insurance providers.
Regarding educational interventions, the meta-analysis by Fernandes et al. (2014) shows that this is the method most commonly used to measure the effects of increased financial literacy on other outcomes. This method has been applied in other fields (e.g., Bolton et al., 2015; Collins & O’Rourke, 2010; Pearson & Liu-Thompkins, 2012; Viswanathan et al., 2021). For instance, marketplace literacy interventions can help consumers make better decisions and, thus, improve their well-being (Viswanathan et al., 2021); health literacy with an informational intervention reduces unhealthy behavior (Bolton et al., 2015); and the exposure to an online educational module about genetics improves both literacy and knowledge calibration (Pearson & Liu-Thompkins, 2012). Based on these prior findings, and considering the relationships previously hypothesized, we expect that an educational intervention will increase travel insurance literacy and, in turn, consumers’ trust and purchase intention.
H3: An intervention to increase travel insurance literacy will lead to higher trust in insurance providers and higher intention to purchase travel insurance.
Travel Insurance Literacy: Scale Development
To achieve the study goals, our scale development process involved all the steps described by Kock et al. (2019), and used in prior research (Chen et al., 2020; Cheng et al., 2021; Ghosh & Mandal, 2019; J.-H. Kim, 2022; Y. Kim et al., 2022; Liu et al., 2020; Teng & Tsaur, 2022; Tsaur et al., 2022; Zhang et al., 2021): (a) item generation, (b) item reduction, (c) purification and dimensionality of the scale, (d) validity and reliability, (e) discriminant validity and (f) nomological validity. Each of these steps is explained in depth in the next subsections.
Step 1: Focus Group—Initial Item Generation
We conducted two successive focus group discussions to develop the initial items. Participants included four managers (purposive sampling; three males, one female; age: 36–50) who worked in the insurance industry. The four managers were English speakers based in the French Riviera, and one of the most important products they sold was travel insurance.
The first discussion lasted approximately two hours. The goal of the first focus group was to identify the most significant topics that should guide the creation of the items. Three open-ended questions asked about the experts’ opinion on the most important factors consumers should know about travel insurance (e.g., What are the most important issues consumers should know when they intend to acquire travel insurance?).
Working from the focus group results, the issues discussed were summarized into the following topics: (1) when and why travelers need insurance; (2) the types of travel insurance there are; (3) the process to acquire travel insurance; (4) what travel insurance can and cannot cover; (5) the processes to make claims; and (6) legal/contractual concepts related to travel insurance policies.
During the following two weeks, four items were generated for each of these topics (i.e., 24 items). To write the items, we considered the terms used in the literature, especially focused on the studies by Choe et al. (2022), Kerr and Kelly (2019), and Sarman et al. (2019). These studies also helped us to create the items associated with the needs for travel insurance, most common claims, and the process to acquire travel insurance. For further guidance, we consulted a series of specialized webpages. These websites provided information about what travel insurance can cover, the types of travel insurance and the information/terms in travel insurance policies.
Two weeks after the first focus group, we met with the same four experts. Now, the topic of conversation was about the items created during the past two weeks. Based on their recommendations, four items were eliminated since, according to them, they did not capture a relevant issue, and six items were rewritten to capture more properly the knowledge intended to measure.
Step 2: Q-sort Technique (Item Reduction)
Four academics from a university in Monaco assessed the remaining 20 items. They were researchers in management with a focus on hospitality and had prior knowledge of scale development. The Q-sort methodology was implemented. This technique is based on the evaluation by experts of the items (Brown, 1986). We asked the four participants–separately–to indicate if and why they “agree” or “disagree” with whether each of the items was valid to measure the construct, taking into account the fit with its definition.
We considered only the items for which all experts “agreed” on their validity. Thus, if one or more of the participants “disagreed” with the validity of an item, this would either be changed (following the participant’s comments) or deleted. The four participants agreed that 16 out of the 20 items properly measured knowledge about travel insurance.
After gathering the answers, we met each participant who rejected one or more items, to ask about their reasons for rejecting them. According to the answers, three of the items should not be considered due to undesirable redundancy (i.e., two or more items capturing knowledge about a very similar concept). They explained that they opted for the one that more clearly captured the concept intended to measure. Thus, the three items were removed. The remaining item was deleted because, according to their opinion, it was difficult to understand. Therefore, wrong answers could be based on misunderstanding, rather than lack of knowledge.
Step 3: Pilot Test (Item Purification)
Forty students (61% female, Mean-age: 23) from a university in Monaco answered a questionnaire formed by the 16 items. All courses are taught in English at this university, thus, the questionnaire was in English. After answering the questionnaire, we asked if they encountered difficulty in understanding any of the items in the scale. Based on their responses, one item was eliminated, since six participants found it confusing. Additionally, the phrasing was improved in three items, to reduce some ambiguity that some respondents identified. This resulted in a 15-item scale, which is used in the following steps (see all items in Supplemental Appendix 2).
Step 4: Reliability of the Scale
We conducted three studies (Studies 4A-4C) to test the reliability of the scale. The questionnaire included the 15-item scale and demographics at the end. Study 4A was conducted in the USA using the Prolific Research Panel (convenience sampling, N = 181; 63% women; Mean-age: 24.88, SD = 6.22). We used the same recruiting method for study 4B, but this time in the UK (N=236; 43% women; Mean-age: 47.81, SD = 10.56).
We conducted study 4C in the city of Monte Carlo, Monaco (N=206; 58% women; Mean-age: 22.27, SD = 4.10). In this case, we printed and distributed questionnaires on the street. The questionnaire was self-administered and included two filter questions to ensure that respondents lived in Monaco (i.e., they were not visitors) and their level of English was B2 or higher (i.e., B2: independent users of the language, with necessary fluency to communicate without effort with native speakers; more than 85% of those willing to participate passed this requirement).
Descriptive Results
To compute the level of literacy, a score was calculated on the 15 items. A score of 15 would be the highest literacy, and 0 the lowest. Respondents from the USA showed a Mean of 6.80 (SD = 2.89; Max. = 13, Min. = 0). In Monaco the Mean was slightly higher (Mean = 7.63; SD = 2.99; Max. = 14, Min. = 0). The results in the UK were also slightly higher (Mean = 8.37; SD = 2.91; Max. = 13, Min. = 0). These mean differences are significant (One-way-ANOVA: F = 14.61; Sig = 0.00; Tukey HSD: USA < Monaco < UK). However, some differences among the samples (e.g., difference in terms of age) limits the conclusion that U.K. citizens are more literate in the domain of travel insurance than U.S. citizens. These descriptive results need to be interpreted considering this limitation, while noting that the goal of the studies is to examine the dimensionality and reliability of the scale, which are discussed next.
Scale Reliability
Given that the items were coded dichotomously (1 = correct answer; 0 = wrong answers), we used a polychoric correlation matrix (Fernandes et al., 2014). We used the software FACTOR (Lorenzo-Seva & Ferrando, 2006) to perform the analyses (SPSS does not allow the analysis; Fernandes et al., 2014). First, we tested exploratory factor analysis (EFA). Next, we tested the fit of the model through confirmatory factor analysis (CFA).
Considering the characteristic of the scale (1 or 0), and based on prior research, we sought items that had significant factor loadings of .30 and above on one factor and did not load .30 or more on other factors (Fernandes et al., 2014; Netemeyer et al., 2003; Nunnally & Bernstein, 1994). For the three studies, EFA results suggest one-dimension for all three samples. In the USA, one factor explained 76% of the variance (factor loadings for the 15 items ranged from 0.39 to 0.88; mean loading = 0.75). In the United Kingdom, one factor explained 72% of the variance (loading from .46 to .81; mean loading = .73), while in Monaco, one factor explained 71% of the variance (loadings .36 to .75; mean loading = .72).
In addition, the results showed that a unidimensional factor model fits the data well for the study
Finally, we compared the one-dimensional model with multidimensional models. Including different combinations of items based on the knowledge they measured, we tested several different combinations of two dimensional, three dimensional, four-, five-, and six-dimension models, using the results of the EFA as guidance. All results showed lower model-fit-indices than the one-dimensional model in the three countries (e.g., two-dimensional model in the USA: χ2 = 234.01, df = 90, p = 0.00; CFI = 0.85; TLI = 0.84; five dimensions in the USA: χ2 = 357.71, df = 90, p = 0.00; CFI = 0.71; TLI = 0.68). These results suggest that one dimension underlies the 15 items in the three countries.
Step 5: Nomological and Discriminant Validity
The first goal of this step was to test the effect of travel insurance literacy (objective knowledge) on trust in providers (H1) and intention to purchase travel insurance (H2). Secondly, we tested discriminant validity following Voorhees et al. (2016), to show evidence that the construct is distinct from the rest of the constructs examined, adding weight to the argument that the significant relationships are really supported by the data, and are not simply an artifact of modeling the same construct twice. Given the nature of the scale, it was critical to test discriminant validity considering the measurement for objective and subjective knowledge, as well as the construct most widely connected in the literature with consumers’ intention to purchase travel insurance, namely, perceived travel risk.
Method
For the study in Step 5, we applied the same method as in study 4C (i.e., convenient sampling, self-administered questionnaire in the French Riviera), including the same filter questions, the travel insurance literacy scale, and demographics at the end. This questionnaire included two extra filter questions to know: (1) Whether participants planned to travel outside the country sometime in the following three months; and (2) if the trip was for more than five days. Only those participants who answered “yes” to the two questions were allowed to participate. To guarantee a high ratio of positive responses in these two filter questions, the data collection was performed during May and June 2022 (the most typical vacation days in France take place between July and August). The questionnaire was in English. Only participants with a B2 level of English or higher were allowed to participate.
As part of demographics, we asked about prior experience with travel insurance and about travel behavior. Regarding travel behavior, the question asked about the number of trips in the previous year. For prior experience, the question focused on how many times participants had gone through the process of buying travel insurance. For example, if they decided to acquire multi-trip travel insurance, but did it just once, the answer recorded would be “1,” regardless of the number of trips during that year (i.e., acquisition process rather than product usage).
If the participant answered that they had acquired travel insurance in the past, the next question was about how they had acquired it: (1) they purchased insurance independently for each trip (i.e., one every time they traveled); (2) they possessed multi-trip travel insurance; (3) insurance included in a tour package; (4) insurance included in other products they possessed, such as bank cards or similar; (5) other. For those who had travel insurance in the past, we asked if they needed to use it, how many times and for which kind of incident/emergency.
Regarding the structure of the questionnaire, the first questions participants answered were about their perception of knowledge. The 3-item scale by Kennedy et al. (2001) was used (e.g., Would you consider yourself informed or uninformed about travel insurance?; Would you consider yourself knowledgeable or unknowledgeable about travel insurance?). Next, the questionnaire included three items adapted from the questionnaire by Yu and Chen (2018) to measure trust in travel insurance providers (e.g., “Travel insurance providers are honest and trustworthy”). We used the 3-item scale by Roehl and Fesenmaier (1992) to measure perceived travel risks (e.g., there is the possibility that I suffer physical danger, injury or sickness while on my vacations), and one item to capture their intention to purchase travel insurance (i.e., “I intend to purchase travel insurance for my next vacation trip”). The items were scaled from 1 (strongly disagree) to 7 (strongly agree). Before demographics, the questionnaire presented the travel insurance literacy scale. We obtained 197 valid responses (56% women; Mean-age: 31.40, SD = 3.77).
Scale Reliability and Discriminant Validity
The results showed a Literacy-Mean of 7.93 (SD = 2.96; Max. = 14, Min. = 0). The reliability of the scale was acceptable in this study as well (EFA: factor loadings for the 15 items ranged from 0.55 to 0.81 [mean loading = 0.63]; FA-Polychoric-Correlation: χ2 = 496.88, df = 105, CFI = 0.92; TLI = 0.92; significant loadings [p < .01]; Standardized loadings: 0.44–0.77; Average = 0.64).
The results of the CFA, including all the constructs, showed that the variance shared between each pair of constructs (squared correlation: Literacy/Risk = .001; Literacy/Trust = .43; Literacy/PurchaseIntention = .25; Literacy/PerceivedKnowledge = .43) was below the corresponding variance extracted indexes (LiteracyAVE = .58; RiskAVE = .71; TrustAVE = .77; PerceivedKnowledgeAVE = .87), which provides evidence of discriminant validity (Voorhees et al., 2016).
Nomological Validity: Effect on Trust and Intention to Purchase
The constructs were averaged. The results showed that there was a positive relationship of literacy with trust in travel insurance providers (R = .67; R-Square = .44; F = 156.32; Sig. = .00), and with intention to purchase (R = .64; R-Square = .41; F = 133.63; Sig. = .00; H1 and H2 supported). A bootstrapping procedure with 10,000 iterations (PROCESS Macro, Model 4; Hayes, 2017) was conducted to test the mediating role of trust in the relation between literacy and purchase intention. The results showed a significant mediating effect of trust (Effect = 0.33; Boot-SE = 0.04; 95% CI [0.24, 0.42)]). The mediating effect was partial since the direct relationship of travel insurance literacy and purchase intention was significant after including the mediating variable (Effect = 0.27; SE = 0.04; p < .01).
In addition, perceived risk was positively associated with purchase intention (R = .244; R-Square = .06; F = 12.40; Sig. = .00). This confirmed prior findings in the literature (e.g., Kai et al., 2021; Kerr & Kelly, 2019; Sarman et al., 2019; Yu & Chen, 2018). However, this construct was not associated with literacy (R = .034; R-Square = .00; F = 0.22; Sig. = .64), or with trust (R = 133; R-Square = .01; F = 2.50; Sig. = .11). Thus, perceived risk and travel insurance literacy were not associated, but both influence intention to purchase.
There was no significant correlation between travel insurance literacy (i.e., objective knowledge) and subjective knowledge (r = .128, Sig. = .08), but there was a negative correlation between subjective knowledge and perceived risk (r = −.32, Sig. = .00). We tested the mediating role of perceived risk in the relationship of subjective knowledge on purchase intention (PROCESS Macro, Model 4; Hayes, 2017), which showed a significant result (Effect = 0.09; Boot-SE = 0.03; 95% CI [0.03, 0.17]). The mediating effect was partial since the direct relationship was still significant after including the mediating variable (Effect = 0.16; SE = 0.07; p < .05).
Relationship with Prior Experience
Around half of the participants had prior experience with travel insurance (51%). Among these, the majority acquired it as part of a package tour (36%) or as part of other products, such as a credit card (43%). Only 18% of the sample had acquired the insurance independently while planning the trip, and 3% possessed multi-trip travel insurance. In addition, 32% had acquired travel insurance only one time in their lives, 20% two times, 18% three times and 30% more than three times. Among those who needed to use travel insurance due to incidents while traveling, the most frequent motive was “trip changes or cancelations” (52%), followed by “medical emergencies” (36%).
The results showed no relationship between prior experience and travel insurance literacy (t = −.15, Sig. = .13). No relationship was observed either regarding how it was acquired (F = 1.49, Sig. = .21), how many times (F = 0.97, Sig. = .42), if they had used it (t = −.17, Sig. = .15) or the type of emergency (F = 0.11, Sig. = .95). We tested the effect of the variables related to past experience with the rest of the constructs. The only association observed was the relationship between perceived risk and having acquired travel insurance in the past (F = 60.80, Sig. = .00). The absent of an effect of prior experience on literacy might be due to the way most of the participants had acquired travel insurance (i.e., part of other products or a tour package). These facts are discussed as part of the limitations of the study.
Step 6: Intervention–Increasing Travel Insurance Literacy and the Effect on Trust and Intention to Purchase
To further test the nomological validity of the scale, in this study we performed an intervention to increase travel insurance literacy among consumers and examine its effect on trust in travel insurance providers and intention to purchase.
Method
This was a two-conditions between-subject-design experiment. Two hundred participants from the UK were recruited. We used Qualtrics as the survey tool and Prolific Research Panel for the data collection. Participants were randomly assigned to one of the two conditions (i.e., educational intervention vs. control group) in the experiment, using the option offered by Qualtrics to this end. For the intervention condition, half of the participants (i.e., N=100) were asked to carefully read the information on a webpage by the Association of British Travel Agents, which explains “most critical aspects regarding travel insurance” (25–30 min read). This webpage includes sections such as “What a travel insurance policy doesn’t cover; “How to use your travel insurance”; “When should I buy travel insurance” among others (https://www.abta.com/tips-and-advice/planning-and-booking-a-holiday/travel-insurance).
Following prior research on educational interventions (e.g., Luna-Cortes & Aristizabal Cuellar, 2022), participants in the control group (N=100) read a piece of information that was similar in length. Hence, all participants were subjected to the same structure, and spent the same time during the experiment. However, this text did not include any information about travel insurance or tourism whatsoever. Specifically, they read a text about Nobel Prize novelist Gabriel Garcia Marquez. Prolific allows checking the durability of participants in responding to the questionnaire. If participants lasted less than 35 min to end the survey, they would not be considered for the study (i.e., answers deleted from the dataset; dataset was completed for each condition when reaching 100). After watching the videos, participants answered a series of questions. This questionnaire included the travel literacy items from the prior study (i.e., Step 5), trust in service providers and intention to purchase travel insurance.
Results
First, T-test results revealed that participants exposed to the travel insurance information rated higher in literacy, in comparison with the control group (t[198] = 8.14, p.01; Mean-LiteracyIntervention = 6.88, Mean-LiteracyControl = 3.79). We interpret the results pattern as supporting the veracity of the travel literacy scale. The participants exposed to the intervention also rated higher in trust (t[198] = 4.21, p < .01; Mean-TrustIntervention = 4.01, Mean-TrustControl = 3.01) and purchase intention (t[198] = 4.41, p < .01; Mean-PurchaseIntervention = 4.83, Mean-PurchaseControl = 3.79). As in the prior study, there is a positive relationship of literacy with trust in travel insurance providers (R = .64; R-Square = .41; F = 141.21; Sig. = .00) and with intention to purchase (R = .70; R-Square = .49; F = 195.34; Sig. = .00) (H1 and H2 supported).
The results reveal significant, mediating effect of literacy on the link between the intervention and trust (Effect = 1.21; Boot-SE = 0.18; 95% CI [0.88, 1.59]) and purchase intention (Effect = 1.28; SE = 0.20; p < .01; 95% CI [0.98, 1.63]; PROCESS –model 4– for SPSS; Hayes, 2017). Hence, the data show that providing information about critical aspects of travel insurance increases the ratings in literacy, which in turn leads to higher trust in insurance providers and higher intention to purchase travel insurance (H3 supported). For both relationships, the results showed a full mediating effect, since the effect of the intervention became non-significant when the mediating effect of literacy is included, for both trust (t = .77; p = .44) and purchase intention (t = 1.12; p = .22).
General Discussion
The literature review on tourists’ attitudes, intentions and behaviors toward travel insurance revealed that knowledge is still limited. Most prior studies had focused on a key antecedent (i.e., perceived travel risk) (Choe et al., 2022; Kerr & Kelly, 2019; Lo et al., 2011). Additionally, the review showed some contradictory findings (Lau et al., 2007; Lo et al., 2011). Thus, some authors indicated a need for research on this topic (Choe et al., 2022; Sarman et al., 2019). Based on prior studies on consumers’ literacy (Bolton et al., 2011; Chang et al., 2019; Fernandes et al., 2014), we proposed that travel insurance literacy could shed new light on this research domain.
A reliable and valid scale was developed to measure consumers’ knowledge about terms, regulations and processes related to travel insurance. Following the methods for scale development in the literature, the travel insurance literacy scale showed good psychometric properties. Discriminant validity was tested including perceived risk, trust in insurance providers, intention to acquire travel insurance and subjective knowledge (i.e., self-assessment literacy). The validity of the scale was supported in connection with all the constructs, including subjective knowledge. In fact, there was no significant correlation between travel insurance literacy and self-assessment expertise, which shows that, in the context of travel insurance, tourists’ subjective knowledge differs from objective knowledge. In addition, there was a negative correlation between subjective knowledge and perceived travel risks, while objective knowledge did not correlate with this variable.
Nomological validity was supported as well. The results showed that both perceived risk and consumers’ knowledge increase intention to purchase travel insurance. As mentioned, there was no significant relationship between literacy and perceived risk, which means these two individual difference variables increase (independently) tourists’ intention to acquire travel insurance. These results indicate that consumers with high knowledge about travel insurance, who at the same time perceive higher risk when planning a trip, will more likely acquire travel insurance.
The relationship of literacy with intention to purchase was partially mediated by consumers’ trust in insurance providers. In other words, higher knowledge about travel insurance was associated with higher trust and, in turn, with a higher intention to purchase. The results also showed that the relationship of prior experience with literacy was not significant. Hence, consumers who had acquired travel insurance in the past might have similar knowledge than consumers who had no prior experience.
Theoretically, a relationship between prior experience and knowledge could have been hypothesized. The lack of association between these variables might be because most of the participants who had purchased travel insurance in the past did it as part of other services (i.e., bankcard, package tour). The relationship between experience and knowledge might be significant with a sample of tourists who acquired insurance independently, since they would probably learn about concepts and regulations through the process. This leads to some limitations of the study, which are described after the practical implications of the findings.
Practical Implications
The results provide some implications for practitioners. First, while most prior research focused on risk avoidance strategy as the reason for consumers to acquire travel insurance (Sarman et al., 2019), the findings of the intervention study suggest that providing clear information to consumers might help future buying intentions. If consumers clearly understand the processes and benefits of owning travel insurance, they will trust providers more. Therefore, tour operators that offer travel insurance, and managers from the insurance industry, should make sure their clients acquire as much knowledge as possible about the type of policies that exist, what is covered by travel insurance, and the process to obtain services when incidents occur.
The results show that consumers who own travel insurance because they acquired it together with other services might not have enough knowledge about it. Service providers in tourism should take the opportunity to explain terms and processes in detail, even if the insurance is included, and provide extra information, on paper or electronically. This will guide consumers during their learning process, leading to meaningful positive outcomes. First, the client will solve the problem more effectively in case of emergencies and, secondly, their trust in the provider will increase.
Consumers’ trust is a key variable to understand consumers’ loyalty (Kennedy et al., 2001). Thus, providing information about travel insurance in the interaction with the consumer might lead to consumers’ loyalty toward the provider and other positive outcomes. However, these constructs were not included in the study. Among other possibilities, this leads to a need for future research in the field, which is explained in the next section together with the limitations of this study.
Limitations and Future Research
This research presents some limitations. For example, it measured the effect of travel insurance literacy on tourists’ intention to purchase and, therefore, did not capture tourists’ behavior. Future research should include the effect of travel insurance literacy on actual spending. Also, some of the relationships were tested only in one country. In particular, the intervention study was conducted in the UK, which limits the possibility of extrapolating the results to other regions and cultures. Further, we used one intervention rather than multiple interventions. Following Pearson and Liu-Thompkins (2012), different types of educational interventions yield different results in enhancing literacy. Thus, future research should test the effect of different types of interventions in samples from multiple countries and regions of the world.
Our research also did not capture participants’ interest in the topic. Future research should include control questions to capture tourists’ interest level, observe the association with literacy, and their motivation during interventions. Future studies can also measure self-efficacy directly. As explained by Mende et al. (2015), self-efficacy can be measured on various levels of specificity (i.e., different levels of confidence). It would be interesting to test which levels of confidence are associated with objective and subjective knowledge in the context of travel insurance.
Another potential limitation, as indicated above, is that approximately half of the participants had acquired travel insurance in the past. Among these, many possessed travel insurance as part of a package tour or other services. It would be interesting to use a sample of consumers who planned their trips on their own, and retest the relationship between prior experience and literacy. Doing so might be important to understand the reasons why some tourists possess more knowledge about travel insurance than others. Additionally, our study focused on current knowledge, while it did not measure the acquisition of knowledge over time. Future research should conduct longitudinal studies to explore how objective knowledge changes before versus after the interaction with travel insurance providers, or before and after the trip.
The studies were limited in terms of demographics. All samples were from Western countries, with similar cultural characteristics (Hofstede et al., 2005). We acknowledge that cultural variables might moderate the relationships presented in this research. For instance, the relationship between knowledge and perceived risk, and the influence of both on purchase intention, might be different in countries that rate high (versus low) in uncertainty avoidance (defined as the extent to which culture’s members feel threatened by unpredictability and unknown situations; Hofstede et al., 2005).
Although the studies did not include moderating variables, it would be interesting to examine relevant interactions with literacy and trust. For instance, prior negative experiences with insurance providers might be associated with consumers’ lack of trust in these companies. Including prior experience as a moderating variable in future studies can help to explain the nuances associated with predicting consumer trust. Finally, research should include other dependent variables in future theoretical models. As mentioned above, the mediating role of trust in the relationship between literacy and loyalty should be tested. Furthermore, prior studies have shown a relationship between knowledge with product effectiveness and customer satisfaction (Lin & Chang, 2012). Testing the effect of travel insurance literacy on these variables will add value to the literature, with meaningful implications for managers in tourism and the insurance industry.
Supplemental Material
sj-docx-1-jtr-10.1177_00472875231220944 – Supplemental material for Measuring Travel Insurance Literacy: Effect on Trust in Providers and Intention to Purchase
Supplemental material, sj-docx-1-jtr-10.1177_00472875231220944 for Measuring Travel Insurance Literacy: Effect on Trust in Providers and Intention to Purchase by Gonzalo Luna-Cortés and Michael Brady in Journal of Travel Research
Supplemental Material
sj-docx-2-jtr-10.1177_00472875231220944 – Supplemental material for Measuring Travel Insurance Literacy: Effect on Trust in Providers and Intention to Purchase
Supplemental material, sj-docx-2-jtr-10.1177_00472875231220944 for Measuring Travel Insurance Literacy: Effect on Trust in Providers and Intention to Purchase by Gonzalo Luna-Cortés and Michael Brady in Journal of Travel Research
Footnotes
Declaration of Conflicting Interests
The author(s) declared no potential conflicts of interest with respect to the research, authorship, and/or publication of this article.
Funding
The author(s) received no financial support for the research, authorship, and/or publication of this article.
Supplemental Material
Supplemental material for this article is available online.
Author Biographies
References
Supplementary Material
Please find the following supplemental material available below.
For Open Access articles published under a Creative Commons License, all supplemental material carries the same license as the article it is associated with.
For non-Open Access articles published, all supplemental material carries a non-exclusive license, and permission requests for re-use of supplemental material or any part of supplemental material shall be sent directly to the copyright owner as specified in the copyright notice associated with the article.