
Abstract
Are social media posts with emoji more engaging? Guided by the media richness theory, this study explores the relationship between visual (i.e., emoji) and textual content, and how they collectively impact user engagement with peer-to-peer accommodation brands. A three-stage sequential design using naturalist data, including text mining, frequent/rare itemset mining, and one-way ANOVA, was used. This study revealed that the combination of {Travel Tips and Inspiration, } and {Interaction and Motivation,} tended to result in an increased amount of likes and shares in social media posts. By theoretically revealing and empirically examining the complex relationship between verbal and visual content, this study enriches the theoretical understanding of media richness in tourism brands. Practically, this study provides actionable guidelines for tourism brands to increase user engagement by effectively using visual-verbal content.
Introduction
Recent years have witnessed the rapid growth of peer-to-peer accommodation worldwide, disrupting traditional accommodation models (Mody et al., 2021). Peer-to-peer accommodation is part of the fast-growing fleet of the sharing economy businesses that enable individuals to rent out their spare space for short periods of time for a fee (L. Zhu et al., 2019). By 2025, peer-to-peer accommodation is estimated to make up 17% of global accommodation (World Economic Forum, 2017). However, compared with traditional accommodation providers, peer-to-peer accommodation is less known to consumers. To penetrate the accommodation business, an effective way for peer-to-peer accommodation brands is to strategically build its distinctive brand personality (Wang et al., 2021), into its brand-generated content (Liang et al., 2020; Tao et al., 2022). To enhance brand awareness and reach, and to project their personalities, peer-to-peer accommodation brands need to create brand generated content to maintain ongoing dialogs with consumers (Wang et al., 2021).
As such, brands including peer-to-peer accommodation need to include various elements into their brand generated content, including verbal (e.g., text) and visual content (e.g., emoji), to deal with, “What to say?” and, “How to say it?” (Luangrath et al., 2017). This practice aligns with the media richness theory, which holds that text-based content is not the richest channel (Walther & Parks, 2002). Visual content, such as emoji can be considered to be “rich” media, because they represent feedback, multiple cues, language diversity, and personal focus (Moussa, 2019). Thus, the communication effectiveness of brand-generated social media content from peer-to-peer accommodation brands, depends on the combinations of emoji and text, rather than on text alone (Wang et al., 2023). In fact, peer-to-peer accommodation brands (as shown later in this study) often include a range of emoji in their social media posts, as a means of engaging their followers in more innovative and entertaining ways (Luangrath et al., 2017). In the crowded marketplace, new brands can leverage emoji as a visual differentiator. Incorporating unique or customized emoji that align with their brand or products can help brands stand out and gain recognition in digital spaces, ultimately helping turn new consumers into brand advocates (Wilk et al., 2020). This strategy is critical to peer-to-peer accommodation brands as they are relatively new compared to the traditional accommodation providers. This visual distinctiveness can contribute to brand recall, help new brands carve their niche and develop new consumer-brand in competitive markets relationship (Alvarez et al., 2023). Emoji can add a level of emotional appeal to a message, and help the message stand out in a sea of text (Bai et al., 2019). However, the co-occurrence pattern of text and emoji, and their performance, are less clear to tourism researchers and practitioners, both theoretically and practically (Wang et al., 2023). As visual paralanguage, emoji supplement the text and overcomes the absence of nonverbal signals in online communication.
Therefore, guided by the media richness theory, this research aims to explore (1) the relationship between verbal (e.g., text) and visual content (e.g., emoji) in brand-generated social media content and (2) their joint effects on user engagement with peer-to-peer accommodation brands. A three-stage research design was adopted: Stage 1 incorporated text mining, to extract hidden topics that co-occurred with emoji; Stage 2 used Frequent/Rare Itemset Mining techniques to identify topic-emoji patterns; and Stage 3 examined the impacts of identified frequent/rare topic-emoji patterns on user engagement.
Theoretical Background and Literature Review
Media Richness Theory
Media richness theory was initially developed to model the comparative efficiency of various communication channels to decrease equivocality in organizational decision-making (Daft & Lengel, 1986). One fundamental element of this theory is media richness, referred to as “the degree to which cues are available in a specific communication context.” According to Daft et al. (1987, p. 358), four key factors determine how rich a medium is: (1) feedback, or how quickly responses can be provided; (2) multiple cues, or how many cues (including as physical presence, voice intonation, body language, words, numbers, and graphic symbols) can be used to convey a message; (3) language diversity, and the number of meanings that can be expressed through symbols, and personal focus; and (4) the ability to produce messages that are personalized for each person. The other fundamental element is the equivocality of a communication scenario, meaning the extent to which a decision-making scenario and the facts associated with it, are available to various interpretations (Walther, 2011). As for the relationship between these two elements, media richness theory holds that there should a perfect fit between the equivocality of a communication scenario, and the richness of a media. Greater equivocality necessitates richer media, while lesser equivocality requires leaner media for maximum efficiency. This theory was initially developed with the idea that a perfect fit (or a perfect misfit) impacts efficiency, and it is frequently discussed in literature as having an impact on communication effectiveness (Walther, 2011).
As peer-to-peer accommodation brands are still relatively new to the tourism market compared with traditional accommodation providers, creating richer media to engage with the general public is critical. Personal, emotionally demanding tasks, such as revealed in the stories of Airbnb hosts, are said to have a high degree of equivocality, making them more suitable for richer media (Daft & Lengel, 1986; Dennis & Kinney, 1998; Walther & Parks, 2002). Conversely, relatively lean media, such text-based messages, cannot be well-suited for efficiently conveying complex emotional issues (Walther & Parks, 2002). Furthermore, when nonverbal cues are absent, the ability to change the tone of a communication message, or express one’s uniqueness, or demonstrate dominance or charisma, will be diminished (Kiesler, 1986; Walther & Parks, 2002). As such, communication effectiveness depends on the combination of media types, rather than on a single media type (Walther & Parks, 2002). Thus, it is more effective to combine emoji with text to enhance communication effectiveness.
The media richness theory is relevant to the study of emoji in this research (Moussa, 2019). First, emoji improve feedback by offering stronger nonverbal cues that can be understood more quickly and efficiently than text-only. Second, emoji increase the ability of the text message to transmit multiple cues, thanks to their 3,633 unique symbols (Unicode, 2021), making the task of conveying and deciphering meanings, easier. Third, emoji increase language diversity, and enable the conveyance of broader thoughts and ideas, since they incorporate facial expressions, gestures, symbols, and physical items (Bai et al., 2019; Novak et al., 2015). Finally, emoji also allow text senders to focus more on themselves by enabling more nuanced expressions that facilitate a better understanding of the feelings and emotions of the senders (Moussa, 2019).
Emoji and Text
The rapid development of digital communication has seen the increasing use of nonverbal information about “the way something is said” and “what is being said” (Luangrath et al., 2017). Various nonverbal communication elements, such as symbols, images, demarcations, or any combination of these, have been conceptualized as textual paralanguage, that is, “written manifestations of nonverbal audible, tactile, and visual elements” (Luangrath et al., 2017, p. 98). Textual paralanguage is often embedded in the verbal message, and adds contextual information, laden with emotion and meaning (Luangrath et al., 2017). Among textual paralanguage, emoji is the most popular paralinguistic element (Tang & Hew, 2019). Researchers thus far have examined the development and categories (Novak et al., 2015), the emotional and semantic functions (Danesi, 2016), the drivers, motivations and diverse use (Prada et al., 2018), and the impacts of emoji on consumer responses (e.g., G. H. Huang et al., 2020; Valenzuela-Gálvez et al., 2023). These studies, however, have overlooked an important fact in brand digital communication—that emoji and texts often exist together (Wang et al., 2023).
While emoji can occasionally be used to merely replace words in text, they are more frequently used to add new information (Na’aman et al., 2017). Emoji can also play a supplementary role in clarifying the intended meaning of ambiguous content (Riordan, 2017), or in providing emotions to content (Shiha & Ayvaz, 2017). Emoji also represent a new modality, unique in their text’s emotional and semantic structure (Cappallo et al., 2019). Thus, it is crucial to examine the relationship between emoji and text (Cappallo et al., 2019; Wu et al., 2018), which would provide a basis for measuring the communication effectiveness of brand self-presentation on social media.
The limited research on text and emoji to date, covers two main areas: (1) their impact on consumer behavior and (2) prediction of emoji using text (see Table 1). The first stream identifies the interaction roles of the text and emoji in generating user engagement (e.g., McShane et al., 2021), purchase intention (e.g., Manganari & Dimara, 2017), and review helpfulness (e.g., G. H. Huang et al., 2020). While the positive impact of emoji on consumer behavior is widely acknowledged, extant literature has largely focused on whether facial emoji is present in messages, overlooking the impacts of emoji type on digital branding (Cappallo et al., 2019), with one exception of Wang et al. (2023). While Wang et al. (2023) have briefly touched on types of emoji, their study has only divided emoji into two types, overlooking the diversity of emoji. More importantly, their analysis is limited to product-related textual content (esthetic experience and promotion), which cannot fully reveal the relationship between various emoji and brand-generated content. This study extends the study of Wang et al. (2023) by empirically identifying the patterns of text-emoji combination and investigating the effects of these patterns on user engagement using naturalistic data.
Representative Studies Combining Both Text and Emoji.
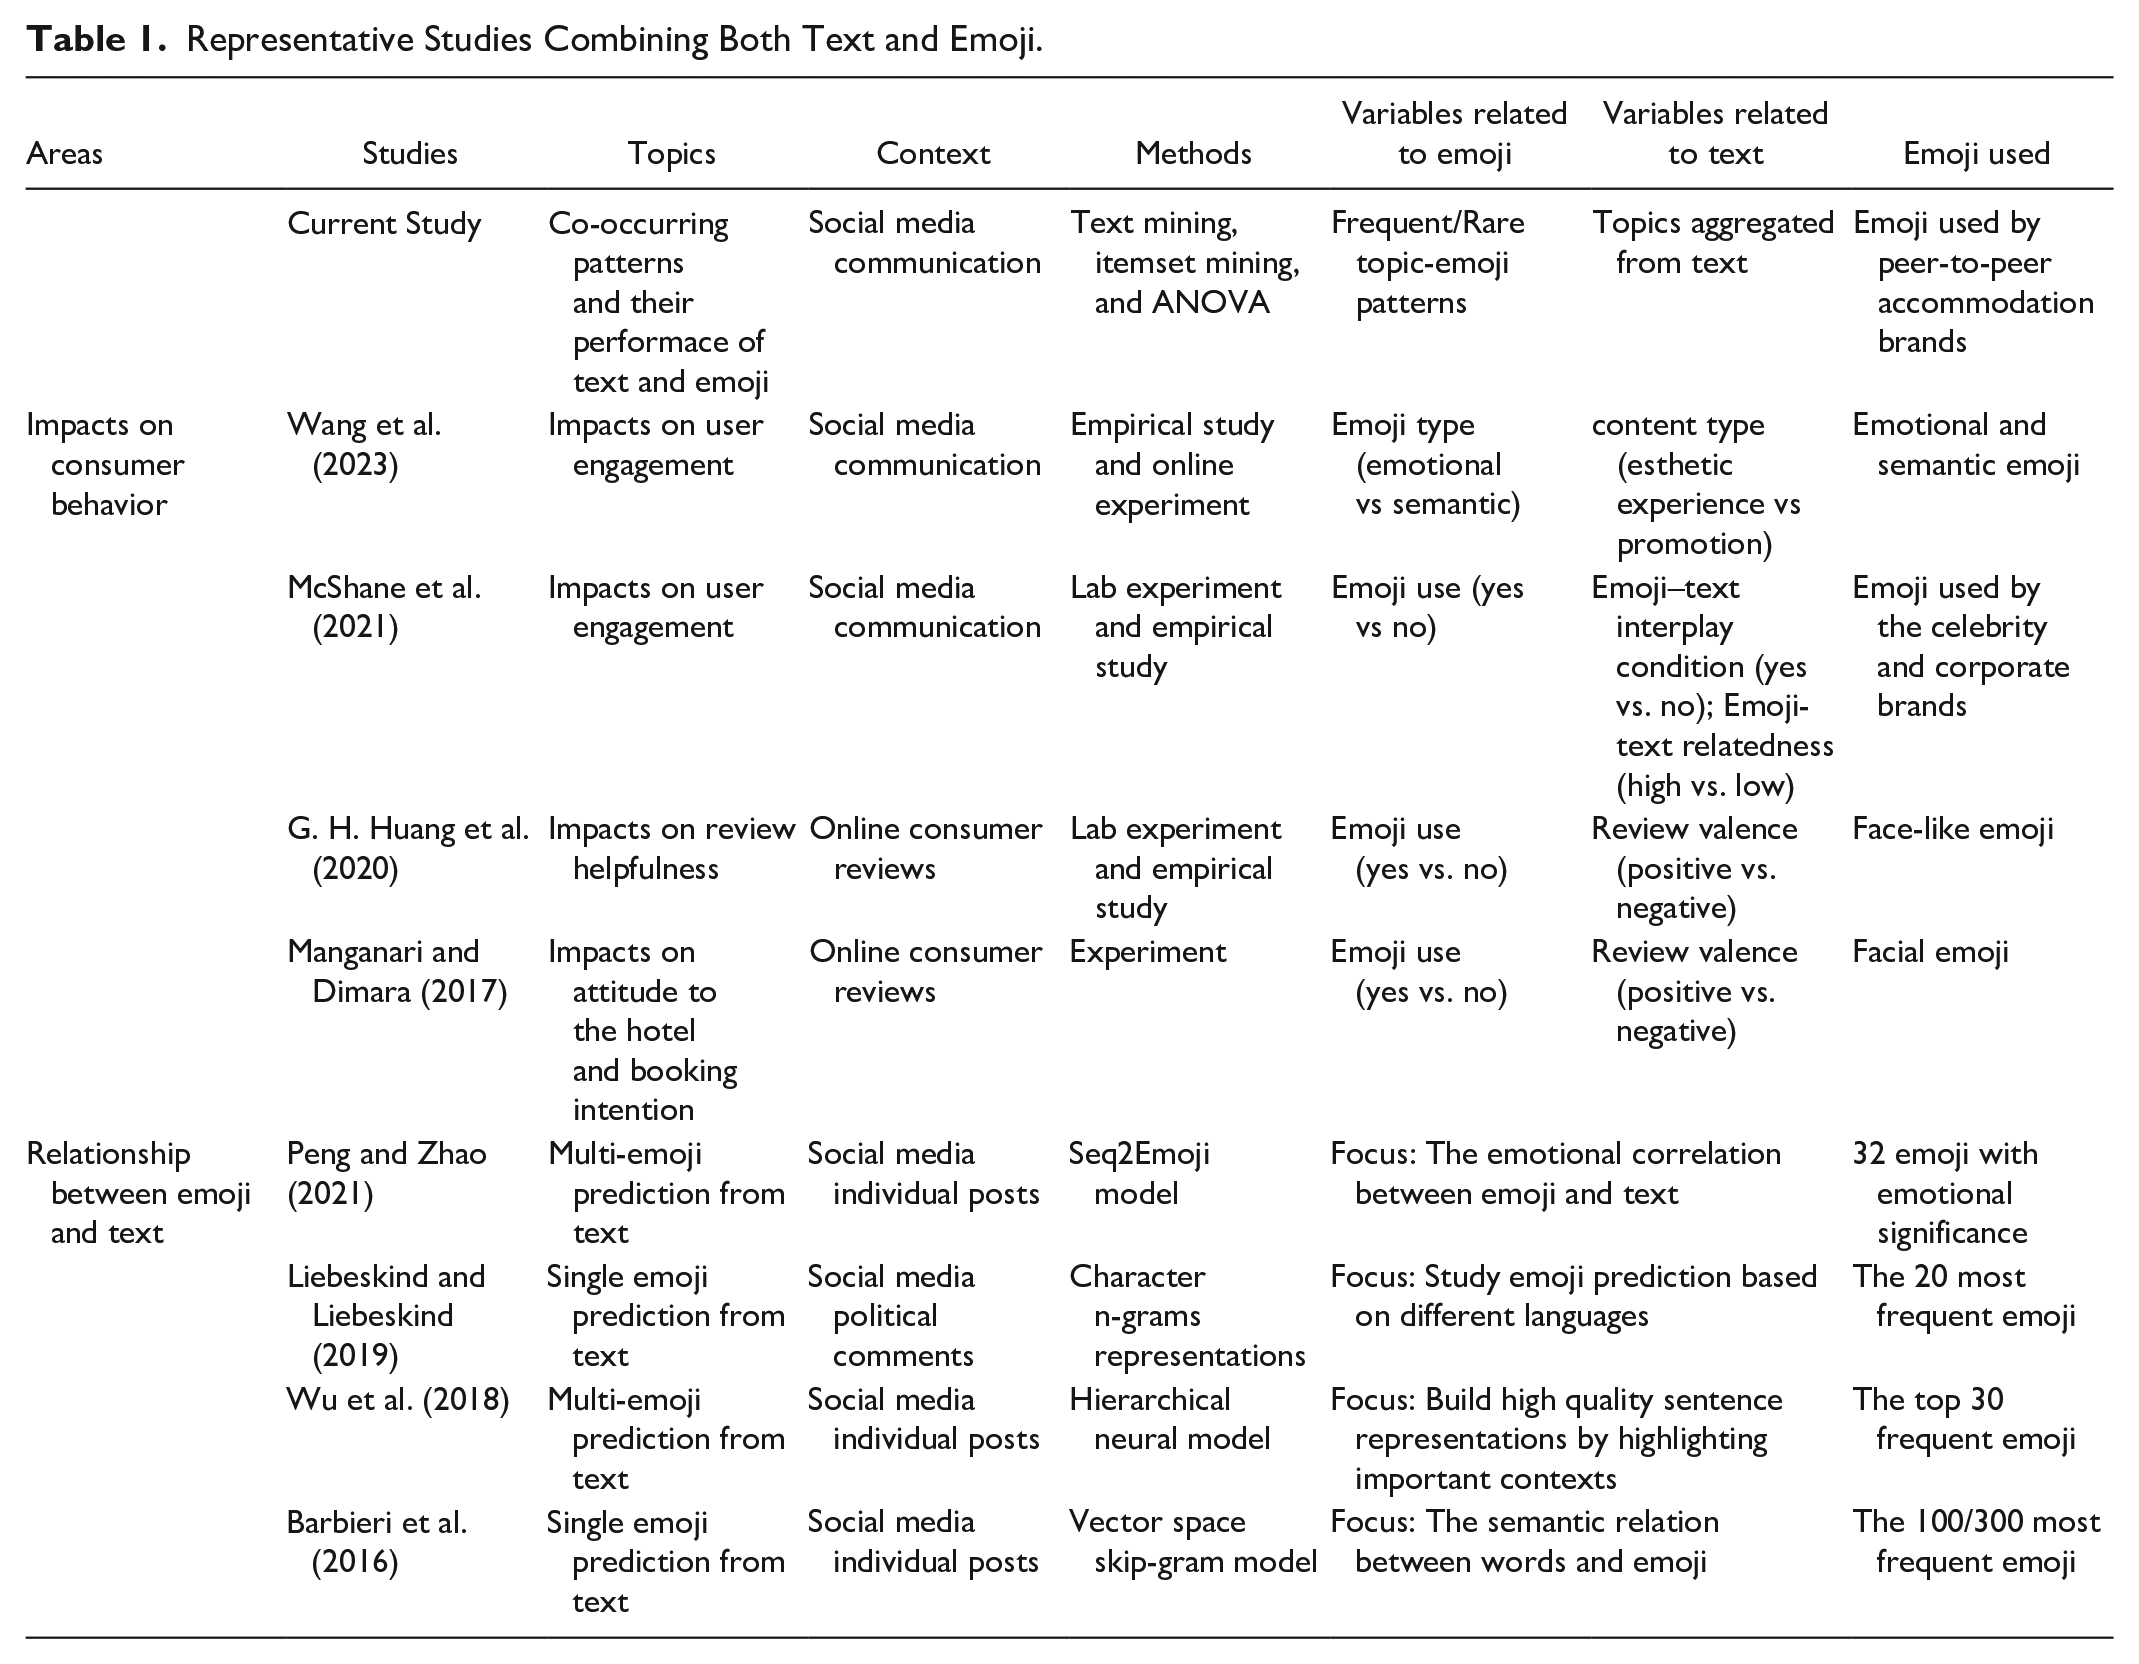
The second area explores the relationship between emoji and text, focusing on predicting emoji from text using machine learning approaches (e.g., Barbieri et al., 2016). However, these approaches all computed the embedding of emoji and words in a semantic space to generate an accurate model, rather than provide explanatory strategies for brands (Fournier-Viger et al., 2017). This stream of research overlooked the fact that emoji can also predict text. In fact, it is well-documented that visual elements are superior to those of text alone as they require less cognitive efforts to understand and draw inferences (Brubaker & Wilson, 2018). Thus, emoji, visual pictographs that are frequently displayed in colorful forms and utilized inline in text (Das et al., 2019; Ge & Gretzel, 2018; Rodríguez-Hidalgo et al., 2017), can be used to predict specific accompanying content, based on their original meanings and portrayed emotions.
In tourism, research on emoji is relatively recent, and the majority of studies (e.g., Basoda et al., 2022) have focused on whether emoji is present in social media posts, overlooking the relevance of the accompanying text. To fully examine the relationship between emoji and text and their joint effects, one promising approach would be to first discover meaningful and valuable frequent/rare patterns through co-occurrence patterns and itemset mining. Based on these patterns, the effectiveness of topic-emoji combinations on user engagement could then be assessed.
Social Media Engagement in Tourism
Social media engagement, often operationalized as the users’ liking, commenting and sharing behavior, has increasingly been used in tourism and hospitality (So et al., 2016), as engagement can lead to positive outcomes, such as brand awareness, brand trust, and word-of-mouth (Cvijikj & Michahelles, 2013). As such, a growing number of tourism literature has started to examine what and how social media content drives user engagement (Suh et al., 2021). Two main factors have been frequently identified in extant tourism literature including (1) text characteristics, such as vividness and interactivity (e.g., de Vries et al., 2012); and (2) text topics (Yang et al., 2022). While these studies have provided insights into the factors driving social media engagement, they focus on “text” only, failing to consider the visual content (e.g., emoji) that are often embedded in social media content (Wong et al., 2023). Thus, opportunities arise to critically examine the joint effects of emoji and text on user engagement on social media so that better social media performance of tourism brands can be more accurately measured.
Research Design
This research examined the relationship between emoji and text, and its joint effects on user engagement in peer-to-peer accommodation brand-generated social media content. Three stages were involved: Stage 1 involved using text mining to extract topics that co-occurred with the use of emoji, using word co-occurrence networks and text semantic cluster analysis; Stage 2 used itemset mining to identify frequent and rare topic-emoji patterns; and Stage 3 examined the effects of topic-emoji patterns on user engagement. Stages 1 and 2 were critical, as they addressed the first research aim, that is, to identify the co-occurrence patterns of text and emoji. In Stage 1, co-occurrence semantic network allowed the authors to identify which words were the most commonly used, how they were connected, and how the different communities were clustered (Segev, 2022). These clusters could be analyzed further to gain a deeper understanding of the underlying topics in the texts using real Twitter data. Stage 2 constructed a transactional database to further extract frequent and rare co-occurring patterns of topic and emoji, through frequent/rare itemset mining. Frequent/rare itemset mining is a data mining technique that seeks to derive itemsets that occur together frequently (rarely) (Luna et al., 2019). Stage 3 addressed the second aim, by examining the effects of topic-emoji patterns on user engagement, using one-way ANOVA. Figure 1 outlines the multi-stage research process. In this study, the rationale in choosing Twitter as the data source was that Twitter is one of the most widely used global social media marketing platforms (Jin & Cheng, 2020; Wang et al., 2021); use of Twitter enables brands to be innovative with their generic strategies on tweets, with limited characters (Juntunen et al., 2020). Barnes et al. (2020) found that 96% Fortune 500 companies in 2019 had active corporate Twitter accounts.
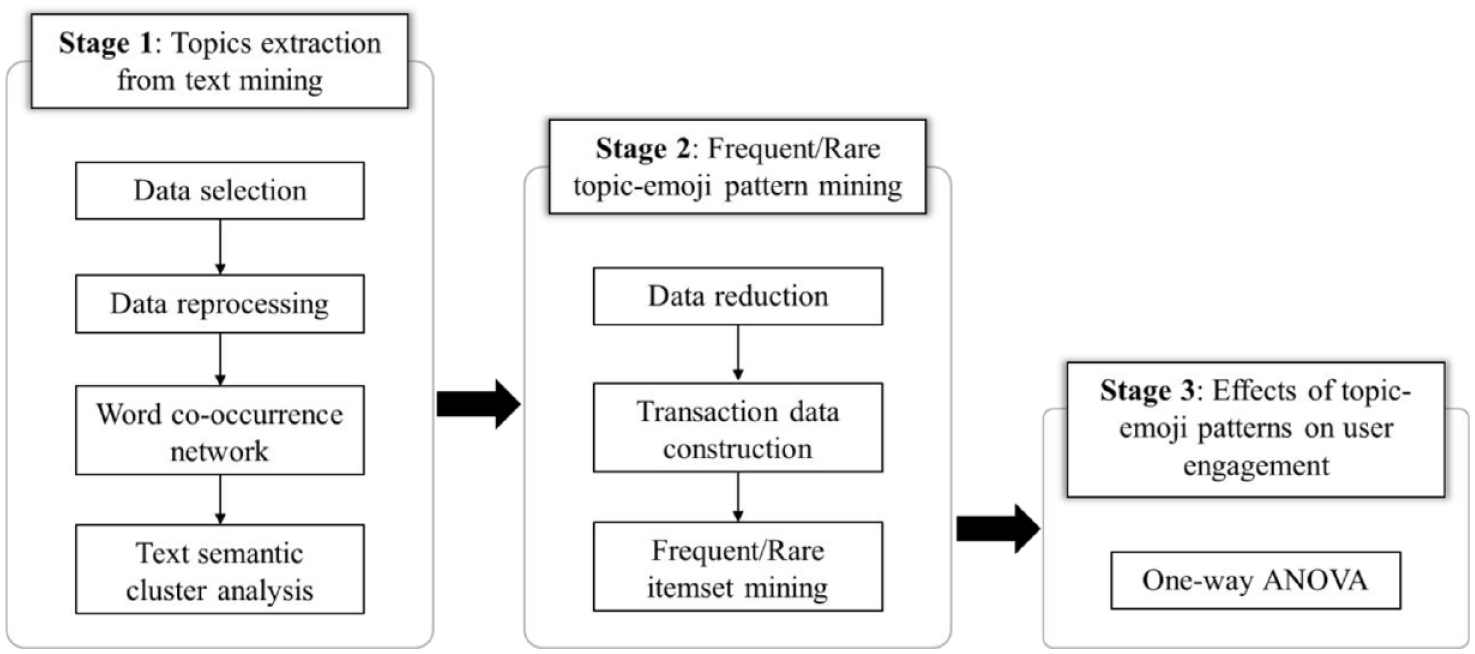
Multi-stage research process.
Stage 1: Topics Extraction From Text Mining
Data Selection
A total of 62 brands that had been extensively endorsed by the literature and industry reports as typical, global peer-to-peer accommodation brands, were first selected (Chan, 2018; Keshen, 2019; Meeroona, 2019; World Bank Group, 2018). This list was then narrowed down according to the following criteria: (1) The provision of peer-to-peer accommodation was required to be the brand’s main business, not just one component, (2) the accommodation exchange could not be reciprocal or free, (3) the operation was required to have continued until the end of 2019, and (4) the brand was required to have a unique official Twitter account, in English. To ensure an adequate sampling size, peer-to-peer Twitter accounts with tweets that included emoji accounting for at least 7.0% of all tweets posted in 2015 to 2019, were selected. As a result, seven brands were retained for further analysis. A brief description of each brand is outlined in Table 2.
Profile of the Peer-to-Peer Accommodation Brands.
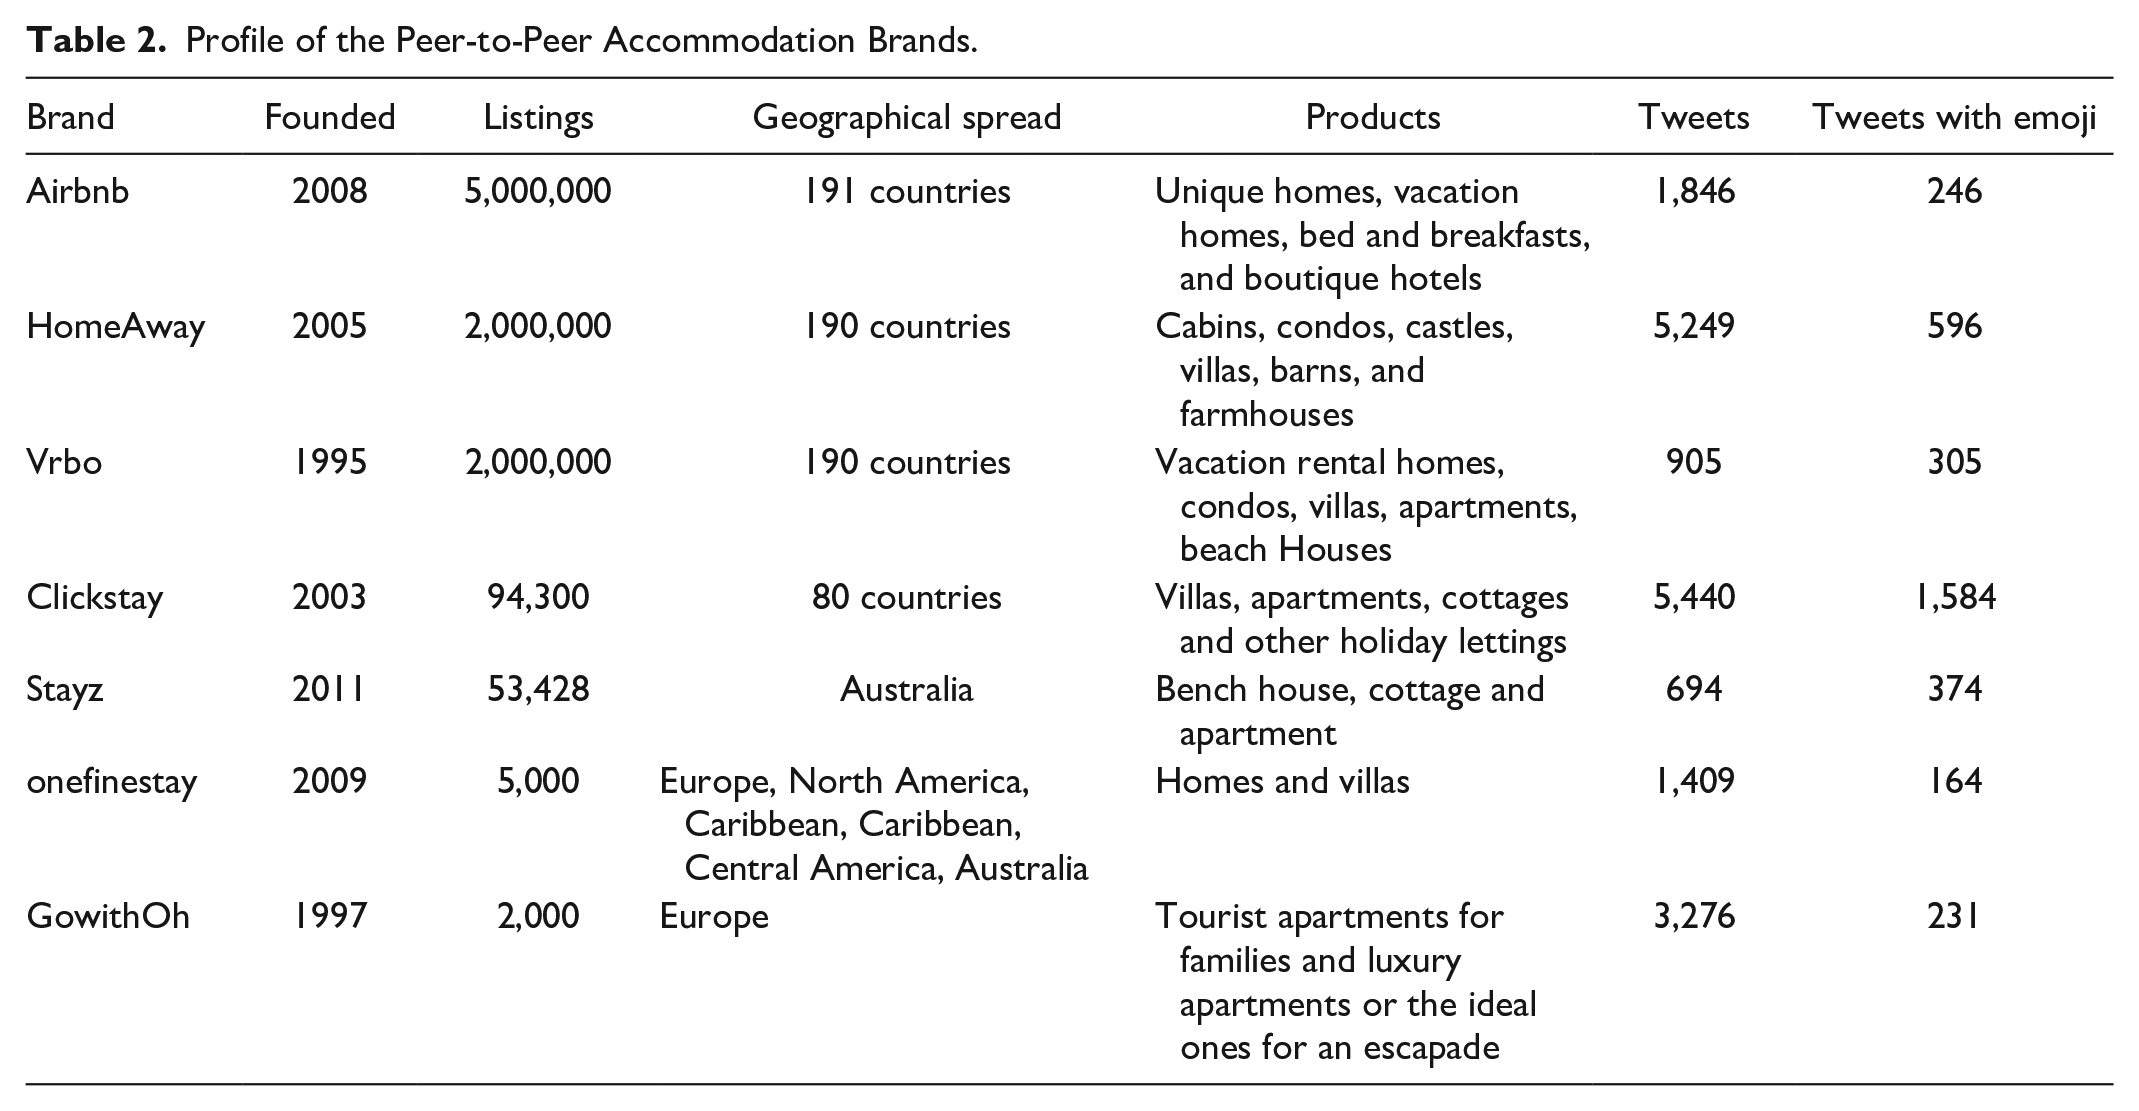
For each of these brands, a python-based web crawler was used to collect all the tweets posted from January 1st, 2015, to December 31st, 2019. A total of 18,819 tweets was included in this stage, and 3,500 tweets with a minimum of one emoji were used for further analysis. Furthermore, the numbers of likes, shares, and comments for each tweet were gathered.
Data Preprocessing
Each tweet that included emoji was pre-processed, as follows: (1) The symbol “@,” URL links, and all non-letter characters (including numbers and punctuation) were excluded, (2) regular, negative and other unique spoken contractions were expanded, for example, “isn’t” into “is not,” (3) texts were set to lowercase, (4) tokenization was undertaken (i.e., dividing each tweet into words), (5) parts-of-speech were identified and tagging (i.e., the process of determining parts of speech to each word, based on its grammatical category in a given sentence) was carried out, (6) lemmatization was undertaken (i.e., the conversion of words to their root form, such as “ate” and “eats” into “eat”), and (7) “stop” words, such as “a” and “the,” that have little or minimal meaning, were removed.
Word Co-occurrence Network
After preprocessing the data, a complete list of all the words was extracted from the text to develop a word co-occurrence network. This was achieved by highlighting the most commonly used words, and how they were connected, as well as the different clustered communities (Khokhar, 2015). In addition, a list of all bigrams, (two words appearing together in a tweet), was generated, and their frequencies calculated. Next, the networked output data was visualized using Gephi visualization and exploration software. The word co-occurrence network consisted of a set of nodes and edges. “Nodes” refer to the words transformed from the text, their size being set by betweenness centrality scores (Brandes, 2001); “Edges” usually represent connections between words; the frequency of bigrams determines their strength. In addition, Force Atlas (a Continuous Graph Layout Algorithm) was run to spatialize the word co-occurrence network (Khokhar, 2015).
Text Semantic Cluster Analysis
After transforming the text into a word co-occurrence network, the Louvain method was conducted to partition the network into different clusters (Blondel et al., 2008). The modularity of a graphical network is an indicator of its strength as a whole, describing how easily it can be discomposed into communities (Newman, 2006). Higher modularity means strong connections within the same community, whereas weak connections mean that connections are spread among different communities.
Modularity is known as, the proportion of “edges that fall into a given community” to the “total number of edges that can exist in those communities.” Mathematically, Equation 1 is followed for modularity, Q
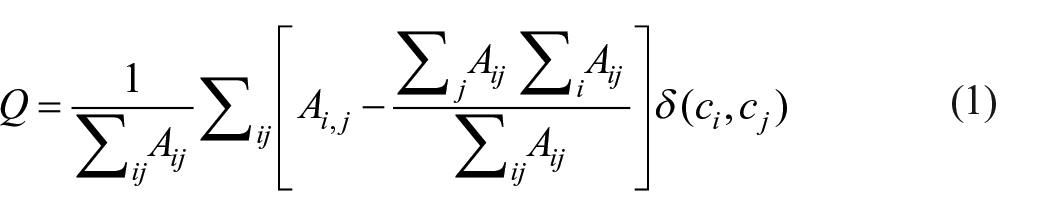
where Aij denotes the edge’s weight between i and j, ∑jAij represents the total of the weights of the edges associated to vertex i, and ci is the community to which vertex i is assigned. The δ function δ (u, v) returns 1 if u = v, and 0, otherwise.
Text Analysis Results
Descriptive Statistics
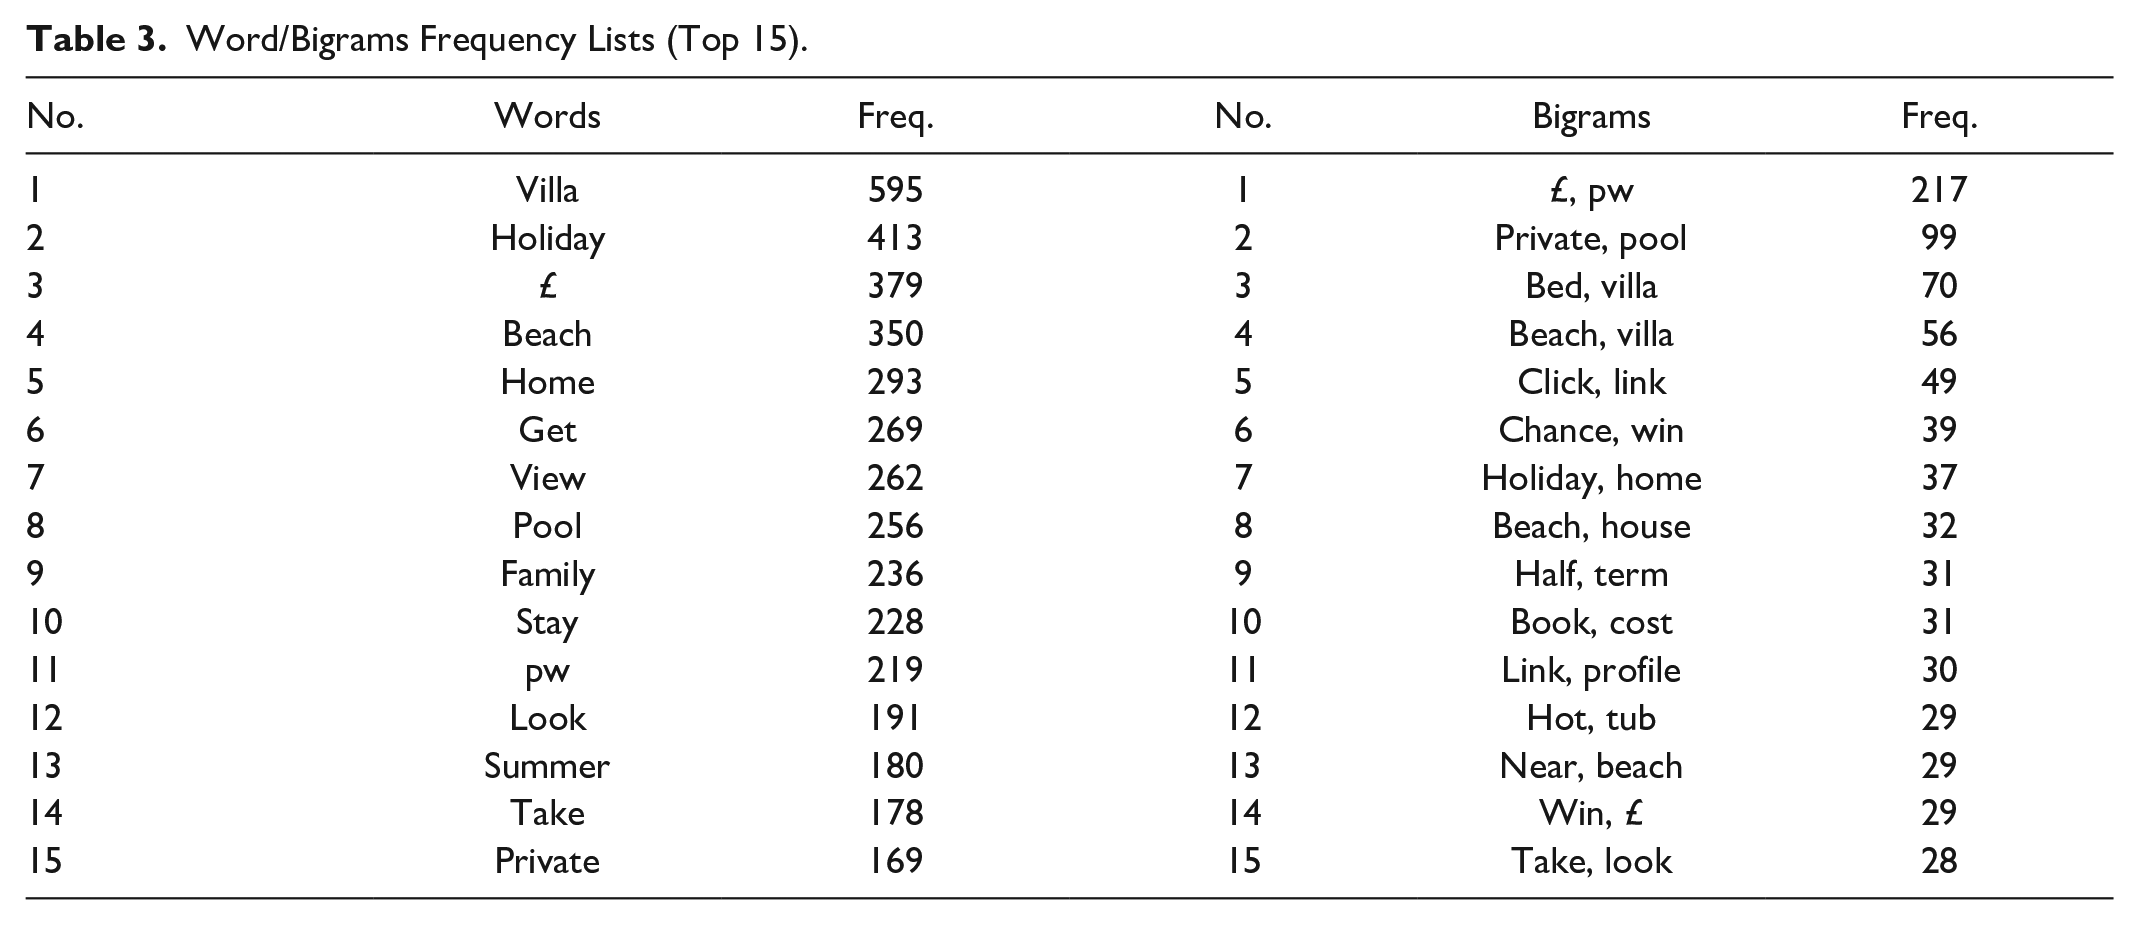
Five thousand, three hundred ninety-five (5,395) types of words, and 26,240 types of bigrams were identified for analysis. Figure 2 shows the frequency distribution of the number of occurrences of words. Around 93.79% of the words appeared less than 20 times, and the mean frequency of each word was 6.48, with a standard deviation of 21.13. This resulted in 592 different types of emoji, with an average of 2.12 emoji per tweet (see Figure 3). The 15 most frequent words/bigrams were extracted from the dataset (see Table 3).
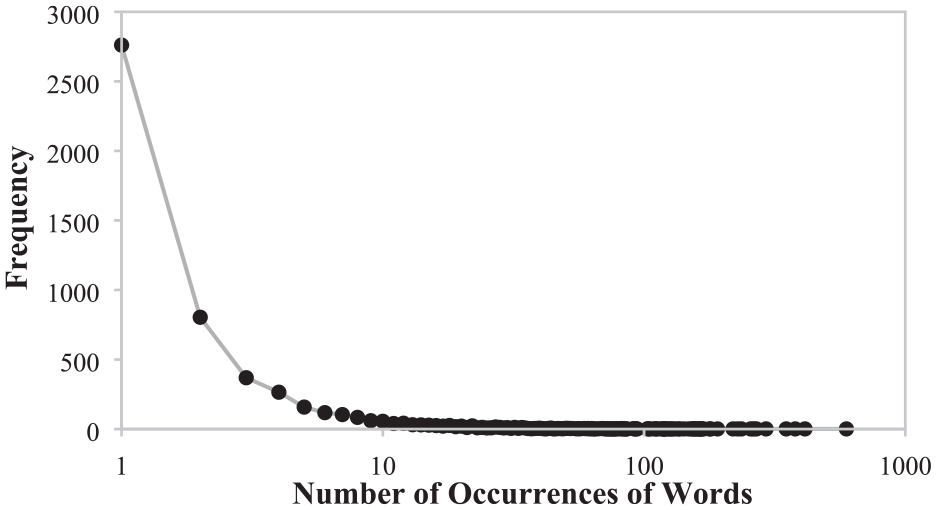
Frequency distribution of the number of occurrences of words.
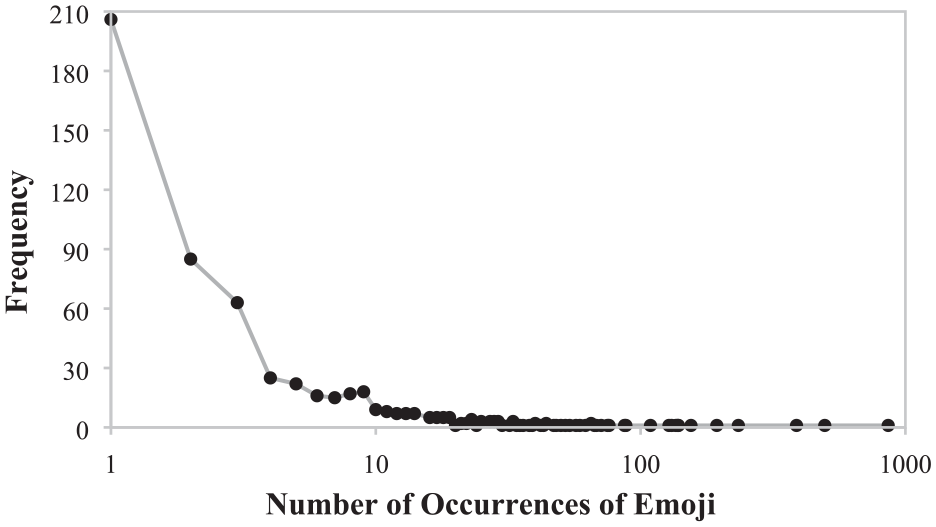
Frequency distribution of the number of occurrences of emoji.
Word/Bigrams Frequency Lists (Top 15).
Topics Co-occurring With Emoji
After data cleaning, a list of words and bigrams were loaded in Gephi, to visualize the word co-occurrence network. Words appearing less often than 20 times were dropped, to allow the micro-topics of a text to be distinguished (see J. Huang, 2017; Y. Zhu et al., 2019). After this, the word co-occurrence network consisted of 335 nodes and 5,774 edges. As can be seen in Figure 4, four communities were identified using the “Force Atlas” algorithm and the Louvain method, for community detection. Each community was composed of strongly related keywords, representing complex specific semantic concepts, distinct from other communities (Drieger, 2013; J. Huang, 2017).
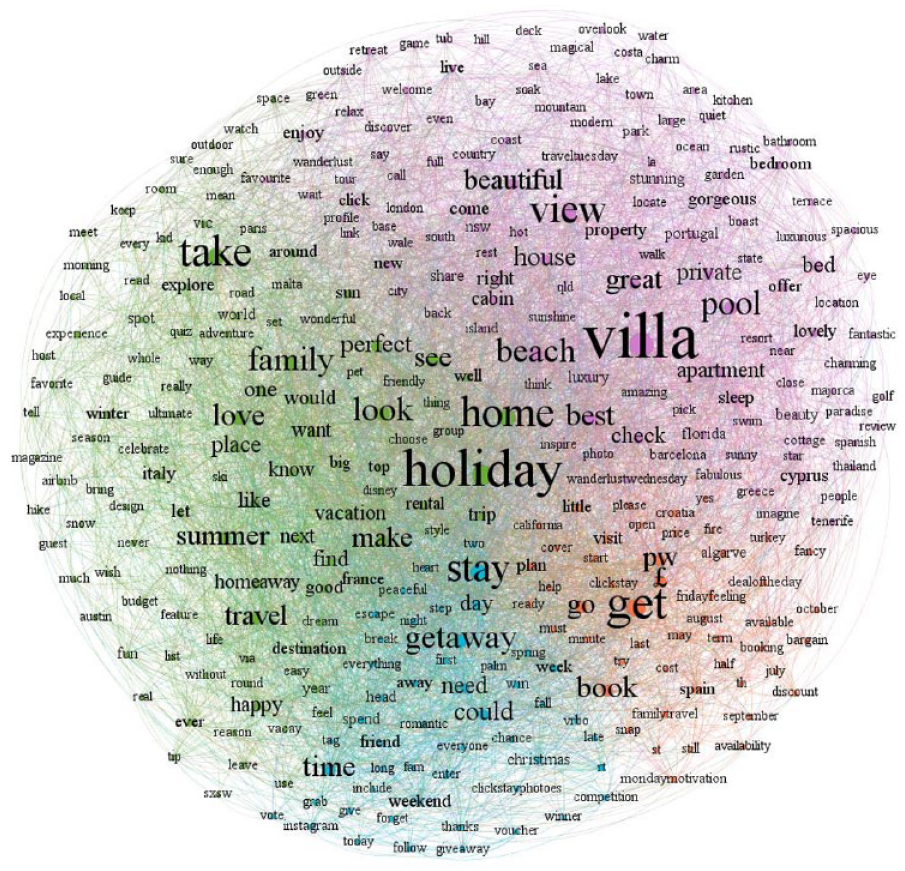
Word co-occurrence network.
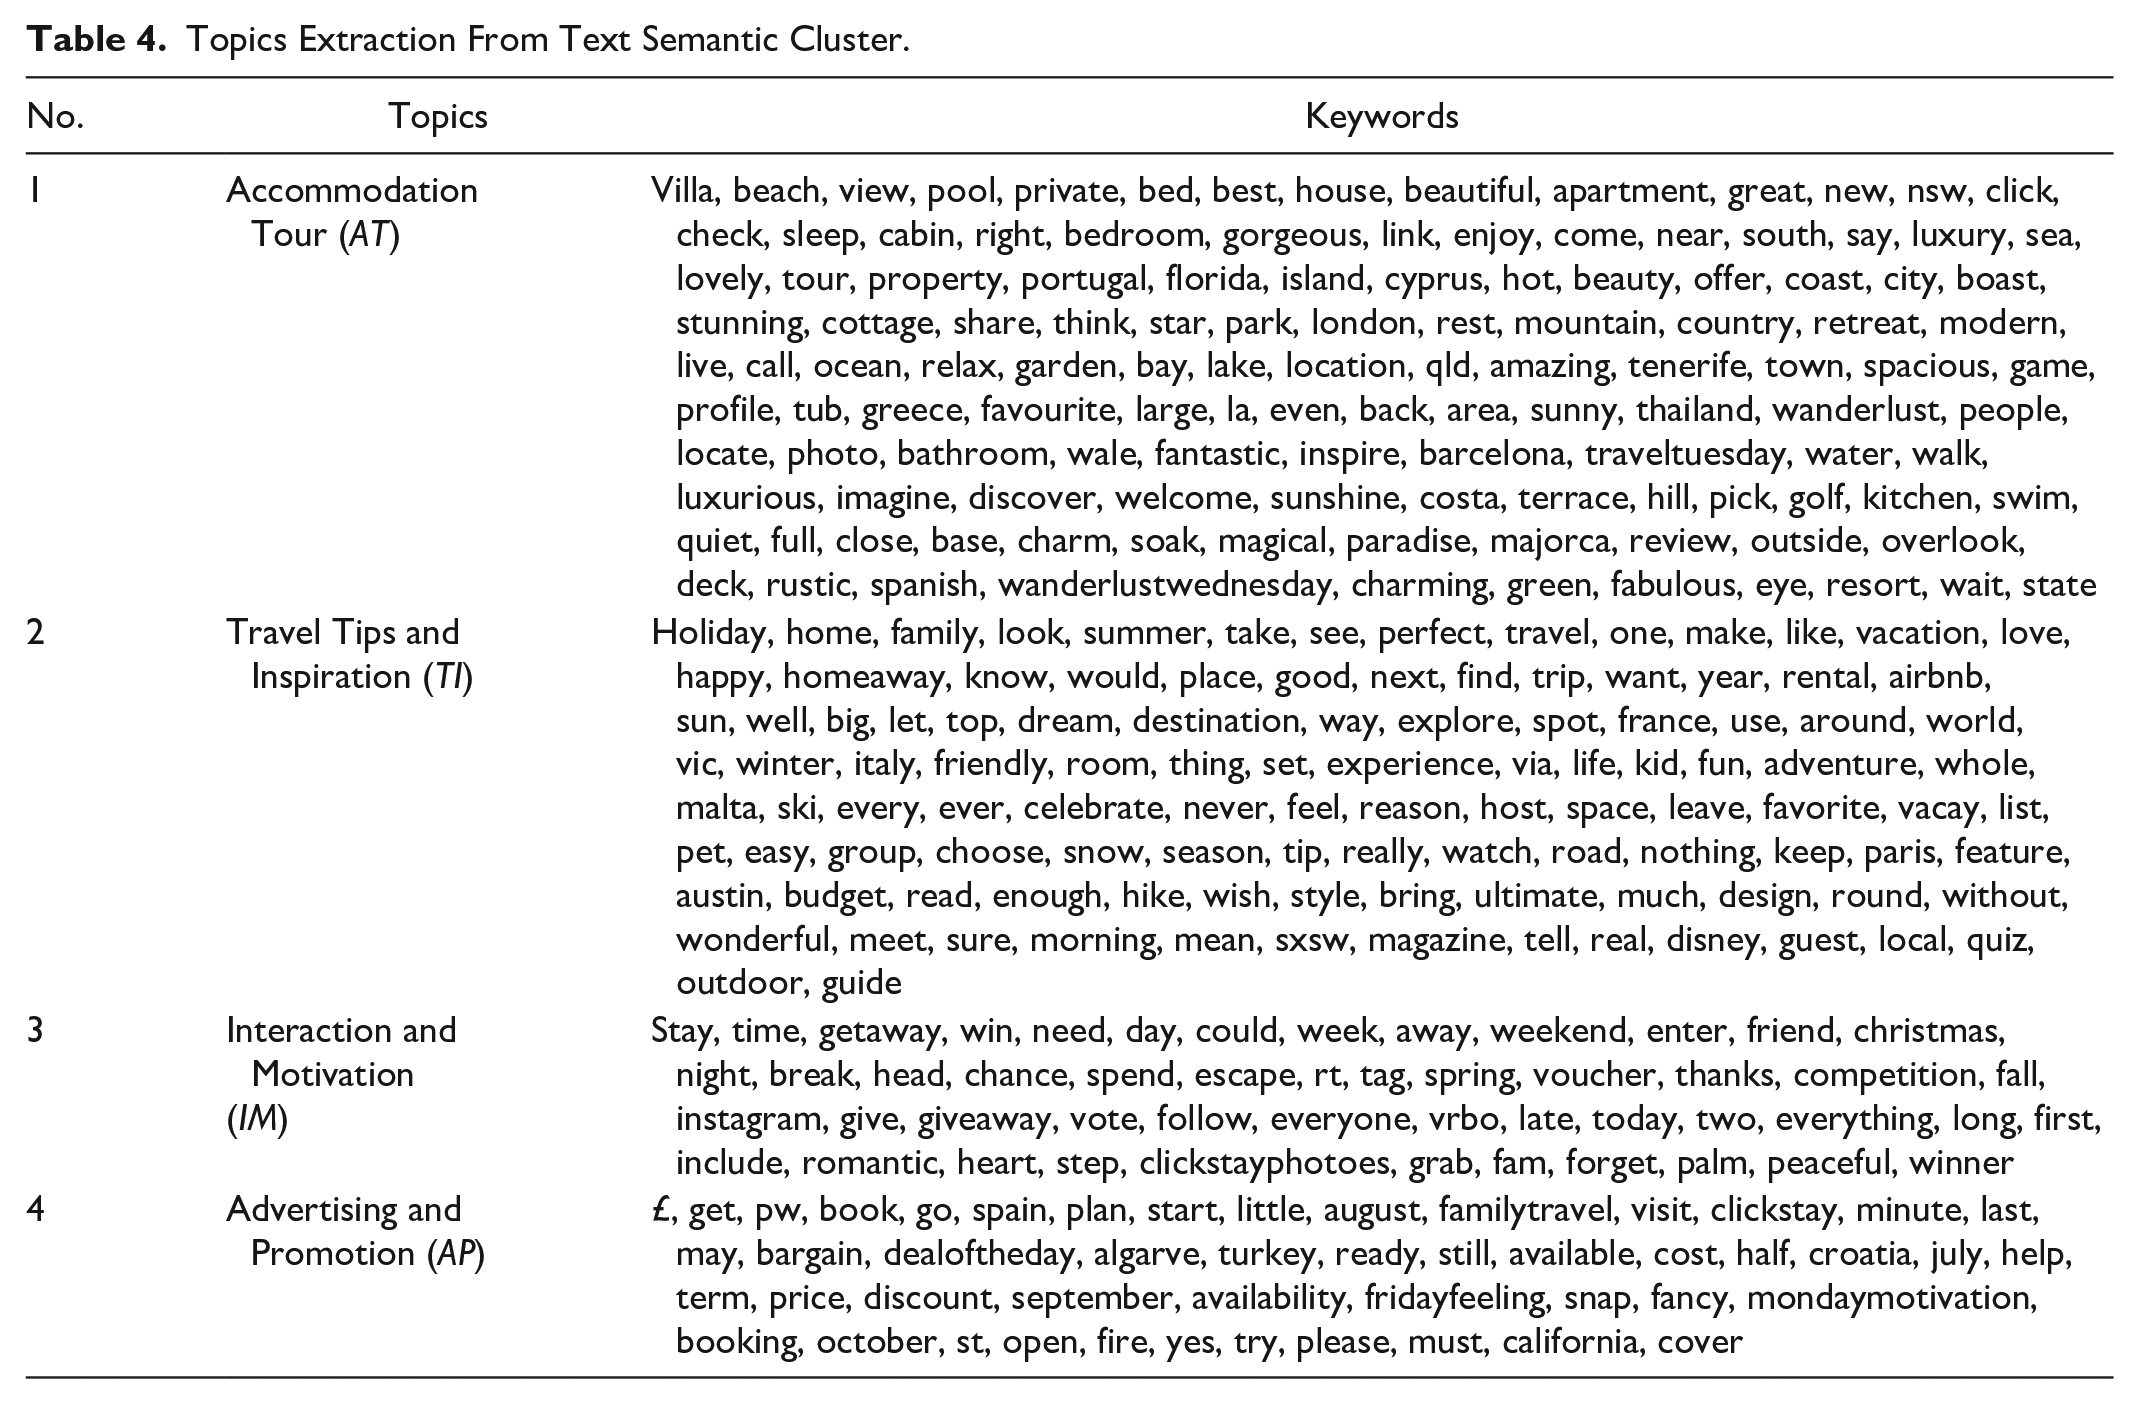
Table 4 displays four categories: Accommodation Tour (AT), Travel Tips and Inspiration (TI), Interaction and Motivation (IM), and Advertising and Promotion (AP), respectively. The first topic, “AT,” describes the physical property and facilities, views, location, space, and listings reviews. Consistent with a real host, the peer-to-peer accommodation brand proudly introduces its listings to it guests. Words commonly used to describe the properties, such as “beach,” “view,” “pool,” “bed,” and “beautiful.” The second topic, “TI,” is mainly related to travel tips and advice, especially destination recommendations. In addition, the content inspires travel plans and suggested activities. The value of this type of content lies in satisfying a consumer’s wish to escape reality, hedonism, esthetic enjoyment, and emotional release (Creevey et al., 2019). The third topic, “IM,” consists mainly of words relating to social interaction and future rewards. Social interaction tends to involve relational conversations—by posing questions, providing quizzes, eliciting votes, and asking for choices and shares, and expressing gratitude, congratulations and blessings. The promise of future rewards can be especially useful as a driver of engagement, with some interesting activities encouraged, such as looking for footprints in a given photo. The last topic, “AP,” mainly concerns advertising, prices, and exclusive deals, often containing indicative terms, such as “£ pw,” and “still available.”
Topics Extraction From Text Semantic Cluster.
Stage 2: Frequent/Rare Topic-Emoji Pattern Mining
Construction of the Transaction Data
In this stage, a transaction database was used to further analyze itemset mining, based on a set of tweets, with each tweet being a set of topics and emoji. That is, brand-generated tweets served as the units for the subsequent analysis. One problem was that the topics exacted from the text semantic clusters, were the topics of the entire text, not the corresponding topics of each tweet. Thus, the topics were required to correspond to each tweet. Based on the indicative words clustered as a topic (as identified in the previous steps), tweets were coded manually under the different topic categories, by one of the authors and an independent coder, who had previously received a coding worksheet and examples of each topic. After two coders had coded all the tweets on their own, any coding differences were resolved through discussion with another author.
The next step was to convert each tweet containing a mix of topics and emoji, into a suitable format that would present analyzable transaction data. Let T = {t1, t2, . . ., tm1} be a set of m1 distinct items, each representing a topic. Similarly, E = {e1, e2, . . ., em2} was a set of m2 distinct items, each representing an emoji. A transaction in this stage was defined as a list of items representing topics and emoji
Frequent/Rare Itemset Mining
The standard settings of itemset mining were defined as follows. Let I = {i1, i2, . . ., im} be a set of m distinct items (symbols), each representing an item (symbol). Let D = {TID1, TID2. . ., TIDn} be a set of n transactions, defined as a transaction database, and each transaction TIDi ⊆ I (1 ≤ i ≤ n) as a set of distinct items. Let |TIDi|=k denote that TIDi contains k items, called k-itemset. Similarly, |D| described the database containing the number of all the transactions. Taking the transaction database in Table 5 as an illustration, there were five transactions (TID1, TID2, . . ., TID5) and five items (t1, t2, e1, e2, e3). For example, the first transaction was a three-item set, representing the set of items t1, t2, and e2.
A Transaction Database.
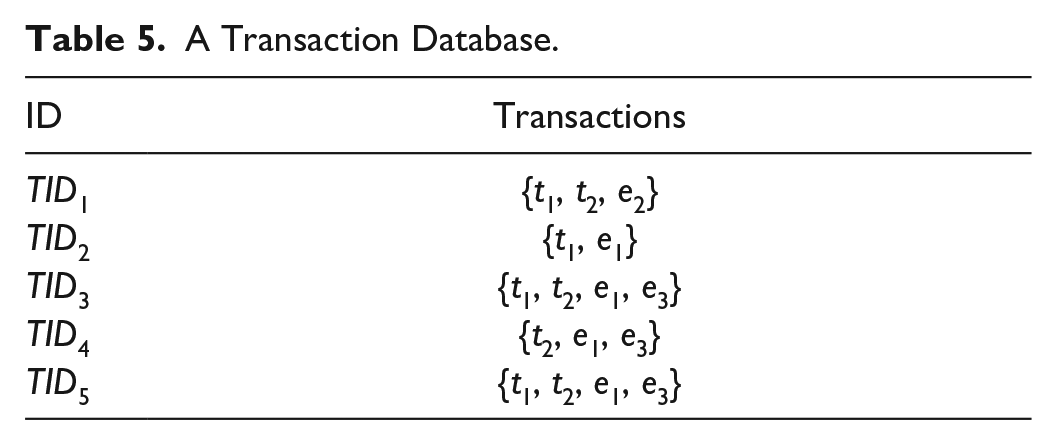
In general, various indicators can be used to evaluate the interest for itemset, in itemset mining (Fournier-Viger et al., 2017), but “support” is a basic measure of the “interestingness” of patterns (Szathmary et al., 2007). The “support” of an itemset is divided into “absolute support” and “relative support.” Let Sup(X) = |{T|X ⊆ T ∧ T ∈ D}| denotes the itemset X’s absolute support, and describes the number of transactions that contains itemset X; Let relSup(X) = Sup(X)/|D| denotes the relative support of itemset X, and describes the proportion of transactions containing X in the transaction database. For example, the itemset {t1, e1} appeared in three transactions (TID2, TID3, and TID5), so its “absolute support” was 3, and “relative support” was 0.60.
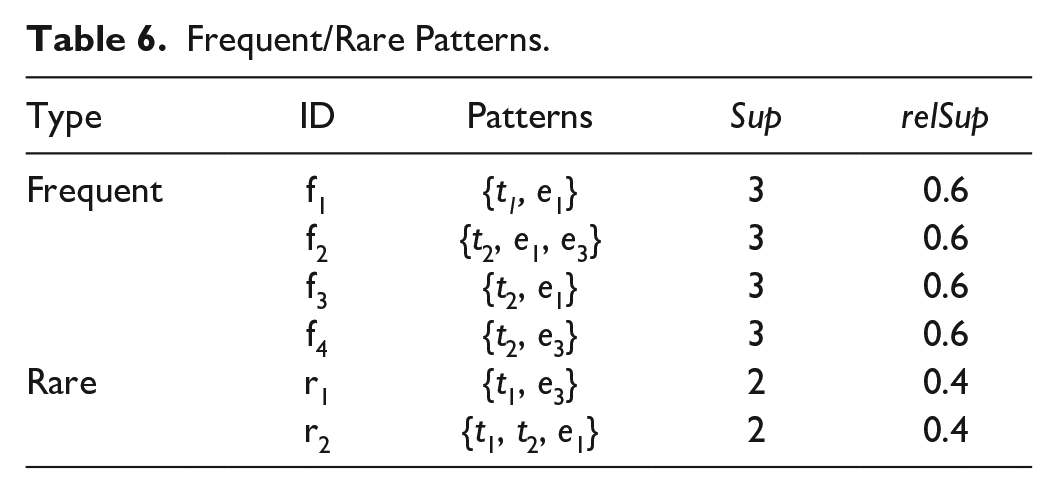
The aim of itemset mining is to extract useful patterns from a database. Among them, a frequent itemset has a “support” that is equal to, or more than, the specified minimum support set by users. Let minrelSup denotes the given minimum “relative support” threshold. If relSup(X) ≥ minrelSup, then itemset X is frequent; otherwise, it is rare. A frequent itemset is usually regarded as an extended “regular” item, whereas a rare itemset is related to an “exception” in the data, and all its subsets are frequent itemsets (Szathmary et al., 2007). Intuitively, an itemset with higher “support” is better. However, a rare itemset can convey information relevant to content marketing managers. Thus, frequent and rare itemsets were highly relevant for this study. In addition, the authors adopted “negFIN,” an efficient algorithm for fast mining frequent itemsets (Aryabarzan et al., 2018), and “AprioriRare,” an algorithm for mining minimal rare itemsets (Szathmary et al., 2007). The two algorithms were applied to the transaction database shown in Table 5, with minrelSup = 0.6, and a range of patterns were identified (as shown in Table 6).
Frequent/Rare Patterns.
Topic-Emoji Pattern Mining Results
Transaction Data Descriptive Statistics
Topics extracted from text semantic clusters and emoji were matched to their corresponding individual tweets. Because coding decisions were not necessary for identifying emoji embedded in the tweets, combined with the fact that emoji displaying long-tailed distribution could bring complexity to later analysis, the samples of tweets that included emoji were further reduced from 3,500 to 1,924. The 1,924 tweets containing the 13 most frequently used emoji was chosen, based on the fact that in the curve of the emoji frequency, the 13 most frequently used emoji reflected the last inflection point. Following this, Cohen’s “kappa” was used to ascertain whether the opinions of the two coders agreed on the topics of the 1,924 tweets. The Cohen’s kappa coefficient for this study was .702, indicating a strong degree of agreement (Landis & Koch, 1977).
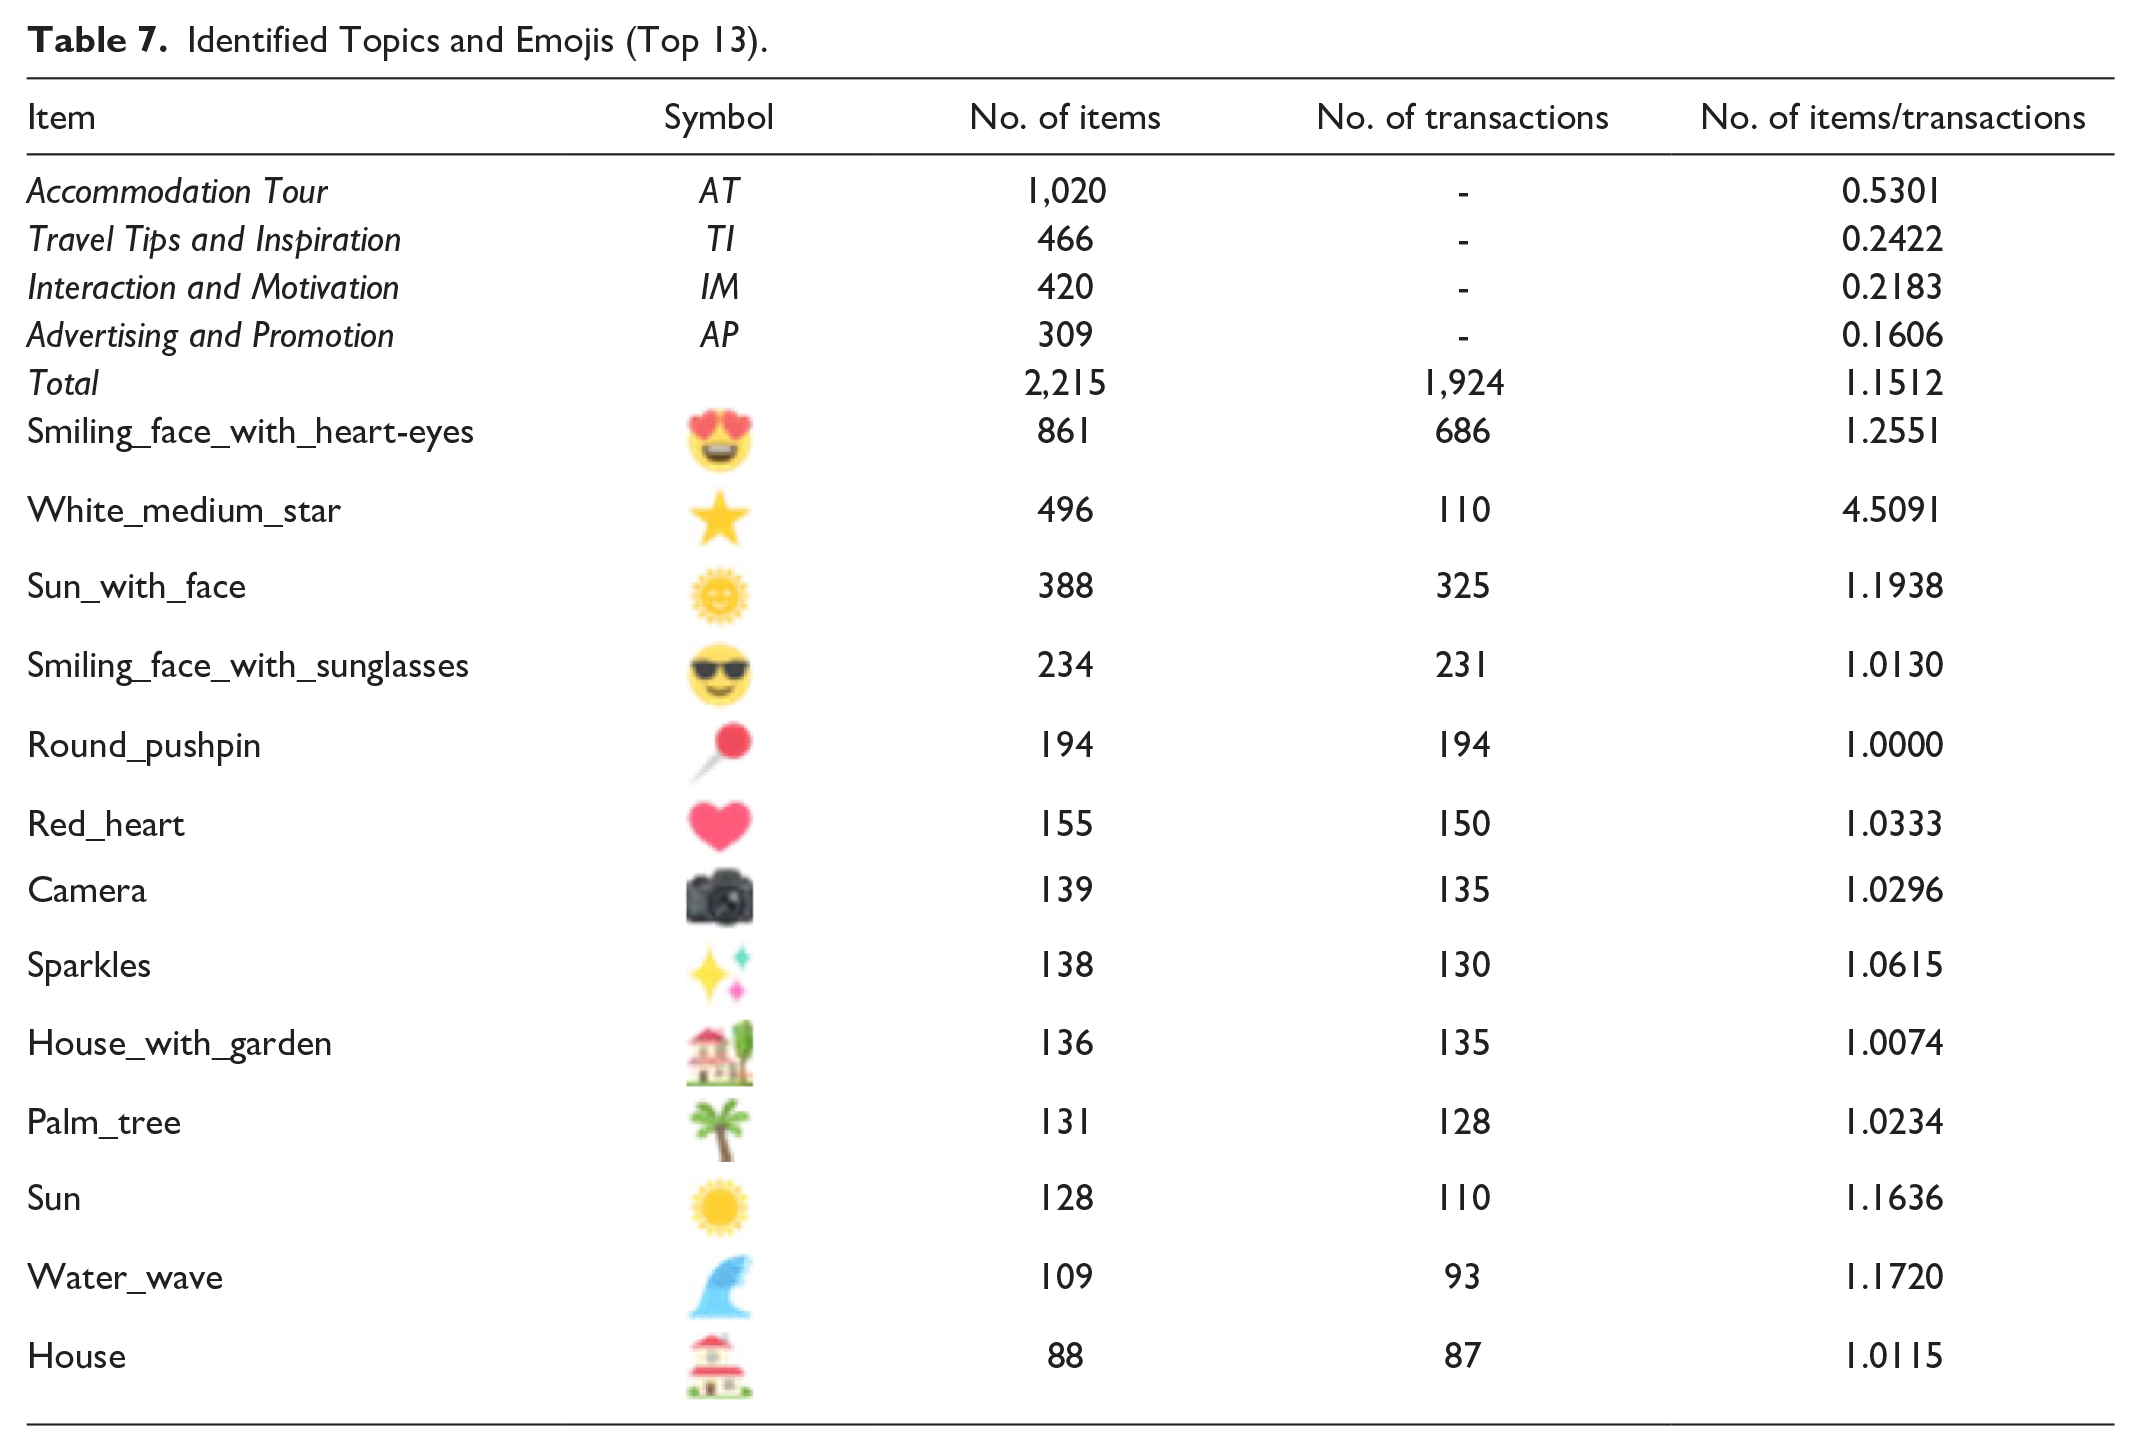
This total of 1,924 transactions (containing four topics and 325 emoji), were constructed for all analyses. Table 7 lists the statistics of the four identified topics and the top 13 emoji. In total, 1,924 transactions corresponded to a 2,215 frequency of topics, that is, on average, each tweet involved more than one different topic. Among these topics, the majority of transactions described “AT” (53.01%), followed by “TI” and “IM” (24.22% and 21.83%, respectively). Peer-to-peer accommodation brands were less likely to post “AP” (16.06%). In terms of emoji, the most frequent emojis used by peer-to-peer accommodation brands were “smileys,” and emoticons of people, including “”, “ ”, and “
 ”. Other high-frequency emoji were, “
 ”, “
”, “ ”, “
”, “ ”, “
”, “ ”, “
”, “ ”, “
”, “ ”, “
”, “ ”, “
”, “ ”, “
”, “ ”, and “
 ”. It is worth noting that according to the Emoji Sentiment Ranking (Novak et al., 2015), these frequently used emoji were all positive, with their sentiment scores greater than 0. In addition, each tweet involved on average, more than one emoji, especially the “”, which was embedded four or more times.
Identified Topics and Emojis (Top 13).
Frequent/Rare Topic-Emoji Patterns
The data sets of the constructed transactions at the individual tweet level were analyzed by using the negFIN and the AprioriRare algorithms in SPMF (Fournier-Viger et al., 2016). The minimum relative support was set to minrelSup = 0.04. The negFIN scans the data sets for frequent patterns and returns those patterns with a greater or equal to 0.04 relSup, whereas AprioriRare for mining minimal rare patterns, returns those patterns with a smaller 0.04 relSup, with all their subsets being frequent itemsets. Given that this stage only focused on the co-occurrence of topics and emoji, and that the sample size in each pattern could not be too small, only those patterns that contained both topics and emoji, and those rare patterns with a relSup of 0.02 to 0.04 were reported.
Fourteen frequent and 13 rare patterns were selected (see Table 8). Each pattern was annotated with its “absolute support” and “relative support.” For frequent patterns, the most regular co-occurrence was found between “AT” and “”, with an absolute support of 404 (f1) indicating that peer-to-peer accommodation brands convey enthusiastic feelings of love, infatuation, and adoration for their own listings; “” and “TI,” “IM,” and “AP” also frequently appeared together (f2–4, ); f5–9 and f12 indicated that “AT” was often self-presented with a group of emoji, including, “”, “”, “”, “”, “”, and “”; f10–11 indicated that “” was commonly used in combination with “TI” and “IM”; f13 demonstrated that more than one emoji (e.g., “” and “”) co-occurred with “AT,” while f14 revealed that more than one topic existed (e.g., “AT” and “AP”), frequently co-occurring with “” in the database.
Frequent/Rare Patterns.
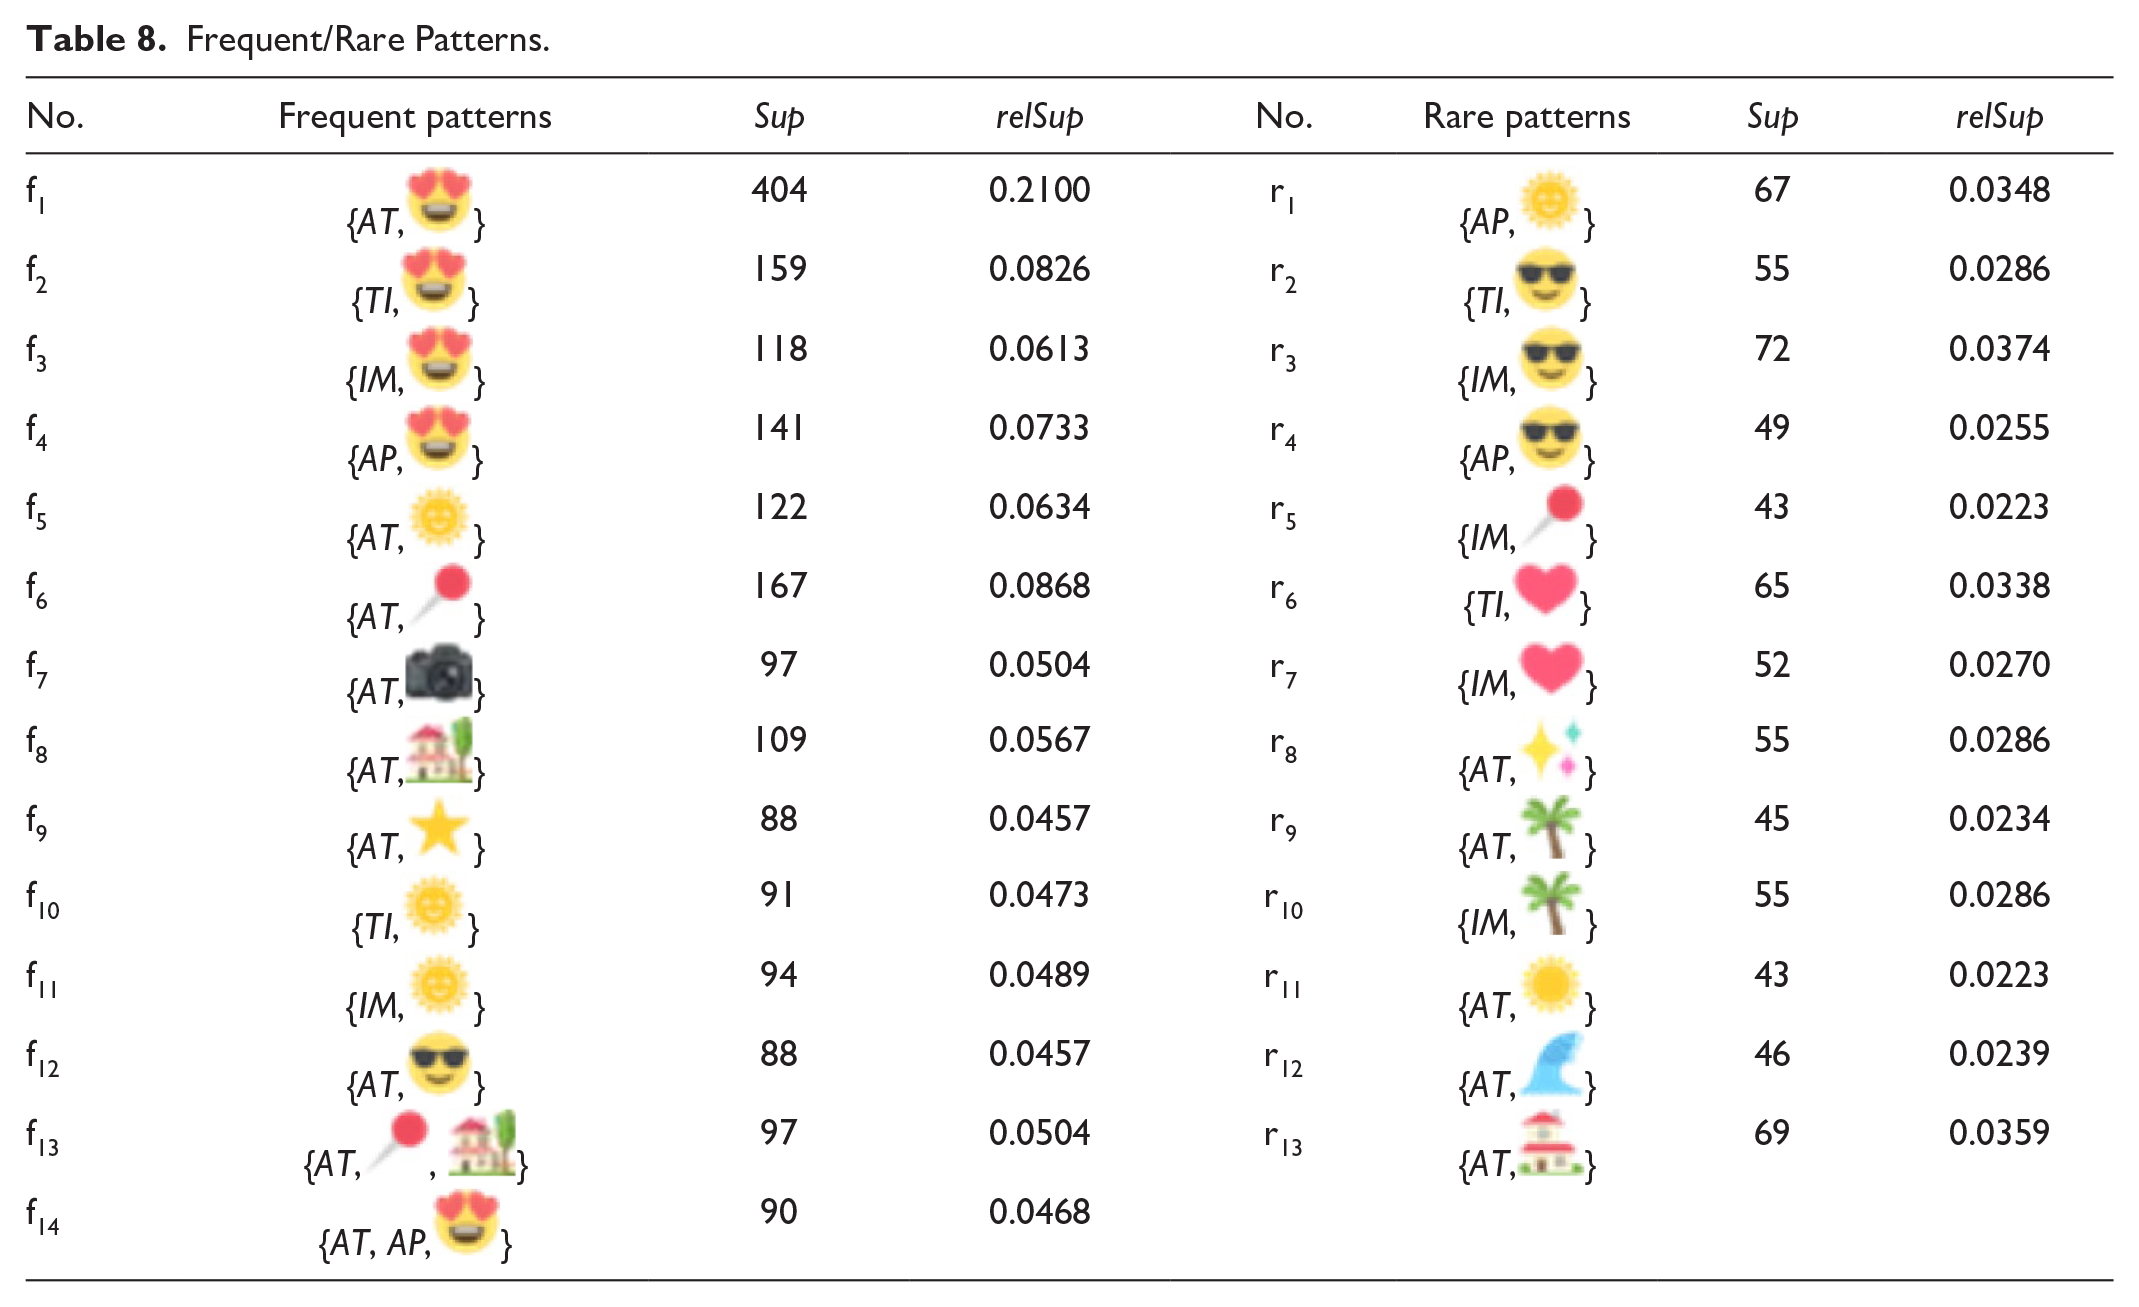
For rare patterns, there was a rare co-occurrence between “AP” and “”, with relative support of 0.0348 (r1); “”, “TI,” “IM,” and “AP” rarely appeared together, (r2–4). Another exception was “IM” and “”, which only occurred infrequently (r5); and although “” tended to express love, co-occurrences with “TI” and “IM” were also rare (r6–7); r8–9 and r11–13 show that “AT” is seldom self-presented with the following group of emoji, “”, “”, “”, “”, and “”; another rare pattern was “IM” with “”, with a lower relative support of 0.0286, (r10).
Stage 3: Effects of Topic-Emoji Patterns on User Engagement
The aim of Stage 3 was to examine the effects of topic-emoji patterns on user engagement. This stage focused on the impact of frequent/rare patterns of topic-emoji on user engagement. Thus, one-way ANOVA was conducted to first determine whether there was statistical evidence that the user engagement means of two or more independent patterns were significantly different overall. Furthermore, multiple comparisons were followed up with post-hoc tests to indicate which specific means were significantly different. The dependent variable was “user engagement,” which was operationalized as the number of clicks on “Like,” retweeting, or comments made by consumers, that is, likes, shares and comments on each tweet (see e.g., Tafesse & Wien, 2018); The independent variable consisted of different categorical, independent patterns, identified by itemset mining.
User engagement is generally measured by the number of likes, shares, and comments, and it was therefore necessary to match the previously identified 27 patterns with specific tweets, to convert the transaction data into a sample set, uniquely identified by the pattern. The sample set consisted of 2,563 records, including the two subsets: 14 frequent patterns (1,861; 72.61%) and 13 rare patterns (702; 27.39%). The number of likes, shares, and comments, count data, was processed as z scores prior to data analysis, and in addition, a small number of outliers was removed, based on 3δ principle. Statistics showed that the number of likes, shares, and comments for the entire sample was −0.0881 to 2.5930, −0.1082 to 2.9867, and −0.0777 to 2.6244, respectively. The descriptive statistics of the sample by frequent/rare pattern were as follows: the average number of likes, shares, and comments for frequent patterns was −0.0509, −0.0746, and −0.0553, respectively; for rare patterns, the means of likes, shares, and comments were −0.0264, −0.0328, and −0.0426, respectively. Notably, user engagement in frequent and rare patterns, differed, and the value of rare patterns was higher. This conclusion can also be drawn from Figure 5, which shows the means of likes, shares, and comments for 27 specific patterns.
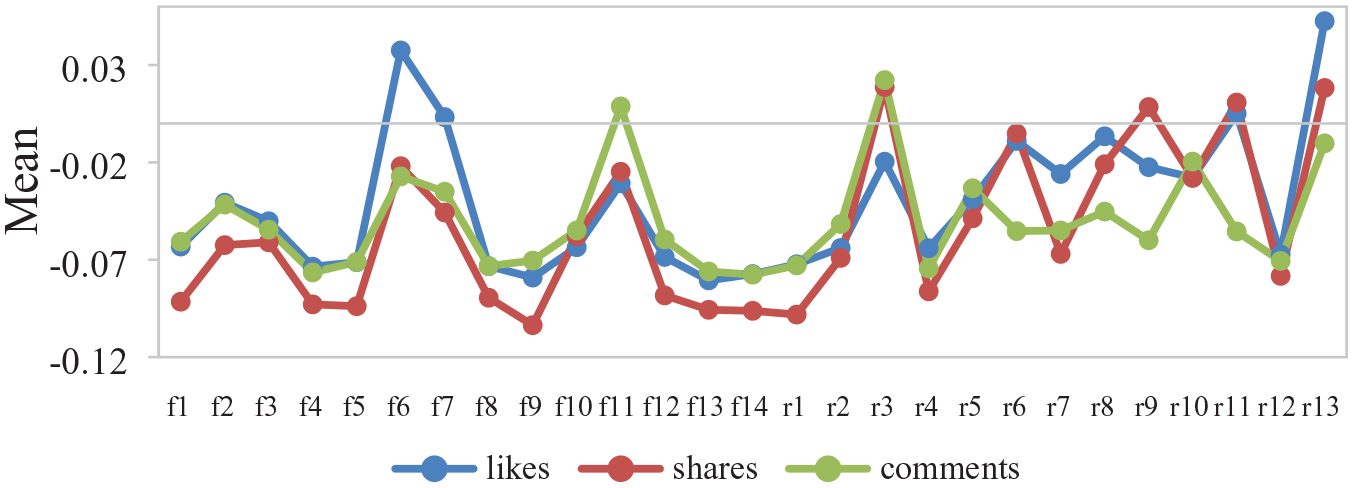
Means plot of 14 frequent patterns and 13 rare patterns.
The differences between frequent and rare groups were tested with Welch ANOVA. This revealed that there was statistical evidence that the means of the number of likes, shares, and comments were significantly different, F (1, 968.9912) = 6.9818, p < .001; F (1, 836.1813) = 17.3080, p < .001; and F (1,1,000.2057) = 3.8556, p < .050, respectively.
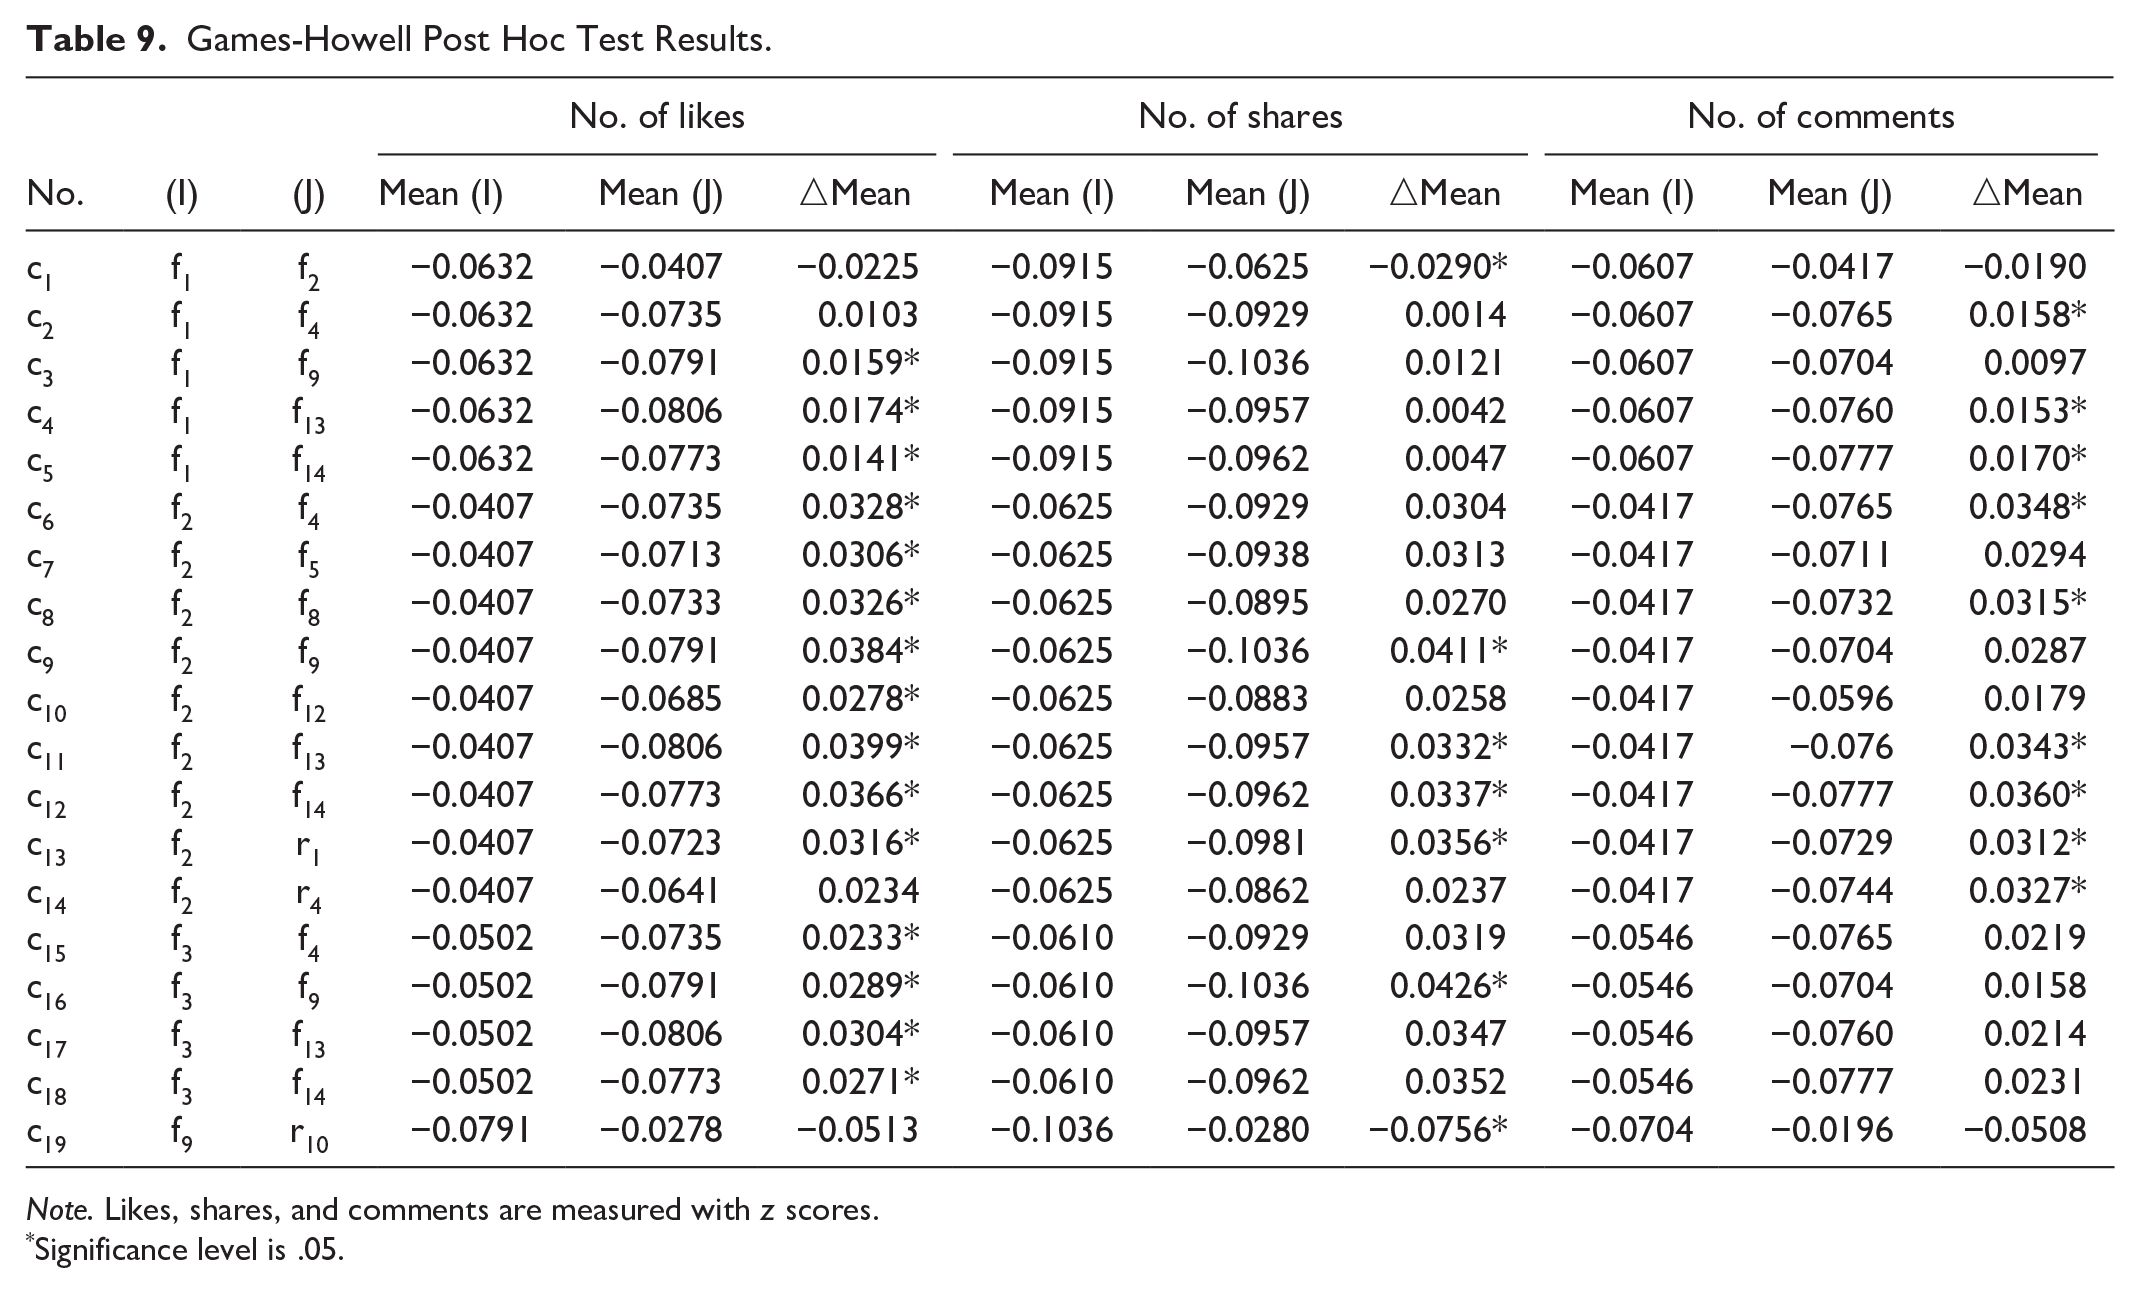
Next, the existence of a statistically significant difference was examined in user engagement concerning 27 specific patterns. The results for Welch ANOVA indicated that statistically, there was a disparity in the number of likes F (26, 675.8615) = 6.9933, p < .001; and shares, F (26, 673.8236) = 5.1045, p < .001; and comments, F (26, 661.6375) = 6.2728, p < .001. The Games-Howell post-hoc test was further conducted to determine which specific pairs of means were significantly different. Only the results for multiple comparisons with significant differences are listed in Table 9. As indicated by c1–c19, four conclusions can be drawn. First, the same emoji that are embedded in different text topics will generate different levels of user engagement. As in c1, c2, c6, and c15, for example, with regards to the impact of “” on user engagement, “AT” is better than “TI,” which in turn, is better than “AP,” whereas “IM” is better than “AP.” Second, even if the same topic is matched with different emoji, it will generate different user engagement. Compared with a combination of “AT” and “”, the number of likes associated with “AT” and “” was statistically significantly greater as in c3, indicating that emotional emoji are more effective at generating “liking” behavior by consumers, than are semantic emoji embedded in listings descriptions with esthetic experience. Third, the combinations of different emoji and different topics will also generate different user engagement, as in c7–c13, and c16. Finally, both frequent and rare patterns will drive user engagement. In particular, as a rare pattern, the combination of “IM” with “” can generate a higher number of “shares” than combining “AT” with “”, as demonstrated by c19.
Games-Howell Post Hoc Test Results.
Note. Likes, shares, and comments are measured with z scores.
Significance level is .05.
Conclusion and Discussion
Through the use of text mining and itemset mining, the current study has identified both topics co-occurring with emoji and frequent/rare patterns where topics and emoji are embedded in peer-to-peer accommodation brand-generated social media content. This study also investigated the impacts of topic-emoji patterns on user engagement. Specifically, the following four content types, “Accommodation Tour,” “Travel Tips and Inspiration,” “Interaction and Motivation,” and “Advertising and Promotion,” were extracted as the textual context for emoji. Regarding co-occurrence patterns, frequent patterns, such “Accommodation Tour” combined with “”, were revealed as “regularities,” whereas rare patterns, such as “Interaction and Motivation” combined with “”, were revealed to be “exceptions.” Moreover, the co-occurrence of topic-emoji supports the proposition of Cappallo et al. (2019)—emoji is distinct from text. For example, the probability of “” being used to represent love is almost 60%, where “Accommodation Tour” and “Advertising and Promotion” appear, whereas the combination of “” and “”, has an 88.18% tendency to be linked with “Accommodation Tour.” Moreover, this proposition is further supported by the impacts of different patterns on user engagement. Those patterns with different emoji and the same topics have different effectiveness. For example, the number of likes for “Accommodation Tour” combined with “” is statistically significantly greater compared to “Accommodation Tour” combined with “”. Similarly, the number of comments relating to “Accommodation Tour” and “”, is statistically significantly greater than those of “Advertising and Promotion” and “”. This demonstrates that the same emoji embedded in different topics can generate different results. Meanwhile, the revelations from the extraction of rare patterns of topics and emoji have been useful. The rare pattern of “Interaction and Motivation” and “”, generated a higher number of shares compared to a frequent pattern, for example, “Accommodation Tour” and “”. This supports the argument of Szathmary et al. (2007) for the recognition of rare itemsets, in contrast with the majority of existing studies, which only focus on the mining of frequent itemsets (Szathmary et al., 2007).
Theoretical Implications
By examining the effects of visual-verbal content in social media posts, this study enriches the theoretical understanding of the media complexities relating to tourism brands in general, and peer-to-peer accommodation brands, specifically. First, this study broadens the explanatory power of media richness theory, by investigating the relationship between visual and verbal content (i.e., text and emoji) in brand-generated social media posts. Previous literature has rarely provided a full theoretical and empirical explanation of how emoji and text can work together to enhance the media richness of brand-generated social media content. Compared with prior research, which has focused on the relationship between emoji and text from a semantic perspective (e.g., Barbieri et al., 2016; Wu et al., 2018), this study has theoretically and empirically shown that communication effectiveness depends on combinations of emoji and text. This opens a wide range of opportunities for further study on the relationship between emoji and text. As shown in this study, a text explains what brands wish to say, and an emoji expresses how this is said, suggesting that the combination of the two can significantly strengthen the carriers of brand-generated social media content in conveying complex information.
Second, this study provides theoretical insights into how new or novel tourism brands can effectively leverage brand-generated social media content in establishing its online presence. As a new alternative to traditional accommodation, peer-to-peer accommodation brands need to be recognized and achieve their unique positioning. Although there has been some research that has explored peer-to-peer accommodation brand personality (Wang et al., 2021) and advertising appeal (Liu & Mattila, 2017), extant tourism literature has not fully addressed the nuances of the digital communication strategies of peer-to-peer accommodation brands. This study provides novel stimuli for the formation of new brand connections with consumers, through the co-occurrence of emoji and text. This extends previous literature on the factors that influence new brand’s penetration strategies into a relatively well-established market by going beyond the logo design of brands (Henderson et al., 2004), media channel choice (Anselmsson & Tunca, 2019), brand name (Yorkston & Menon, 2004), or type font characteristics (Grohmann et al., 2013). This study reveals that emoji co-occurring with text can be effectively used as a significant and easy-to-implement approach for tourism brands to stimulate user engagement.
This study also contributes to the marketing communication literature by developing a typology of the relationship between texts and emoji in tourism brand digital communication. Previous studies have mostly considered emoji to be a binary variable (e.g., the presence of emoji, informational or emotional), and its impact on consumer reactions (Ko et al., 2022). This study has investigated the effect of emoji at a more in-depth level, by identifying and empirically testing the effect of the typology of emoji and texts on user engagement. The typology identified by this research offers a holistic view of the combination of emoji and texts in tourism brand digital communication.
Finally, this study also contributes to user engagement literature in tourism, by examining the effects of visual-verbal content on different engagement metrics (i.e., the number of likes, shares, comments). Previous studies have suggested that “like,” “share,” and “comment” require different level of cognitive effort (Muntinga et al., 2011). Like-clicking requires the lowest cognitive effort and is regarded as passive engagement, whereas sharing and commenting requires a higher level of cognitive effort and is considered to be “contributing” and “co-creating” (Kim & Yang, 2017). Given that extant studies relating to engagement have predominantly adopted single measurements of the number of likes, comments, or shares, this study is innovative by utilizing them together, further revealing significant differences among these three different engagement types. For instance, the results of the current research indicated that “Travel Tips and Inspiration” combined with “”, led to a higher number of likes and shares, and a relatively small number of comments.
Methodological Contributions
This study contributes significantly to extant tourism methodological literature by providing a broader methodological toolbox to better comprehend the relationship between verbal and visual content. The use of a sequential research design, from text mining to itemset mining, in investigating the joint effect of emoji and text, goes beyond the conventional approach, which has tended to examine emoji and the text separately (Miller et al., 2017). In fact, the challenge in examining the relationship between emoji and the text, is that they mutually influence each other (Tang & Hew, 2019), and as such, scholars have called for more innovative and multiple methods to fully investigate this phenomenon (McShane et al., 2021). The methodological approach of the current study directly addressed this call, and the methods presented in this study demonstrate abundant possibilities in tourism to develop innovative methodological approaches.
Practical Implications
This study offers actionable guidelines for tourism brands to increase user engagement by leveraging the typology of the relationship between emoji and text. Brand can utilize the findings of this study to effectively use emoji and text together when crafting brand-generated social media content. For example, to achieve a larger number of likes and shares, it is encouraged that “Travel Tips and Inspiration” and “”, and “Interaction and Motivation” and “”, be used together, rather than “Accommodation Tour” and “”, as the combination of these two has a greater impact on user engagement.
This study also offers important implications for developing relevant algorithms to optimize the platform design for social media platforms. As shown in our study, certain combination of text and emoji can induce higher level of engagement. The findings indicate that when users type certain text, the platform can recommend the matching emoji that can stimulate engagement among users, which can significantly enhance user experience on social media platform.
Limitations and Future Research
This study is not without limitations. Although the co-occurring patterns of topics and emoji, and their effects on user engagement, have provided helpful insights, other elements included in social media content have not been considered in this study. Examples of these related elements, are hashtags, links, images, and videos. These can disproportionately influence the characteristics of content, and further impact user engagement. Second, due to the constraints of itemset mining algorithms, the repetitive emoji in a tweet have only been coded once in the construction process of the transaction data. Emoji repetitions can emphasize the corresponding emotions and semantics of social media content (Pereira & Pestana, 2022). Thus, one potential extension of this work would be to incorporate other factors appearing together in the same social media content, in addition to the text and emoji. Lastly, another extension to explore in future studies is the high-level classification of emoji, such as emotion-related and entity-related emoji, to be converted into transaction data with topics.
Footnotes
Declaration of Conflicting Interests
The author(s) declared no potential conflicts of interest with respect to the research, authorship, and/or publication of this article.
Funding
The author(s) disclosed receipt of the following financial support for the research, authorship, and/or publication of this article: This work was supported by Zhejiang Provincial Philosophy and Social Sciences Planning Project (No. 24NDJC308YBMS), the Zhejiang Provincial Natural Science Foundation of China (No. LQ24G020002), the Fundamental Research Funds for the Provincial Universities of Zhejiang (No. XT202306), Zhejiang Gongshang University “Digital+” Disciplinary Construction Management Project (No. SZJ2022B006), Research Start-up Foundation for Introduced Talents of Zhejiang Gongshang University (No. 1040XJ2322029).
Author Biographies
![]() .
.