
Abstract
This paper undertakes an exploration of how the diversification of tourism markets and activities exerts its influence on economic growth, particularly in New Zealand. By employing a dynamic autoregressive distributed lag method, this study uncovers the interplay between tourism diversification and economic growth dynamics in New Zealand. Empirical results show that it is only the diversification of European markets that generated positive economic growth. However, the diversification of tourism activities emerges as a potent driver of favorable economic expansion. The evidence suggests that a strategic emphasis on augmenting tourism diversification from European markets holds the potential to magnify the positive economic impact of the tourism sector. Additionally, the proposition of enhancing diversification in tourism activities emerges as a key avenue for bolstering New Zealand’s economic growth prospects. This study bridges a gap in the existing literature and furnishes policymakers with insights on how to harness the potential of tourism diversification.
Keywords
Introduction
While the early stage of economic growth literature has extensively focused on the importance of capital and labor; later researchers have paid attention to the role of other economic factors such as research and development activities, government intervention, human capital accumulation, and international trade (Barro & Sala-i-Martin, 2003; Erdogan & Erdogan, 2023; Solow, 1956). Notably, following the introduction of the new international trade theories in the second part of the 20th century, the number of research has increased on international trade. Within this regard, an export-led growth strategy has become one of the essential development strategies, and global export volume has significantly mounted up since the 1970s (World Bank, 2022). While the export-led growth strategy was initially based on increasing the export volume of raw materials, intermediate goods, and manufactured goods, the picture changed by the beginning of the 2000s, with the service sector, particularly the tourism industry, assuming a transformative role in driving economic growth. In this regard, Morakabati et al. (2014) reported that 80% of the export volume consisted of primary goods in developing regions in the 1970s. However, the share of the service industry in exports has increased since the beginning of the 2000s. United Nations Conference on Trade and Development (2022) reported that service export solely constitutes 22.6% of total world trade. Therefore, the composition of world trade has swiftly evolved in recent years, and the tourism industry has been considered one of the vital service industries for economies.
The surge in global mobility, spurred by globalization, has propelled tourism into the limelight, rendering it a pivotal driver of economic performance in recent times. Undoubtedly, a significant portion of research has delved into the realm of tourism, along with its associated facets, within the context of international trade (Parrilla et al., 2007). As the boundaries between nations blur in the wake of globalization, the movement of people for leisure, exploration, and cultural immersion has transcended mere travel to become a dynamic economic force. This acknowledgment underscores the significant shift in perceiving tourism not solely as a recreational pursuit but as a strategic export that bolsters economic growth, fosters cultural exchange, and cultivates cross-border connections (Ulucak et al., 2020). Therefore, an increase in tourism revenues can help increase the foreign exchange earnings of an economy, create new jobs in the tourism industry, encourage new tourism infrastructure investments, and boost tax revenues, which in turn promote economic development and increase welfare in a given country. Tourism revenues are particularly important in countries suffering current account deficits (Can & Gozgor, 2018).
Enhancing the economic impact of the tourism sector can be effectively facilitated through the strategic diversification of tourism markets. This approach not only expands the spectrum of tourism sources but also acts as a buffer against the volatility in tourist arrivals and associated revenues. By broadening the range of markets, tourism diversification serves as a resilient strategy, countering the sway of shifting consumer preferences and safeguarding against non-economic external shocks—ranging from geopolitical tensions to instances of terrorism—that might otherwise impede the steady flow of tourists and revenues (Peng et al., 2023; Yap et al., 2023). It also minimizes the effects of economic depressions and adverse income shocks on the tourism revenues of a host country, stabilizes foreign exchange earnings, and promotes tourism infrastructure investments and capital formation. Further, tourism diversification can have a multiplier effect on the demand level of other produced goods and services in various industries, such as agriculture, transport, health, entertainment, information, and communication. Therefore, the diversification of tourism activities has a vital significance in an economy. Morakabati et al. (2014) emphasized that tourism diversification can significantly reduce the share of natural resources in the export composition of resource-rich countries. Thus, it can help reduce the negative effect of decreasing aggregate demand during a recession. This not only shields them from sudden fluctuations in demand but also safeguards against the ripple effects of external crises that could otherwise cripple a mono-dimensional tourism industry. Diversification empowers nations to not only maximize their economic gains but also harness the enriching potential of cross-cultural exchanges and diplomatic relationships, fostering a dynamic and resilient tourism ecosystem that flourishes in the face of uncertainty.
The tourism sector has historically been considered a significant alternative for diversifying economic activities, reducing regional disparities, and enhancing economic development in New Zealand (Oppermann, 1994). The tourism sector plays a key role in generating new jobs and export revenues, and the country can benefit from the diversification of its tourism markets. The tourism sector has grown faster than the overall economy in the country in recent years (Ministry of Business, Innovation & Employment, 2022). The share of international tourism revenues has increased from 18.8% to over 20% in 2020. In this regard, more than one of five US$ export earnings is generated by the tourism industry in New Zealand in 2020. Besides, the tourism industry is one of the most productive industries in New Zealand, and the daily spendings of international tourists are average three times higher than residents. The tourism industry creates more than 50% of the food and beverage sector’s income in some regions such as Taupo, and international tourism creates almost 50% of total tourism revenues. In this regard, international tourism is the country’s biggest export earner; and every 42 international tourism arrivals creates one job in New Zealand. Thus, the tourism industry accounts for the direct employment of 230,000 people (which translates into 8.4% of total employment); and is responsible for goods and services tax proceeds worth NZ$3.8 billion in 2019 (Organization for Economic Cooperation and Development, 2020; Tourism New Zealand, 2020, 2023; World Bank, 2022). Tourism directly accounted for 5.8% of Gross Value Added (GVA) in New Zealand worth NZ$16.2 billion in 2019. 1 An additional (or indirect value added of) NZ$11.2 billion was generated from industries supporting tourism (Organization for Economic Cooperation and Development, 2020). The international student expenditure (studying less than was more than NZ$4.1 billion between April 2019 and March 2020 (Ministry of Business, Innovation & Employment, 2022). However, New Zealand’s tourism industry is heavily reliant on visitors from a few key markets, such as Australia, China, and the United States. This over-reliance on a single market makes the industry vulnerable to changes in visitor numbers and spending patterns. Concurrently, such a tourism composition refers that New Zealand still has a space to increase tourism activities, revenues and its competition power by benefiting tourism diversification strategy. Besides, New Zealand’s tourism industry experiences significant seasonal fluctuations, with the peak season occurring during the summer months (Tourism New Zealand Annual Report, 2021). This can lead to overcrowding in certain areas and underutilization of resources in other areas. Therefore, diversifying New Zealand’s tourism offerings can help the country establish stable tourism earnings that increase economic growth, through the development of new industries and the creation of new jobs. Hence, there is a need to diversify the tourism markets in order to attract more tourists especially tourists from the developed countries who have the capability of affording goods and services sold in New Zealand. However, increasing tourism activities from different markets for various purposes may not always increase economic performance and is not costless. The unintended consequences of tourism could occur by diversification such as environmental pollution, increasing travel costs, rising housing prices, social unrest, etc. (Akadiri et al., 2019; Fahimi et al., 2018). Therefore, to avoid the dilemma of economic growth and mentioned unintended consequences of increasing tourism activities, there is a need to shape an optimal tourism diversification strategy in New Zealand. To do this, which tourism markets and activities boost economic performance in New Zealand must be investigated.
The present study aims to investigate whether there is a significant contribution of tourism diversification to economic growth in New Zealand by using a new tourism diversification indicator in New Zealand within the Solow growth model structure. To the best of our knowledge, very few papers have considered the economic impact of diversification of tourism markets and none of the previous papers has examined the economic benefits of diversification tourism activities. Understanding how tourism diversification affects economic performance by considering market and activity types may provide key inputs for policymakers to form future tourism diversification strategies and optimize interactions between tourism, economic performance, and consequences of tourism diversification. Understanding the contribution of tourism from different markets and purposes help decision-makers of New Zealand to determine the markets, which should be focused on and shape market- and activity-based tourism diversification strategies, which can help to increase the competitive power of New Zealand in tourism. In addition, understanding the effects of tourism diversification may help to increase the efficiency of tourism development policies and the optimal distribution of resources allocated for the tourism sector. Also, a novel Dynamic Autoregressive Distributed Lag (DARDL) method has been used in the examination of the tourism diversification-economic growth nexus. The use of the DARDL method allows us to extract the dynamic effect of possible tourism diversification shocks on economic growth, thus may help to predict the potential pathway of economic growth after a tourism diversification shock. Therefore, this paper combines three distinctive contributions to the existing body of knowledge; subject, sample, and method.
The remaining parts of the study are arranged in the following ways. Section 2 summarizes the literature. Section 3 covers the method, data, variables, and methodologies employed in this study. The empirical results can be found in section four. The discussion findings from the data analysis are presented in section five, and section six concludes the paper with policy recommendations.
Literature Review
The importance of tourism activities on economic performance has promoted the establishment of a research area that can be examined under four hypotheses (Tugcu, 2014). The first hypothesis asserts the positive effect of tourism on economic growth performance, and this argument is called the “tourism-led growth hypothesis (TLGH),” while the second hypothesis is called the “growth-led tourism hypothesis (conservation hypothesis).” In this regard, the first hypothesis indicates that an increase in tourism activities and the extension of the tourism industry can increase the economic growth and welfare of a country (see Adedoyin et al., 2021; Durbarry, 2004; Paramati et al., 2017; Romão, 2020; Sequeira & Maçãs Nunes, 2008) while the second one asserts that an increase in economic growth level may help develop the economy’s tourism industry and activities (see Işik et al., 2017; Payne & Mervar, 2010). The third hypothesis can be called the “feedback hypothesis.” The validity of the feedback hypothesis confirms the existence of a bidirectional relationship exists between tourism and growth (see Bilen et al., 2017; Dogru & Bulut, 2018; Pulido-Fernández & Cárdenas-García, 2021). The fourth hypothesis can be called as “neutrality hypothesis,” which refers to the non-existence of a statistically significant relationship between tourism and economic growth (see Akadiri et al., 2020; Eyuboglu & Eyuboglu, 2020; Katircioglu, 2009; Wu & Wu, 2020). It should be noted that empirical results may vary from country to country based on their economic structure, development stage, income level, and socioeconomic conditions, as well as different methodological examinations.
Despite the vital role of tourism in economic development, researchers have paid less attention to investigating the tourism dynamics in New Zealand. A great body of empirical research has been established on the effect of tourism activities on economic performance. Some prominent researchers have focused on examining the dynamics of the tourism industry (see Lin et al., 2019; Ozcan & Erdogan, 2017; Pizzuto & Sciortino, 2021; Solarin, 2018), while a great part of the researchers have aimed to investigate the effect of tourism on economic growth (Table 1). The main features of the existing literature on tourism-economic growth can be summarized. First, a great part of the earlier studies has focused on the impact of tourism revenues and receipts on economic growth. However, because of being correlated with the gross domestic product (GDP) level, researchers have emphasized that the use of either tourism revenues or receipts may cause biased estimations and inferences (Gunduz & Hatemi-J, 2005). Second, researchers have employed the number of tourist and international tourist arrivals as a proxy for tourism to prevent biased estimates. Third, a significant part of the existing literature has focused on the effect of tourism on economic growth, yet the impact of diversification on economic performance was largely ignored in the literature, and limited papers exist in regards to the research subject.
List of Papers on the Effect of Tourism on Economic Growth.
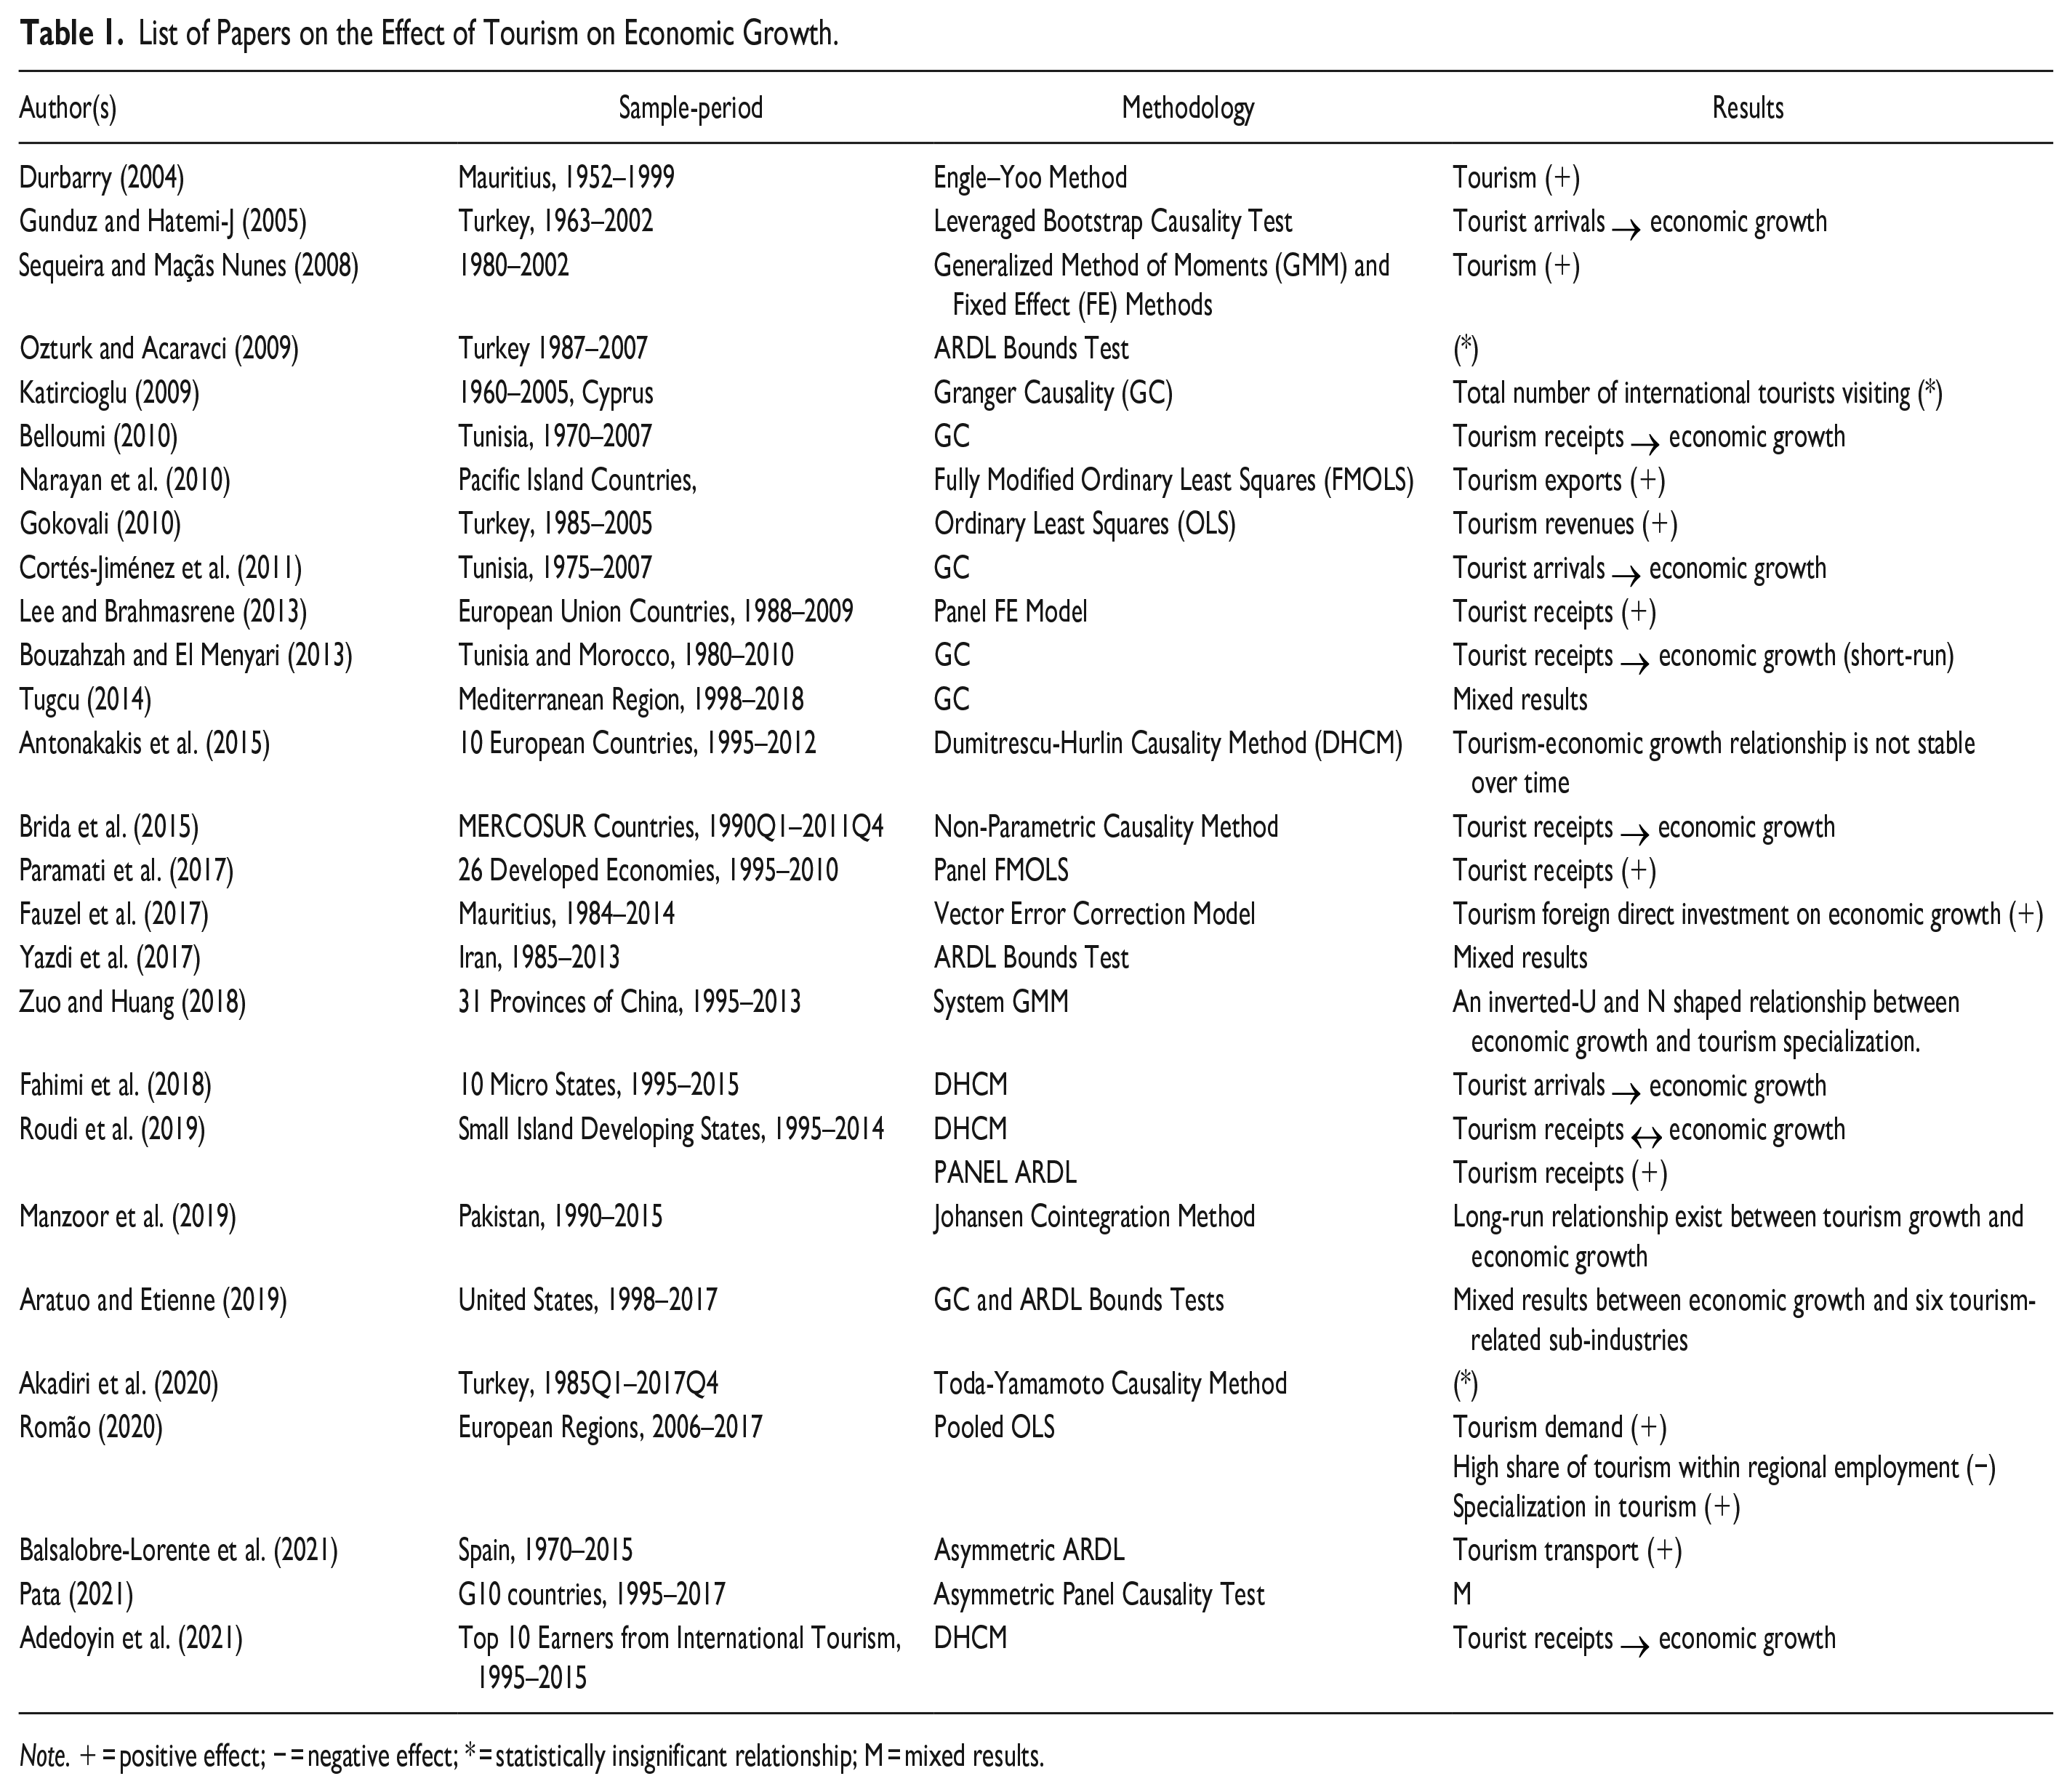
Note. + = positive effect; − = negative effect; * = statistically insignificant relationship; M = mixed results.
For instance, Can and Gozgor (2018) examined tourism diversification and economic growth in eight European and North African countries from 1995 to 2014 by conducting individual and panel Granger causality methods. They concluded that there is a causal effect running from market diversification to economic growth in Egypt and Greece. In addition, they revealed that there is a causal effect running from economic growth to market diversification in Turkey, Morocco, and France. Last, they emphasized the existence of bidirectional causality in Spain, Italy, and Tunisia. Saboori et al. (2022) investigated the economic impact of tourism market diversification in 109 economies from 1995 to 2018. Utilizing a quantile regression approach, the empirical findings suggest that tourism market diversification has a positive impact on economic growth, especially in countries with lower levels of economic growth. Yap et al. (2023) used a generalized method-of-moments technique to demonstrate that tourism market diversification has a positive effect on the inbound tourism flow of Qatar in the period 2006 to 2019. Using generalized methods of the moment, Peng et al. (2023) explored the role of diversification for 75 countries for the period 1995 to 2018 and they found that tourism market diversification surges economic growth.
In the broader context, the intricate concept of tourism diversification has remained largely unexplored within the existing literature. Notably, despite the pivotal role played by the tourism industry in New Zealand, prior research has not delved into the potential influence of tourism diversification on the nation’s economic growth. This study fills this crucial gap by embarking on a comprehensive examination of how tourism diversification intricately interacts with and shapes economic growth in New Zealand. The research unfolds by encompassing visitors from diverse origins, purposes, and segmented markets. In essence, the study’s fundamental objective lies in thoroughly investigating the nexus between tourism diversification and economic growth within the New Zealand context. Moreover, this research adds a theoretical layer to the discourse, deepening the understanding of the interplay between tourism diversification and growth through the utilization of a Solow growth model framework. Empirical substantiation is provided through dynamic estimation tools, as detailed in the subsequent section. By doing so, the present study aims to contribute to fill the existing gap in the literature.
Methodology
Modeling Approach
In order to investigate how tourism diversification affects the per capita income level which is an indicator of the wealth of a nation, the current study uses a traditional Solow model specification following Mankiw et al. (1992) and Tang and Tan (2015). According to the traditional Solow model, a Cobb-Douglas production function can be used to evaluate changes in output over time. A specification of such a model is as follows:

where Y is the output, t is the time dimension. K or capital and L or labor are the main inputs and the suppliers of these factors of production are rewarded based on the marginal products of these factors. A is the level of technology,


Effective labor, which is AL, is assumed to grow at g + n. A fixed portion of the output, s, is assumed to be invested. If k is defined as capital stock per effective labor unit and y is defined as output level per effective labor unit, k can be determined through:

where
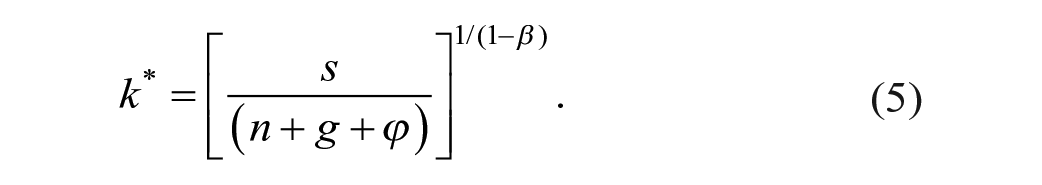
Hence, it is shown that while the rate of saving is positively associated with the steady-state capital-labor ratio, the population growth rate is negatively associated with the ratio. Assuming that K/Y is the fraction of Y invested and dropping
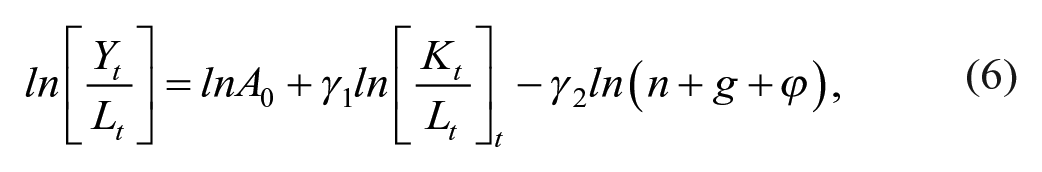
where
y is output per labor (or per capita), k is capital stock per labor (or per capita),
Deriving the Tourism Diversification Index and Data
Can and Gozgor (2018) propose a diversification index, which is originally based on the Herfindahl-Hirschman export diversification index. In the calculation, they simply use tourist arrivals instead of export in Equation 8.
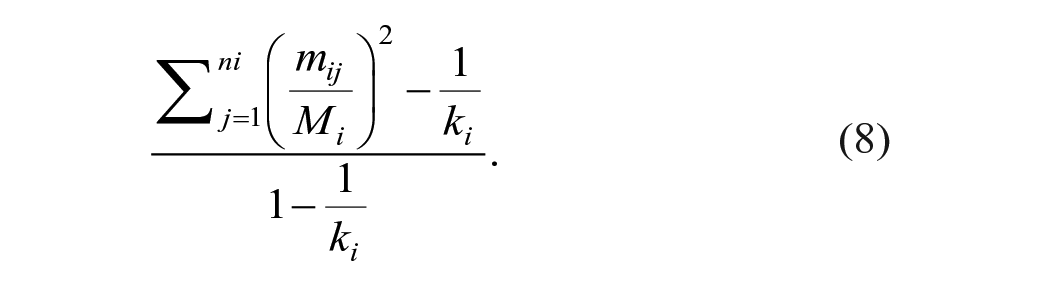
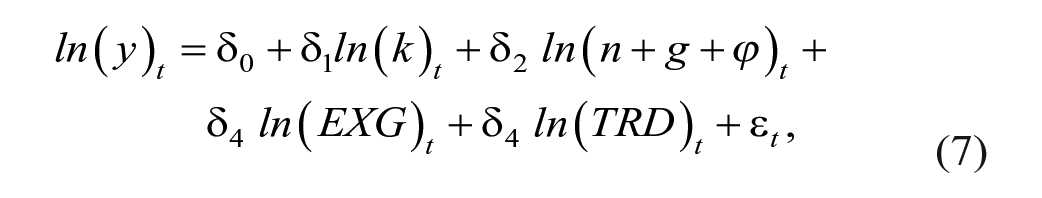
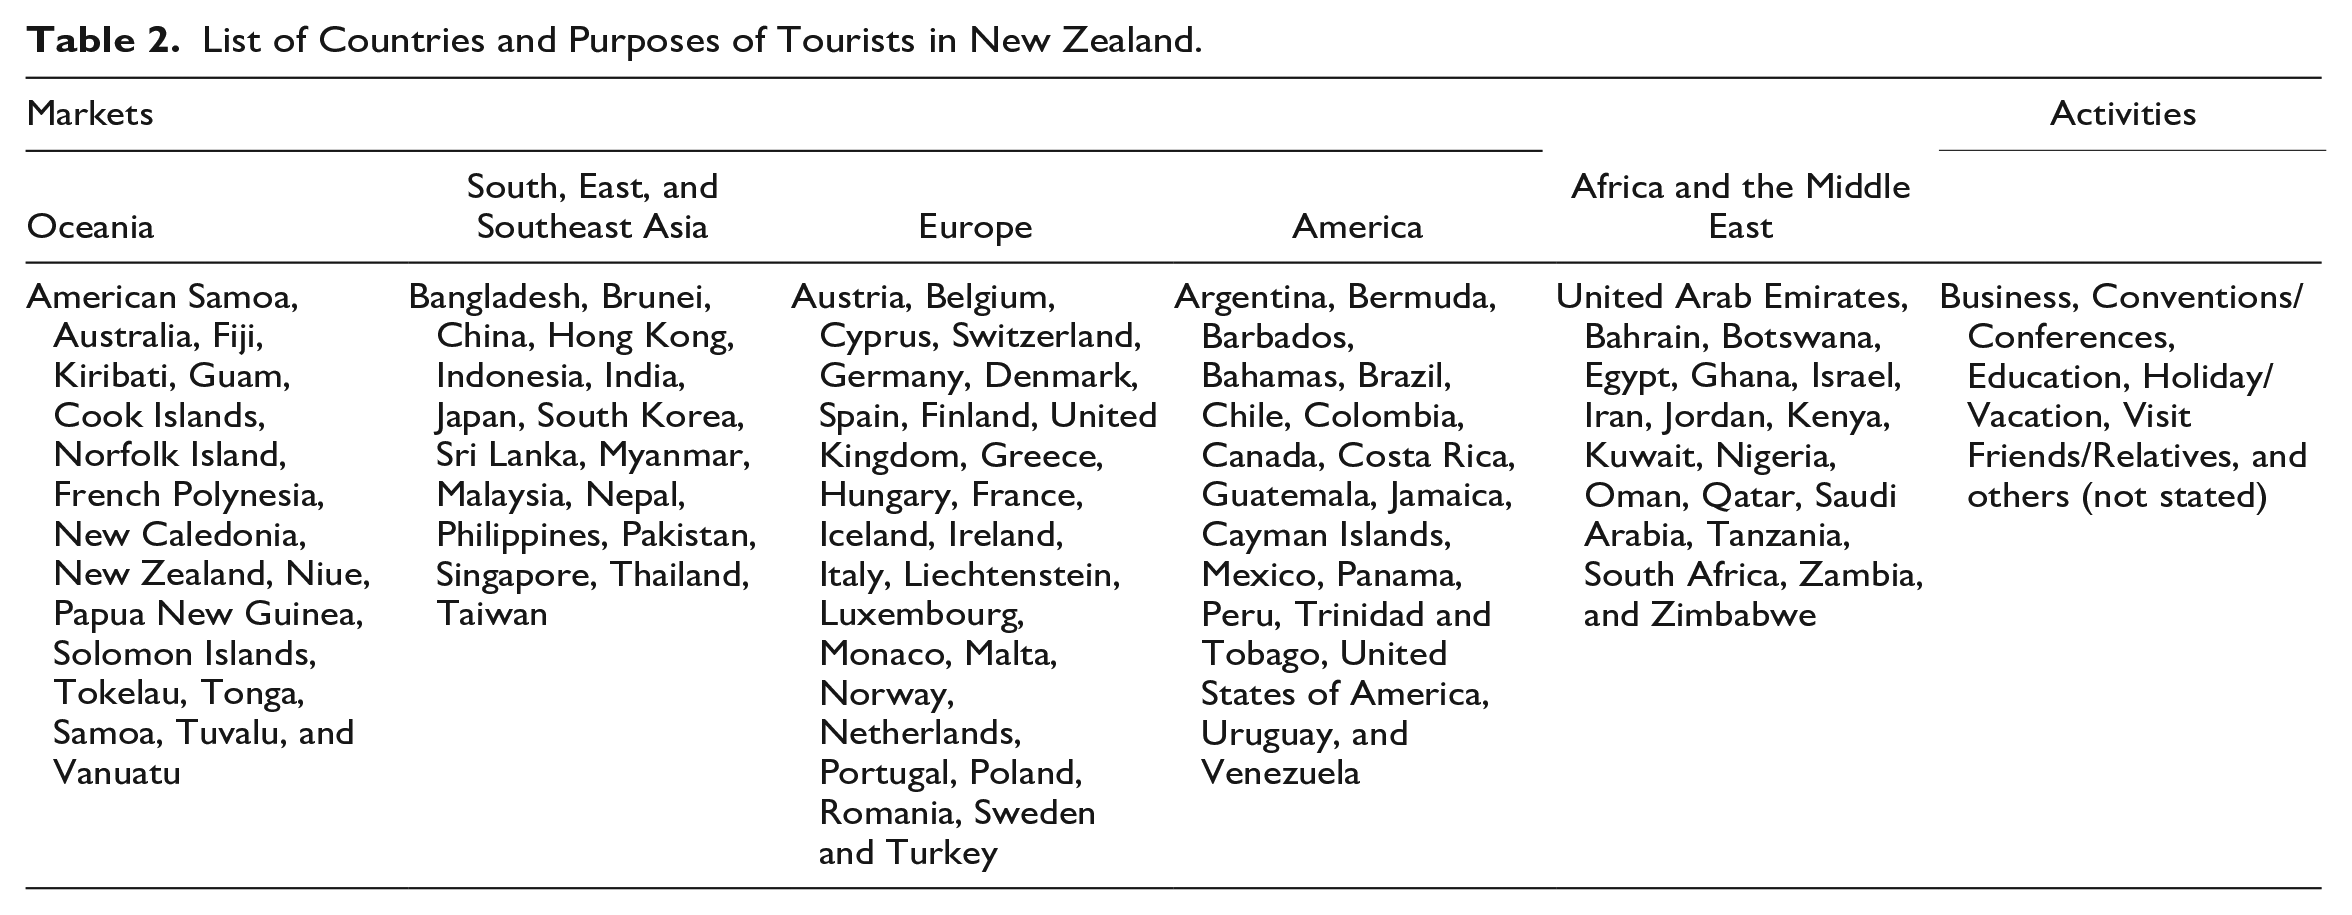
Where M is the total number of visitors to country i, m is the number of visitors coming from country j to country i, and k is the number of partner countries. The index bear values starting from 0 to 1. A host country which welcomes tourists from very few countries (or offer limited tourism activities) will have an index close to 1 (Can & Gozgor, 2018). By using Equation 8, we calculated several diversification indicators for New Zealand. For instance, we first calculated an overall diversification index from all visitors from 98 different markets. Then we calculated it for visitors from Oceania (18 markets), from South, East, and Southeast Asia (17 markets), from Europe (25 markets), from America (19 markets), and from Africa and the Middle East (19 markets). The selection of these markets is premised on the basis that they have at least a visitor into the country in each year of the analysis period. Finally, we calculated an index by considering visiting purposes of all arrivals. Therefore, there are seven models in which only the TRD is expressed as TRD1, TRD2, TRD3, TRD4, TRD5, TRD6, and TRD7 in each of the equations as follows:
a.
b.
c.
d.
e.
f.
g.
To estimate Equation 7 for the first six models (Model1. . .Model6), annual data covering the 1979 to 2019 period is used, which equals to 41 observations. However, the time dimension of Model 7 is limited to 1987 to 2019 because of data unavailability for visitors by purpose. The source markets as well as activities are presented in Table 2. In Figure 1, the diversification trend in the tourism industry of New Zealand is displayed and it is demonstrated that diversification in European markets has expanded the most among all the markets in the latest years. The tourism data has been collected from International Travel and Migration—ITM of the Stats NZ Tatauranga Aotearoa and the data for the other variables are sourced from the World Bank’ World Development Indicators. Consistent with Mankiw et al. (1992), we suppose that the rate of depreciation plus the growth rate of technology is 5%. Real GDP per capita, per capita real gross fixed capital formation, and per capita real exports (in 2010 US dollar prices) are premised on market.
List of Countries and Purposes of Tourists in New Zealand.
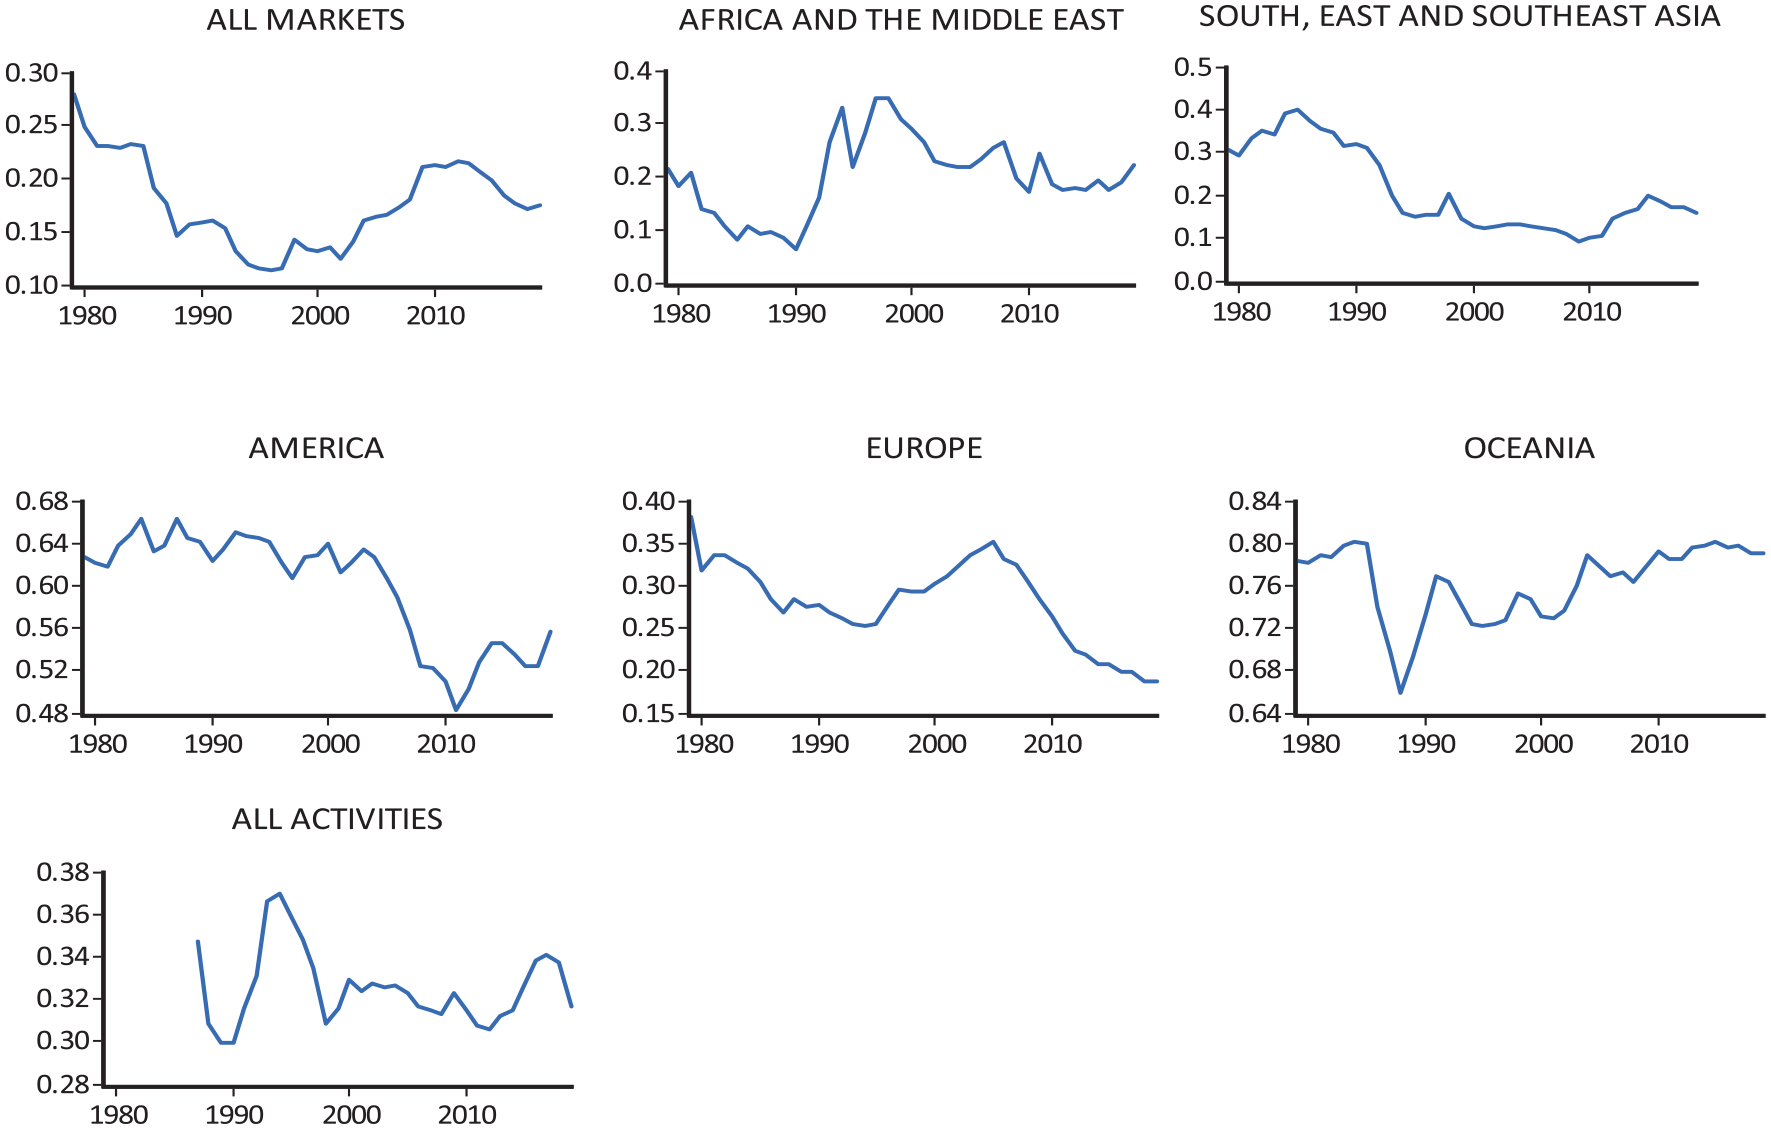
Diversification of tourism markets and activities, 1979 to 2019.
DARDL Method
Time-series estimations typically begin with unit root checks since the traditional ordinary least squares method requires stationary variables so that the estimation would not result in a spurious regression relationship. Then at least one possible cointegration relationship is investigated because most of the macroeconomic data follow a nonstationary path in the long run. Finally, long-run cointegration parameters are estimated using appropriate estimators which take specific model dynamics into account such as integration order of model variables, correlation among independent variables, serial correlation, and unstable variance for the estimation. One of the important special cases in time-series econometric investigations is that variables have different integration levels, that is, the existence of I(1) and I(0) variables in an econometric model (Kartal et al., 2023). To cope with such a case, a widely used method first introduced by Pesaran et al. (2001), then attracted great attention in applied economics and econometrics literature, is the autoregressive distributed lag (ARDL) approach. More recently, Jordan and Philips (2018) modified the ARDL approach with dynamic simulations, the so-called DARDL. In line with Jordan and Philips (2018), the estimation procedure is given in Equation 9.
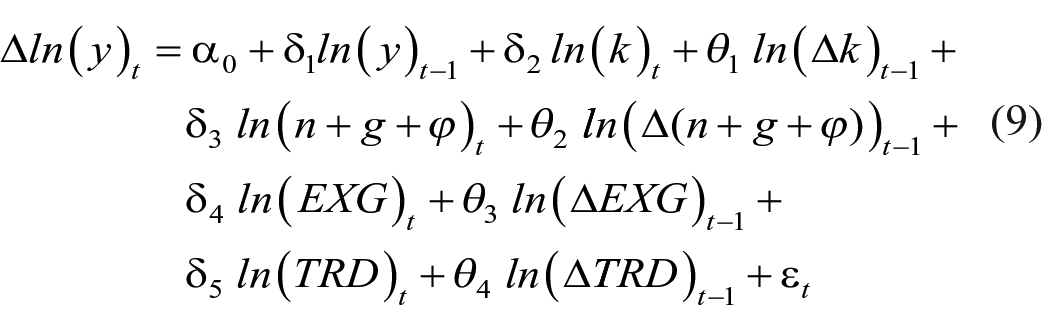
Equation 9 enables us to estimate the long-run (
Empirical Results
To check the stationary of each model variable, this study performed the test of Phillips and Perron (1988) or (PP), the test of Elliott et al. (1996) or (DF-GLS), and the test of Said and Dickey (1984; ADF) of unit root tests, whose results are shown in Table 3.
Stationary Check for Model Variables.
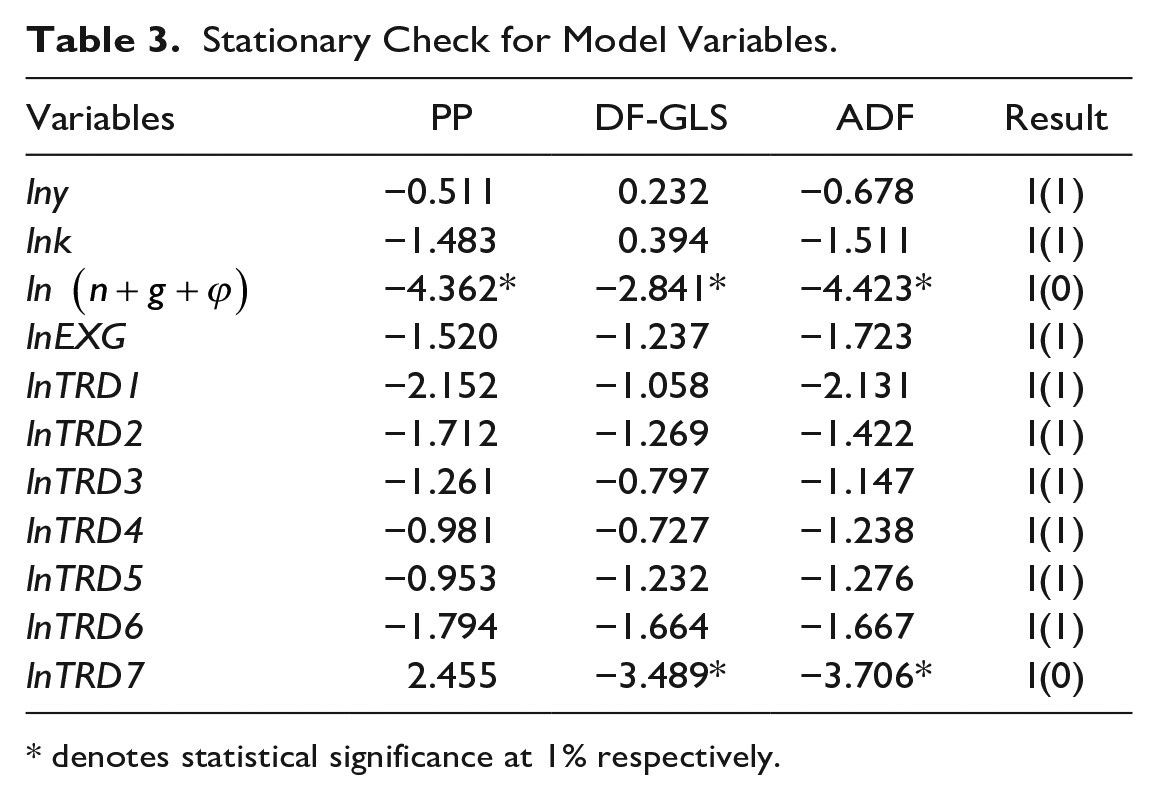
denotes statistical significance at 1% respectively.
According to the results of unit root tests, two variables have a stationary process at the level (I (0)). Of them, ln
The second step is to verify the long-run equilibrium relationship between the model variables before estimating model parameters. To this end, the Bound testing procedure was followed, and the results were presented in Table 4.
Cointegration Test Results.
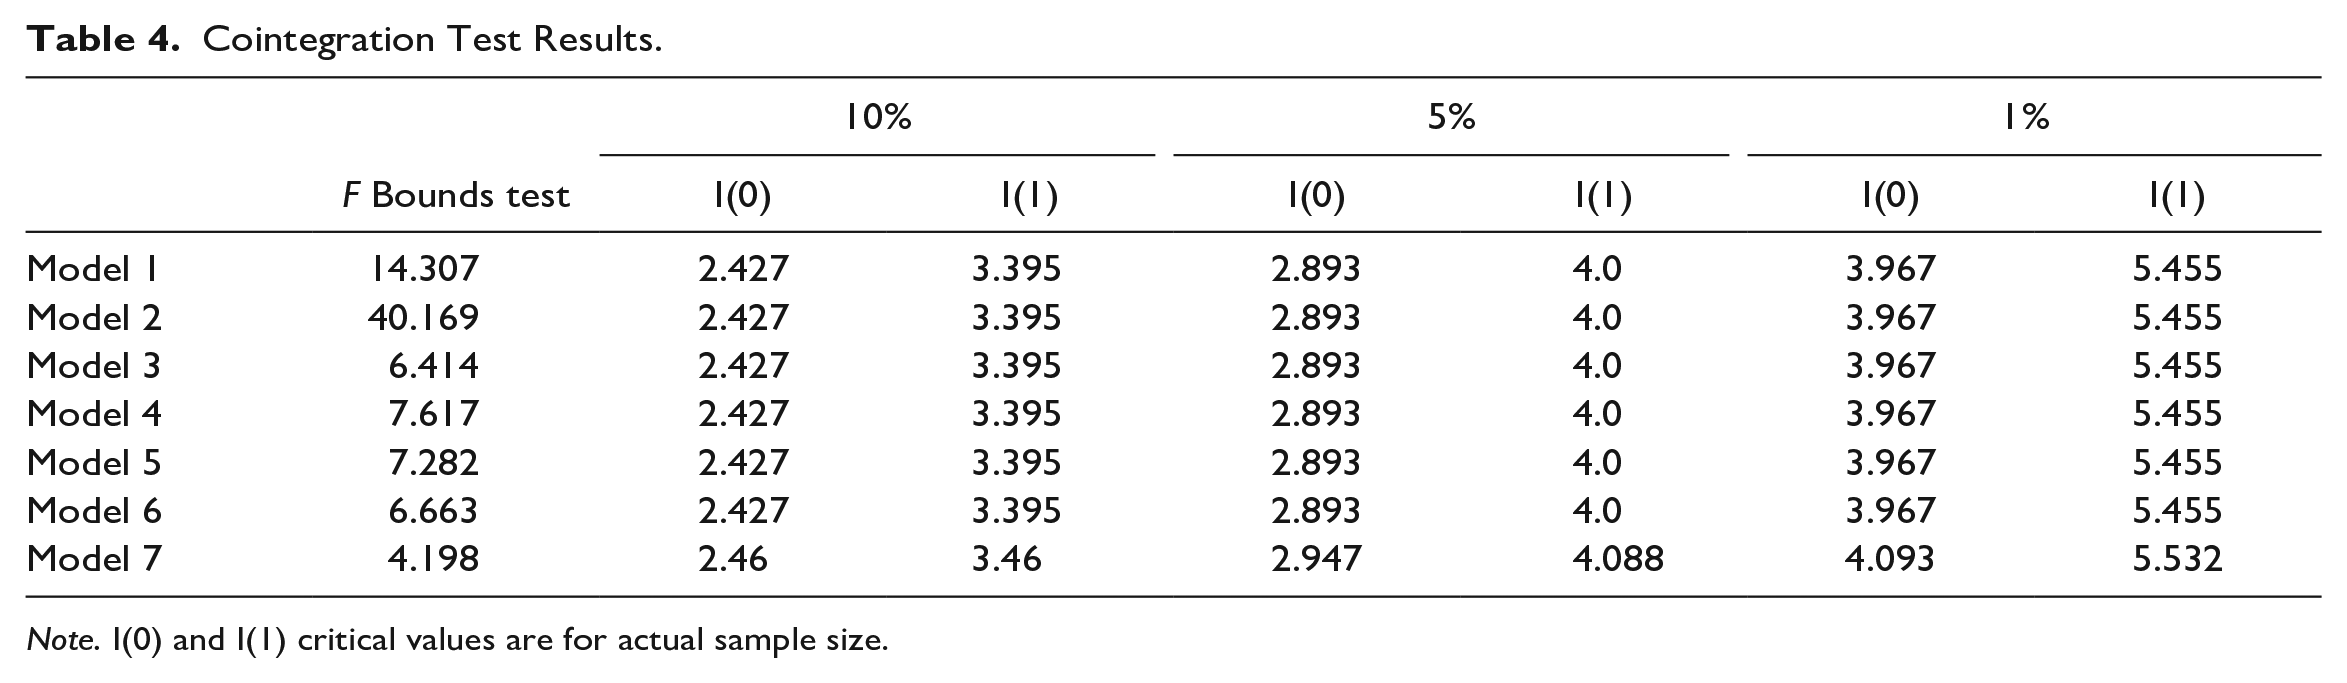
Note. I(0) and I(1) critical values are for actual sample size.
According to the results in Table 4, F statistics calculated for all models are higher than critical values in all confidence intervals except Model 7. However, Model 7 applies at a 95% confidence interval, which can be empirically accepted to reject the null hypothesis of no cointegration. Therefore, it is concluded that a long-run relationship between study variables holds for each model.
Having verified the cointegration relationship through the bound testing approach, we estimated seven models in which only the tourism variable is replaced that is, TRD1, TRD2,. . ., TRD7. Each model was specified according to optimal lags suggested by the Akaike information criterion. Based on the model selection, we estimated the coefficient in the structure of Equation 9. Accordingly,
ARDL Long-Run Coefficients.
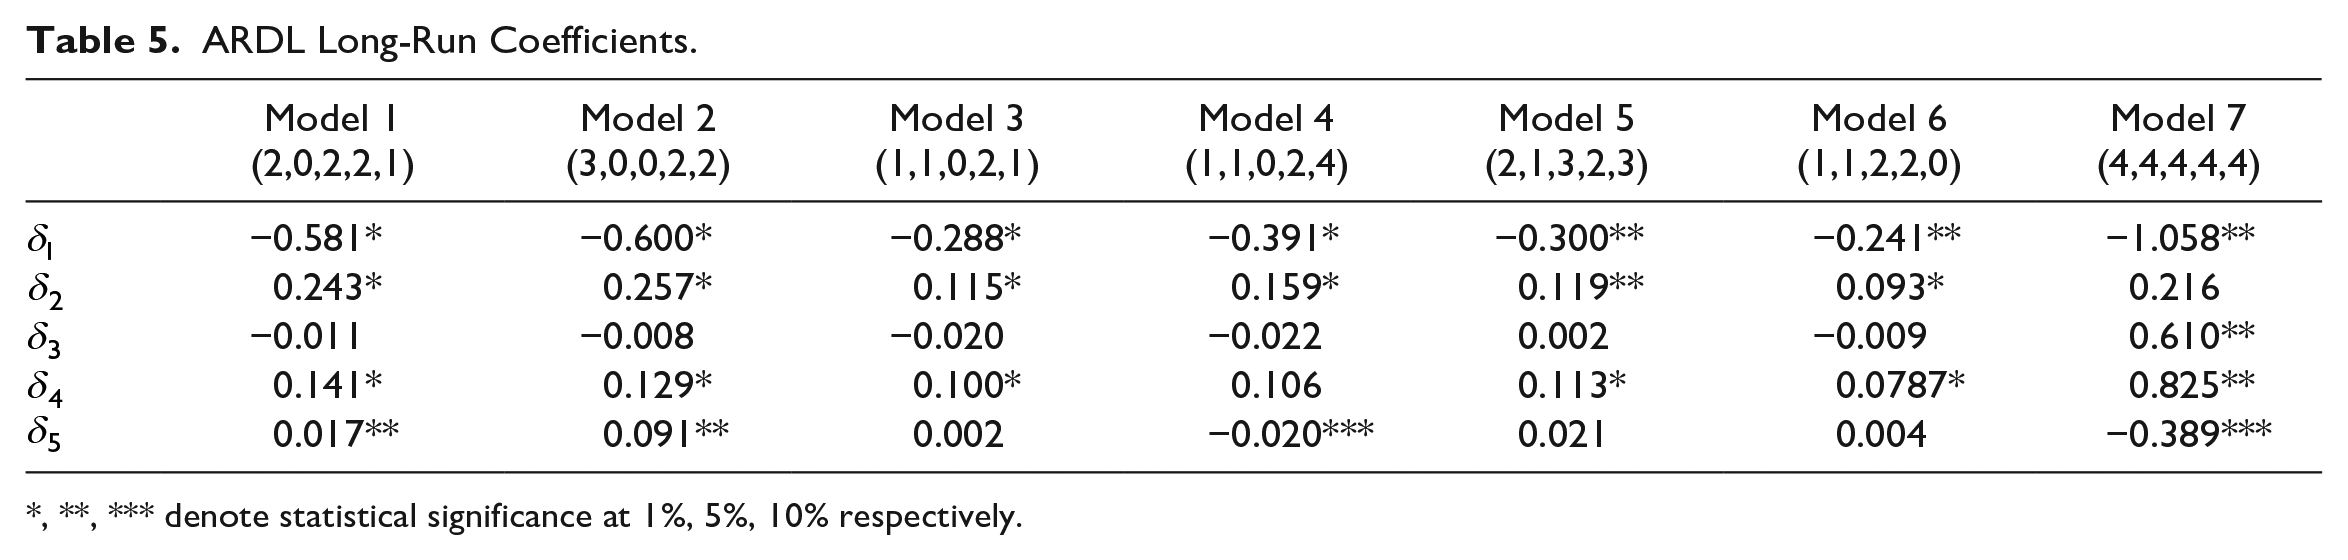
, **, *** denote statistical significance at 1%, 5%, 10% respectively.
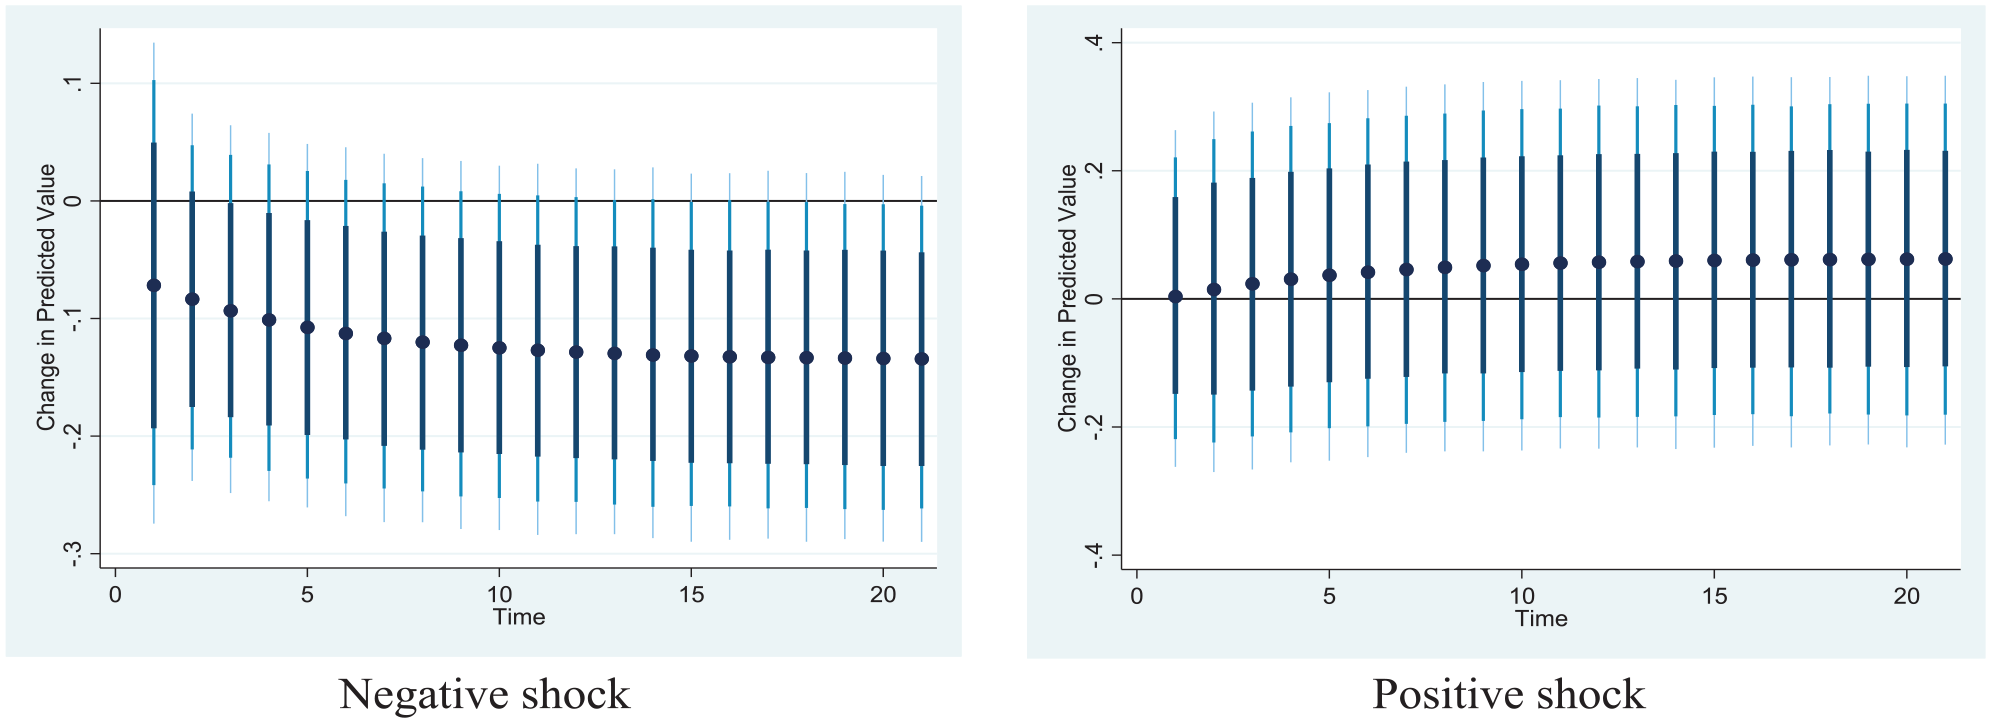
According to the results in Table 5, statistically significant results for tourism diversification were obtained for Model 1, Model 2, Model 4, and Model 7. Considering the calculation method of the tourism diversification index, a negative coefficient was expected for
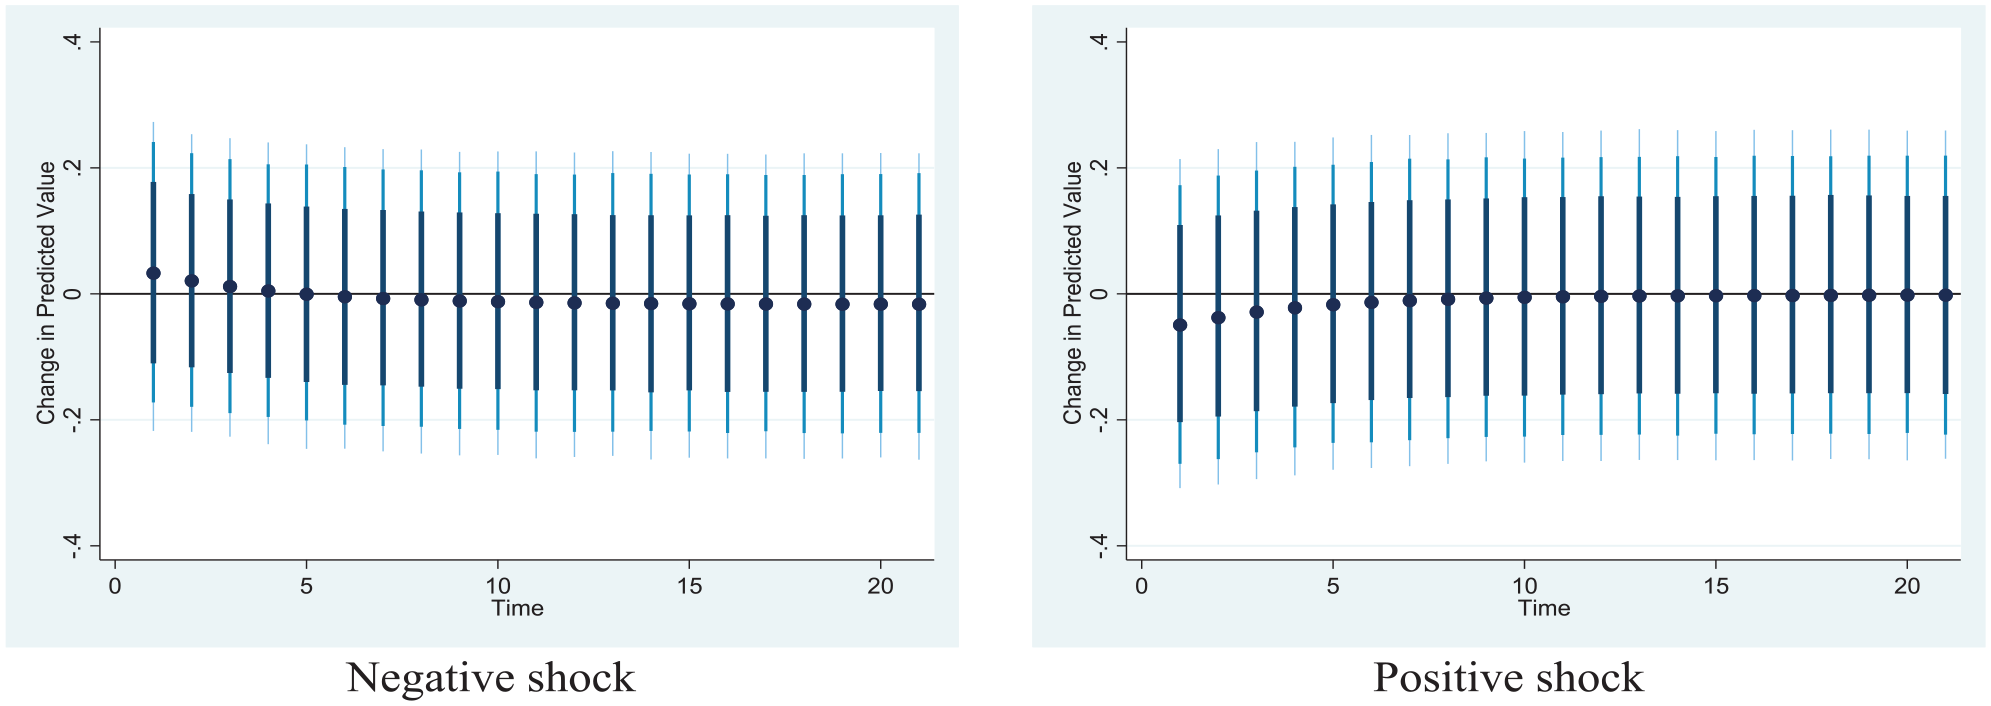
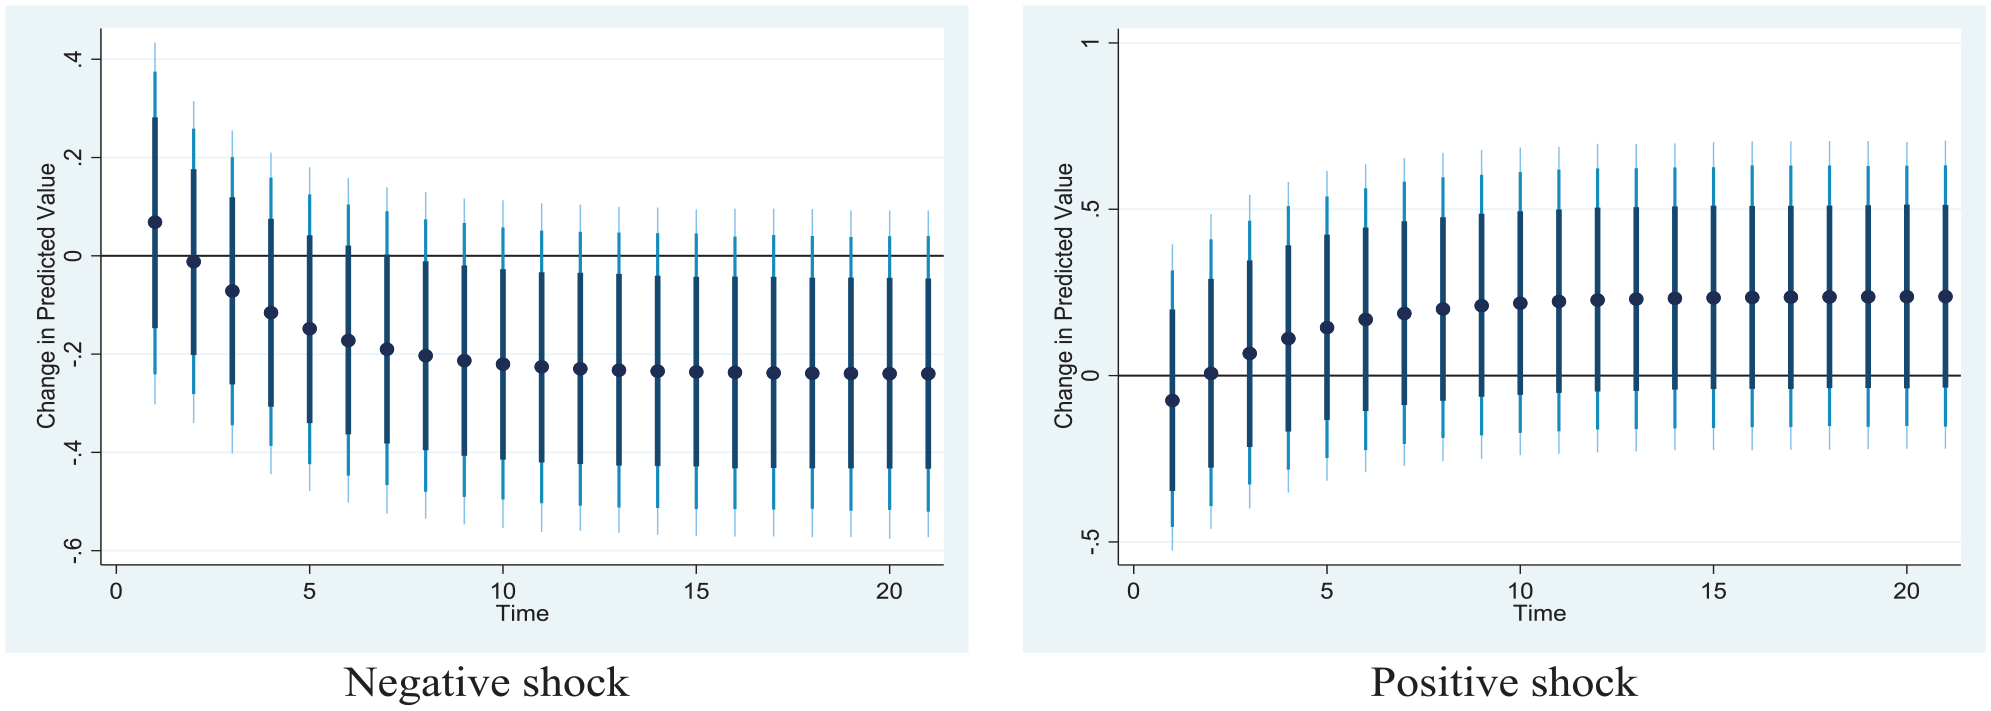
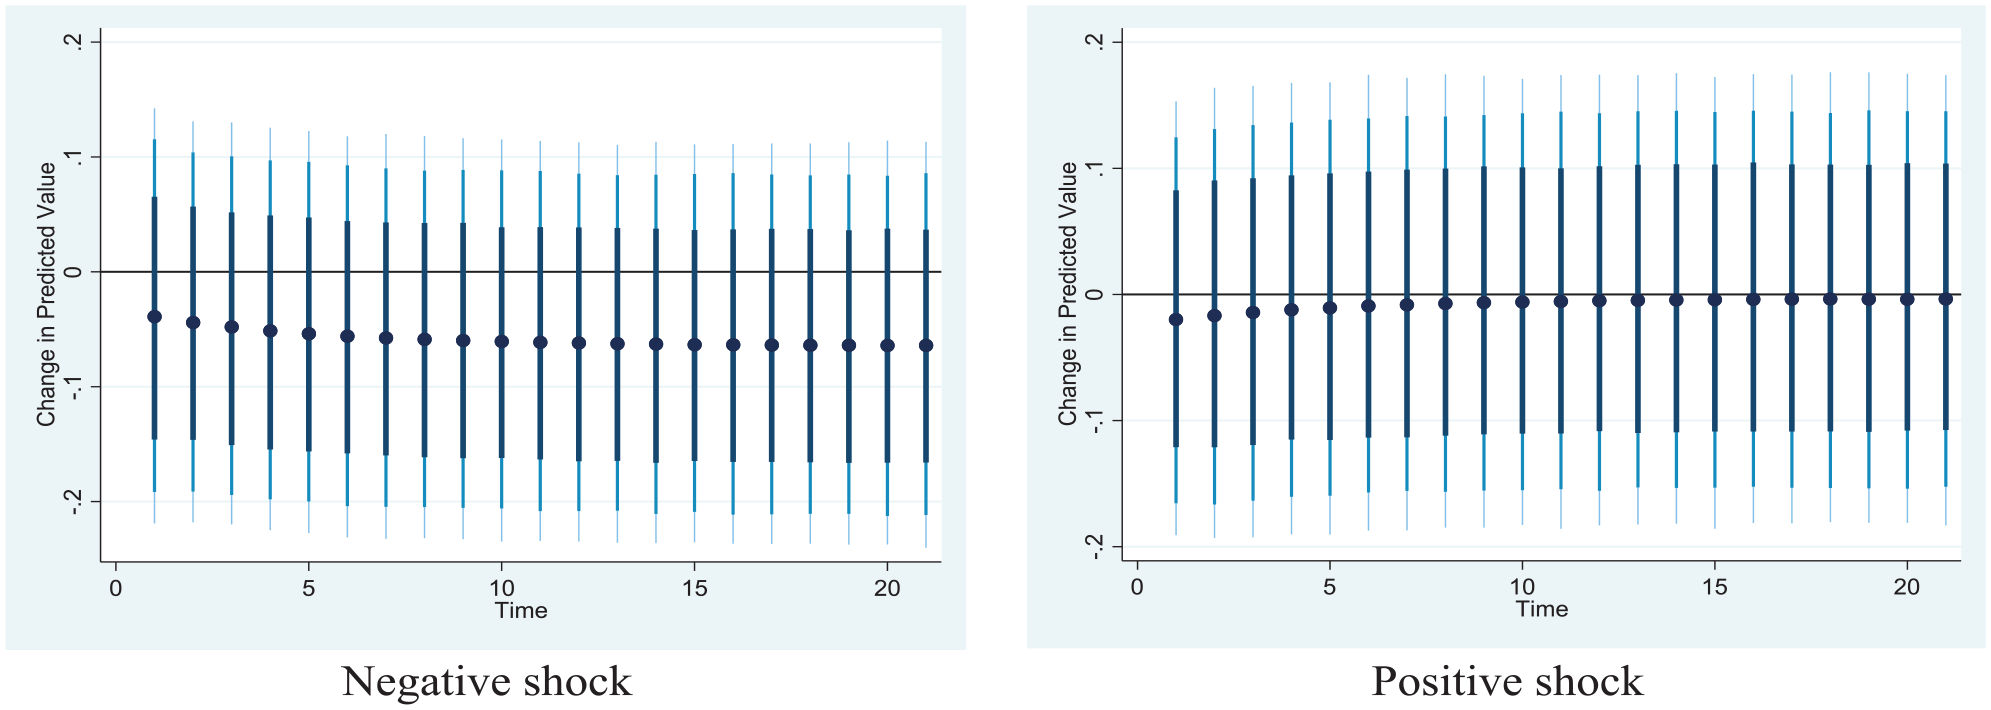
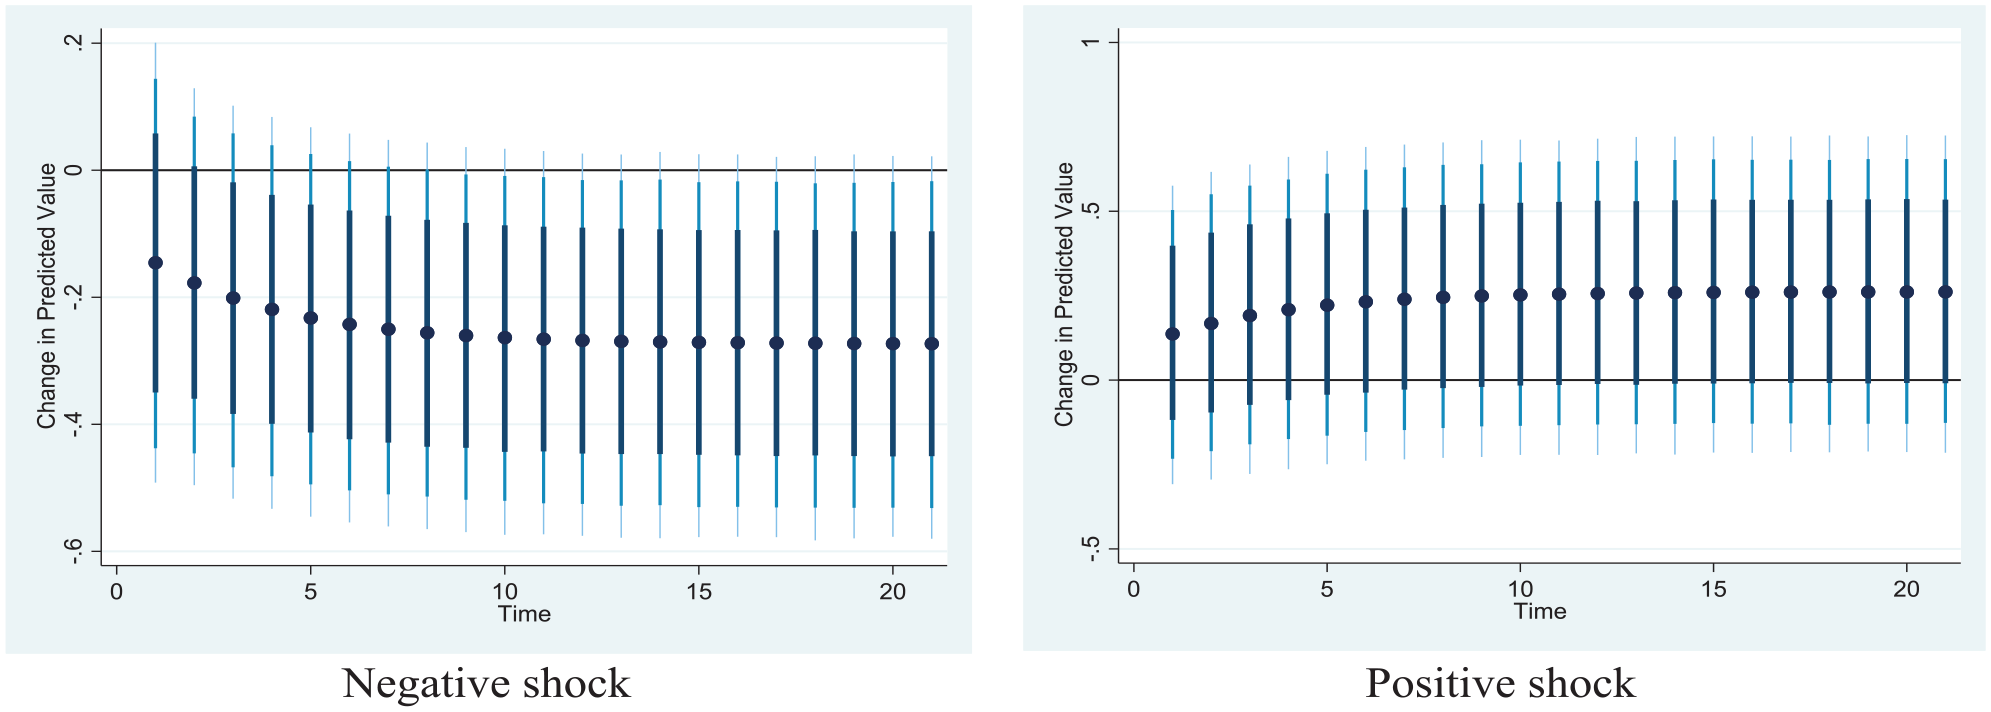
One of the most important outputs of the DARDL approach proposed by Jordan and Phillips is dynamic simulations showing the long-run impulse of any selected variable on the response variable. Therefore, the current study simulated how a negative or positive shock for tourism diversification significantly changes the predicted value of per capita income over time by applying the dynamic simulations of the suggested procedure. The number of simulations was set to 5.000 to create the following figures (Figures 2–8) for each model (Jordan & Phillips, 2018).
Change (±1%) in predicted value for per capita income for Model 1.
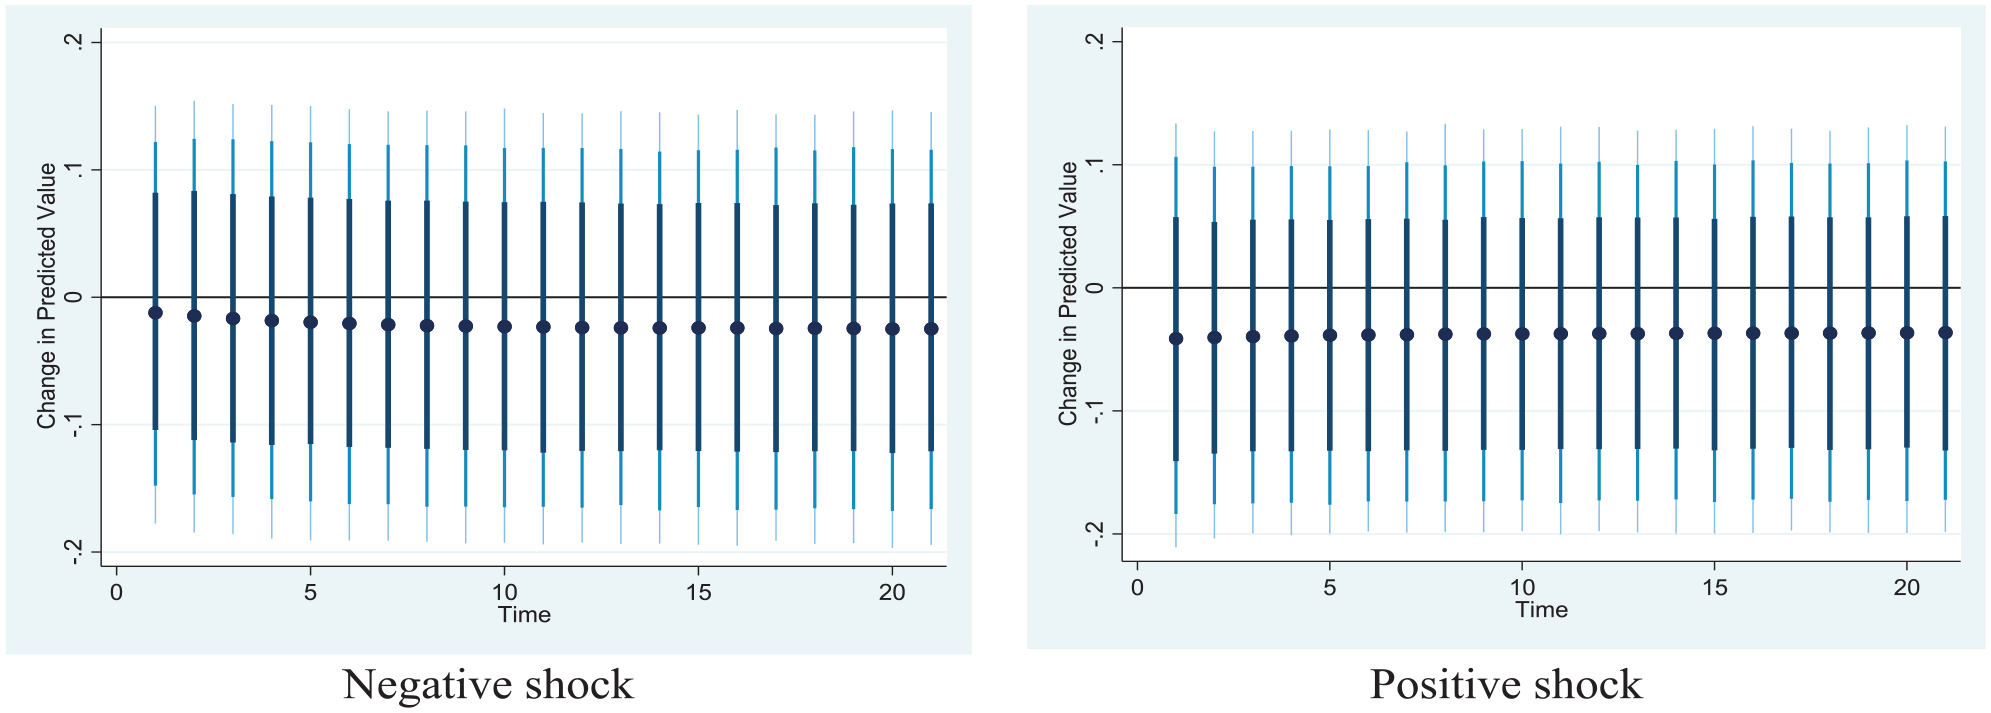
Change (±1%) in predicted value for per capita income for Model 2.
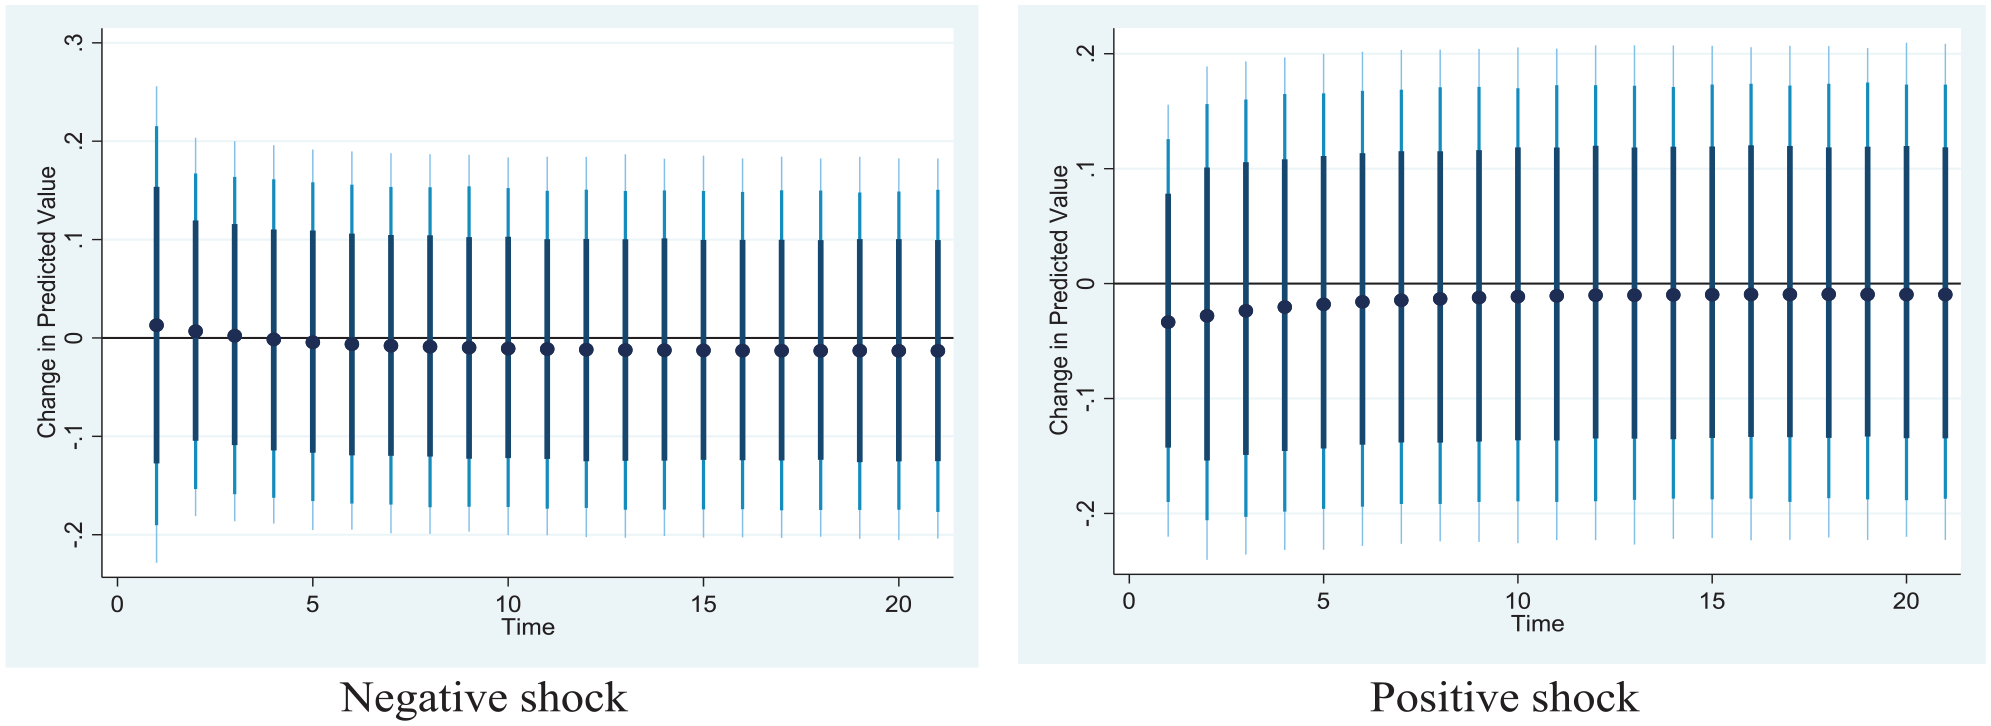
Change (±1%) in predicted value for per capita income for Model 3.
Change (±1%) in predicted value for per capita income for Model 4.
Change (±1%) in predicted value for per capita income for Model 5.
Change (±1%) in predicted value for per capita income for Model 6.
Change (±1%) in predicted value for per capita income for Model 7.
According to the DARDL simulation, there are varying impacts on GDP per capita for each model in case of positive or negative shocks to tourism diversification indexes calculated by considering the number of visitors incoming from different regions to New Zealand.
Figure 2 shows that a negative/positive shock has a negligible change in GDP per capita, and they disappear in the long run, which can depict an insignificant impact on tourism diversification in terms of Model 1. However, these changes do not fall into the prevailing confidence interval that makes them statistically significant. 2 On the other hand, negative shocks have an impact over the long run in Model 2, Model 5, and Model 7, although their significance levels are low. Accordingly, it can be concluded that negative shocks have a decreasing effect over the long run for Model 2, Model 5, and Model 7. The simulation results tend to suggest that the diversification of markets does not promote GDP in most cases.
Discussion of the Results
The ensuing empirical findings, which suggest that diversification of tourism markets does not generate greater GDP (except in the European markets), are partly in line with the findings of Can and Gozgor (2018), which could not provide support for tourism markets diversification promoting GDP in France, Morocco, and Turkey. The empirical findings of the diversification of tourism markets are not consistent with the notion of TLGH, except in the case of European markets. The results of the diversification of tourism activities are also consistent with the notion of TLGH. One of the rationales of the empirical findings is that marketing activities tend to focus on a few selected markets. For instance, the marketing activities of Tourism New Zealand (which is the country’s parastatal responsible for marketing tourism to the globe) are focused on high-value consumers in 15 key markets. The markets are Australia, China, the USA, Canada, the UK, and Germany. Others are Japan, South Korea, Singapore, Malaysia, India, Argentina, Brazil, Indonesia, and the Philippines. Each tourist is expected to spend about NZ$300 a day and would be ready to pay NZ$35 levied on international visitors arriving at airports (New Zealand Trade and Enterprise, 2020). Focusing on high-value visitors has several advantages, which include generating higher revenue per tourist, reduction of overtourism; reduction of the impact of tourists on the environment. However, focusing on high-value consumers is often detrimental to the likelihood of getting visitors from developing countries or low-income visitors. The goal of focusing on high-value consumers is against the objectives of diversification of the markets.
The results showing evidence for the success of diversification of the European markets can be attributed to the countries in the bloc being the most developed of all the blocs in the study. Loeb (1982) and Lim et al. (2008) emphasized that the per capita income and economic prosperity of the source country are one of the major determinants of travel decisions. According to the data provided by World Bank (2023), the average GDP per capita (PPP) level of the European region is 41,777.8 US$. According to the World Bank (2023); GDP per capita in European Union has reached an all-time high of33,961.76 US$ in 2022. If one compares regional incomes, the GDP per capita in the European countries was estimated at US$31,046 in 2020 (in 2015 prices), which is far higher than the figure for South Asia at US$1,745 in 2020 (in 2015 prices), and higher than the figure for the Middle East & North Africa at US$3,919 in 2020 (in 2015 prices) (World Bank, 2022). Therefore, tourism diversification from European markets can be achieved, and a high-income level can increase the purchasing power of individuals, which increases the number of foreign travelers from European markets. Another reason for the success of diversity in the European markets can be attributed to the rapid rise in the diversification of the European markets. In Figure 1, it is shown that diversification in the European markets has been the most rapid among all the markets analyzed in this paper. Latest statistics also show that European markets appear to be one of the most diversified markets. The United Kingdom, which is the largest market in Europe accounted for only 45% of the total arrivals from Europe into New Zealand in 2019. In the same year, Australia, which is the largest market in Oceania accounted for 90% of the total arrivals from Oceania. The United States, which is the largest market in America accounted for 73% of the total arrivals from America into New Zealand in 2019 (Ministry of Business, Innovation & Employment, 2022). Another reason for the results of European countries can be attributed to the number of European markets in our sample. There are 25 countries in the European sample. None of the other markets have up to 20 countries in their samples. Therefore, the inclusion of more countries in a sample might increase the success of the diversification of tourism markets.
A possible reason for the positive economic impact of tourism activities is the ability of the tourism sector in the country to offer a diverse offering to visitors. New Zealand’s advantage over other destination markets is that it provides tourists with diverse and rich offerings in a small geographical space (New Zealand Trade and Enterprise, 2020). There are several tourism activities available in the country including rugged west coast beaches, sub-tropical climate, and picturesque coastline. Another justification for the positive economic impact of tourism activities can be attributed to the continuous investment by the government of New Zealand to improve and diversify tourism activities. The government’s budget directly related to tourism for the 2019/20 financial year was NZ$227.1 million, with NZ$111.4 million allocated to Tourism New Zealand for marketing New Zealand as a visitor destination (Organization for Economic Cooperation and Development, 2020). The government has also invested about NZ$88 million in tourism on the West Coast of the South Island, as part of ensuring the region’s popular sites to have the capacity to continue to provide high-quality experiences for tourists (New Zealand Trade and Enterprise, 2020).
Conclusion and Policy Implications
The purpose of this study is to examine the economic effect of diversification on the tourism industry. Utilizing a recently introduced index of tourism diversification, the attention of this paper is on New Zealand. Departing from the past papers on the impact of diversification in the tourism sector that have merely concentrated on tourism market diversification, we have investigated the effect of tourism markets as well as activities. In many host nations such as New Zealand, tourism policies are aimed at increasing the tourism inflows from different source countries as well as improving inflows for different tourism activities. Using the DARDL method, the empirical findings indicate that diversification of tourism markets does not generate positive economic growth, except in the case of European markets. However, the diversification of tourism activities caused positive economic growth in the country.
An implication of the findings is that diversification of markets alone might not be sufficient to realize the benefits of diversification of the tourism industry. There is a need to also focus on the diversification of tourism activities in order to realize the economic benefits of diversification. In this regard, policymakers may consider focusing on paying specific attention to the European tourism markets that New Zealand has a low performance for having insights into reasons for weak performance. Understanding the travel patterns of European tourists can help New Zealand to diversification the number of European visitors. Moreover, the provision of appropriate travel options for the European markets can help New Zealand to yield tourism benefits on economic performance. Besides, tax discounts or exemptions for the European markets, in which New Zealand hosts fewer tourists, can relatively increase the disposable income of the tourists from those markets; thus, New Zealand could raise its popularity. In addition, New Zealand authorities may consider scheduling direct charter flights from the European markets to provide relatively cheap travel options for European tourists by benefiting from economies of scale, to reduce long travel time and stress for the tourists. Hence, the popularity, travel, and tourism revenues of the destination can be increased, which in turn increases economic performance. Another way to achieve adequate diversification of the tourism sector is by intensifying campaigns to diversify activities in each of the tourism markets. Moreover, policymakers of New Zealand can consider extending the capital budget for increasing tourism investment to diversify tourism activities in New Zealand can help to increase the number of tourism arrivals for various purposes. In addition, establishing desired financial conditions such as credit promotions, subsidiaries and tax reductions for tourism investor firms can increase the investment appetite of the firms which helps diversify the number of tourists visiting New Zealand with different purposes and yields economic benefits of diversification. For example, holiday/vacation tourism and visiting friends/relatives tourism are the major activities of Chinese visitors in the country. In 2019, the two major activities accounted for almost 75% of the activities of Chinese visitors in New Zealand (Ministry of Business, Innovation & Employment, 2022). Hence, there is a need to intensify campaigns dealing with increasing arrivals for other purposes including business tourism, conventions/conferences tourism, and education tourism from China.
There is also a need for Tourism New Zealand and other tourism marketing agencies to focus on attracting visitors from other markets beyond the 15 markets that are currently being prioritized. Considering other markets does not necessarily mean that high-value consumers cannot be targeted. Many European countries including Belgium, Switzerland, France, Ireland, and the Netherlands are high-income nations with several wealthy citizens that visit various countries across the globe but have not been included in the priority list of Tourism New Zealand for marketing purposes in New Zealand. In developing countries such as South Africa, rich tourists travel to various countries. Hence, the focus on other countries including developing countries will improve the economic benefits of the tourism sector. Lower revenue per tourist or over-tourism will not necessarily emanate as a result of focusing on other markets.
Allowing flexibility in the mode of entry for arrivals can further improve the diversification of tourism activities and its economic benefits. This is because flexibility encourages several visitors to choose the country ahead of other tourist destinations with stringent entry conditions. One way to improve flexibility is to encourage more Free Independent Travelers (FITs). FITs, who choose to travel without pre-booking their holiday, are flexible travelers that can also be engaged in several tourism activities beyond holiday tourism. Such travelers face fewer administrative bottlenecks relative to other forms of travel modes such as tours and groups. Some progress is being made in respect of FITs. Buoyed by internet infrastructures, visitors accounted for approximately 75% of all visitor visas issued to Chinese visitors to New Zealand in August 2017, a significant increase from 40% in August 2013 (New Zealand Trade and Enterprise, 2020). It is expected that FITs should be popularized among other tourism markets.
The current paper has some limitations. First, due to data limitations, we have not been able to conduct an analysis on the diversification of activities within each source market of the tourism sector in New Zealand. Future studies may consider establishing a tourism diversification index of tourism activities and test whether it fosters economic growth. The findings on the diversification of activities within each source market can provide clues to the tourism authorities in New Zealand on which market they should focus when trying to diversify tourism activities. Second, the economic and non-economic factors affecting the diversification of both tourism markets and activities have not been considered in the current study. Future studies may investigate the determinants of tourism diversification. It may provide a guide on what variables tourism authorities in New Zealand need to focus on when they want to further diversify tourism markets. Third, the attention of the current paper is on New Zealand, and obtained empirically cannot be generalized for other samples. Therefore, future research can focus on the diversification of tourism markets and activities using other samples such as the G-7, highly industrialized economies, or countries with the most tourism arrivals and receipts.
Footnotes
Declaration of Conflicting Interests
The author(s) declared no potential conflicts of interest with respect to the research, authorship, and/or publication of this article.
Funding
The author(s) received no financial support for the research, authorship, and/or publication of this article.
1.
NZ$ is New Zealand dollars.
2.
“The shaded portion indicates (from lightest to darkest) the 95%, 90%, and 75% confidence intervals.”