
Abstract
Travel and tourism advertising is critical in developing positive associations to attract visitor patronage and build sustainable post-pandemic tourism. An important part of an advertising message is delivered through voice and other aspects of audio, for example, music. However, how audio features impact viewers of travel and tourism advertisements remains unexplored in the research. This study implements advanced audio analytics to test how various features impact upon viewers. The results show that voice quality is important in developing positive affect; advertisement viewers prefer speakers with quieter voices (less mean intensity) that have a higher level of clarity (higher harmonics-to-noise ratio). This can be explained via the heuristic route of the heuristic-systematic model. Music tempo was found to be important in stimulating reactions from advertisements, with faster music being associated with a higher level of positive affect. The paper concludes with practical and theoretical implications, limitations, and suggestions for future research.
Introduction
“The tongue can paint what the eyes can’t see.” Chinese Proverb.
Our voices are a powerful instrument for communication and persuasion. Of course, a large element of this is in communication using language. However, the voice is not limited to merely verbal communication, non-verbal communication in voices is also an important way to convey meaning in a message and persuade listeners (Van Zant & Berger, 2020). How a speaker says something may be as relevant as what is being said (Tracy et al., 2011). Since the human voice is one of the most important carriers of human emotions, such paralanguage is an essential element in affective communication. Individuals rely on nonverbal cues such as pitch, loudness, and aspects of voice quality to appraise a speaker’s emotion (Juslin & Laukka, 2003). In advertising, voice and music are pivotal in creating a persuasive message for radio listeners, television viewers, and of course, online viewers (Chattopadhyay et al., 2003; Dubey et al., 2018; Martín-Santana, Muela-Molina et al., 2015; Rodero et al., 2017; Wang et al., 2021). However, voice has been neglected as an area of research in marketing and management disciplines (Dubey et al., 2018; Gélinas-Chebat & Chebat, 1996; Hildebrand et al., 2020), partly due to the difficulty in analyzing voices and their effects in a realistic, scalable, and reliable way.
Travel and tourism advertising play an important role in developing a sustainable tourism economy, and this is particularly pertinent in the post-pandemic world as economies seek to rebuild. In the new e-tourism environment that in being created there is the potential to transform tourism (Fuchs, 2022; Gretzel et al., 2020) and refocus marketing more on priorities of sustainability than of profit (Jamrozy, 2007; Truong & Hall, 2017). Ideally, goals of business value and socio-economic value should be combined—a triple bottom line of people, planet and profit (Bhattacharya, 2016). Information and communications technologies in tourism firms are ubiquitous, but they have suffered from an ICT Productivity Paradox and new approaches are needed (Fuchs & Sigala, 2022). Evidence suggests that the pandemic has shifted travel and tourism advertising to digital, with a 70% digital advertising spend in 2023, high online sales of 32% (vs. 20% for retail as a whole), and advertising in 2023 moving back to pre-pandemic levels of around $19.6 billion in the US alone (Zenith, 2021). With the increasing dominance of digital advertising, their value for transformative e-tourism is stronger than ever (Gretzel et al., 2020). There is the potential to develop more responsible, social and ecological tourism (Bandyopadhyay & Ray, 2019; Higgins-Desbiolles, 2020). The corollary is that ads must be more effective than ever to enable the desired attitudinal and behavioral change for transformative e-tourism. The good news is that digital advertising and its effects can be captured as data in a variety of places, opening up the opportunity to analyze and improve offerings using new and more advanced methods.
Current advances in data analytics techniques, including those based on artificial intelligence and machine learning, have provided new impetus to the investigation of audio features and their effect on consumers (Hildebrand et al., 2020). Existing research based on human coding has recognized its limitations and there have been calls for more research utilizing machine coding of video content (Tellis et al., 2019). Notwithstanding, although heralded with enormous potential (Dawar, 2018), audio analytics is rarely used in travel and tourism research. Ngai and Wu (2022) go as far as to state that audio analytics are rarely used in the marketing discipline as a whole, and that available research is very limited, citing only two papers. Existing audio research is bedded in the use of experiments and field studies (Chattopadhyay et al., 2003; Huang & Labroo, 2020; Martín-Santana, Muela-Molina, et al., 2015; Martín-Santana, Reinares-Lara, et al., 2015; Rodero et al., 2017), rather than the examination of audio features from real, unstructured data and their relationships with actual human behavior. As yet, no known research has examined the relationships between the audio features of travel and tourism advertisements and individual outcomes using data analytics methods (J. Li et al., 2018).
This study creates and applies a novel methodology that combines machine learning algorithms, pre-trained deep learning models, and other statistical data analytics methods to test a research model for a number of existing and new theoretical relationships between voice, music, and positive affect from travel and tourism advertisements. In this research, based on the heuristic-systematic model and the musicscape model, a research model is developed and tested that examines a number of features of voice quality and of music in travel and tourism advertisements, while controlling for a variety of additional video features. This research uses YouTube video data from the monthly top-5 ads on AdForum since it began in 2013. The findings support a number of the theorized hypotheses and contribute directly to nascent theory regarding the impact of audio on individual behavior in travel and tourism research. From a practical perspective, the research identifies specific voice and music features that will have a greater impact on net positive affect among consumers from travel and tourism ads. Such features offer the opportunity to tourism marketers for developing more effective advertisements in the future. The contribution of the paper is discussed in more detail in the discussion and conclusions section.
The structure of this article is as follows. The next section examines the theoretical background for the study, introducing the research model and hypotheses. The third section explains the original research process employed in the investigation to extract and analyze the audio and other features examined. The penultimate section provides the results of testing the research model and hypotheses. The final section discusses the results and explores their implications for research and practice, noting study limitations, and making overarching conclusions on the study.
Literature Review and Conceptual Model
Heuristic-Systematic Model/Elaboration Likelihood Model
The elaboration likelihood model (ELM) posits that the persuasion of a consumer can occur through two distinct routes, the central route and the peripheral route (Petty & Cacioppo, 1986; Petty et al., 1983). The central route requires considerable cognitive effort on the part of the consumer to process the information contained in an advertisement, drawing on previous knowledge and experience, and elaborating on the information in the message conveyed. Processing may be either objective (evaluating a message on its actual merits) or biased (prior opinion influences attitude to be consistent, via support arguments, or counter arguments if not). In the peripheral route, when elaboration likelihood is low, individuals do not process message content to any great extent and instead seek aspects of a message that are non-content based. Such aspects can include music, voice, expertise, likability, quality, design elements, attractiveness, and so on.
The heuristic-systematic model (HSM) of persuasion is almost identical to the ELM but was developed slightly earlier. It is a dual-processing model whereby individuals process messages through either systematic processing or heuristic processing routes (Chaiken, 1980). Systematic processing involves cognitive effort via careful and deliberate processing of messages, similar to the central route in ELM. It values message content and source reliability in cognitive processing. This involves analysis and judgment from systematic processing. Heuristic processing relies on simple decision rules or heuristics to rapidly assess message content. This equivalent to peripheral processing in ELM. Since people tend to minimize the use of their cognitive resources, this route can be quite popular. In video ads, this might include heuristics for source attractiveness, credibility, video quality, length of video, music characteristics, voice characteristics, video production characteristics, and presence of various objects in a video, such as faces, animal or brand logos. This research adopts HSM as its underlying theory. In particular it is used to explain the importance of voice characteristics and music features—through the heuristic route—in influencing positive affect on viewers of advertisements.
Mehrabian-Russell and Musicscape Models
In addition to HSM, the research is influenced by the Mehrabian-Russell model and Musicscape model. The Mehrabian-Russell model (Mehrabian & Russell, 1974) is a classic model in environmental psychology and is better known as the Stimulus-Organism-Response (S-O-R) model. The three structures in the model, stimulus, organism, and response together determine behavioral outcomes for individuals. Stimulus represents the influence on an individual—external forces in the external environment that impact upon a person, including sensory, perceptual, affective, cognitive and physiological stimuli. Organism refers to the internal state of an individual, the emotional and psychological stability that may be influenced by a stimulus. Finally, response is the change in behavior exhibited as a result of the change in internal state of the person, the action that is taken as a result. Together the model explains how elements in an advertisement, such as music, may influence cognitive and affective outcomes for consumers of ads in the tourism industry. Indeed, Trompeta et al. (2022) recently conducted a substantive meta-analysis and found significant cognitive and affective influences of music (and different elements therein) on individuals in tourism and hospitality settings.
Bitner (1992) developed the servicescape model based on the S-O-R model. The “servicescape” refers to tangible and intangible elements of an environment with which employees and customers interact. Bitner’s (1992) servicescape model includes various characteristics in a consumption environment (stimuli) that impact upon consumers emotional and psychological state, subsequently determining their behavior, classified as approach or avoidance. The musicscape model transfers the notion of the servicescape into a music-centric environment. Music can have a significant effect on affective responses to advertising (North et al., 2004; Oakes & North, 2006). Oakes (2000) original model suggests an interaction between music compositional attributes (e.g., volume, tempo, and style) and moderators (e.g., age, gender, and social class), which in turn influence cognitive (e.g., expectations), affective (e.g., positive or negative emotion), and behavioral outcomes (e.g., spending, return intention, and length of stay). Further research has identified a larger range of attributes of music that may influences consumers in advertising settings, including, for example Oakes (2007) categorizations into mood, genre, repetition, score, association, tempo, valence, image, semantics, and timbre. A considerable body of research has supported the influence of music on consumers in various settings, including retail (Garlin & Owen, 2006; Roschk et al., 2017; Turley & Milliman, 2000), hotels (Magnini & Parker, 2009), and restaurants (Harrington et al., 2015; Milliman, 1986; North et al., 2003; Novak et al., 2010; Wilson, 2003). More recently, Trompeta et al. (2022) conducted a comprehensive meta-analysis that confirmed the affective, cognitive, and behavioral responses of consumers to characteristics of music in tourism and hospitality settings (Trompeta et al., 2022).
Voice Analytics
Voice analytics is a part of the broader field of audio analytics. Audio analytics examines soundwaves, which vary along four principal dimensions: time, frequency, amplitude, and spectrum (Sueur, 2018). Time refers to soundwave duration. Frequency (in Hertz) or pitch measures oscillations per second of soundwaves, ranging from high to low pitch. Humans are typically limited in their aural capabilities and tend to hear pitches from 20 Hz up to 20 kHz, varying over time with age. Amplitude evaluates sound intensity, sometimes also referred to as power or loudness, typically calculated in decibels (dB). Lastly, spectrum assesses acoustic perturbance or instability, measured using a variety of variables, which includes the evaluation of sound quality (e.g., harmonics-to-noise ratio (HNR), shimmer, jitter, and entropy, e.g., see Sueur, 2018). Each of these aspects may be measured using digital data from a video or audio advertisement. In this study, elements of each of these dimensions are measured and used in the analysis, focusing particularly on pitch, intensity, HNR, and duration (a control variable).
Hypotheses and Research Model
Voice Features
Pitch has been found to instill significant psychological reactions in people. Pitch in marketing communications can influence consumer perception (Hagtvedt & Brasel, 2016). Research has further shown that high-pitched voices are typically judged as less trustworthy, more nervous, less confident (Jiang & Pell, 2017), and less forceful or potent (Apple et al., 1979). On the other hand, in the political context, politicians with lower-pitched voices have an advantage in election campaigns (Tigue et al., 2012). This is typically because lower-pitched voices are perceived with greater persuasiveness, trustworthiness, and competence (Guyer et al., 2019; Oleszkiewicz et al., 2017). Similarly, low-pitched, dull, and smooth voices that are often associated with males, tend to be more persuasive, significantly driving perceptions of speaker warmth, attitude toward the speaker, and behavioral intentions (Zoghaib, 2019). Low-pitched voices also tend to induce distinctive, positive associations, attitudes, and higher brand recall, regardless of gender (Zoghaib, 2017). Based on the above, it is posited that:
H1. The mean pitch of voiced frames in an ad will be negatively related to positive affect.
It is important to mention that in this research we use the likes of a video as a measurable indicator of the positive affect of the video on the viewer. The neuropsychology literature states that “‘Liking’ refers to the hedonic impact of positive events, with underlying mechanisms that include hedonic hotspots in limbic brain structures that amplify’ liking’ reactions” and the authors “use the term ‘liking’ to refer to positive hedonic impact or core affective process within pleasure that can be objectively measured” (Nguyen et al., 2021). Thus, following this reasoning, we use likes as an indicator of positive affect from viewing the tourism advertisement,
In addition to mean pitch, another aspect of the pitch of a speaker that has been found to provide insight into the emotion and personality of a speaker is pitch variability, which is typically measured using the standard deviation of pitch. High pitch variability has been found to show consistently a relationship with high arousal emotions (Hildebrand et al., 2020). High pitch variability is associated empirically with many positive emotions such as happiness (Belin et al., 2008; Breitenstein et al., 2001; Jiang et al., 2015; Whiteside, 1999a, 1999b), joy (van Bezooijen, 1984; Waaramaa et al., 2010), elation (Whiteside, 1999a, 1999b), pleasure (Belin et al., 2008), and interest (van Bezooijen, 1984; Whiteside, 1999a, 1999b) in a speaker. This finding has been demonstrated consistently over many studies (Juslin & Laukka, 2003; Kamiloğlu et al., 2020). In some studies, pitch variability has shown associations with positive personality characteristics such as sociability (Burgoon et al., 1990), persuasiveness (Burgoon et al., 1990), and tenderness (Juslin & Laukka, 2003; Waaramaa et al., 2010). Notwithstanding, there are various studies that have found that some negative emotions can also be attributed through pitch variation, such as anger and fear (Breitenstein et al., 2001; Johnstone & Scherer, 2000; K. Scherer, 2003; K. R. Scherer & Giles, 1979). However, such emotions are unlikely to appear in travel and tourism advertisements. Thus, in this research it is hypothesized that:
H2. The standard deviation of pitch of voiced frames in an ad will be positively related to positive affect.
In terms of the psychological impact of voice, the acoustic power of a sound has an important effect on the establishment of consumer preferences and influences individuals’ emotional states. Biswas et al. (2019) find that ambient music that is less loud is likely to influence relaxation levels and a greater predilection for healthy foods. In obverse, sounds that are increasing in intensity tend to be perceived as approaching objects that demand increased vigilance due to the prospect of threat or danger (Bannister, 2020). These findings appear to ally with those of with Leongómez et al. (2021), whose results suggest that persons may modulate their voices strategically to convey nonverbal communication and individualities such as formidability and threat. More generally, research suggests that louder voices tend to be associated with aggression and anger, which is likely to evoke negative emotions in the receiver (Juslin & Laukka, 2003). Indeed, voices with greater sound intensity are construed as having greater extraversion and exerting greater dominance (K. R. Scherer & Giles, 1979; Tusing & Dillard, 2000). Thus, we would expect voice intensity to influence individuals’ affective response to an ad. The following is posited:
H3. The mean intensity of voiced frames in an ad will be negatively related to positive affect.
Voice quality has been measured in many ways in the scientific acoustic literature. One of the most common ways of measuring voice quality is the harmonics-to-noise ratio (HNR). In technical terms, HNR refers to the ratio between a speaker’s periodic (harmonic) and non-periodic (noise) parts of speech (Fernandes et al., 2018). The general idea is that a voice with more harmonic characteristics and less noise is characterized as being of a higher vocal quality. A meta-analytic study by Maryn et al. (2009) found that not only is the HNR the most commonly investigated parameter for voice quality in the literature, but it also explained a high degree of perceptual judgments of voice quality (ranging from r = .45 to r = .87, depending on the type of measures used in studies of sustained vowels). However, there is only a small amount of research that examines the relationship between HNR and emotions. A recent literature review by Kamiloğlu et al. (2020) found that higher HNR measured in a number of previous studies is associated with positive emotions of happiness, pleasure and interest. Based on on previous research, it is hypothesized that:
H4. The mean harmonics-to-noise ratio of voiced frames in an ad will be positively related to positive affect.
Music Features
Different features of music have been shown to have both direct and mediated effects on individual affective, cognitive, and behavioral outcomes in a variety of contexts (Trompeta et al., 2022). The tempo of background music in a store or in an ad provides a classic example of the use of the heuristic route of HSM in customer persuasion via sensory cues (Zhu & Meyers-Levy, 2005). Tempo refers to the beats per minute (BPM) of music. Physiologically, faster music has been found to have an impact on the human body; for example, it can lead to increases in heart rate, breathing rate, and blood pressure (Lundin, 1985). Research in a retail setting has shown that the tempo of background music influences one’s affective states and stimulates a larger positive affective response (Spangenberg et al., 2005). However, this is not always the case (Trompeta et al., 2022). Oakes (2003) finds that in festival event context, faster tempo music induces greater arousal and pleasure in contrast to slower music, which, as a result can influence a higher degree of impulse purchasing. Spence et al. (2019) reviewed the impact of music tempo on food and drink consumption and concluded that tempo of background music in bars and restaurants exhibits a form of “entrainment.” Indeed, Milliman (1986) found that faster music resulted in a 30% increase in spending as compared to slower music. Further studies have also confirmed this, and research has even found that faster music can alleviate some negative elements in the environment context (Knoeferle et al., 2017; Oakes & North, 2008). Pantoja and Borges (2021) examined video restaurant advertisements and found that faster music creates positive arousal which evokes positive taste expectations and greater purchase intentions in consumers. In sum, it is believed that tempo will exert a positive influence on positive affect. Therefore, it is stated that:
H5. The tempo of music during an ad will be positively related to positive affect.
Music tempo is only one feature of music that may have an association for individuals on an affective level (e.g., Caldwell & Hibbert, 2002; Feng et al., 2014). The effectiveness of music may be linked to the fit with the advertising message in other ways (Martín-Santana, Muela-Molina, et al., 2015; Martín-Santana, Reinares-Lara, et al., 2015; Zander, 2006). Research has demonstrated that musical genre can induce different types of emotions, including joy, amazement, power, and sadness (Zentner et al., 2008). One aspect in which there may be an important influence on positive affect is the key is which a piece of music is written. At the simplest level, we may be able to distinguish music that is written in major keys and minor keys. Kellaris and Kent (1992) found that time appears to move more slowly in music with a major key, which would appear to support the notion of slow tourism perceptions (Oh et al., 2016). Minor keys tend to be associated with negative emotion, particularly since they have learned associations with funerals and other grief-stricken contexts, dysphoria, and sad imagery (Handayani & Korstanje, 2018). On the other hand, major keys tend to be associated with positive emotions such as joy, happiness, hope, and triumph (Hevner, 1935). Therefore, it is posited that, in the context of travel and tourism advertisements:
H6. The major (as opposed to minor) key of music during an ad will be positively related to positive affect.
The hypotheses are combined into the research model shown in Figure 1. The hypotheses follow the heuristic route in the HSM model. The music features are further couched in the Musicscape Model. In addition to the specific hypotheses, the research model controls for several variables that might have an impact on positive affect, including the duration of each advertisement, the quality of the video (e.g., lighting and blurriness), the consistency of scenes in the ad, and socialness. All of these variables have been found to be significantly related to positive affect in previous advertising research.
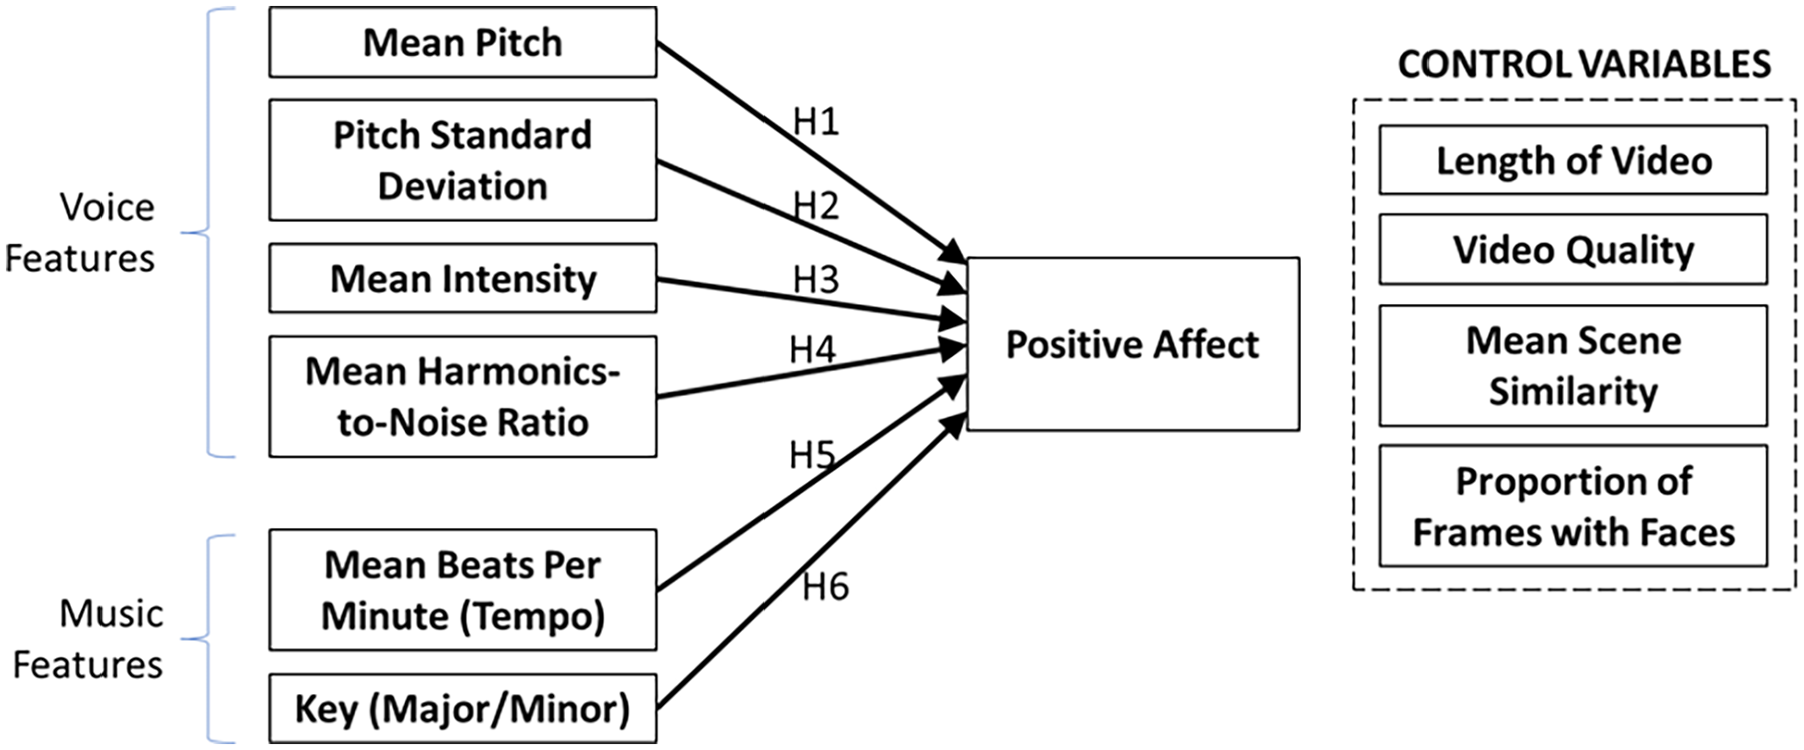
Research model.
Methodology
The specific steps undertaken in the research are delineated in Figure 2. The steps include: identifying the sample of ads for investigation, extracting video features, extracting audio files, pre-processing audio files for further analysis, extracting voice and music features, combining data sets, data preparation and calculation of the dependent variable, power analysis and examination of outliers, testing the research model via regression and examination of model diagnostics, and formal testing of the research hypotheses. We now detail each of the steps in the research process in turn.
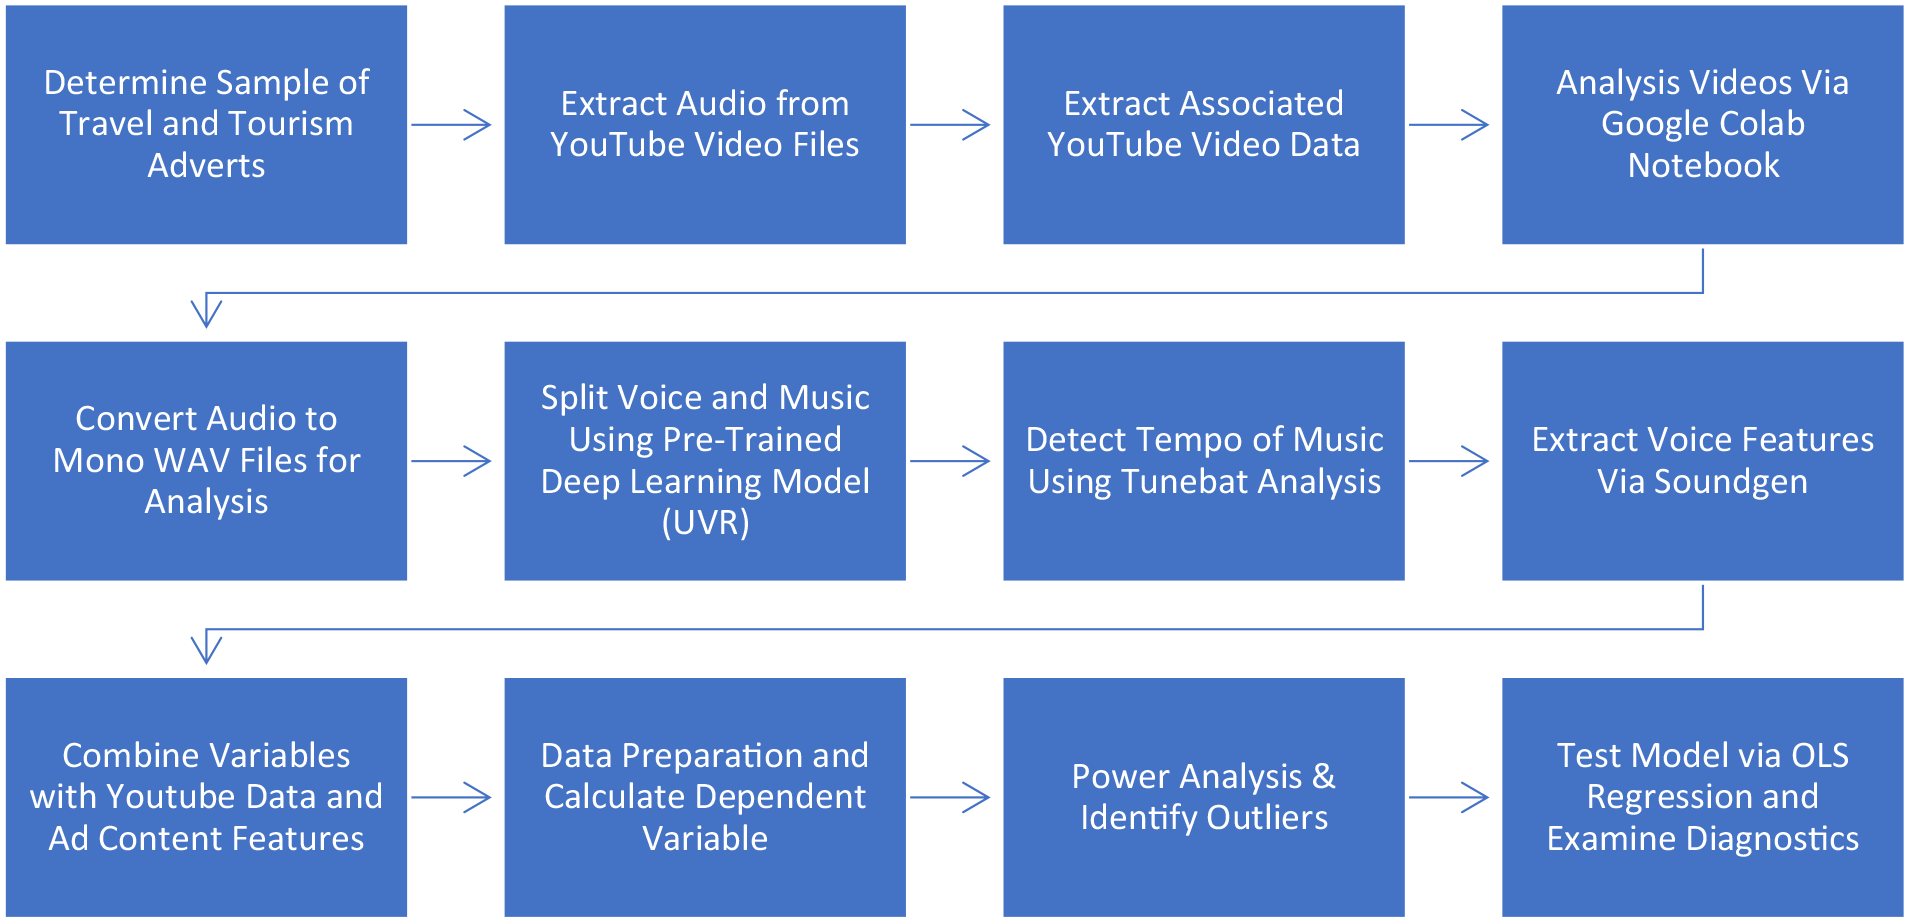
Summary of Research Process.
Sample Selection and Collection of Data
The initial step in the research process involved selecting a sample of travel and tourism advertisements for the study. The videos in the sample were considered best practice advertisements for travel and tourism and were sourced from Ad Forum (adforum.com). The potential sample included all ads in the database from October 2013 to November 2021 (n = 395). Videos were matched to YouTube via their title and content. A total of 291 matching videos were identified for the sample. Video data (e.g., likes and views) were downloaded using YT Tracker (as of the 4th of February, 2022). No videos had dislikes. Additional video characteristics (for the control variables) were analyzed using the Google Colab Notebook developed by Schwenzow et al. (2021). This additional analysis measured a number of features including: the quality of the videos via the focus of the frames using a Laplace filter to detect edges, which is related to proper lighting and blurriness (Pech-Pacheco et al., 2000); the proportion of frames with faces in the video measured using multi-task cascaded convolutional networks (Zhang et al., 2016); and mean scene similarity (e.g., colors, shapes, objects, textures, sizes and locations), from on the middle frame in each scene via the Siamese network approach and ResNet-152, a pretrained deep convolutional neural network based on ImageNet (He et al., 2016).
Data Pre-processing: Audio Data Format and Splitting
WAV files have far superior audio quality to MP3 files and are considered truer and more accurate to sound sources, although involving much larger files sizes. Therefore, the MP3 audio files were converted to WAV format to enable analysis of a richer set of audio data. Each audio sample was also converted from stereo to mono since the processing software applied in the study (Soundgen; Anikin, 2019) requires the audio files to be in a single-channel format. Voice and instrumental (music) characteristics of each ad were split using Ultimate Vocal Remover (Takahashi & Mitsufuji, 2017) and the UVR GUI package (https://github.com/Anjok07/ultimatevocalremovergui). Two videos were removed at this stage due to identification of a duplicate video or due to being too large for processing (n = 289).
Data Processing: Extraction of Audio Features
The tempo (in beats per minute or BPM) and the key (major or minor) of the music (non-voice) for each ad was calculated using Tunebat (http://tunebat.com/). Tunebat is used by many music professionals due to its high accuracy. The company also curates a large database of processed music files from Spotify as a source of reference.
Audio features were extracted using Soundgen (Anikin, 2019). Spectrograms of voice and music for a sample ad (“100% Pure New Zealand: Where One Journey Leads to Another”) are shown in Figures 3 and 4. The ad is 2 min long, as shown on the x-axis, Time. The pitch is shown in the y-axis (Frequency in kHz), from low to high. Voice frequency (Figure 3) has been capped at 4 kHz, below which all significant features appear, to show details more clearly. The upper (colorful) portion of each figure displays pitch, while the lower portion (black) details amplitude or loudness. The spectrogram illustrates important audio features via colors and symbols. The overall measured audio signal is shown by the colored pixels in the upper portion of the figure, with loudness ranging from blue (lowest) to red (highest). The green dots show pitch calculated via autocorrelation, whilst the red crosses denote the lowest dominant frequency. The final calculated pitch is indicated by the black dotted line.
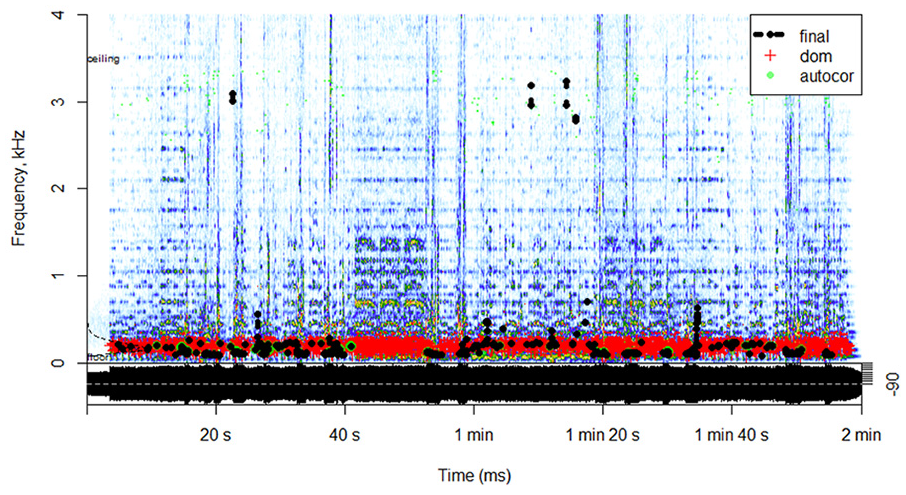
Spectrogram of voice in an ad.
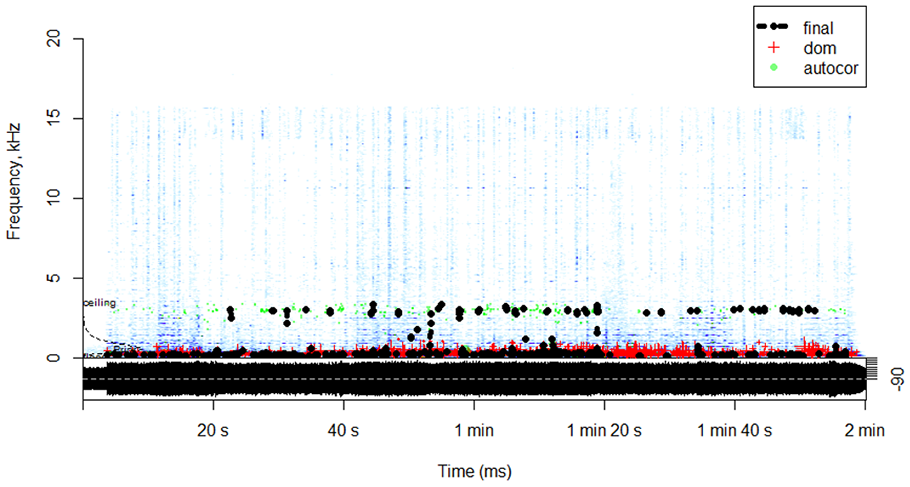
Spectrogram of music/accompaniment in an ad.
The spectrogram for the music of the ad is illustrated via the same coded features. As illustrated in the amplitude graph in the lower section of Figure 4, music appears throughout the whole ad, with very little variation in loudness.
Combining Data Sources, Data Preparation and Calculation of Dependent Variable
Each advertisement was coded with a unique identity number that was used to merge and join the various data sources. Thus, data on the voice features, music features, and other features were merged into a single data file.
The calculation of positive affect considered the total number of views of an ad, as well as the number of ad likes and dislikes (positive and negative votes). An examination of the data set found that the videos only had positive votes (likes), so consideration of negative votes was unnecessary. Since the distribution of the resulting variable was found to be highly positively skewed, a natural log transformation was also used. Positive affect for a given ad i is calculated as:

where
Descriptive statistics for the overall sample are shown in Table 1. This reports the raw data before standardization and data after standardization. The percentage of voiced frames ranged from 1.8% to 69.4%, with an average of 28.4% of voiced frames in an ad (SD = 0.15). The mean intensity of voice was 0.07 (SD = 0.04), with a mean Harmonics-to-Noise-Ratio of 9.29 (SD = 0.02). Mean pitch was 308.93 Hz (SD = 178.55 Hz), while mean standard deviation of pitch was 166.55 Hz (SD = 130.08 Hz). Regarding music features, the calculated tempo varied considerably from a minimum of 50 BPM to a maximum of 156 BPM, with a mean of 90 BPM (SD = 26.65 BPM), whilst 63% of music was in a major key. The length of videos ranged between 14.49 and 382.69 s, with a mean of 92.63 s or one-and-a-half minutes (SD = 64.16 s). The proportion of frames with faces ranged between 0% and 96.2%, with a mean of 33.7% (SD = 21.6%). Mean video quality was quite variable with a mean of 158.23 and a standard deviation of 118.81, while mean scene similarity was quite static (M = 72.7, SD = 2.3). After standardization of the independent variables, we can see that all variable means are 0 and all standard deviations are 1.
Descriptive Statistics of Sample.
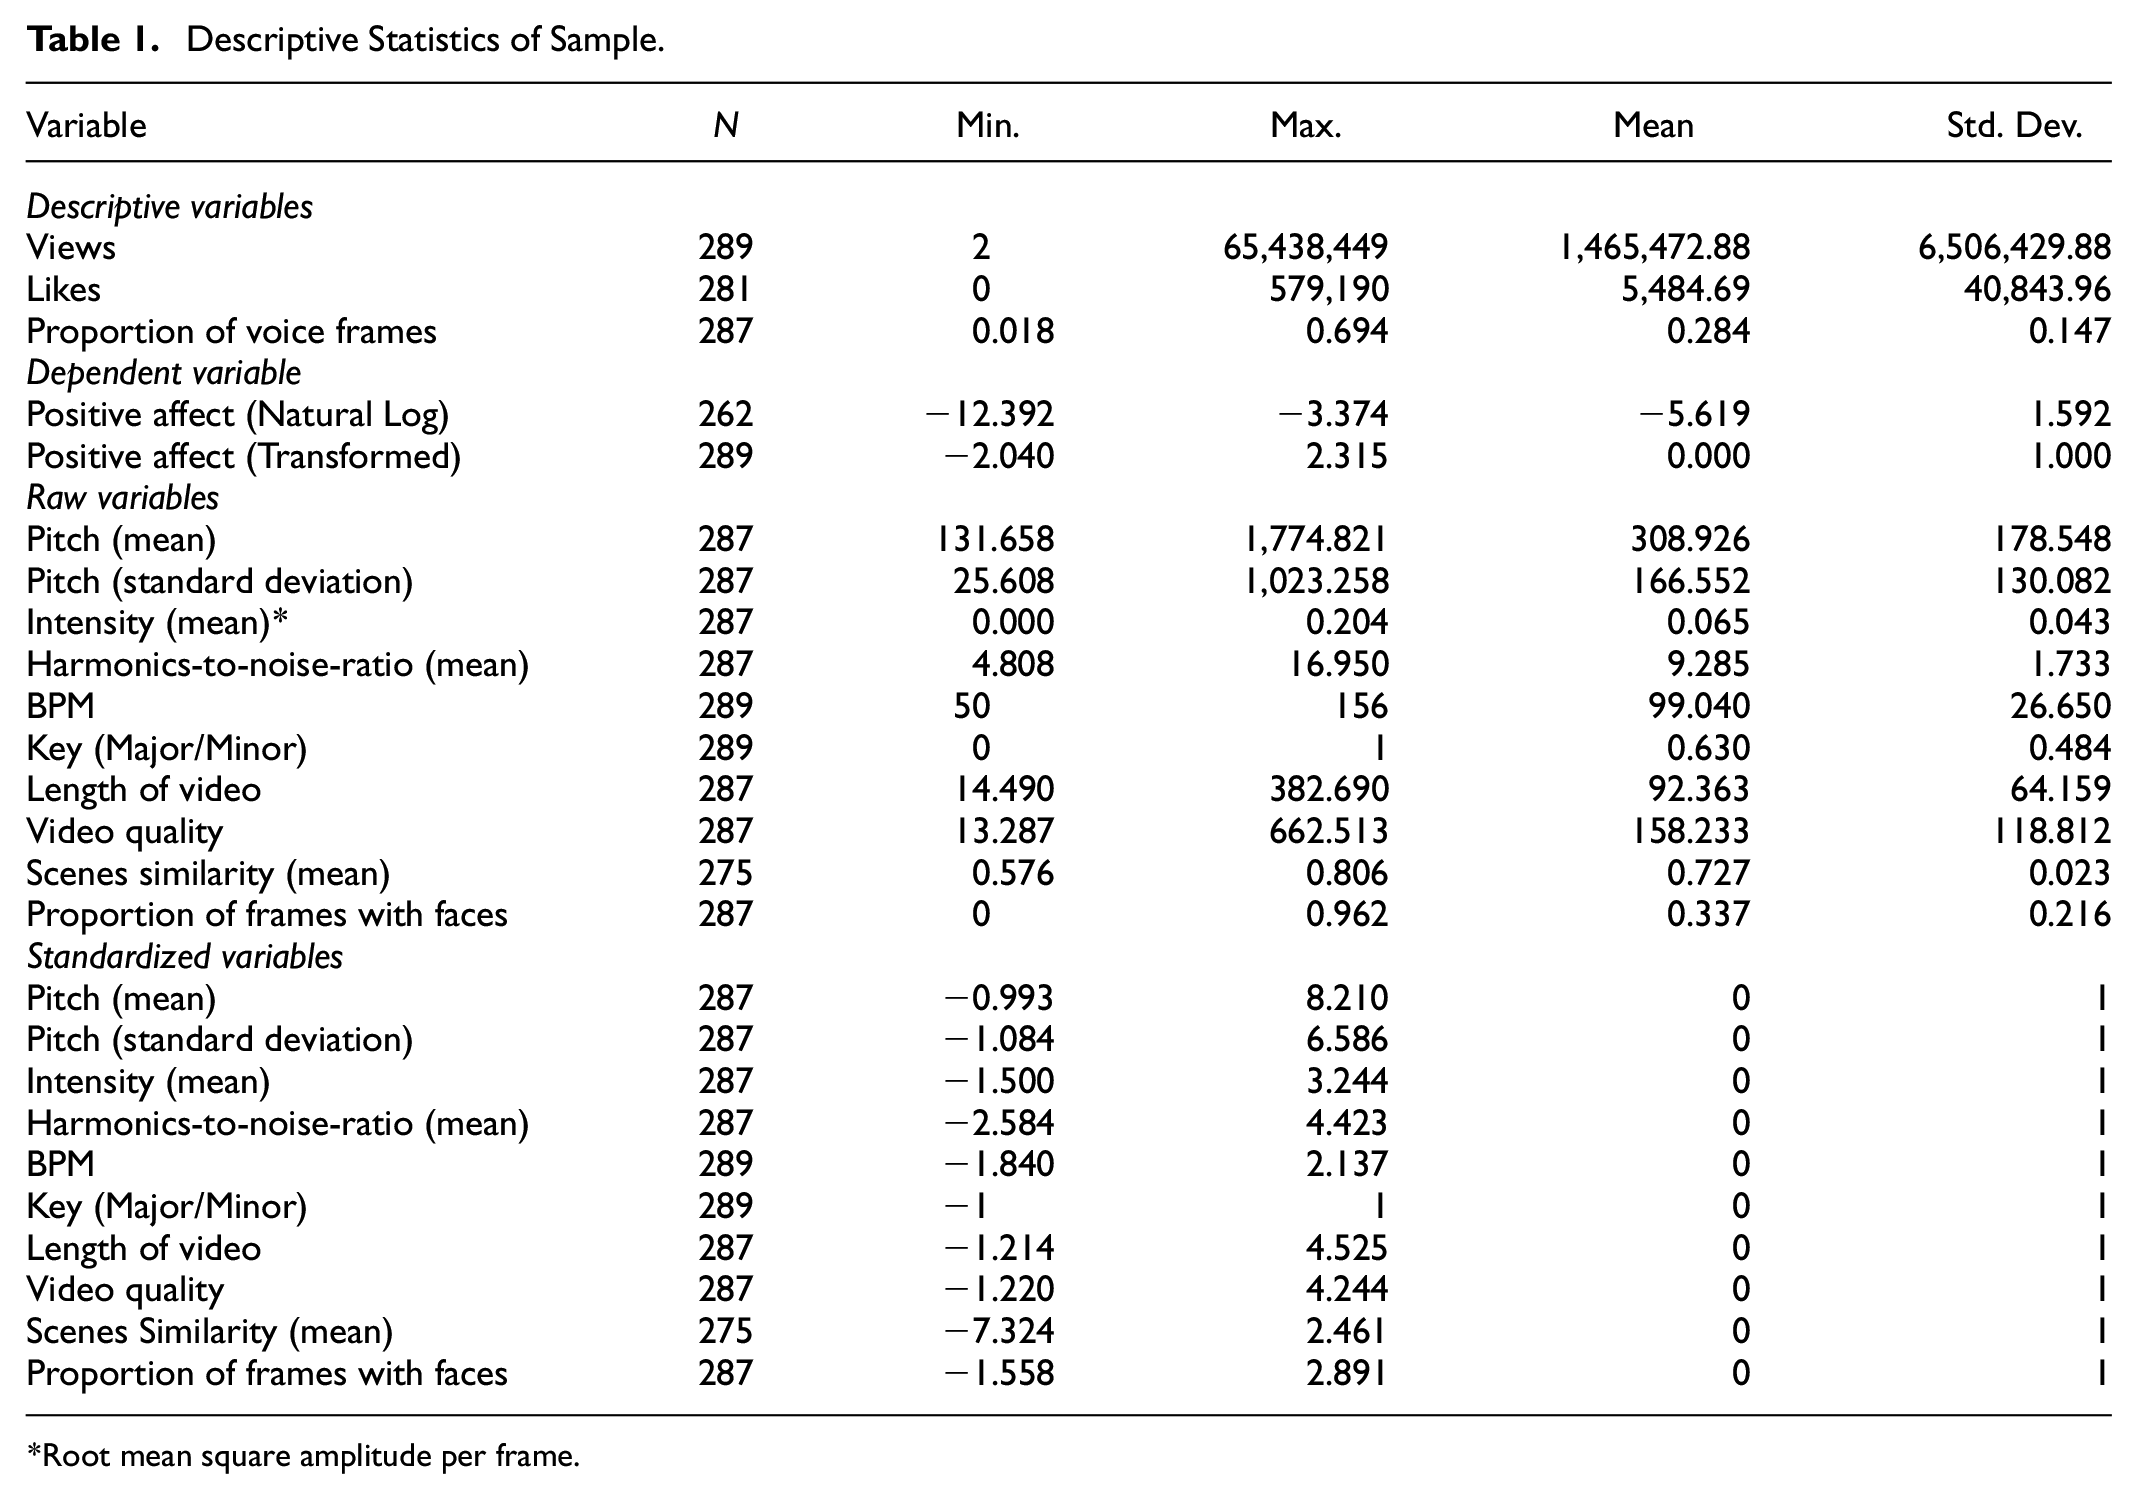
Root mean square amplitude per frame.
The mean view count for the ads was 1.47 million (SD = 6.51 million), with a mean like count of5,484.69 (SD = 40,843.96). The natural log of net positive affect had a mean of −5.62 (SD = 1.59). The transformed dependent variable has a mean of 0 and a standard deviation of 1. The distribution of the regression standardized residual of the dependent variable is shown in Figure 5. The results are approximately normal in terms of skewness and kurtosis.
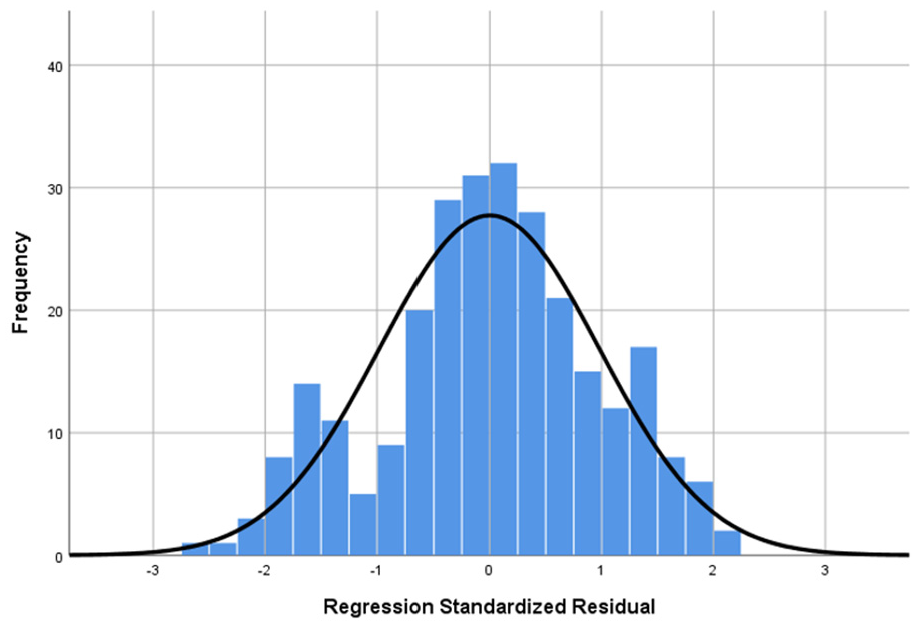
Histogram of net positive affect (natural log) variable (outliers included).
The independent variables were standardized before use in the regression model to avoid any bias from the different units used. As a further safeguard for normality, the dependent variable was transformed using a Box-Cox transformation procedure with negatives allowed (Hawkins & Weisberg, 2017) and missing values were imputed with the mean, since less than 10% of the variables were missing (Peng et al., 2006).
Outliers and Power Analysis
Regression results may be vulnerable to bias from outliers, so it is prudent to conduct analysis with and without outliers and consider their impact on the research results (Barnett & Lewis, 1994). To examine outliers, Mahalanobis (1936) distance was calculated for the regression. A total of eight observations had a Mahalanobis distance with a probability less than .001 (J. Hair et al., 1998; Tabachnick & Fidell, 1996). Robustness tests were conducted further with and without the detected outliers.
A power analysis for t-tests in G*Power 3.1.9.7 (α = .05, power = 0.95) found that a sample of 265 (outliers removed) yields an effect size of 0.041, whilst a sample size of 273 (outliers not removed) has an explainable effect size of 0.040. Thus, the sample can explain small to moderate effect sizes for the variables in the model. An F-test power analysis found effect sizes of 0.093 (outliers not removed) and 0.095 (outliers removed) using the same parameters, again in the moderate to low range, indicating an acceptable sample size for testing the research model.
Examination of Model Diagnostics
Standard model diagnostics were applied to scrutinize the robustness of the final regression model. A normal P-P Plot of the regression standardized residual for positive affect (natural log) for the model shows that the residuals closely follow the diagonal line, with no noticeable pattern of strong deviation (see Figure 6a). Second, a scatterplot of the standardized residual against the standardized predicted value reveals no pattern in the residuals, indicating homoscedasticity and suggesting that the regression model is a good fit to the data (see Figure 6b).
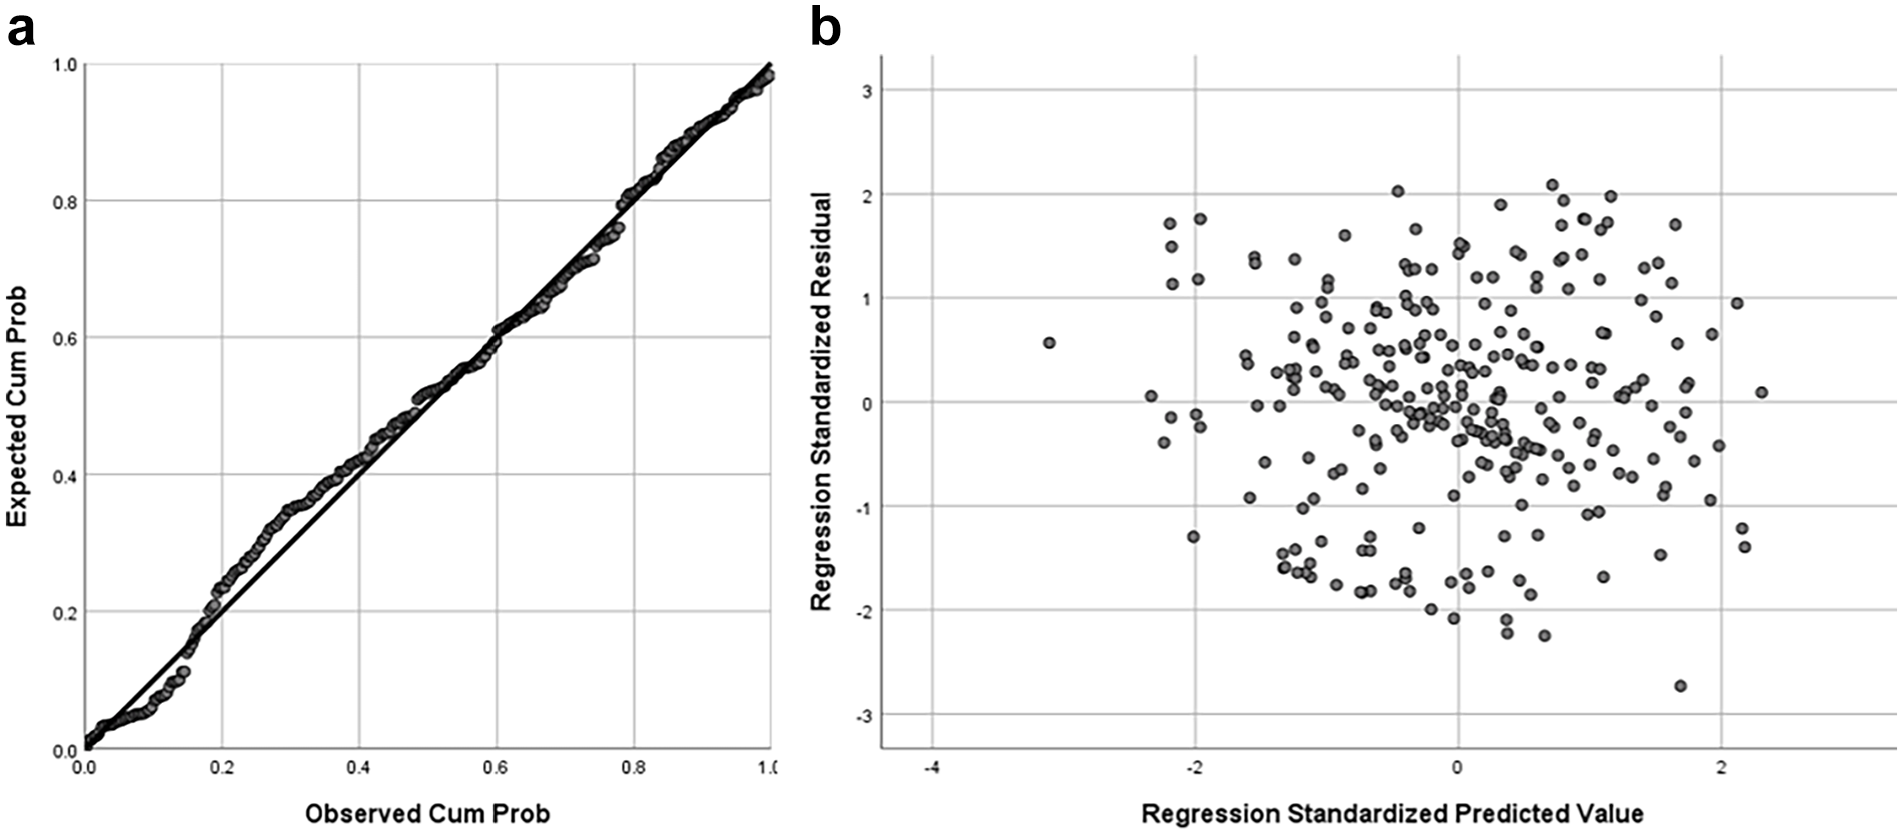
Model Diagnostics (outliers included). (a) Normal P-P Plot of Regression Standardized Residual of ln(Net Positive Affect). (b) Scatterplot of Regression Standardized Residual against Regression Standardized Predicted Value.
In order to assess possible multicollinearity problems in the data set, the variance inflation factor (VIF) was calculated and examined (Tables 3 and 4). In all cases, the VIF is below 10, suggesting multicollinearity is not a problem. As a further scrutinization of possible multicollinearity, condition indices of all variables in the model were determined. J. F. Hair et al. (2013) states that any condition indices above 30 must be inspected to determine if any pairs of variance decomposition proportions (VDP) appear above 0.9. No variables met this criterion, with the highest condition index in the model being 3.187 (outliers included) and 2.750 (outliers removed).
Results
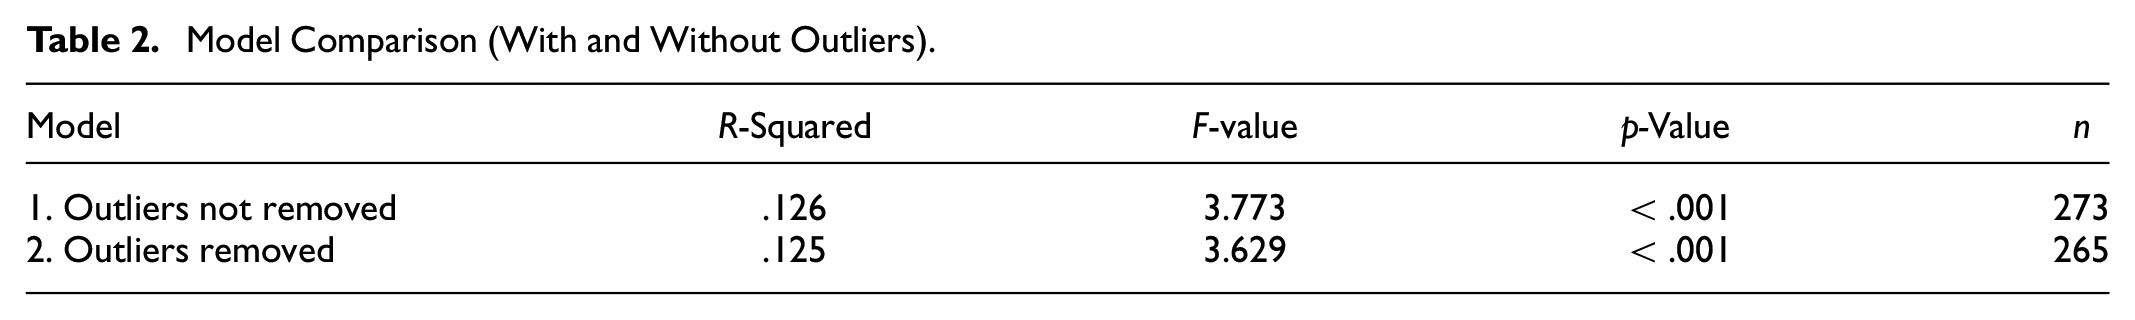
In line with good practice, the regression analysis was performed with and without outliers to test the robustness of the results. ANOVA tests and the coefficients of determination for models with and without outliers are shown in Table 2. In the model with outliers included, 12.6% of the variance in PosAff is explained by the independent variables in the research model from Figure 1 (n = 273, F = 3.773, p < .001). The model without outliers had very similar results, with 12.5% of variance in the dependent variable explained (n = 254, F = 3.629, p < .001).
Model Comparison (With and Without Outliers).
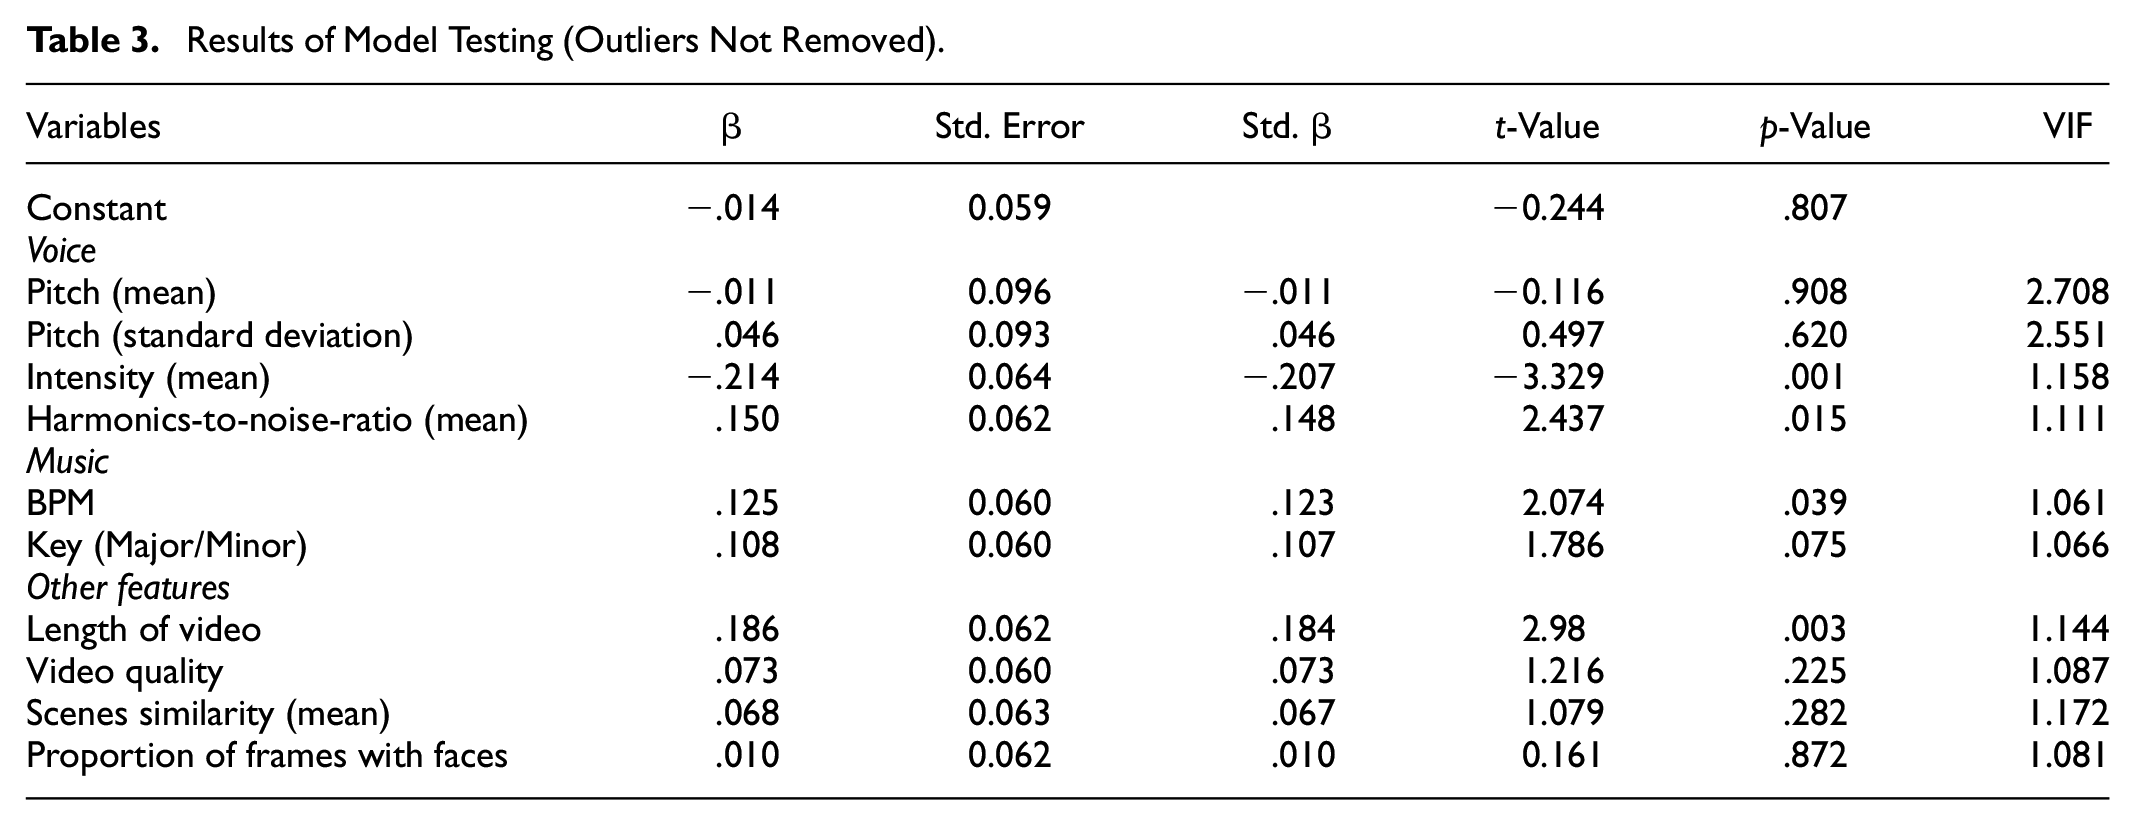
The results of testing the research model on the full sample are examined in blocks of variables for voice, music, and other features (Table 3). In terms of voice, two core variables being tested in the research model, the mean pitch and standard deviation of pitch had non-significant relationships with positive affect (β = −.011, p = .908 and β = −.046, p = .620, respectively). Notwithstanding, the two key voice quality variables, mean voice intensity and mean voice harmonic-to-noise ratio (HNR) are both significant determinants in the model: mean voice intensity is significantly negatively related to PosAff at the 1% level (β = −.214, p = .001), while the mean voice HNR is significantly positively related to PosAff at the 5% level (β = .150, p = .015). In terms of music, tempo was found to be significantly related to PosAff at the 5% level (β = .125, p = .039), although the specific key used was non-significant in the model. Finally, with respect to other features used as control variables, the length of video was found to be positively and significantly related to PosAff (β = .186, p = .003). However, video quality, mean scene similarity, and the proportion of frames with faces were not found to have a significant relationship with positive affect.
Results of Model Testing (Outliers Not Removed).
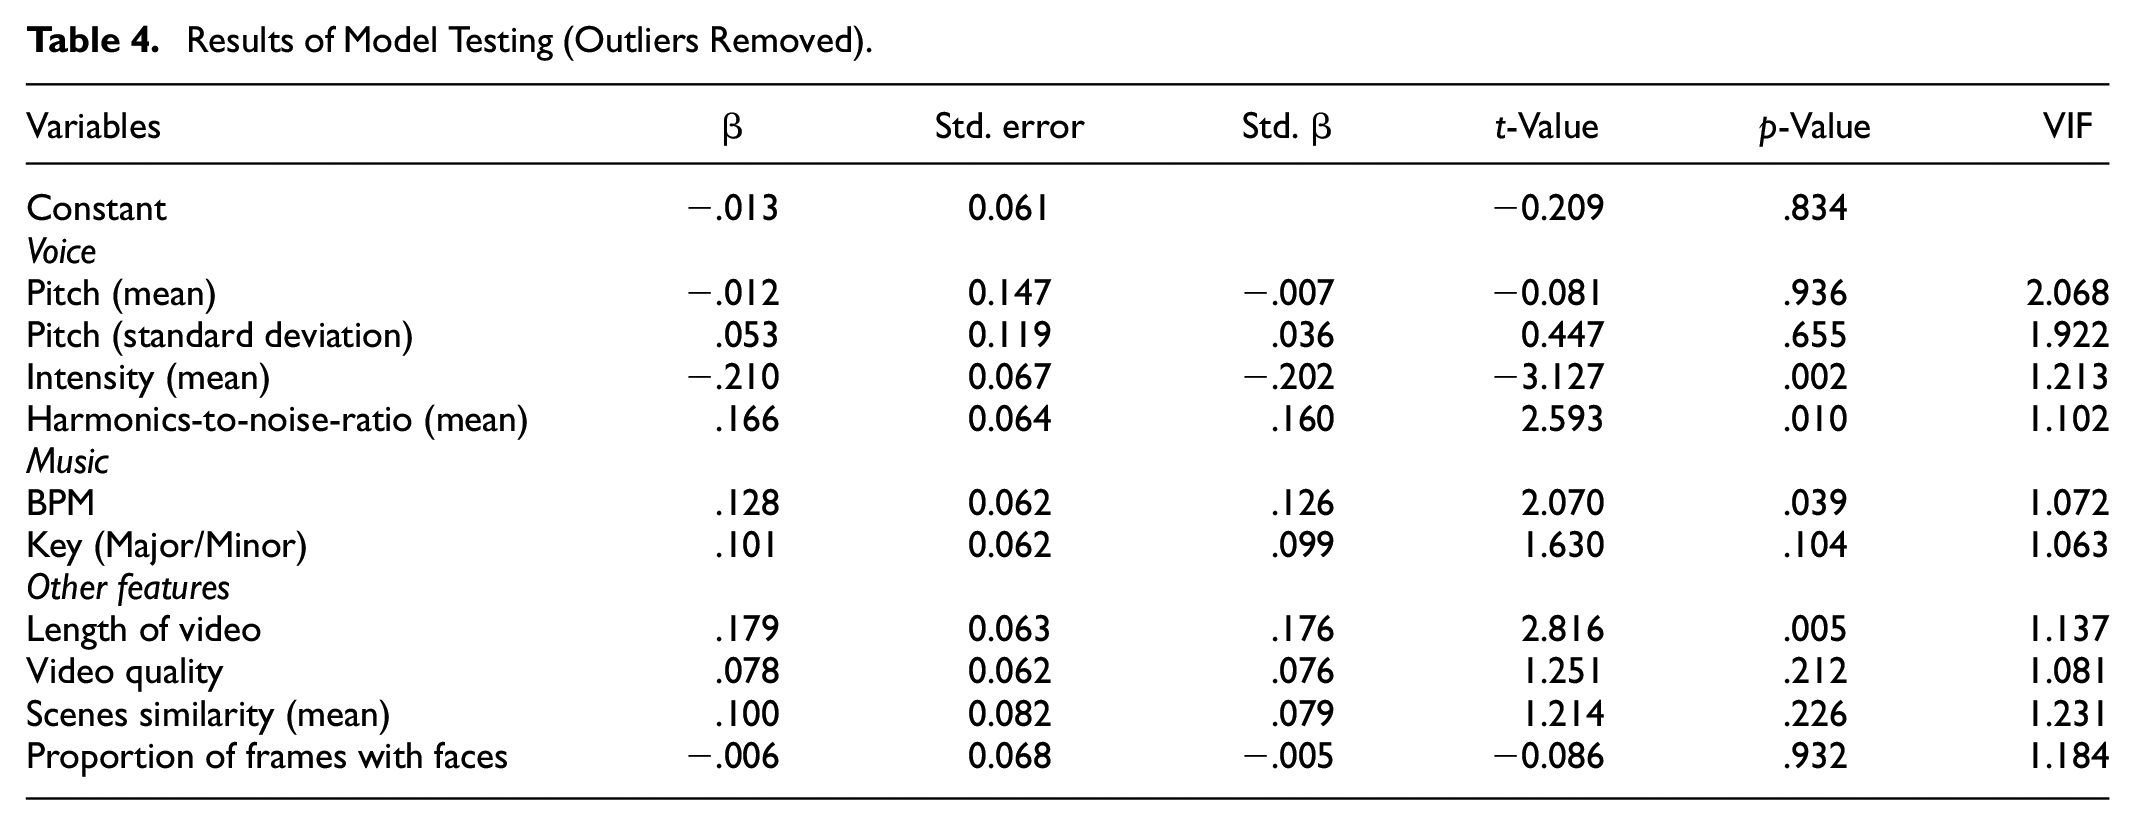
The research model is re-examined with the outliers removed (see Table 4). The significance of voice variables in the model remains unchanged and the relationships are significant at similar levels: mean intensity (β = −.210, p = .002) and mean voice HNR (β = .166, p = .010). Tempo remains significant in the model (β = .128, p = .039). Mean pitch and standard deviation of pitch remain non-significant in the model. In terms of control variables, key, video quality, mean scenes similarity and the proportion of frames with faces remain non-significant. Length of the video remains significant in the model (β = .179, p = .005).
Results of Model Testing (Outliers Removed).
Overall, the results of the analysis offer support for H3 (the mean intensity of voiced frames in an ad will be positively related to positive affect), H4 (the mean harmonics-to-noise ratio of voiced frames in an ad will be negatively related to positive affect), and H5 (the tempo of music during an ad will be positively related to positive affect), but not for H1 (the mean pitch of voiced frames in an ad will be negatively related to positive affect), H2 (the standard deviation of pitch of voiced frames in an ad will be negatively related to positive affect), or H6 (the major key of music during an ad will be positively related to positive affect). Positive affect is determined by key voice quality characteristics, mean voice intensity and mean HNR, but not by pitch. The implications of this finding are examined in the next section.
Gender was not considered a variable of interest in the study, rather the focus is on the mean pitch of an advertisement. However, as an additional robustness test, the moderating effect of the gender of voice on the relationship between mean pitch and positive affect was examined. Latinus and Taylor (2012) suggest that individuals are able to process and discriminate the gender of voice. To examine the moderating effect of gender on the relationship between mean pitch and positive affect, every ad was coded according to whether it had a distinct single gender for voice. Ads with no voice (music only) or an indistinct or mixed voice were coded as missing. The results of the test did not find a significant moderating effect of gender on the relationship between mean pitch and positive affect (full sample: R2 = .02, moderator: β = .05, p = .899; without outliers: R2 = .02, moderator: β = −.08, p = .850). As a result, gender was not considered further in the analysis.
Discussion and Conclusions
Audio advertising have become a vital part of marketing strategies for travel and tourism companies. In the post-pandemic world successful advertising has the potential to transform tourism (Fuchs, 2022; Gretzel et al., 2020) and combine goals of business value and socio-economic value—focusing on a triple bottom line of people, planet and profit (Bhattacharya, 2016). The ultimate aim must be to create more responsible, social and ecological tourism (Bandyopadhyay & Ray, 2019; Higgins-Desbiolles, 2020).
From the perspective of voice analytics, each video comes with a combination of various voice features, music background, and varied content. Travel and tourism brands leverage specific combinations of features to shape their unique identities. Notwithstanding, there is a dearth of studies exploring the efficacy of audio advertising features that employ advanced data analytics methods. This research provides empirical evidence to support theoretical relationships that have not been previously tested via actual travel and tourism video advertising data (or advertising video data more broadly). The findings affirm the beneficial outcomes that speakers with quieter voices (less intensity) and higher voice clarity (higher harmonics-to-noise ratio) bring to businesses through their positive affect from travel and tourism advertisements. The research has also demonstrated that ads with higher tempo music also tend to stimulate a greater level of positive affect from consumers. Notwithstanding, voice pitch (mean and standard deviation) and the major or minor key of music in an ad did not appear to have an impact on the positive affect of consumers.
Implications for Theory and Research
This research makes several theoretical and research contributions. First, this research contributes via the establishment of a novel methodology for conducting audio analytics research in travel and tourism, combining machine learning algorithms, pre-trained deep learning models, and other statistical methods. The comprehensive research process specified may be used in future research examining features of voice and audio in travel and tourism advertising. Contemporary developments in data analytics have brought considerable new opportunities for the analysis of a wide variety of types of unstructured data (Balducci & Marinova, 2018). Recent decades have seen a plethora of research examining textual data in marketing (Berger et al., 2020; Herhausen et al., 2020; Villarroel Ordenes et al., 2019). Notwithstanding, there is a paucity of research examining a broader range of media and modes—including audio, image, and video as well as text and numeric heuristics—to understand and predict consumers’ behaviors (Grewal et al., 2022). Several recent studies have begun to push boundaries by applying data analytics methods to videos in marketing (X. Li et al., 2019; Liu et al., 2018). However, in a recent review of machine learning research in marketing, Ngai and Wu (2022) go as far as to state that audio analytics are rarely used in the marketing discipline and that available research is very limited, citing only two papers. This research answers such recent calls for new audio analytics research to provide novel evidence of the effect of voice quality on net positive affect in travel and tourism advertisements and marketing more generally. It provides a clear blueprint for future studies of audio analytics in travel and tourism research.
Second, the research findings provide supporting evidence for the critical role that acoustic features of voices (e.g., intensity and harmonic-to-noise ratio) play in influencing consumer responses (Biswas et al., 2019; Hagtvedt & Brasel, 2016). Such features influence consumers via the heuristic route in the HSM model. We do so by analyzing the pitch, intensity, and quality of the actual audio in travel and tourism advertisements, and by examining data on consumer interactions with video ads. Louder voices (with greater sound intensity) tend to be associated more with negative emotions and perceptions in the literature. For example, greater sound intensity tends to be associated with aggression and anger (Juslin & Laukka, 2003; Moriyama & Ozawa, 2001), and has been linked to perceptions of greater dominance (K. R. Scherer & Giles, 1979; Tusing & Dillard, 2000). Louder voices are not a suitable element for inclusion in travel and tourism advertisements. This research has found that louder voices stimulate negative responses to travel and tourism ads. Research has shown that smoother voices are associated with more positive emotional responses in individuals. Kamiloğlu et al. (2020) found that higher HNR is associated with positive emotions of happiness, pleasure and interest. This research has found that smoother voices can contribute to developing a more positive response from a tourism advertisement. Overall, this study shows that travel advertisements with a lower intensity (less loudness) and greater harmonics-to-noise ratio produce more positive affect. This is an original contribution to knowledge. The corollary of this is that such advertisements are also likely to have further influences on behavior.
Third, the research demonstrates that the tempo of music can have an influence on consumer responses to advertisements via the musicscape model (and the heuristic route in the HSM model). Prior research acknowledges the impacts of music tempo on advertisement effectiveness. In additional to physiological effects (such as breathing and heart rates) (Lundin, 1985), faster music influences an individual’s affective states and stimulates a larger positive affective response (Spangenberg et al., 2005). The greater levels of arousal and pleasure in faster music can encourage a higher degree of expectations, consumption, purchasing, and impulse purchasing, via a form of “entrainment” (Pantoja & Borges, 2021; Spence et al., 2019). Moreover, music with a higher tempo can alleviate some negative elements in the environment context (Knoeferle et al., 2017; Oakes & North, 2008). This research supports prior research that has found a significant relationship between higher tempo and positive affect.
Implications for Practice
The findings of this research enable some strong practical recommendations for advertisers in the travel and tourism industry. First, the findings of the research have identified the important role of specific voice features related to the quality of the speaker in an advertisement, and these features enable advertisers to design more impactful advertisements that customers favor. For instance, a lower intensity, quieter voice, and a clearer voice with a higher harmonics-to-noise ratio will contribute positively to positive affect. Consumers tend to prefer less loudness and greater harmonics-to-noise ratio. These findings are useful to practitioners who may increase the positive affect among consumers by selecting voice actors for travel and tourism advertisements that are quieter and that have a better-quality voice with less additive noise, that is, very clear and relaxed speakers.
Second, this research established a relationship between music tempo and net positive affect. The higher the number of beats per minute for a travel and tourism advertisement, the greater the net positive affect from consumers. Faster music creates physiological effects in consumers (such as heart rate and breathing rate) and can generate more pleasure and arousal as compared to slower music and can stimulate an increased positive affective response (Spangenberg et al., 2005). This in turn can influence purchase intentions (Pantoja & Borges, 2021). When advertisers are trying to identify the most appropriate music to use in an ad, it is important to consider the use of faster music at an appropriate tempo. Trial and error may be able to identify the specific tempo of music that is best matched to particular brands and types of travel and tourism advertisement.
Ultimately, the hope is that powerful advertising underpinned by new analytics methods can be a tool for transformative advertising (Fuchs, 2022; Gretzel et al., 2020) that combines business value and socio-economic value (Bhattacharya, 2016). Advanced approaches to advertising may be able to break the ICT Productivity Paradox (Fuchs & Sigala, 2022) and build a more social, ecologically-mindful and responsible form of future tourism (Bandyopadhyay & Ray, 2019; Higgins-Desbiolles, 2020). For instance, by designing advertisements that include particular types of voices and music, it may be possible to persuade consumers to choose particular choices of travel and tourism products and services that are more in tune with transformative environmental and social trends. For example, an ad with a smooth, quiet, and clear speaker with faster music is likely to generate positive affect that may encourage consumers to choose vacations that immerse them within the arousal and excitement of a particular culture, such as understanding the worldviews of residents in favelas in Brazil or promoting an understanding of a Buddhism in a pilgrimage to Sri Lanka, pushing tourists out of their traditional “comfort zone” and enhancing the understanding of different cultures. Similarly, designing ads with the requisite characteristics may be able to entice visitors to make choices that are more ecologically friendly, such as the choice of a virtual reality experience of the Great Barrier Reef or Machu Pichu as opposed to a physical visit to the site.
Limitations and Future Research
Even though this research has established meaningful practical and theoretical implications, there is significant scope for future research to explore further the benefits of applying audio analytics methods. Several limitations of the current research are noteworthy. First, this study focused on travel and tourism advertisements as a holistic unit. Weng et al. (2021) have examined the differential effects of destination types (cultural vs. natural destinations) and the moderating influence of advertising format, such as video. The sample in this research was not large enough for such an analysis. Future research may examine whether the research findings are applicable for various subtypes of travel and tourism advertising, and if the effectiveness of voice quality in videos varies according to the nature of the travel and tourism advertisement.
This research focuses on specific acoustic features of voice. Many more features of voice can be measured using voice analytics and the methods outlined in this paper. Thus, future research is encouraged to investigate the effects of other dimensions of soundwaves. These studies may focus on other features of time, such as the mean length of an utterance (e.g., word), further features of spectrum, such as jitter and shimmer (Sueur, 2018), and additional potential features of voice quality, including cepstral peak prominence or relative mean perturbation (Maryn et al., 2009). More broadly, the combinations of different voice features may stimulate various images and perceptions in the mind of the consumer that may be linked to particular brands (Kim et al., 2021). Examining the gender of the speakers may also be an interesting avenue for future research (Latinus & Taylor, 2012). The corollary is that the creation of a unique “brand voiceprint” may be able to kindle consumer preferences toward the brand/product. This is likely to be a fruitful area for future research and it is recommended to explore the extent to which brand voiceprints that are developed are able to segment consumers and predict their preferences toward different product categories.
Footnotes
Declaration of Conflicting Interests
The author declared no potential conflicts of interest with respect to the research, authorship, and/or publication of this article.
Funding
The author received no financial support for the research, authorship, and/or publication of this article.