
Abstract
Augmented reality (AR) is an emergent technology in tourism. However, research concerning the AR user experience is relatively scarce and seldom addresses the intentions of designers. Accordingly, we sought to: (a) explore the design intentions underlying a multi-user, purpose-built AR experience; (b) assess the extent to which users’ realized experience aligned with the designers’ intended experience; and (c) examine the relationships between users’ internal states and their associated behavior, in alignment with a Stimulus-Organism-Response framework. In Study 1, designers (n = 5) took part in a focus group and completed a design intentions survey. In Study 2, users (n = 48) tested the AR experience, and a range of subjective (e.g., affective responses) and objective (i.e., visual attention) data were recorded. Findings indicated designer–user disparities primarily at the organism and response levels. Additionally, users’ affective responses to the AR experience were strongly associated with visitor engagement.
Keywords
Introduction
Innovative experiences broaden the visitor appeal and enhance economic performance (Barron & Leask, 2017). This is particularly important in light of the COVID-19 pandemic (Itani & Hollebeek, 2021), given that the travel and tourism industry has suffered losses of almost $4.5 trillion (WTTC, 2021). Technological advancements, such as augmented reality (AR), provide opportunities to enhance the visitor experience by overlaying digital content onto users’ immediate surroundings (Loureiro et al., 2020). While discussions concerning the application of AR in tourism span the past two decades (Fritz et al., 2005; Jingen Liang & Elliot, 2021), only recent innovations in hardware and software have enabled AR technology to break out of the laboratory environment into everyday experience.
One sector that has been particularly active in the employment of AR technology is museums (Serravalle et al., 2019). The National Museum of Singapore, for example, provides a Story of the Forest smartphone installation depicting the dense tropical rainforests of Southeast Asia and native fauna. The uptake of AR is rapidly accelerating, with the market estimated to be worth $340 billion by the year 2028 (Grand View Research, 2021). Facebook’s rebrand to Meta, and the envisioned metaverse, emphasizes the importance of immersive technology that seamlessly integrates physical, digital, and social components. However, it is unlikely that AR’s potential will be reached unless there is congruence between designers’ intentions and users’ actual experiences, and hence there is a need to more fully understand this relationship.
Several research clusters can be identified in the AR tourism literature (He et al., 2018; Jingen Liang & Elliot, 2021). For example, scholars have focused on the challenges and possibilities associated with AR technology (Kounavis et al., 2012), as well as user acceptance (Chung et al., 2015). Conversely, research pertaining to the AR user experience is relatively scarce and seldom addresses the intent of designers who develop such experiences (Jingen Liang & Elliot, 2021). This is problematic for two reasons. First, little is known about what designers are hoping to achieve by employing AR technology in tourism, with respect to both the type of experience and how it affects users. Second, the extent to which designers’ intentions are realized by users of AR technology is presently unknown. A joint approach, which incorporates the perspectives of designers and users, is warranted to comprehensively assess AR experiences in tourism. Identifying the relative points of convergence and divergence between both populations can help inform future theoretical advancements in visitor experience design (Bonfanti et al., 2021).
Preliminary AR user experience research is almost entirely oriented toward the effects of smartphone-based applications that entail a single user engaging with a pre-existing artifact or exhibit (tom Dieck et al., 2018). Importantly, such applications do not encourage interactions with companions (Ponsignon & Derbaix, 2020). The recent development of head-mounted displays, such as the Magic Leap and Microsoft HoloLens, allow multiple users to interact with purpose-built AR experiences in an engaging manner. It is crucial to examine this medium given that social factors are theorized to play a fundamental role in tourism-related experiences (Chen et al., 2020).
This multi-study investigation was conducted within a pragmatic research paradigm (Feilzer, 2010), wherein multiple methods of data collection were employed to address three aims. The aim of Study 1 was to explore the design intentions underlying an AR experience developed for use in a museum context. Study 1 involved the collection of qualitative focus group data and quantitative survey data, in alignment with the suggestion that mixed methods should be prioritized in AR-related tourism research (Jingen Liang & Elliot, 2021). Study 2 involved the collection of quantitative data in relation to user experience testing and this work was guided by the following aims. The primary aim was to assess the extent to which users’ realized experience aligned with the designers’ intended experience. A secondary aim was to examine the relationships between users’ internal states and their associated behavior in relation to the AR experience.
To provide a theoretical foundation for the work, constructs of interest were organized within a Stimulus-Organism-Response (SOR) framework (Suh & Prophet, 2018). SOR models have been applied to the study of virtual reality (VR) technology and thus the present study provides a logical extension to this line of inquiry (Kim et al., 2020). The SOR model employed in the present investigation provided equal coverage of cognitive (e.g., presence) and affective (e.g., remembered pleasure) constructs. This is noteworthy given that many conceptual frameworks in the tourism domain do not dedicate sufficient attention toward affective phenomena (McCabe et al., 2016; Tucker & Shelton, 2018).
From a practical perspective, the involvement of a creative team afforded an opportunity to identify and establish design intentions, against which user experience testing could subsequently be compared (Smit et al., 2021). We collected user data pre-, during, and post-experience to examine how visitor responses unfolded over time (Stienmetz et al., 2021). Eye-tracking data was captured to explore users’ attentional processes. Such data is less susceptible to bias when compared to subjective data (Scott et al., 2019) and this is one of the first attempts in tourism to incorporate eye-tracking in AR. Finally, the application under investigation was a purpose-built, multi-user experience that required an AR head-mounted display.
The following sections contain a review of literature and an overview of the developed hypotheses. Study 1 presents an exploration of the design intentions underlying the AR experience, while Study 2 entails user experience testing. Thereafter, a general discussion is offered, which includes theoretical and managerial implications, as well as limitations and directions for future research.
Literature Review
Intended and Realized Experience
Providing memorable experiences is fundamental for the longevity of tourism providers (Barron & Leask, 2017). Accordingly, there is growing interest toward the role of design in tourism (Smit et al., 2021). There is substantial variation in the conceptualization of tourism experience design (Tussyadiah, 2014). Herein, we conceptualize experience design as the practice of designing a product or service with an emphasis on the quality of user experiences. Hence, this process is predicated on the creation and staging of prerequisites that enable consumers to have desired experiences (Smit et al., 2021).
A distinction can be made between intended and realized experiences (Voss et al., 2008). Intended experiences are planned by tourism providers and offered to visitors. Alternatively, realized experiences refer to the actual lived experiences of visitors. Concentrating on the perspectives of visitors alone does not provide sufficient intellectual insight to inform experience design. Consequently, researchers have advocated a joint approach that considers the views of designers and visitors in combination to better inform tourism-related experience design (Dube et al., 2015).
There are many advantages associated with the inclusion of designers in the research process. For example, designers can identify constructs that were important to them during development and hence their views can serve as a foundation upon which to compare users’ experiences (Ponsignon et al., 2017). Additionally, the findings from user testing can be communicated back to designers so that they can refine the experience in accordance with an iterative design process (Tussyadiah, 2014). This would afford an opportunity to minimize any designer–user disparities, thereby enhancing the visitor experience and maximizing the site’s economic performance.
Few attempts have been made to assess the congruence between intended and realized experience and this is a focus of the present investigation. A notable exception concerns a qualitative study by Ponsignon et al. (2017). The researchers conducted a series of interviews with visitors and staff at a cultural center and identified four areas that can be managed by the service provider (i.e., individual touchpoints, customer journey, social environment, and physical environment). Nonetheless, there is significant scope to employ quantitative approaches to the study of intended and realized experience. This was emphasized by Ponsignon et al. (2017), who recommended that visitor behavior data be captured in real-time. Head-mounted AR devices collect real-time behavioral data through a series of integrated sensors. Hence, there appears to be a strong rationale for the study of head-mounted AR in tourism.
Stimulus-Organism-Response Models
SOR models assert that external or environmental cues prompt cognitive and affective states, which subsequently drives behavioral responses (Jacoby, 2002; Mehrabian & Russell, 1974). Tourism researchers have employed SOR models to help explain consumer behavior in relation to destinations shown in 360° images (Yeh et al., 2017) and VR (Kim et al., 2020). The present investigation extends this line of scientific inquiry to incorporate AR technology. A SOR model is used as a guiding framework to explore the relationships between the AR experience (stimulus), users’ internal states (organism), and their associated behavior (response), and is also used to assess the extent to which users’ realized experience aligns with designers’ intended experience. Fundamental constructs related to each phase of the SOR model are depicted in Figure 1 and described herein.
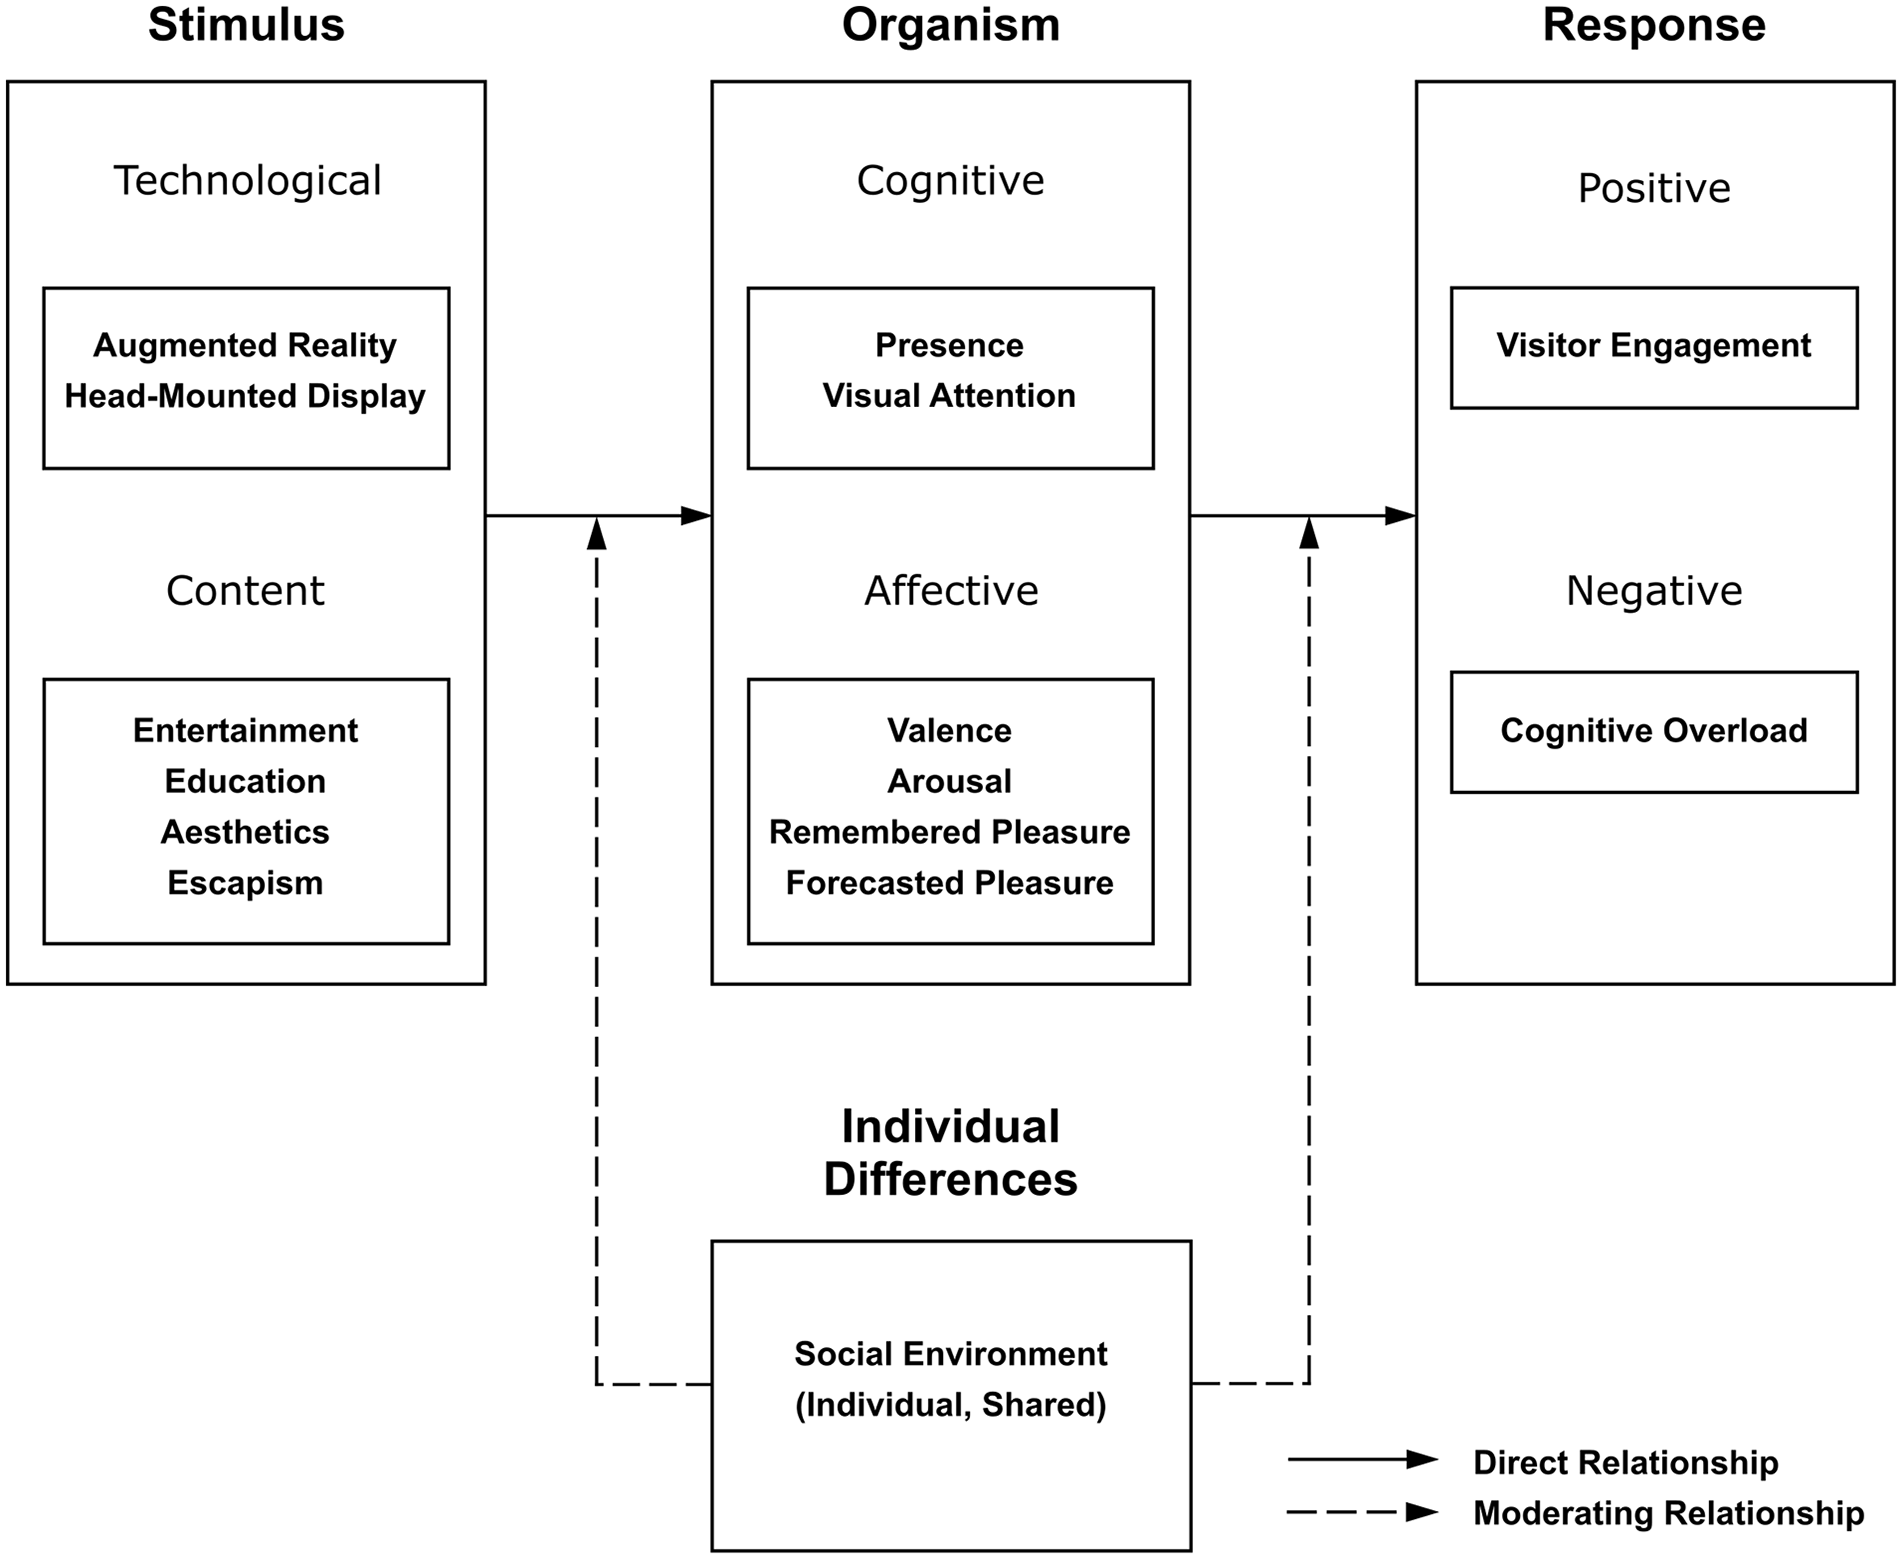
The Stimulus-Organism-Response model employed in the present investigation.
Stimulus
The stimulus refers to the trigger that facilitates users’ cognitive and affective reactions. Suh and Prophet (2018) made the distinction between technological stimuli and content stimuli. The technological stimulus under investigation is head-mounted AR, which overlays digital assets onto users’ real environments. An important feature of AR in tourism is the ability for users to access engaging digital content while concurrently preserving interactions with other users, thereby adding a social element to the stimulus. This is beneficial because social interaction is a vital component of experience that has been associated with a range of desirable outcomes (e.g., positive affective responses; Chen et al., 2020). In contrast, VR, despite being fully immersive, can be considered to prompt rather solitary experiences (Ingram et al., 2019). It is perhaps for this reason, that AR has been described as one of the most promising technologies in tourism (Loureiro et al., 2020).
It is also important to consider the type of content or experience that is delivered via AR technology, as different applications will prompt diverse affective and cognitive states (Suh & Prophet, 2018). Experience typologies are useful for tourism managers, as they afford the distinction between different market offerings. A plethora of visitor experience typologies have been proposed (Packer & Ballantyne, 2016), with Pine and Gilmore’s (1998) Experience Economy serving as a predominant framework in tourism (Jung et al., 2016).
Pine and Gilmore (1998) emphasized the importance of staged experiences and proposed four realms according to two dimensions: involvement (ranging from passive to active participation) and desire (ranging from absorption to immersion). Active participation permits the visitor to directly affect the event or performance (e.g., attending an interactive cooking class), however, such interaction is not possible during passive participation (e.g., watching a film at a cinema; Pine & Gilmore, 1998). Absorption occurs when an experience occupies an individual’s attention whereas immersion refers to instances where an individual feels part of the experience itself (Pine & Gilmore, 1998). Subsequently, the researchers proposed four realms of experience (i.e., entertainment, education, aesthetics, and escapism) and suggested that the richest experiences comprise elements from all four realms. A strength of the experience economy framework is its flexibility in identifying a range of experience types. Nonetheless, there is also a need to consider distinct psychological constructs at the organism level when studying tourism experiences (Scott & Le, 2017).
Organism: Cognitive
Organism refers to users’ internal evaluations of the stimulus. It is possible to identify a range of cognitive reactions to immersive technology use (Suh & Prophet, 2018). In the context of AR technology, presence is a sense of feeling surrounded by a realistic physical/virtual environment (Georgiou & Kyza, 2017). Presence in AR has been associated with a range of positive outcomes such as greater intentions to use smartphone-based shopping applications (Smink et al., 2020), but has rarely been the subject of empirical investigation in tourism (Jung et al., 2016). A notable exception concerns a study by He et al. (2018), who reported that greater perceptions of presence were associated with increased willingness to pay for an art museum experience. However, the researchers’ intervention was pre-recorded, and participants were instructed to imagine that they were on-site using an AR device. Therefore, there is ample opportunity to examine presence in AR with greater consideration toward ecological validity.
Another cognitive process of interest concerns visual attention (Scott et al., 2019), which allows individuals to selectively prioritize or suppress information in their environments. Understanding visitors’ visual attention is important to site managers, as this information can be used to help redesign staged experiences in an engaging manner (Le et al., 2020). Our eyes are constantly in motion of two main types. Fixations refer to instances in which the eyes remain still and can last anywhere from tens of milliseconds to several seconds. Alternatively, rapid movements of the eyes from one fixation to another are termed saccades and can take 30 to 80 ms to complete (Holmqvist & Andersson, 2017). Fixations reveal the stimuli that visitors are dwelling on whereas saccades are indicative of a shift in focus.
Eye-tracking technology has become a powerful tool to help researchers examine the perception of visual stimuli in tourism (Rainoldi & Jooss, 2020). For example, screen- and mobile-based eye-tracking devices have been used to examine tourists’ attentional processes in relation to marketing materials (Scott et al., 2019). However, there is a dearth of eye-tracking research in relation to immersive virtual environments, despite researchers emphasizing the usefulness of such an approach (Rainoldi & Jooss, 2020). This paucity of research is surprising given that many head-mounted displays used to access immersive stimuli have the capacity to record users’ gaze behavior (Harris, Bird, et al., 2020).
Organism: Affective
Conceptual frameworks in tourism often support the notion that visitors are rational decision makers (McCabe et al., 2016). Visitors are typically theorized to engage complex cognitive processes when collecting, rationally evaluating, and acting upon information that serves to promote their greatest satisfaction (Pearce & Packer, 2013; Walls et al., 2011). However, visitors do not always make fully rational decisions and their motives are often driven by the powerful influence of affective phenomena (Walls et al., 2011; Wattanacharoensil & La-ornual, 2019). Affective responses are increasingly being cited as key determinants of memorable experiences and hence their measurement is important (Chen et al., 2020; Godovykh & Tasci, 2020a).
Despite the appeal of measuring affective responses in tourism, the terms affect, emotion, and mood are often used interchangeably reducing conceptual clarity (Skavronskaya et al., 2017). Accordingly, there is a need to define constructs of interest if this line of scientific inquiry is to flourish (Skavronskaya et al., 2017). Affect can be defined as “a neurophysiological state consciously accessible as a simple primitive nonreflective feeling most evident in mood and emotion but always available to consciousness” (Russell & Feldman Barrett, 2009, p. 104).
Herein, affect is conceptualized as a dimensional domain, containing two orthogonal and bipolar dimensions, affective valence (ranging from pleasure to displeasure) and arousal (ranging from sleepiness to high arousal). Researchers have advocated the measurement of affective valence, albeit adopting the behavioral economics term utility (Kahneman et al., 1997), as an appropriate successor to satisfaction (Godovykh & Tasci, 2020b). This is because affective valence is a bipolar dimension and has greater coverage of outcomes when compared to satisfaction, which is typically assessed with unipolar measures.
In addition to measuring affective responses during a specific encounter, Godovykh and Tasci (2020b) recommended the measurement of affective responses in relation to two additional timepoints. Remembered pleasure/utility concerns how pleasant or unpleasant an experience is later remembered. Moreover, forecasted pleasure/utility concerns how pleasant or unpleasant future experiences are predicted to be. Researchers have theorized that both remembered and forecasted pleasure can help predict whether behavior will be repeated (Karl et al., 2021; Zenko et al., 2016). Hence, such constructs could yield considerable value when evaluating the extent to which AR experiences can help retain visitors.
Few investigators have sought to assess affective responses to AR experiences in the tourism domain. Kourouthanassis et al. (2015) conducted a field study with visitors using a smartphone-based travel guide. Participants were required to use the application for the duration of their visit and the researchers reported that affective valence and arousal were both statistically significant predictors of usage behavior. However, little is known about the effects of AR experiences on remembered/forecasted pleasure. Hence, there is a distinct need to consider this element of the user experience and how it relates to visitor behavior.
Organism: Individual differences
There is evidence to suggest that individual differences can influence responses to immersive technology use (Suh & Prophet, 2018). For example, Park and Stangl (2020) reported that high-sensation seekers reported the most positive AR experiences when compared to their lower sensation-seeking counterparts. Another factor that might influence responses to immersive technology use concerns the social environment (Bolton et al., 2018; Ponsignon & Derbaix, 2020). Preliminary findings from computer science indicates that shared AR experiences can prompt greater user interest when compared to individual applications (Park et al., 2020). However, future research is required to examine the extent to which this applies in tourism.
Response
A response refers to an outcome of immersive technology use (e.g., learning effectiveness; Suh & Prophet, 2018). Perhaps the most important response to museums is visitor engagement (Barron & Leask, 2017). This can be conceptualized as involvement with, and commitment to, a consumption experience (Taheri et al., 2014). Researchers have shown that AR applications can prompt visitor engagement in relation to science festivals (tom Dieck et al., 2018), but further research is required to assess this in a museum context.
It is important to consider positive and negative responses to immersive technology use (Suh & Prophet, 2018). A negative response is cognitive overload, given that tourism experiences typically entail an element of visitor learning. In accordance with Cognitive Load Theory (Sweller, 1999), cognitive workload can be considered as the quantity of informational units that must be held in working memory during a task. It is plausible that there is an optimal level of cognitive workload for tourism-related AR experiences, and it is the responsibility of designers to optimize this. Previous research is heavily weighted toward positive user responses (Kim et al., 2020; tom Dieck et al., 2018). Hence, examining negative responses to AR experiences, such as cognitive workload, represents a more harmonious approach when compared to the extant literature (Jingen Liang & Elliot, 2021).
Hypothesis Development
Intended and Realized Experience
AR design and user experience studies have been described as promising lines of inquiry (Jingen Liang & Elliot, 2021). However, no research to date has addressed the extent to which designers’ intentions are realized by users of AR technology in tourism. Study 1 comprised an exploration of the design intentions underlying an AR experience developed for a museum context. A mixed methods approach was adopted and included the collection of qualitative focus group data and quantitative survey data. Study 1 was exploratory (no a priori hypotheses) and generated predictions that were assessed in Study 2, which entailed the collection of quantitative data in relation to user experience testing. Accordingly, specific research hypotheses pertaining to intended and realized experience are presented in Study 1, following data collection with designers.
User Responses
An aim of Study 2 was to examine the relationships between users’ internal states and their associated behavior in relation to the AR experience. Constructs of interest were organized in accordance with a SOR framework (see Figure 1). Cognitive and affective reactions to immersive stimuli are theorized to prompt user responses (Suh & Prophet, 2018). Hence, we hypothesized positive relationships between presence–visitor engagement and between visual attention–visitor engagement (H1). Likewise, we predicted positive relationships between remembered pleasure–visitor engagement, and between forecasted pleasure–visitor engagement (H2). Kim et al. (2020) sought to examine tourists’ intentions to visit destinations previously experienced in VR. The researchers employed a SOR framework and reported that cognitive factors had a stronger influence on positive outcomes when compared to affective responses. Accordingly, we predicted stronger relationships between cognitive variables–visitor engagement when compared to the relationships between affective variables–visitor engagement (H3).
The majority of AR research in tourism concerns smartphone-based applications that are designed for a solitary user (tom Dieck et al., 2018; Trunfio & Campana, 2020). Consequently, little is known about the effects of engaging with purpose-built, head-mounted AR experiences among groups of visitors. Initial findings indicate more positive responses to shared experiences when compared to individual experiences (Park et al., 2020). Hence, we hypothesized greater visitor engagement for those who take part in a shared experience when compared to individual users (H4). At the organism level, we predicted that shared experiences would prompt more positive remembered and forecasted pleasure when compared to individual users (H5). Conversely, we hypothesized that shared experiences would be associated with lower presence and visual attention toward digital assets, when compared to individual users (H6). This is because cognition is likely to gravitate toward other users during shared experiences.
Study 1
Methods
Pragmatism
The present investigation was conducted in alignment with a pragmatic research paradigm (Feilzer, 2010). A detailed description of this approach can be found in Supplemental Material 1.
Participants
The study was approved by the University of Exeter Research Ethics Committee. A purposive sample of five adult designers was recruited through email correspondence with a production studio in the United Kingdom (Mage = 44.8 years, SDage = 3.2 years; one woman, three men, and one who preferred not to say; four British and one who preferred not to say; Mexperience = 20.6 years; SDexperience = 2.7 years). Inclusion criteria stipulated that volunteers were involved in the creation of the AR application. Each studio department (e.g., design, quality assurance) were represented. It was anticipated that the sample size was small enough for each participant to contribute, yet sufficiently large to share diverse opinions across the whole group (Freeman, 2006).
Procedure
Data collection took place in May 2021. A convergent mixed methods design was employed, which entailed a concurrent collection and analysis of qualitative and quantitative data (Creswell, 2022). This research design was appropriate given that it allowed for the perspectives of designers to emerge via qualitative methods, but also allowed us to quantify designers’ intended experience, enabling subsequent analyses against users’ realized experience in Study 2. Participants provided informed consent and completed a demographic questionnaire. A review of literature was conducted to facilitate the development of focus group materials (He et al., 2018; Suh & Prophet, 2018), which were subsequently refined among the research team. The purpose of the focus group was to explore the design intentions underlying the AR experience. The focus group was conducted via web-based videoconferencing software (Zoom; San Jose, CA, USA) and all participants joined using video and audio. It is important to create a comfortable environment when conducting focus groups (Krueger & Casey, 2014). Zoom was deemed appropriate given that (a) participants could join the discussion from a familiar setting, (b) participants could easily see and hear other participants, and (c) it could limit in-person interaction during the COVID-19 pandemic.
Three members of the research team were present during the focus group. The lead researcher served to moderate the discussion while the remaining two researchers provided additional assistance (e.g., monitoring the chat function on Zoom; Krueger & Casey, 2014). The focus group commenced with a brief introduction from the moderator, who reiterated the purpose of the study and informed participants that the discussions would serve to guide the next phase of the research.
The opening question concerned each participant’s role in the development of the AR experience. This opening question was intended to be easy to answer to encourage participants to divulge information and feel comfortable in the group setting (Krueger & Casey, 2014). The second question related to the origins of the project and participants were encouraged to contribute until no more views were offered. The main topics of discussion were design challenges, target user demographics, as well as user responses during and post-experience. The questions were open-ended and intended to encourage universal participation within the group. The moderator used the screen share function on Zoom to display a series of documents (e.g., internal storyboards) to facilitate a critical discussion of the AR experience on a scene-by-scene basis.
The moderator employed follow-up questions and provided opportunities to clarify responses to explore the subject at a deeper level. The focus group lasted 61 minutes, was digitally recorded, transcribed verbatim, and yielded 17 pages of single-spaced text. Each participant was required to complete a design intentions survey via web-based software (Qualtrics; Provo, UT, USA) upon the cessation of the focus group. The survey was completed by each member of the design team individually. It was anticipated that this would eliminate any bias occurring through group dynamics, which is a concern when sampling pre-existing groups of individuals who work closely together (Freeman, 2006). The data derived from the survey served as a foundation upon which users’ realized experiences could be compared against in Study 2.
Measures
The design intentions survey consisted of multiple inventories designed to capture user responses to AR technology. In all cases, the stem of each item was minimally adjusted to capture design intentions. For example, “The setting of the AR experience was very attractive” was adjusted to “We intended the setting of the AR experience to be very attractive” (tom Dieck et al., 2018).
An inventory developed by tom Dieck et al. (2018) was adapted and employed to assess the stimulus content in relation to the four realms of experience (i.e., entertainment, education, aesthetics, escapism) advocated by Pine and Gilmore (1998), as well as user engagement. This inventory included 17 items (e.g., “We intended for users to learn something new during the AR experience”) attached to a 5-point bipolar scale (1 = Strongly Disagree, 5 = Strongly Agree).
Presence was measured using four items (e.g., “We intended for users to be so involved, that they feel their actions could affect the activity”) adapted from the Augmented Reality Immersion questionnaire (Georgiou & Kyza, 2017). Items were attached to a 7-point bipolar scale (1 = Totally Disagree, 7 = Totally Agree).
On the basis that we conceptualize affect as a dimensional domain, intended affective responses were firstly assessed using the Affect Grid (Russell et al., 1989). This is a 9 by 9 grid, with the horizontal dimension representing affective valence (from unpleasantness to pleasantness) and the vertical dimension representing arousal (from sleepiness to high arousal). Anchors are placed at the extremes of the two orthogonal dimensions (e.g., “pleasant feelings”), as well as the four corners (e.g., “excitement” [pleasant, high-arousal]) to facilitate understanding (Ekkekakis, 2013). The moderator shared the Affect Grid during the focus group and participants were required to collectively select one of the 81 squares that corresponded with their intended experience on a scene-by-scene basis.
To minimize common method variance, remembered pleasure was measured using a scale with a different format to the Affect Grid (Russell et al., 1989). A visual analogue scale was employed in relation to the question “Overall, how did you intend to make users feel during the AR experience?” The scale ranged from −100 (very unpleasant) to 100 (very pleasant) in intervals of 1. The slider was initially positioned at the origin (0). The descriptors and slider were visible to participants but the numbers were not (Zenko et al., 2016).
Forecasted pleasure was measured using the Empirical Valence Scale (Lishner et al., 2008). Participants were required to respond to the question “If users repeated the AR experience, how do you think they would feel?” Fifteen empirically spaced verbal descriptors were depicted underneath the scale, ranging from −100 (most unpleasant imaginable) to 100 (most pleasant imaginable). The values were hidden from participants who were instructed to select one descriptor only.
Cognitive workload was measured using an adapted Simulation Task Load Index (SIM-TLX; Harris, Wilson, et al., 2020). This inventory comprised nine items (e.g., “How mentally fatiguing did you intend the task to be?”) attached to a 21-point bipolar scale (0 = Very Low, 20 = Very High).
Data analysis
Separate analyses were conducted with respect to the qualitative and quantitative data, in alignment with a convergent mixed methods design (Creswell & Plano Clark, 2017). The transcription data were organized using NVivo (QSR; Melbourne, Australia) and analyzed by means of theoretical thematic analysis (Braun & Clarke, 2006). Initially, the lead author engaged in a process of familiarization to gain a sense of the overall context of the data and the wording employed by participants. The transcript was read multiple times and initial ideas were recorded. Thereafter, initial codes were generated theoretically in relation to Suh and Prophet’s (2018) SOR model of immersive technology use. Codes were then collated into larger themes and a reviewal process enabled the development of a thematic map (Terry et al., 2017). Finally, the themes were defined and named, which helped to tell the overall story of the analysis (Maguire & Delahunt, 2017). Responses to the design intention survey were collated and descriptive statistics were calculated. Integration was achieved by merging the results from the qualitative and quantitative data, which enabled a more complete understanding of the designers’ intended experience when compared to that provided by either the qualitative or quantitative results alone (Creswell & Plano Clark, 2017).
Results and Discussion
Stimulus
Participants described several properties pertaining to the AR experience. The decision to employ AR technology from Magic Leap appeared to be predicated on a desire to develop for “one of the boundary pushers in terms of entertainment” (Quality Assurance Lead). The AR experience depicted “ghost dinosaurs . . . and you’ve got to try and spot them, and you’ve got to try and help save them and return them to their dimension” (Creative Director). Hand gestures, which were tracked by the AR technology, appeared to be of central importance: “You would hold out your hand, a stream would go out to a ghost dinosaur, it would encapsulate it and then it would float up and through a portal and back to ghost land” (Lead Designer; see Figure 2).
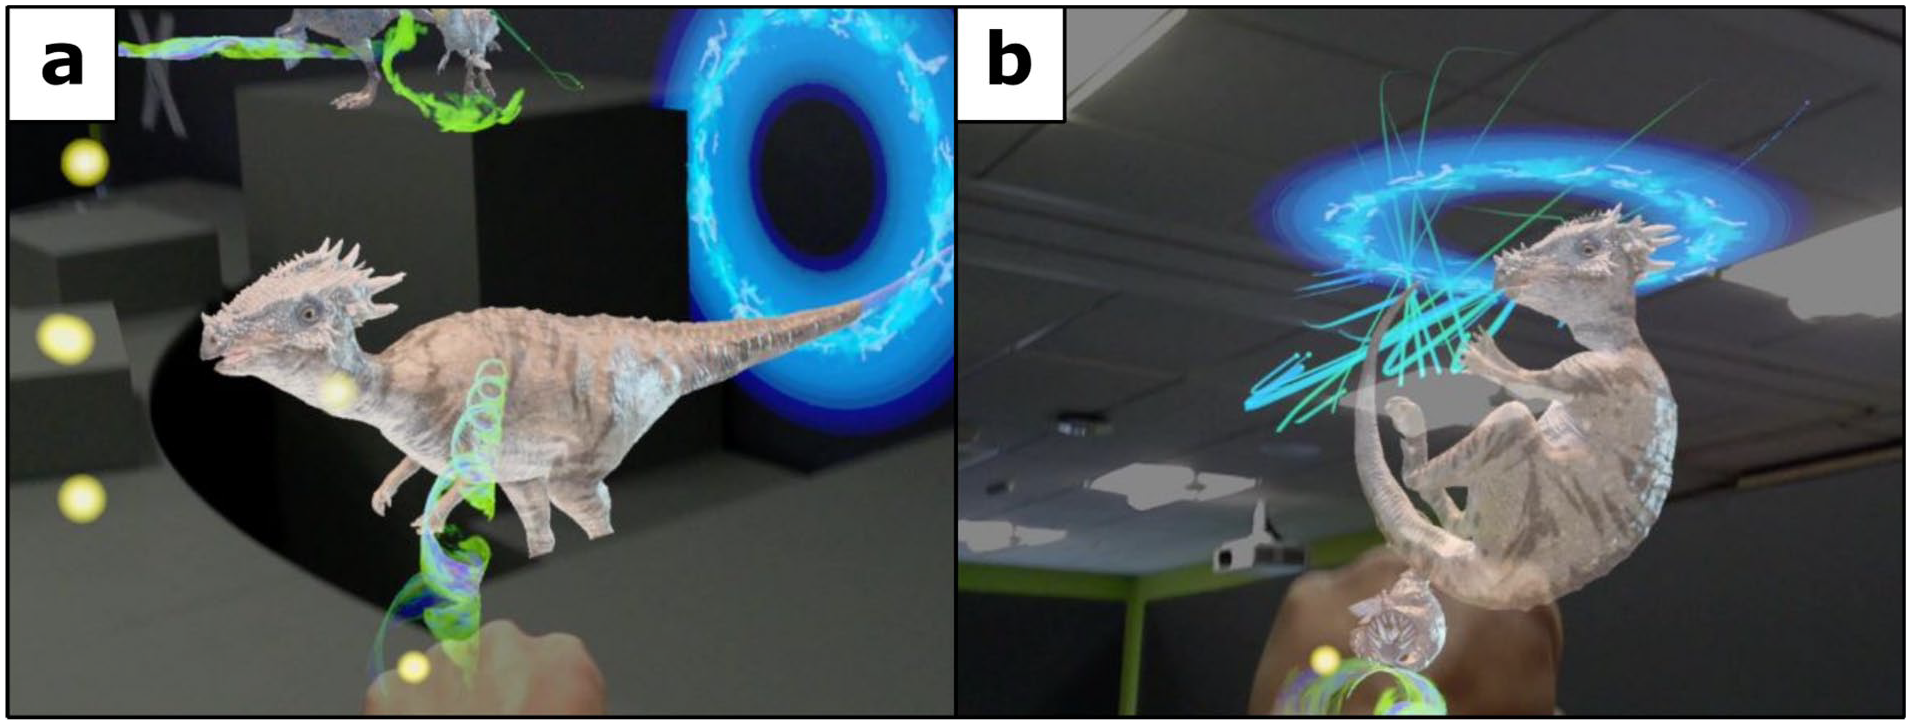
Spotting a ghost dinosaur (a) and returning it to their dimension (b).
The AR experience was developed by a consortium which included two museums. Accordingly, the authenticity of the simulated content was vital: “Even though they were ghosts, they were all scientifically accurate ghost dinosaurs and then we talked about what their species were and what time period they were from” (Lead Designer). This “known facts” (Bec et al., 2019, p. 118) approach draws upon validated information to present an accurate account of history, which is fundamental for visitor education (Mura et al., 2017). The extent to which the required hand gestures aligned with the core values of the corporate partner were also considered: We weren’t Ghostbusters; we weren’t destroying them [dinosaurs]. It was really important to the museum . . . their ethos of saving species. . . we didn’t want it to be a zapping game. . . we want to feel like we’re saving them [dinosaurs], we’re not attacking them. (Creative Director)
Participants revealed that they wanted the physical set to represent “a slightly unnerving retro café that would look like it had been attacked by something” (Creative Director). Unfortunately, “the full café did not get designed” as this stripped back physical set was scheduled to be showcased overseas at a large film festival. The qualitative insights were largely corroborated by the findings from the design intentions survey. Using Pine and Gilmore’s (1998) experience typology as a guiding framework, the AR experience was intended to provide entertainment (Mdn = 4.66) and education (Mdn = 3.50) to a greater extent than aesthetics (Mdn = 3.00) and escapism (Mdn = 2.25). Accordingly, we predict statistical equivalence between designers’ intentions and users’ realized experience for each realm of experience (H7).
Organism: Cognitive
The Lead Designer explained that the AR experience commenced with a small dinosaur that “just appears on the surface in front of you.” As the experience progresses, multiple dinosaurs appear and “they are moving around and interacting with the surfaces, they’re standing on the worktop, they’re standing on the boxes. . . every bit of physical set has a digital twin.” Presence (i.e., a sense of feeling surrounded by a realistic physical/virtual environment; Georgiou & Kyza, 2017) was clearly of significance to the design team “. . .if people didn’t get the feeling that they [dinosaurs] were actually interacting with the physical assets then that would not be completely hitting our target” (Lead Designer). This qualitative finding was substantiated by the design survey, which indicated that the experience was intended to prompt high perceptions of presence (Mdn = 6.00) and we hypothesize statistically equivalent scores among users (H8).
The analysis revealed that the peak of the experience came toward the end when a Tyrannosaurus Rex “peeks through a hole in the wall” (Art Lead). There was a high degree of expectancy that this part of the experience should comprehensively capture the visual attention of users, with a Programmer stating that “we would have failed if people were not aware or looking at the T-Rex.” Given these qualitative insights, we predict statistical equivalence between designers’ intentions and users’ realized experience in relation to visual attention toward the digital Tyrannosaurus Rex (H9).
Organism: Affective
Designers revealed that the process of equipping an AR head-mounted display in a social environment could raise users’ arousal: “there’s the potential that one headset doesn’t do what it’s supposed to do, so there’s a feeling of ‘Oh, I’m holding the group back’, there is a peer pressure almost implied” (Quality Assurance Lead). Participants explained that the early phase of the experience was designed to elicit affective responses in the pleasant, high-arousal quadrant of the Affect Grid (Russell et al., 1989): “It would be quite exciting wouldn’t it? There’s nothing to be scared of, it’s quite a cute dinosaur for the first one, isn’t it? And it should feel quite exciting and pleasant” (Creative Director). The Lead Designer added: The only time that we would go toward unpleasant feelings is probably emotions like fear and shock, which does feature in this [experience], particularly the T-Rex. . . there’s verbal “OMGs” and stepping back and it’s a punchy moment when it sticks it’s head through the wall and the audio that goes with it is really strong.
Participants explained that although not a design intention, the cessation of the experience often results in pleasant affective responses: “it is not intentionally an exciting or enjoyable moment of handing something [AR head-mounted display] back to somebody, but in practice that is what it tends to end up being” (Lead Designer). The affective journey associated with the AR experience is depicted in Figure 3. We predict an increase in users’ affective valence and a decrease in users’ arousal from pre- to post-experience, in alignment with designers’ intentions (H10).
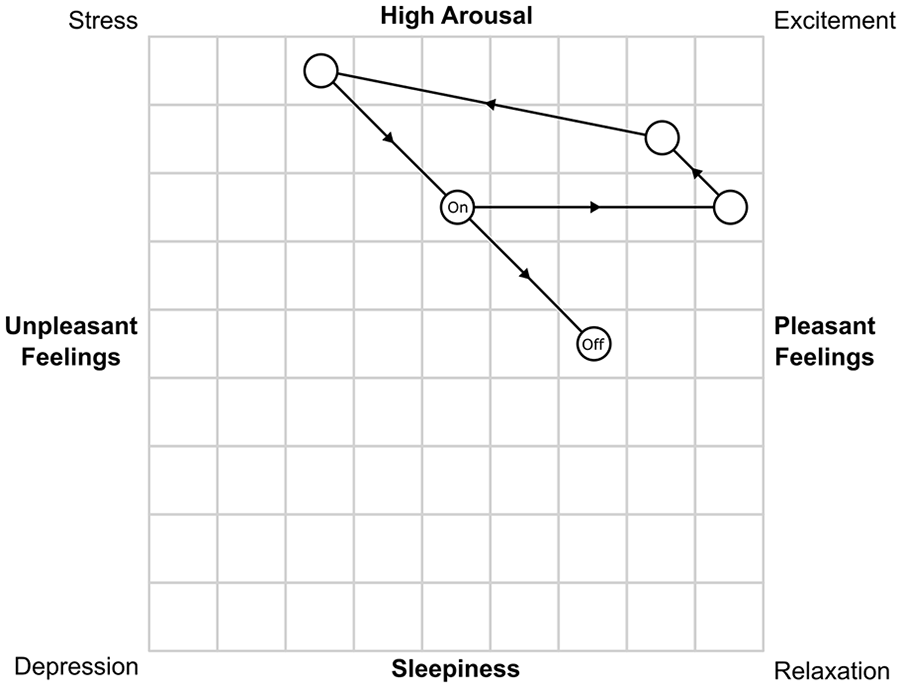
The affective journey associated with the augmented reality experience.
High scores were observed for the remembered pleasure item of the design intentions survey (Mdn = 86.00). However, the forecasted pleasure item yielded lower scores (Mdn = 70.00). Hence, it is plausible that the AR experience was designed for single, as opposed to repeated, consumption. We predict statistical equivalence between designers’ intentions and users’ realized experience for remembered pleasure and forecasted pleasure (H11).
Organism: Individual differences
Participants described the difficulties associated with developing an AR experience for a broad demographic. Devising the gameplay in accordance with the theorized demographics’ familiarity with AR appeared to help in this regard: We had to make sure that it was extremely accessible for people who had no prior use of video games, the fact that people were wearing a Magic Leap for the first time and could easily spend the first 30 seconds just going “Woah, what am I looking at?” (Lead Designer)
The AR experience catered for small groups of simultaneous users and there was evidence to suggest that shared experiences would influence visual attention: As you go through the dinosaur experience, people work out really quickly that they can steal dinosaur evidence from other people and so you start to see, and I’ve experienced it myself, you look over and see what other people are doing and sort of going “Oh right, I’m going to grab that”, the competitive nature takes over. (Quality Assurance Lead)
Response
The design survey revealed that a high level of visitor engagement (e.g., interacting with other dinosaur related materials) was intended following the cessation of the AR experience (Mdn = 4.00) and we hypothesize statistically equivalent scores to be reported by users (H12). The designers also explained that they tried to minimize negative responses for users: “Any cognitive load for them [users] beyond really simple interfaces and a really clear objective and they were going to spend the whole 5 min just staring around and going ‘Look at that!’” (Lead Designer). Examination of the SIM-TLX scores confirmed that designers intended the AR experience to prompt low levels of cognitive workload (Mdn = 3.00). Temporal demands yielded the highest designer scores (Mdn = 8.00), and this was perhaps due to the relatively short duration of the experience: Not including the on-boarding and off-boarding on either side, we aimed for 5 mins, so there was some light narrative touch but also when it came to the gameplay, we needed to be able to teach gameplay that people could get really quickly. (Lead Designer)
Bearing these findings into consideration, we hypothesize statistically equivalent cognitive workload scores from users, with temporal demands prompting the highest scores (H13).
Study 2
Methods
Participants
Ethical approval was granted by the University of Exeter Research Ethics Committee. Sample size was determined by a resource constraints approach (i.e., access to the physical set being restricted to a one-week period; Lakens, 2022). A purposive sample of 48 adults was recruited (Mage = 28.7 years, SDage = 10.6 years; 27 women, 21 men). Recruitment was conducted through word-of-mouth and facilitated by means of social media posts. Inclusion criteria stipulated that participants were 18 years of age or older without visual or auditory impairment that was not corrected for (e.g., with contact lenses). Volunteers were required to provide evidence of a negative COVID-19 lateral flow test prior to participation. Furthermore, volunteers were informed that their participation would enable entry into a raffle, which comprised five £50 gift vouchers. A sensitivity analysis was conducted in R Studio (2022.07.1) to determine the smallest effect size of interest (SESOI) in relation to a one-sample equivalence test (Lakens, 2022). Given N = 48, SD = 1.00, and α = .05, 80% power was achieved with equivalence bounds ±0.42 expressed in raw scores.
Apparatus
The physical set associated with the AR experience was assembled prior to data collection (see Figure 4). This included a semi-circular desk positioned perpendicular to a large gray wall. Several boxes were positioned on the desk that served as props for the digital content to interact with. The AR experience could accommodate up to six simultaneous users (depicted by the colored squares; see Figure 4). However, the research team restricted the number of concurrent users to a maximum of three, to maintain adequate social distancing during the COVID-19 pandemic.
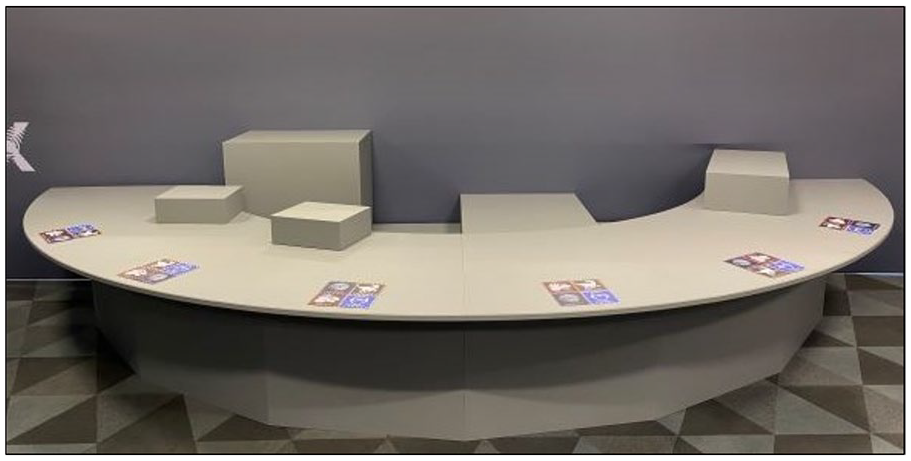
The physical set associated with the augmented reality experience.
AR head-mounted displays (Magic Leap 1; Plantation, FL, USA) were used to deliver the digital experience and to record participants’ gaze behavior. The AR device consisted of a lightweight headset tethered to a small battery pack. Additionally, handheld controllers were used to navigate through menus. Cleanbox technology (CX1; Carlsbad, CA, USA) and disinfectant wipes were employed to ensure that each AR head-mounted display and controller were thoroughly cleaned between uses.
Procedure
Data collection took place in May 2021. A cross-sectional study design was employed. Participants visited the site on one occasion to take part in the AR experience. Following COVID-19 checks, volunteers read an information sheet and provided informed consent. Thereafter, they completed a demographic questionnaire. Members of the research team demonstrated how to correctly fit and adjust the AR head-mounted display. Handheld controllers were also provided, and their functions described. Each participant was asked to stand in position around the semi-circular desk. Subsequently, volunteers completed a visual calibration of the AR head-mounted display. This process required participants to fixate on a total of 14 targets presented at a range of locations/depths and served to enhance the validity of the eye-tracking data. Upon successful calibration, volunteers took part in the AR experience which lasted approximately 5 minutes. Participants were required to “release” and “collect” evidence from the digital dinosaurs depicted via the AR head-mounted display. Following completion of the experience, participants were instructed to complete a post-experience survey.
Measures
Core affect was assessed pre- and post-experience using the Affect Grid (Russell et al., 1989). All measures contained in the post-experience survey echoed those of the design intention survey, but without adjustment to the stem of each item. The stimulus content was measured using items developed by tom Dieck et al. (2018) in relation to Pine and Gilmore’s (1998) four realms of experience. Presence was assessed by the Augmented Reality Immersion questionnaire (Georgiou & Kyza, 2017). Remembered pleasure and forecasted pleasure were measured using visual analogue scales (Lishner et al., 2008; Zenko et al., 2016). User engagement was assessed using items derived from tom Dieck et al. (2018). Furthermore, cognitive workload was measured using the SIM-TLX (Harris, Wilson, et al., 2020). Additional details (e.g., anchors) are presented in Study 1 and all items are contained in Supplemental Material 2.
Data analysis
Supplemental Material 3 describes the data screening associated with the objective eye-tracking data. The survey data were screened for univariate outliers in R Studio (2022.07.1) using standardized z-scores (z > ±3.29; Tabachnick & Fidell, 2019). Tests revealed six outliers and in all instances, the score was adjusted by assigning the outlying cases a raw score that was one unit smaller or larger than the next most extreme score in the distribution until z < ±3.29 (Tabachnick & Fidell, 2019). The distributional properties of the data were examined visually by means of normal Q–Q plots and histograms (Coolican, 2018).
Tests of the distributional properties of the data revealed violations of normality in 15 of the 23 cells of the analysis (three at p < .05, four at p < .01, and eight at p < .001). Scholars have raised concerns about the transformation of subjective data derived from Likert scales (Nevill & Lane, 2007). Hence, these data were not transformed. Subsequently, non-parametric analyses were employed. Such analyses were deemed appropriate given that skewness values frequently exceeded twice the standard error of the dependent variables (Coolican, 2018; see Supplemental Material 4). User responses were assessed by means of Spearman’s rho correlations and Wilcoxon rank sum tests. Holm-Bonferroni corrections were applied to help control family-wise error and significance was accepted at p < .05.
One-sample Wilcoxon signed rank tests were used to examine statistical equivalence between designers’ intentions and users’ realized experience. This procedure involved conducting two one-sided tests (TOSTs) to determine whether the location shift was sufficiently close to zero to reject the presence of a meaningful difference. The SESOI was used to set symmetrical equivalence bounds around designers’ intended experience in raw scores (e.g., ±0.42 on a 5-point scale, ±0.59 on a 7-point scale). Statistical equivalence was established when the larger of the two p values was smaller than alpha (.05; Lakens et al., 2018). All analyses were conducted in R Studio (2022.07.1) and the associated markdown files are available online (https://osf.io/BT3UV/).
Results and Discussion
All research hypotheses associated with the present investigation are reiterated in Supplemental Material 5.
User responses
Spearman’s rho correlations were used to examine the relationships between visitor engagement and presence, visual attention, remembered pleasure, and forecasted pleasure. A moderate positive relationship was observed between presence and visitor engagement (rs = .38, n = 48, p < .01; see Figure 5a), providing partial support for H1. However, visual attention toward digital assets was not associated with visitor engagement (p > .05; see Figure 5b). This was a rather unexpected finding that opposes the predictions of SOR models (e.g., Suh & Prophet, 2018). Large positive relationships were observed between remembered pleasure–visitor engagement (rs = .52, n = 48, p < .001; see Figure 5c) and between forecasted pleasure–visitor engagement (rs = .49, n = 48, p < .001; see Figure 5d), leading to the acceptance of H2.
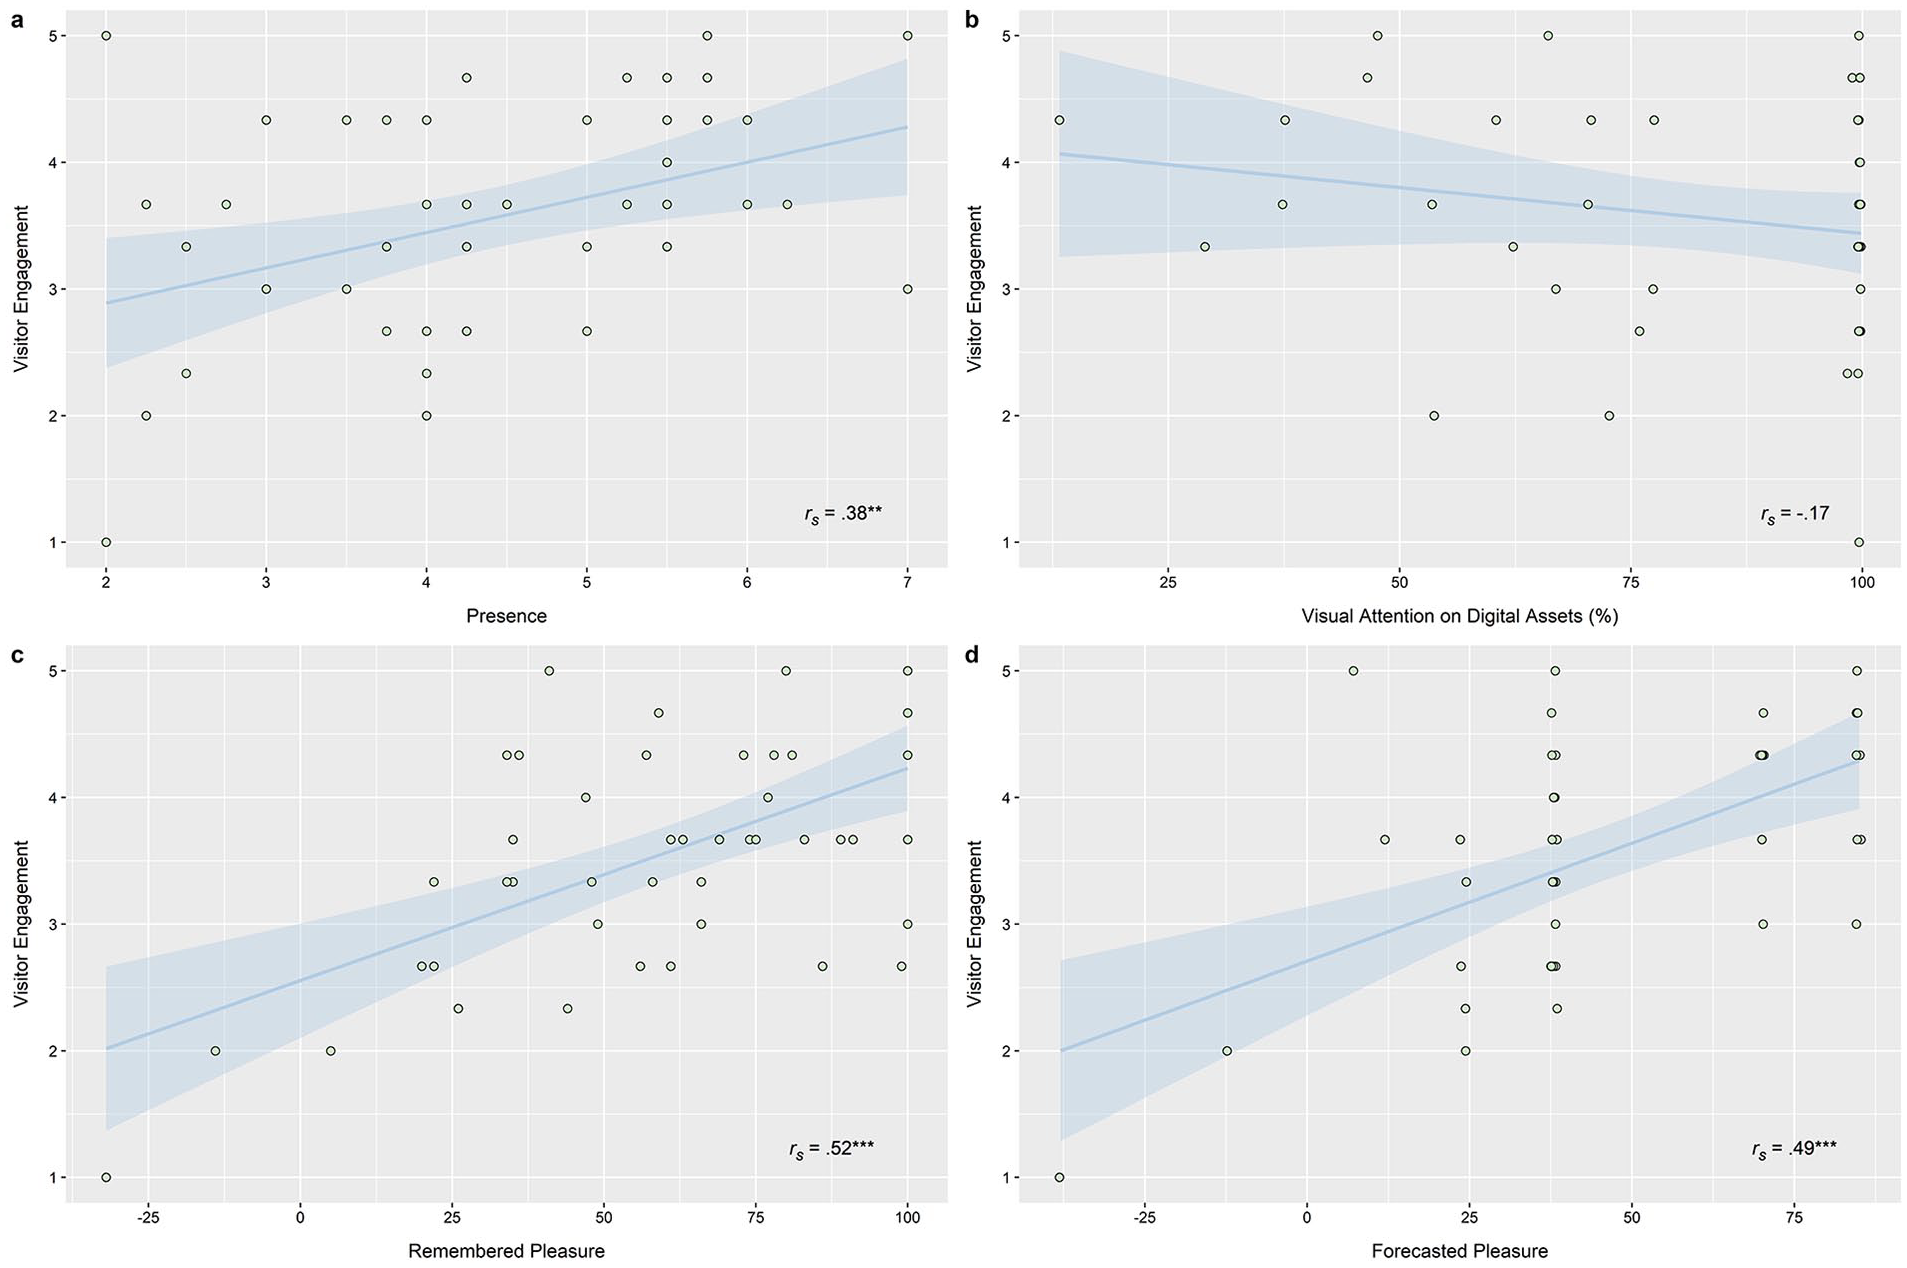
Correlation plots between visitor engagement and presence (a), visual attention (b), remembered pleasure (c), and forecasted pleasure (d).
H3 was not accepted given that the relationships between affective variables–visitor engagement were stronger than those between cognitive variables–visitor engagement. These findings oppose recent VR-related research (Kim et al., 2020). Nonetheless, the results contribute toward a growing corpus of work that emphasizes the importance of affective phenomena in tourism (Godovykh & Tasci, 2020a).
Wilcoxon rank sum tests were employed to examine the effects of experience type (i.e., individual vs. shared) on presence, visual attention, remembered pleasure, forecasted pleasure, and visitor engagement. The analyses indicated that the differences were negligible and statistically non-significant (ps > .05; see Supplemental Material 6). Researchers have frequently suggested that social interaction is integral for desirable outcomes in tourism (Chen et al., 2020; Wei et al., 2019). Hence, the present findings were somewhat unexpected and prohibited the acceptance of H4–6. It is possible that the AR experience was not of sufficient length (i.e., 5 minutes) to induce the hypothesized differences between individual and shared AR experiences.
Intended and realized experience
Stimulus
The TOST procedure (SESOI = 0.42) indicated statistical equivalence between designers’ intended experience and users’ realized experience for entertainment (p = .004) and education (p = .001). However, users’ aesthetics and escapism scores were not equivalent to designers’ intentions (ps > .05; see Figure 6), which prevented the full acceptance of H7. It is noteworthy that such discrepancies are not inherently negative, as users’ scores for aesthetics and escapism surpassed those of the designers (see Figure 6). This is particularly encouraging given that rich experiences are theorized to comprise elements from all four realms (Pine & Gilmore, 1998).
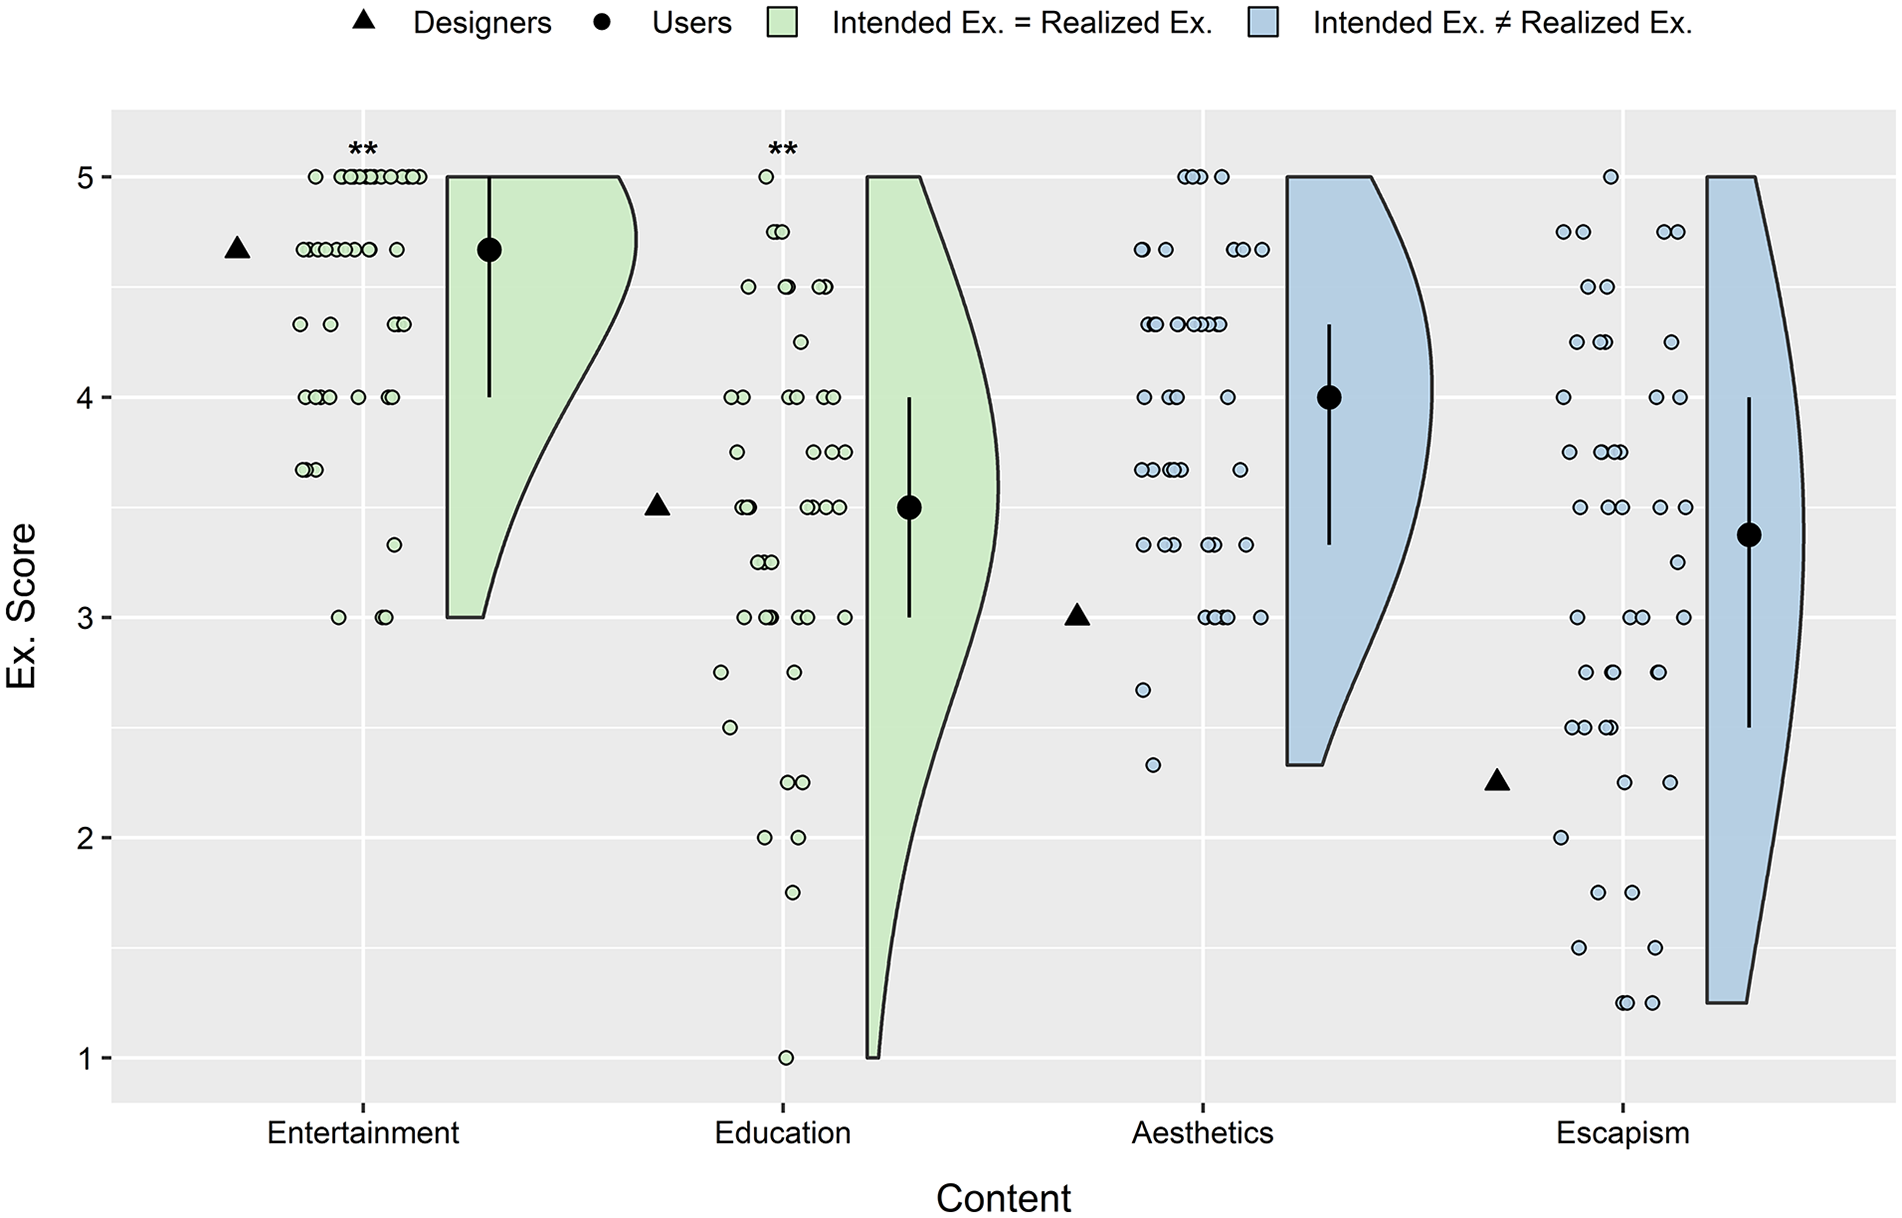
Raincloud plot depicting designer and user scores for each realm of experience proposed by Pine and Gilmore (1998).
Organism: Cognitive
Statistical equivalence was not established in relation to presence scores (SESOI = 0.59; p > .05; see Figure 7a), which precluded the acceptance of H8. Presence in AR was conceptualized as a sense of feeling surrounded by a realistic physical/virtual environment (Georgiou & Kyza, 2017). However, a component of VR presence concerns plausibility, which refers to the illusion that the depicted events are really happening (Slater & Sanchez-Vives, 2016). It is possible that users’ presence scores were impaired by the implausibility of experiencing dinosaurs, an extinct species, in their immediate environment. An alternative explanation is that the incomplete physical set (see Figure 4) compromised users’ perception of presence.
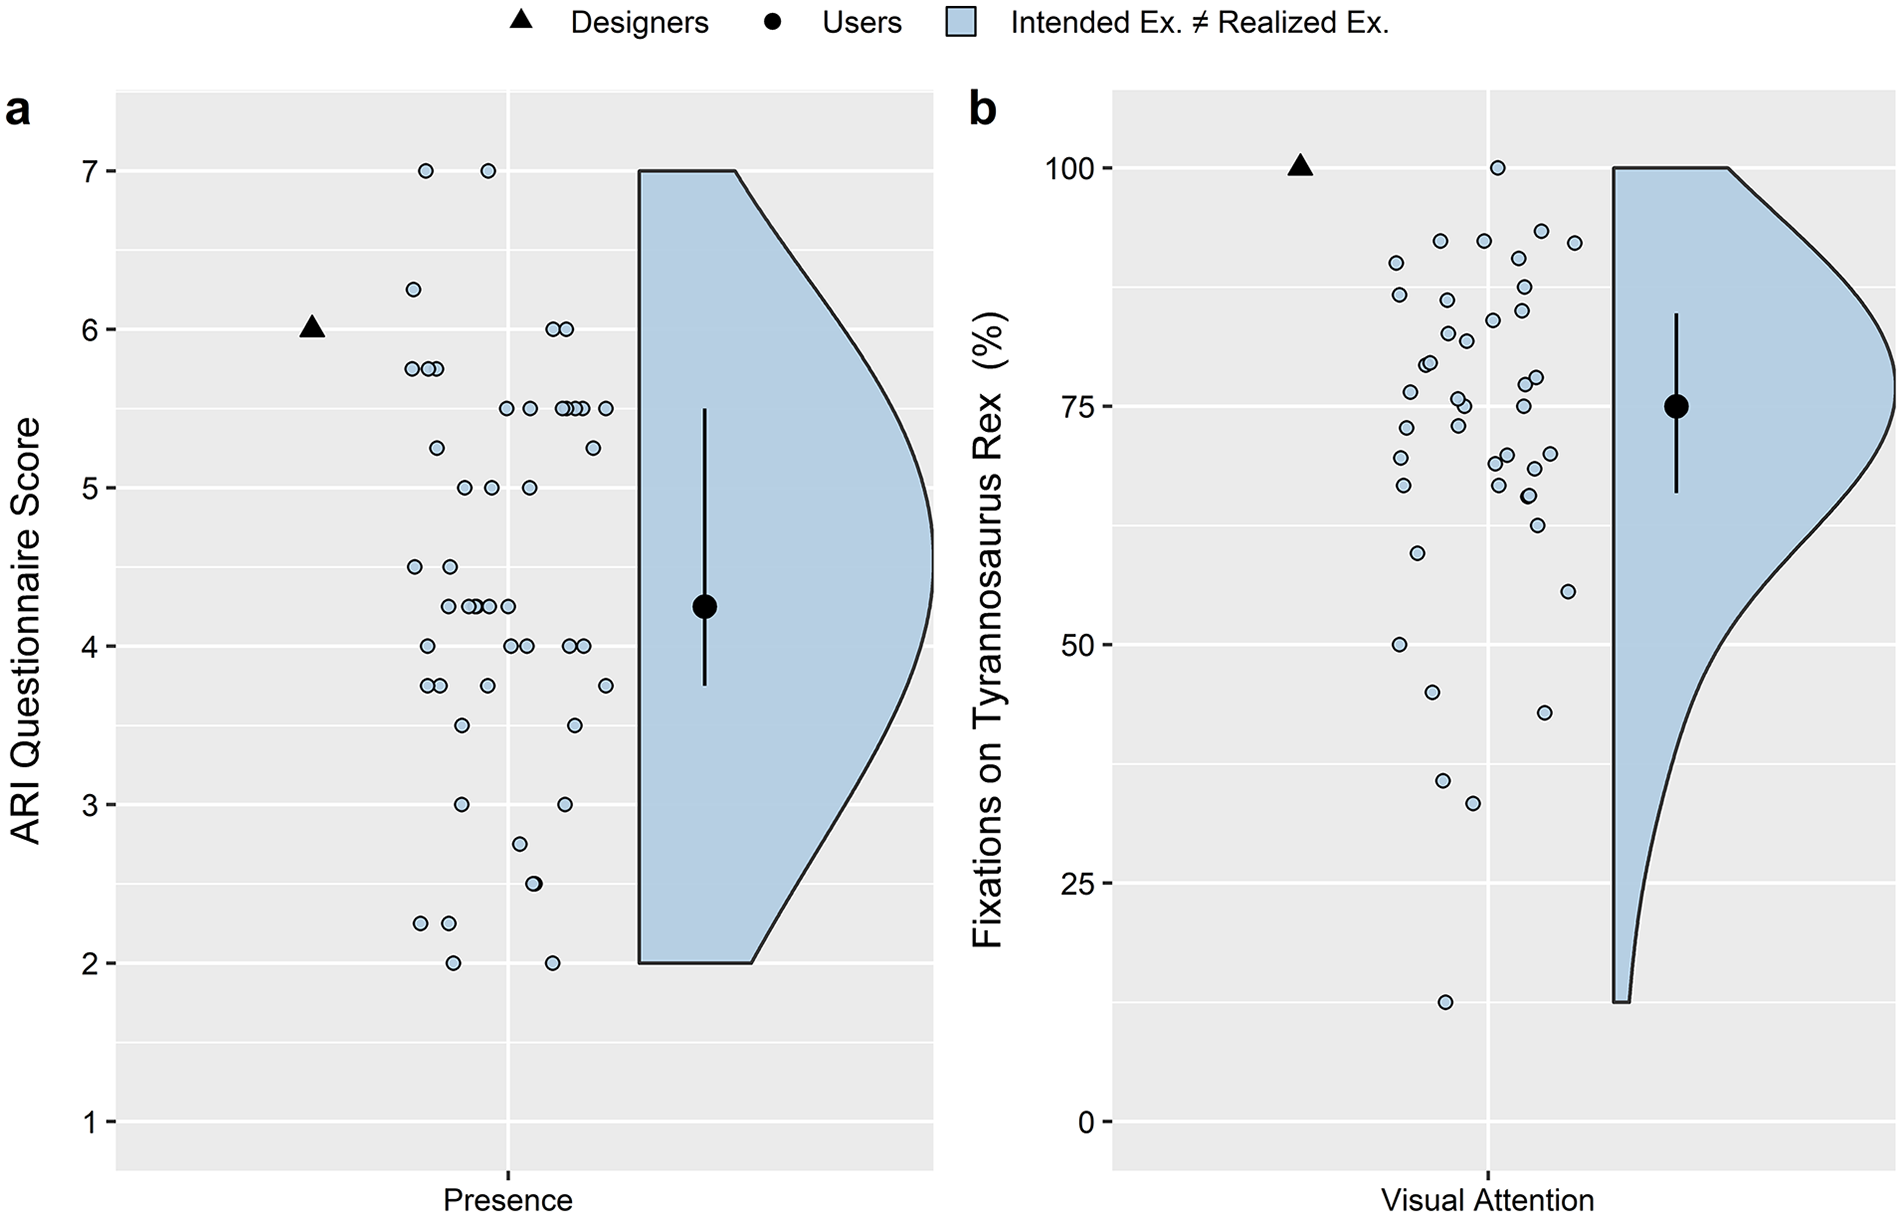
Raincloud plots depicting designer and user scores for presence (a) and visual attention (b).
This investigation entails one of the first attempts in tourism to employ eye-tracking in AR. The digital Tyrannosaurus Rex appeared to have captured users’ visual attention effectively (Mdnfixations = 75%), albeit that statistical equivalence was not established with the designers’ high expectations (SESOI = 8.40; p > .05; see Figure 7b), leading to the non-acceptance of H9. Notwithstanding, this is a promising finding given that immersive technology allows users to navigate a scene in 360°, in stark contrast to traditional modes of display (e.g., television screens; Discombe et al., 2022). Moreover, the Tyrannosaurus Rex was depicted toward the end of the AR experience, at a time when visitors are more likely to encounter satiation (i.e., reduced attention owing to repeated exposure; Rainoldi et al., 2020).
Organism: Affective
Affective valence increased from pre- to post-experience, p < .001, r = .66, in accordance with designers’ intentions. This is encouraging given the high affective valence scores reported prior to the AR experience (Mdn = 7.00). Arousal scores increased from pre- to post-experience, contrary to designers’ intentions, which prevented the full acceptance of H10. Nonetheless, these findings indicate that AR experiences can elicit responses from the pleasant, high-arousal quadrant of the Affect Grid (Russell et al., 1989). This supports related research concerning AR travel guides (Kourouthanassis et al., 2015).
There was no evidence of statistical equivalence following the TOST procedure for either remembered pleasure or forecasted pleasure (SESOI = 16.80; ps > .05), leading to the non-acceptance of H11 (see Figure 8a and b). Nevertheless, a promising finding to emerge from the present investigation concerns the high scores reported for remembered pleasure (Mdn = 62.00), with 95.84% of users appraising the experience positively (i.e., scores >0; see Figure 8a). Researchers have recently emphasized the importance of measuring remembered pleasure (Godovykh & Tasci, 2020b). This is because decisions about future intentions are often predicated on memories. Hence, the present investigation provides some initial support that purpose-built AR experiences can be viable in the tourism domain.
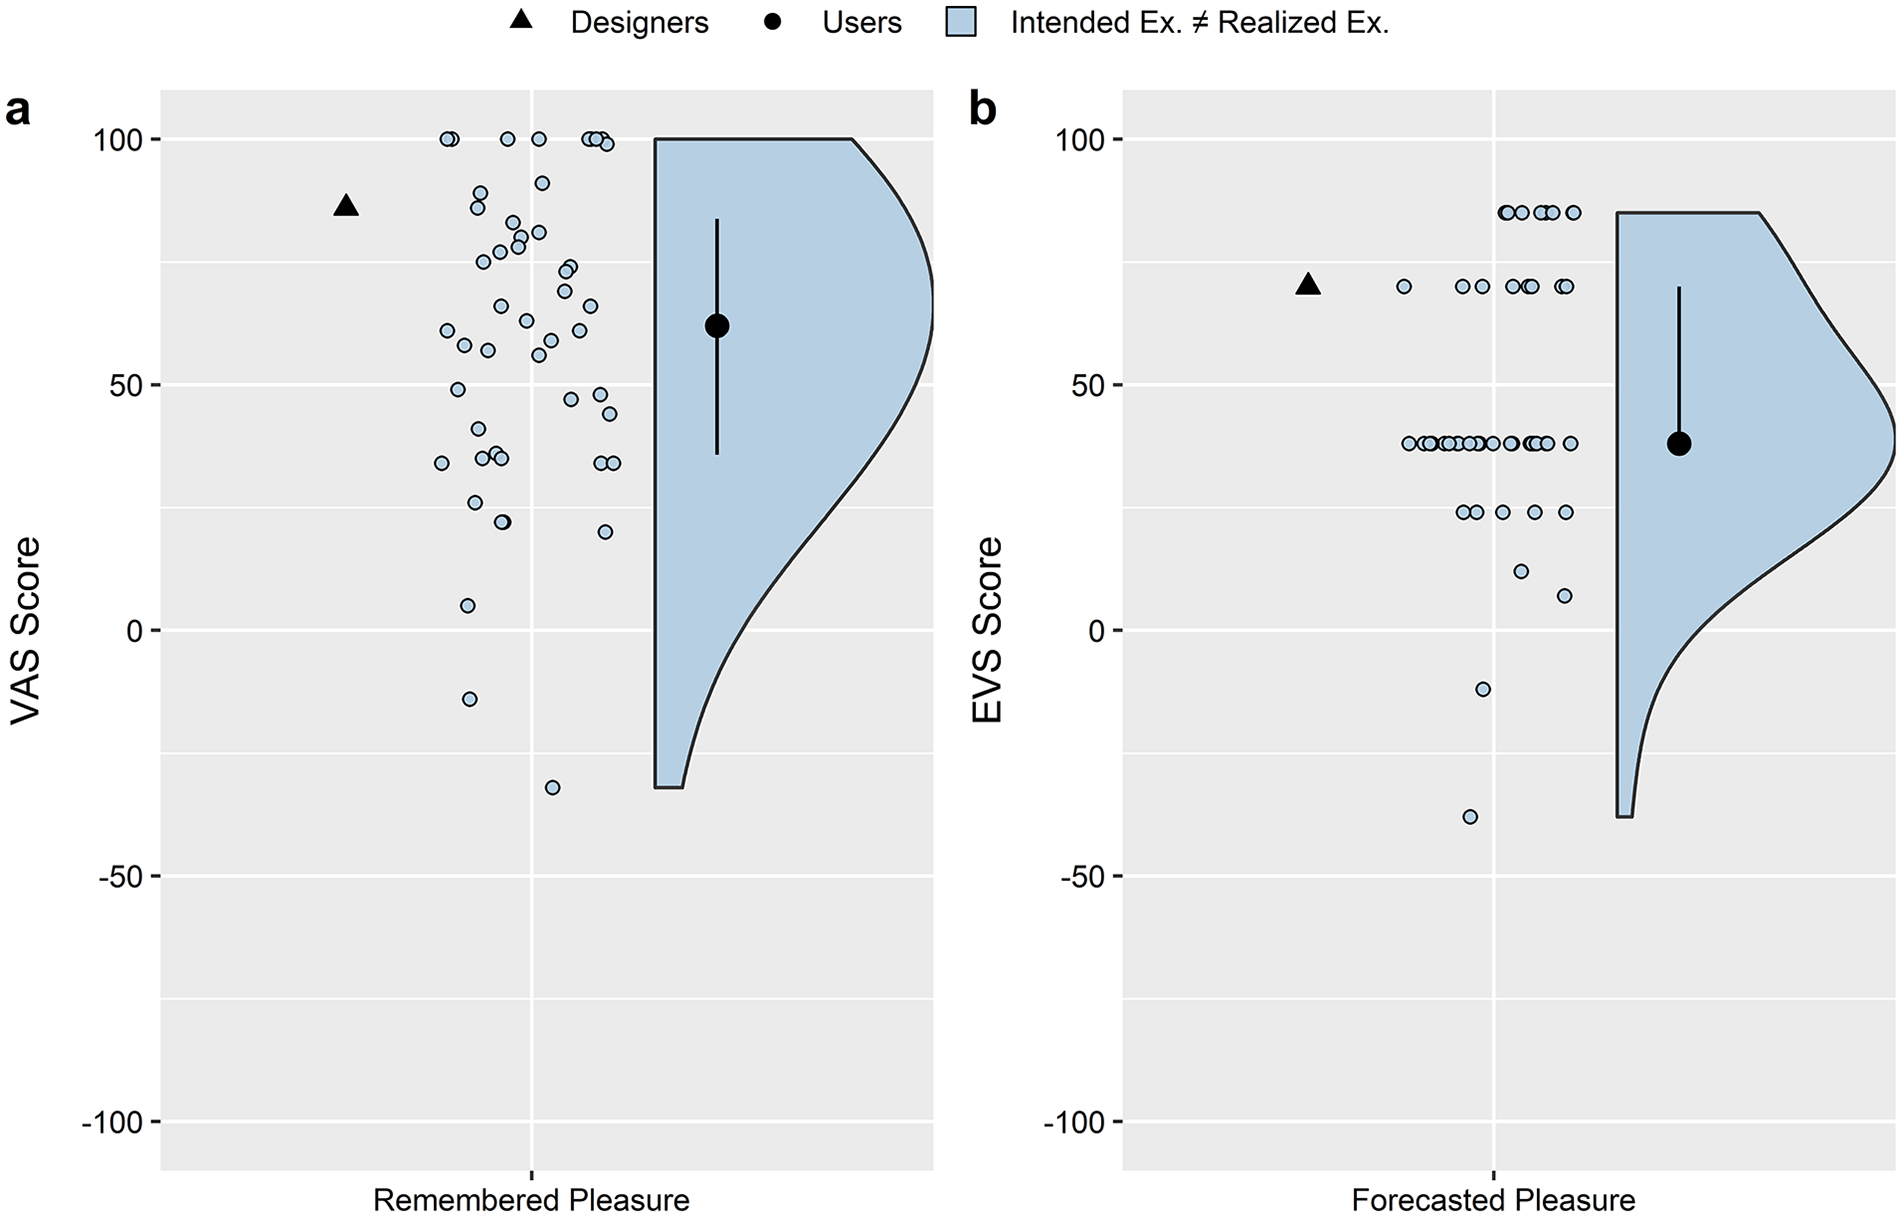
Raincloud plots depicting user and designer scores for remembered pleasure (a) and forecasted pleasure (b).
Response
Equivalence tests were non-significant for engagement scores (SESOI = 0.42; p > .05), precluding the acceptance of H12. Nonetheless, the user engagement scores were moderate (Mdn = 3.66) and analogous to those obtained in other AR-related investigations in tourism (tom Dieck et al., 2018). These findings indicate that users were likely to engage with the subject matter following the completion of the AR experience. Visitor engagement is frequently cited as an important outcome of museums and so these findings attest to the potential of AR to bring the museum experience to life in an engaging manner (Serravalle et al., 2019).
Regarding negative responses, the TOST procedure (SESOI = 1.76) indicated statistical equivalence for physical demands (p = .022) and task complexity (p = .012) components of cognitive workload (see Figure 9). The remaining seven components did not reach statistical equivalence (ps > .05). With the exception of the distractions component, user scores were higher than those intended by the design team (see Figure 9). Many of the participants in the present investigation were unfamiliar with head-mounted AR devices and this could help explain the high scores observed in the task control component, which refers to the ease at which the task can be navigated (Harris, Wilson, et al., 2020).
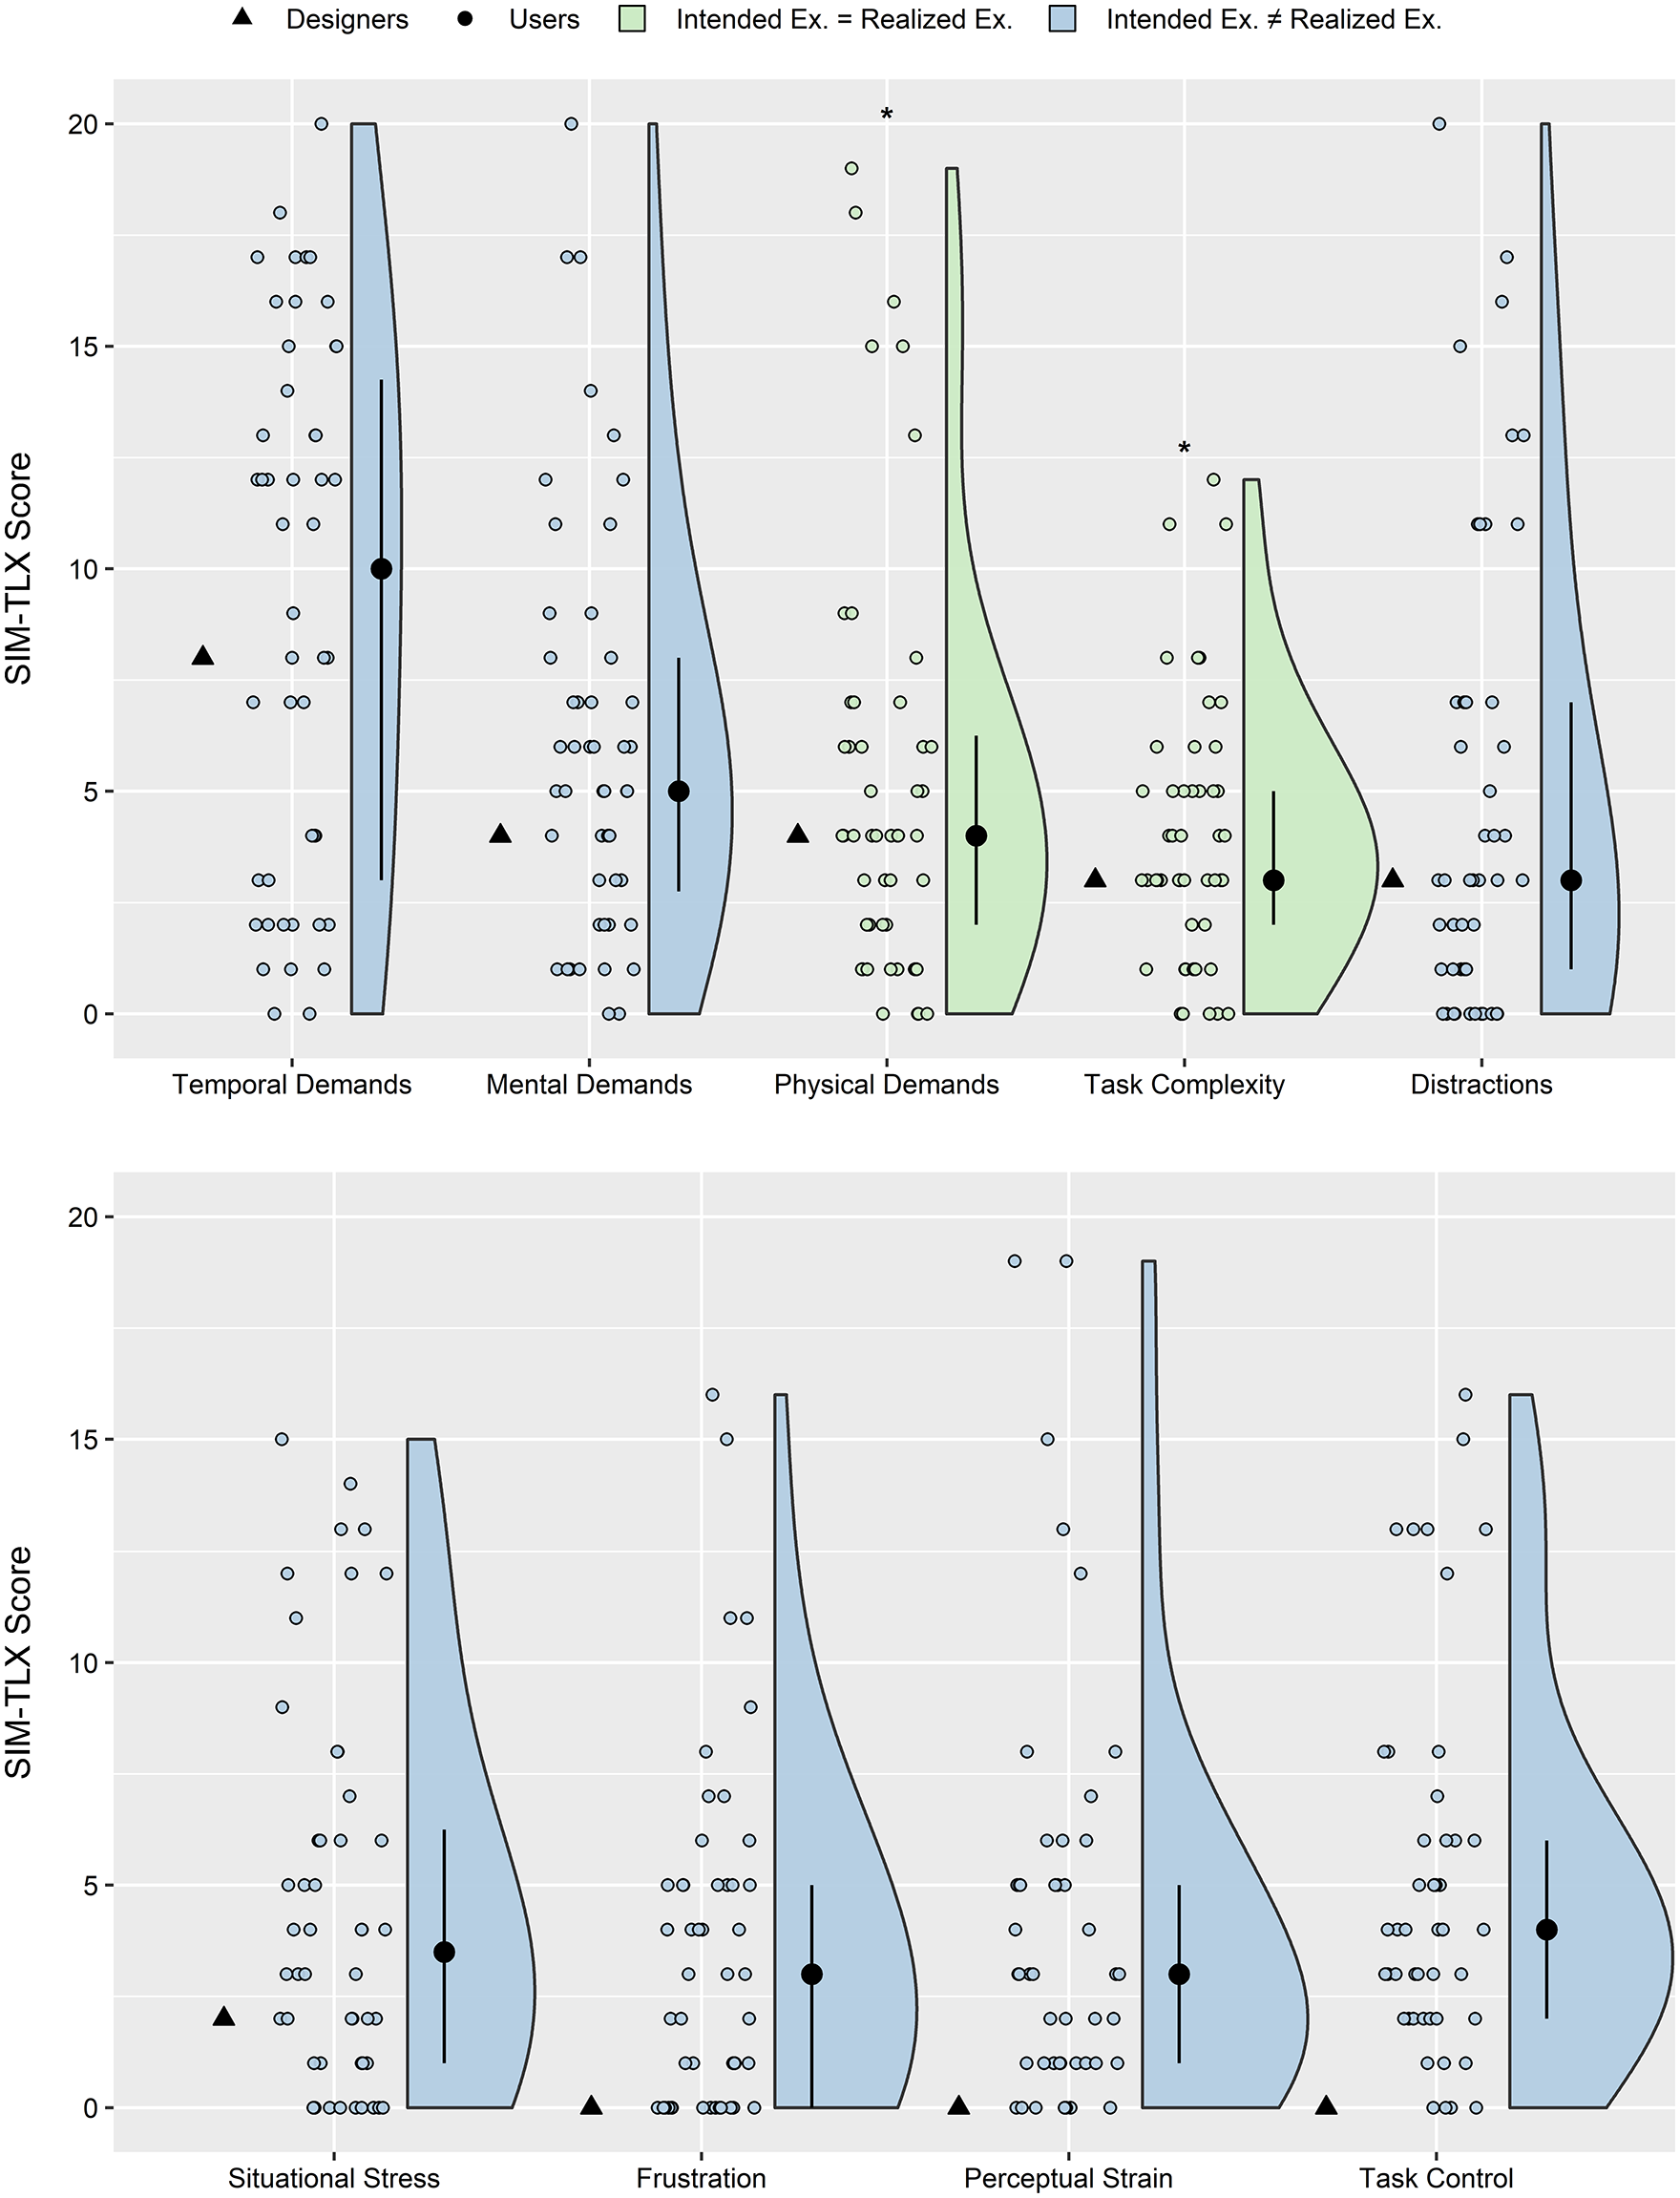
Raincloud plots depicting designer and user scores for cognitive workload.
General Discussion
AR design and user experience are often described as separate streams of research in tourism (Jingen Liang & Elliot, 2021) and yet focusing on either perspective in isolation only provides a partial view of the visitor experience (Dube et al., 2015; Ponsignon et al., 2017). Accordingly, this multi-study investigation makes an important methodological contribution to the extant literature by assessing the extent to which users’ realized experience aligned with designers’ intended experience. An important theoretical contribution of the work concerns the development of a tourism-specific SOR model (see Figure 1) that depicts the relationships between an AR experience, users’ internal states, and their associated behavior.
The aim of Study 1 was to explore the design intentions underlying a multi-user AR experience developed for a museum context. A mixed methods approach was adopted and the findings integrated to facilitate a comprehensive understanding of the subject matter. For example, the design intention survey revealed that the designers envisioned the AR experience to be entertaining and educational. Researchers have emphasized the importance of these constructs, often referred to as edutainment, in enabling successful visitor experiences in cultural contexts (Ponsignon et al., 2017). Hence, these findings provide some initial support for the applicability of AR in tourism.
The primary aim of Study 2 was to assess the extent to which users’ realized experience aligned with the designers’ intended experience. When considering this across the entirety of the SOR model, it appears that the greatest congruence was found in relation to the stimulus (see Figure 10). The designers’ most pertinent realms of experience (i.e., entertainment and education) prompted statistically equivalent responses from users. Encouragingly, users also reported high scores for aesthetics and escapism, which alludes to the quality of the AR experience (Pine & Gilmore, 1998).
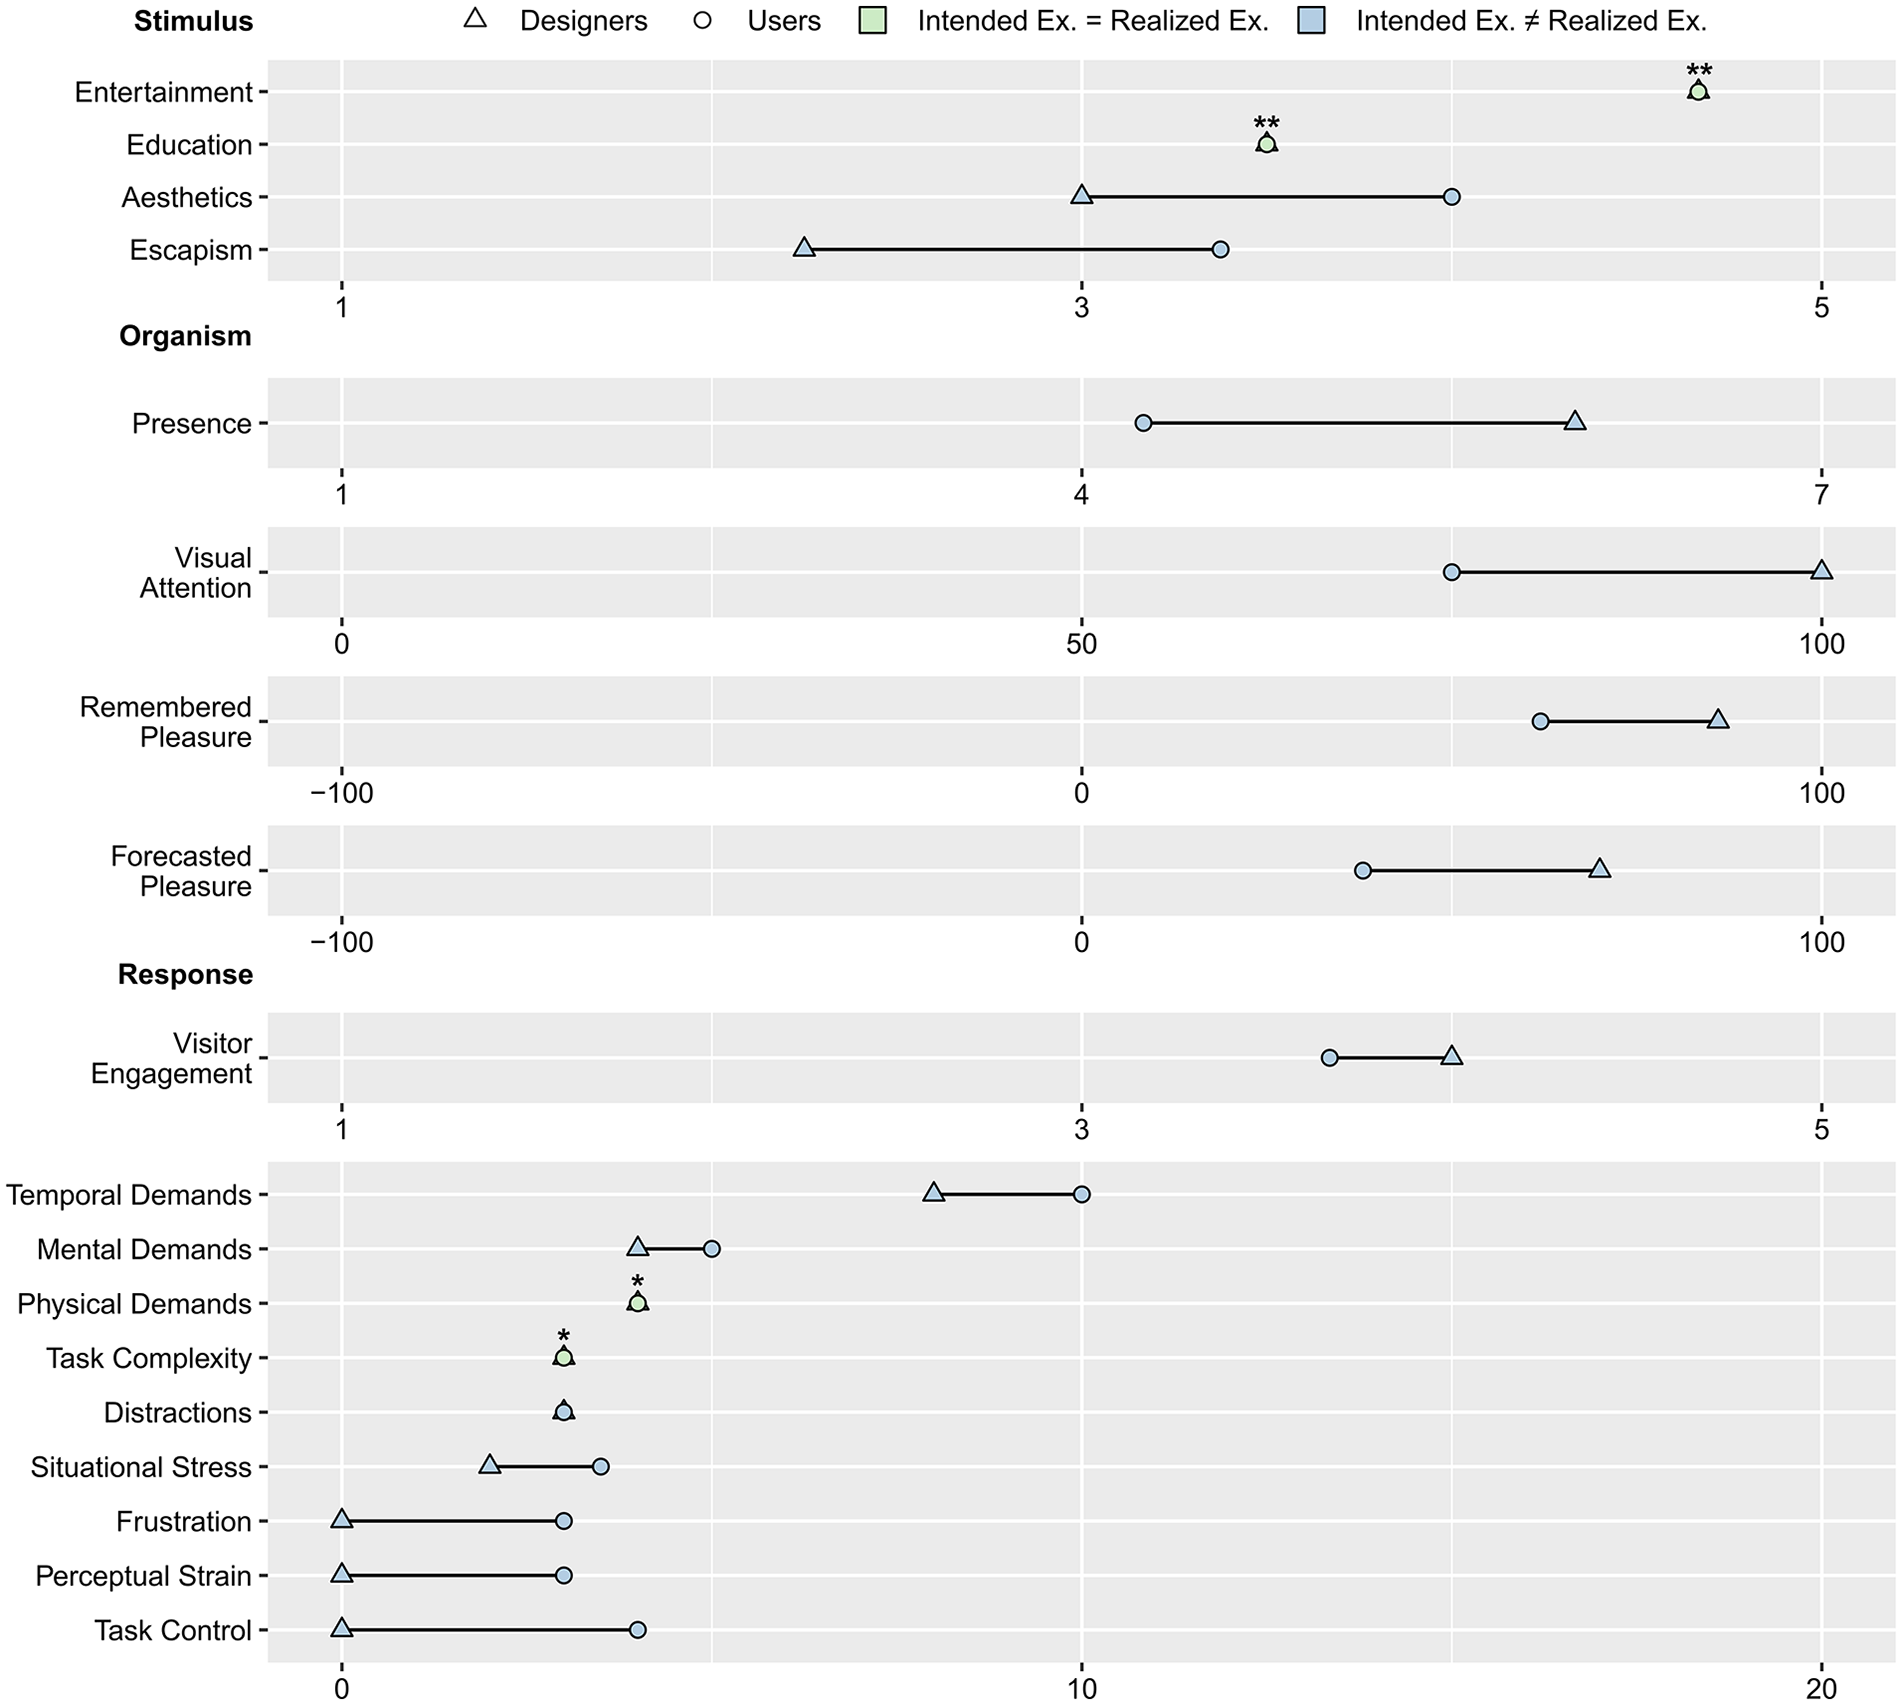
Dumbbell plot depicting designer and user median scores for each construct across the Stimulus-Organism-Response model.
Further inspection of the findings reveals that intended and realized experience began to significantly diverge at the organism and response levels. Collectively, the findings support the notion that the design team were adept at creating an AR experience and had a sound knowledge of how users would categorize such content. However, it appears that there is an opportunity for designers to refine their expectations of how AR experiences impact users at the cognitive, affective, and behavioral levels. Some disparities between designers’ intended and users’ realized experience are to be expected, given the recency of AR head-mounted displays (Jingen Liang & Elliot, 2021). Nonetheless, the volume of discrepancies speaks to the value of examining intended and realized experience concurrently, while placing particular emphasis on how experiences affect individuals at the organism and response levels (Scott & Le, 2017). Designers might consider the use of A/B testing to reduce any major disparities between intended and realized experience (King et al., 2017).
Theoretical Implications
AR is increasingly being implemented in tourism contexts (Loureiro et al., 2020). However, there is a paucity of research examining the factors that impact visitor behavior in relation to immersive technology use (Kim et al., 2020). Accordingly, a secondary aim of Study 2 was to examine the relationships between users’ internal states and their associated behavior in relation to the AR experience. The findings provide scholars with several theoretical insights. For example, we found positive relationships between visitor engagement and presence, remembered pleasure, and forecasted pleasure (see Figure 5). These findings support the theoretical predictions of SOR models (Jacoby, 2002; Suh & Prophet, 2018), which hold that cognitive and affective states are associated with behavioral responses.
An interesting theoretical insight to emerge from the present investigation is that affective variables (i.e., remembered pleasure, forecasted pleasure) were more strongly associated with positive responses (i.e., visitor engagement) when compared to cognitive variables (i.e., presence, visual attention). However, it is noteworthy that the cross-sectional design employed herein precludes any claim of causality. Therefore, an alternative explanation for the present findings is that greater visitor engagement leads individuals to derive more positive affective responses from AR experiences.
Suh and Prophet (2018) explained that a range of individual differences can moderate the effects of immersive technology use at the organism and response levels. We sought to examine the effects of shared experiences against individual experiences given the prominent role that social interaction is theorized to play in tourism (Chen et al., 2020; Wei et al., 2019). The differences were negligible and statistically non-significant, but it is noteworthy that shared experiences constituted groups of two or three individuals. Hence, it is plausible that the small group sizes were insufficient to produce the hypothesized differences when compared to individual users. AR experiences are likely to cater for larger groups of simultaneous users as this form of technology becomes increasingly accessible.
Managerial Implications
The present investigation yields several implications for tourism managers. Researchers have previously demonstrated how AR can enhance the visitor experience by providing additional information about existing artifacts (Jung et al., 2016). The AR content in such work is typically presented to the visitor via smartphone technology which, despite being highly accessible, can be a rather solitary experience. The current findings advance this nascent line of inquiry by providing support for the efficacy of purpose-built, multi-user AR experiences that are presented through head-mounted displays. Support is evidenced by a wealth of positive user ratings across the employed SOR model (see Figure 10).
The findings revealed high user scores across each of Pine and Gilmore’s (1998) four realms of experience. Objective eye-tracking data derived from the AR head-mounted display provides some initial encouragement that digital assets can be used to good effect in sustaining visitors’ visual attention. Affective responses were also positive, which increases the likelihood of users sharing their experiences on social networks (Serravalle et al., 2019). Finally, users reported high scores for engagement, which is vital for the sustainability of tourism sites such as museums (Barron & Leask, 2017).
Findings from the focus group in Study 1 shine a light on how tourism managers can work in collaboration with AR designers to produce authentic experiences. The designers capitalized on validated information provided by a museum to present a scientifically accurate representation of dinosaurs in AR. This is important, as researchers have suggested that a “known facts” approach is essential for visitor education (Bec et al., 2019; Mura et al., 2017). The qualitative findings also speak to some of the challenges that designers are likely to encounter when developing similar experiences for tourism contexts. Foremost amongst these, are catering for visitors with varied levels of technical expertise and allowing sufficient time for on/offboarding.
We have also shown that purpose-built AR experiences can be effective with very little in the way of a physical set (see Figure 4). Pragmatically, this means that tourism managers can host engaging experiences without the need for visitors to gather around delicate artifacts, thereby reducing overcrowding, which has been associated with several negative outcomes (e.g., safety concerns; Yu & Egger, 2021).
Tourism managers are routinely encouraged to be receptive to new approaches pertaining to the design and analysis of visitor experiences. For example, Stienmetz et al. (2021) suggested that summary evaluations alone (e.g., SERVQUAL; Parasuraman et al., 1988) are insufficient when managing and designing tourism experiences. Consequently, there is a need to complement such measures with those that capture the sequence of events as they unfold over time (Stienmetz et al., 2021). Accordingly, it is hoped that tourism managers might employ a similar approach to that conducted in Study 2, which entailed user response data pre- (e.g., affective responses), during (i.e., visual attention), and post-experience (e.g., visitor engagement).
Limitations and Future Directions
The sample of users who took part in the present investigation was smaller than those samples employed in other immersive technology-related studies (e.g., Kim et al., 2020). Nonetheless, the sample of users (n = 48) sits comfortably toward the higher end of studies that have incorporated eye-tracking in tourism (i.e., N = 12–63; Rainoldi & Jooss, 2020). The AR head-mounted display identified when users’ gaze intersected with digital assets. A logical extension to the present investigation would entail an exploration of users’ gaze behavior in relation to the digital, physical, and social elements of an AR experience (Bolton et al., 2018). The intended experience could be measured from the perspectives of the service provider (e.g., visitor experience officers) in addition to those responsible for AR development. Equivalence tests were employed to determine whether users’ realized experience aligned with designers’ intended experience. However, researchers might explore whether users’ experience exceeds designers’ intentions through superiority tests.
We captured designers’ intended affective journey on a scene-by-scene basis (see Figure 3). However, we refrained from collecting users’ affective responses during the AR experience, as completing even single-item subjective measures would have impaired the associated eye-tracking data. Researchers might seek to employ objective measures of affective phenomena, such as skin conductance or electromyography. Combining such measures with eye-tracking would allow researchers to objectively assess the cognitive and affective states of users while they seamlessly engage with AR technology.
A cross-sectional research design was used in relation to the user testing and therefore the findings should be viewed within the frame of association. Researchers are encouraged to employ experimental designs to further the study of AR in tourism, as this would permit claims of causality. For example, assessing the visitor experience with and without such immersive technology would offer a useful addition to this line of research. The observed remembered/forecasted pleasure scores provided some initial support that users are likely to re-engage with AR technology (Karl et al., 2021). Nonetheless, longitudinal research is required to comprehensively assess the sustainability of AR technology. This research might take place beyond a museum context to scrutinize the generalizability of the present findings. Finally, we arranged constructs of interest in alignment with a SOR model (see Figure 1). Such frameworks hold value to site managers and researchers alike. However, future work might expand the framework employed herein and consider the development of valid and reliable inventories that can help assess purpose-built AR experiences in tourism.
Conclusion
The present investigation contributes toward an emerging corpus of AR-related research in tourism (Loureiro et al., 2020). AR design and user experience research are often conducted separately (Jingen Liang & Elliot, 2021), despite there being considerable value in identifying the gaps between designers’ intentions and users’ realized experiences (Ponsignon et al., 2017). Accordingly, data were collected from designers using mixed methods, which allowed them an opportunity to convey their intent for the AR experience. Subsequently, this data served as a foundation upon which to compare users’ experiences against (Smit et al., 2021). This represents a more nuanced approach to visitor experience evaluation, which typically entails comparisons between visitors’ expectations and their associated experiences (Ponsignon et al., 2017). Disparities were observed between designers’ intended and users’ realized experience, particularly at the organism and response levels. Nonetheless, the present findings are encouraging given the infancy of AR head-mounted displays and provide a vista for tourism offerings in the envisioned metaverse.
Supplemental Material
sj-docx-1-jtr-10.1177_00472875221134031 – Supplemental material for A Magic Leap in Tourism: Intended and Realized Experience of Head-Mounted Augmented Reality in a Museum Context
Supplemental material, sj-docx-1-jtr-10.1177_00472875221134031 for A Magic Leap in Tourism: Intended and Realized Experience of Head-Mounted Augmented Reality in a Museum Context by Jonathan M. Bird, Philip A. Smart, David J. Harris, Laura A. Phillips, Gabriella Giannachi and Samuel J. Vine in Journal of Travel Research
Supplemental Material
sj-docx-2-jtr-10.1177_00472875221134031 – Supplemental material for A Magic Leap in Tourism: Intended and Realized Experience of Head-Mounted Augmented Reality in a Museum Context
Supplemental material, sj-docx-2-jtr-10.1177_00472875221134031 for A Magic Leap in Tourism: Intended and Realized Experience of Head-Mounted Augmented Reality in a Museum Context by Jonathan M. Bird, Philip A. Smart, David J. Harris, Laura A. Phillips, Gabriella Giannachi and Samuel J. Vine in Journal of Travel Research
Supplemental Material
sj-docx-3-jtr-10.1177_00472875221134031 – Supplemental material for A Magic Leap in Tourism: Intended and Realized Experience of Head-Mounted Augmented Reality in a Museum Context
Supplemental material, sj-docx-3-jtr-10.1177_00472875221134031 for A Magic Leap in Tourism: Intended and Realized Experience of Head-Mounted Augmented Reality in a Museum Context by Jonathan M. Bird, Philip A. Smart, David J. Harris, Laura A. Phillips, Gabriella Giannachi and Samuel J. Vine in Journal of Travel Research
Supplemental Material
sj-docx-4-jtr-10.1177_00472875221134031 – Supplemental material for A Magic Leap in Tourism: Intended and Realized Experience of Head-Mounted Augmented Reality in a Museum Context
Supplemental material, sj-docx-4-jtr-10.1177_00472875221134031 for A Magic Leap in Tourism: Intended and Realized Experience of Head-Mounted Augmented Reality in a Museum Context by Jonathan M. Bird, Philip A. Smart, David J. Harris, Laura A. Phillips, Gabriella Giannachi and Samuel J. Vine in Journal of Travel Research
Supplemental Material
sj-docx-5-jtr-10.1177_00472875221134031 – Supplemental material for A Magic Leap in Tourism: Intended and Realized Experience of Head-Mounted Augmented Reality in a Museum Context
Supplemental material, sj-docx-5-jtr-10.1177_00472875221134031 for A Magic Leap in Tourism: Intended and Realized Experience of Head-Mounted Augmented Reality in a Museum Context by Jonathan M. Bird, Philip A. Smart, David J. Harris, Laura A. Phillips, Gabriella Giannachi and Samuel J. Vine in Journal of Travel Research
Supplemental Material
sj-docx-6-jtr-10.1177_00472875221134031 – Supplemental material for A Magic Leap in Tourism: Intended and Realized Experience of Head-Mounted Augmented Reality in a Museum Context
Supplemental material, sj-docx-6-jtr-10.1177_00472875221134031 for A Magic Leap in Tourism: Intended and Realized Experience of Head-Mounted Augmented Reality in a Museum Context by Jonathan M. Bird, Philip A. Smart, David J. Harris, Laura A. Phillips, Gabriella Giannachi and Samuel J. Vine in Journal of Travel Research
Footnotes
Declaration of Conflicting Interests
The author(s) declared no potential conflicts of interest with respect to the research, authorship, and/or publication of this article.
Funding
The author(s) disclosed receipt of the following financial support for the research, authorship, and/or publication of this article: This work was supported by Innovate UK [Project No. 104901].
Data Availability Statement
Supplemental Material
Supplemental material for this article is available online.
Author Biographies
References
Supplementary Material
Please find the following supplemental material available below.
For Open Access articles published under a Creative Commons License, all supplemental material carries the same license as the article it is associated with.
For non-Open Access articles published, all supplemental material carries a non-exclusive license, and permission requests for re-use of supplemental material or any part of supplemental material shall be sent directly to the copyright owner as specified in the copyright notice associated with the article.