
Abstract
COVID-19 brought the global tourism industry to a standstill. In response, various tourism stakeholders adopted innovative approaches such as virtual tours (VTs) to keep their attractions firmly in the minds of potential visitors. This study has integrated the Technology Acceptance Model (TAM) and Protective Action Decision Model (PADM) models to determine the factors that affect a person’s decision to adopt VTs as temporary alternatives during times of crises. Data were collected from a sample of 401 respondents after they had experienced at least one of the VTs simulating Egyptian heritage sites. The results show that the antecedents of the TAM and PADM models are effective in predicting users’ intention to adopt VTs and that adoption intention has a positive impact on the tendency to visit the actual site. In addition, practical implications are provided for site managers to consider when opting for VTs as a promotional tool or as an alternative product during times of crisis.
Keywords
Introduction
A testament to the frailty of globalization, COVID-19 has brought the world to a standstill. Starting as a seemingly unremarkable virus in early 2020, COVID-19 has spread from the city of Wuhan, in China, to more than 216 countries, infecting more than 21 million people and killing more than 700,000 according to the WHO (2020). Governments all over the world implemented restrictions, such as the closure of borders, community lockdowns, the suspension of flights, and the closure of public places, to avoid the spread of the pandemic (Osler 2020). It is evident that all such restrictions have affected the travel and tourism industry the most (Sharma and Nicolau 2020)—a sector that has often sat comfortably in the non-necessity zone. According to the third UNWTO (2020b) report on travel restriction, 100% of destinations worldwide had implemented COVID-19-related travel restrictions, and 165 of 217 destinations (72%) had completely stopped international tourism before the end of April 2020. It is expected that international tourism will decrease by 80% for the year 2020 if the crisis continues until the end of the year (UNWTO 2020b; OECD 2020), and many commentators are predicting major long-term structural and transformational changes in the tourism eco-system (Gössling, Scott, and Hall 2020; Sigala 2020). Yet, beyond being a “non-necessity” for tourists and travelers, the industry has become an economic necessity for the well-being of many destinations and communities. Hence, there is a call to use the COVID-19 crisis as an opportunity to reform the travel and tourism sector to be more sustainable (Ioannides and Gyimóthy 2020; UNWTO 2020a), more dependent on the use of technology (e.g., robotic applications, mobility tracking technologies, virtual reality applications, virtual tours, digital identity controls in airports, and self-service check-in kiosks) as a safe alternative to direct human interactions (Sigala 2020; Zeng, Chen, and Lew 2020), and to develop innovative and digitalized tourism experiences (UNWTO 2020a).
Different economic sectors reacted differently to the crisis, the most interesting of which was the travel, tourism, and cultural sectors, which had always relied on visitor desires for novelty and firsthand experiences (Hsu, Cai, and Li 2009; M. Li and Cai 2012; Lunardo and Ponsignon 2019; Su et al. 2020). Until recently, museums, heritage sites, and places of touristic interest had been hesitant to allow visitors to comprehensively explore their collections, features, or environments online, because of the underlying fear that digital imitations would dilute the experience, or, worse yet, compete with the actual sites and steal potential visitors away. When COVID-19 put an unavoidable halt to in-person visitations, radical and rapid adaption was needed. It soon became obvious that if these sectors were going to survive, they were going to have to invest in technological innovation—in other words, virtual tours (VTs) became the only product that cultural and heritage attractions could offer during the pandemic. For example, when forced to cease physical tours, the Frank Lloyd Wright Foundation (2020) began conducting VTs, once a week in real time, to stay connected with visitors. Similarly, as they closed their doors to the public, the New York Botanical Garden (NYBG, n.d.), the Eiffel Tower (Sociéte d’Exploitation de la tour Eiffel 2020), and the Vatican Museums (Vatican News 2020) responded by releasing VTs. Even entire destinations developed VTs in attempts to maintain touristic interest. For instance, The Singapore Tourism Board (2020) released the “Experience Singapore now. Visit later.” initiative, which allowed visitors from all over the world to virtually explore some of the city-state’s most iconic attractions and districts.
Yet, it should be appreciated that for the sectors that have traditionally relied on in-person visitation, the success of newly developed VTs during the COVID-19 pandemic will likely be influenced by two crucial considerations. The danger posed by the virus has resulted in the majority of people avoiding crowded places, and some even refusing to leave their homes altogether. Certainly, the degree to which people view VTs as an alternative that will allow them to visit places without getting sick will have a strong bearing on how willing they will be to use them. At the same time, factors relevant to the VT experience itself, such as how useful or how easy to use the VTs are, will no doubt affect a person’s attitudes toward, and intention of, using them. In this regard, two well-established frameworks are appropriate, the Protective Action Decision Model (PADM) and the Technology Acceptance Model (TAM). However, both the PADM and the TAM have only ever been investigated in isolation, and never before have researchers tested the applicability of the models in situations where both are simultaneously relevant. In addition, the sudden emphasis on VTs from the travel, tourism, and cultural sectors has raised many questions regarding the overall practicality of the technology (e.g., Sigala 2020). There is a concerning lack of research measuring the usefulness of VTs, the extent to which tourists enjoy them and the extent to which these VTs can replace actual site visits in the long run. Moreover, the apparent dual role of these VTs, as interim products during a crisis and as promotional tools in the aftermath of a crisis, as well as the effect of improved quality and technological advancement on the user experience, is worthy of further research. To address this research gap, this article aims to achieve three interrelated objectives. First, to critically review the literature related to the concept of VTs, the antecedents of VT adoption during times of crisis and the link between VT adoption intention and the tendency to visit the actual site. Second, the article aims to test a structural model that integrates and investigates the effects of five antecedents, from the PADM and the TAM, on the intention to adopt VTs: perceived ease of use, perceived usefulness, perceived enjoyment, hazard-related attributes, and risk perceptions during COVID-19. In addition, the researchers seek to extend the model and measure the impact of VT adoption intention on the tendency to visit the actual tourism site. Third, the article aims to provide insights for researchers and practitioners in the tourism field about the effectiveness of VTs, the extent to which people accept them, and to what extent they can be alternatives to actual site visits in the long term.
Literature Review
Virtual Tours
The term virtual tour has several interpretations and thus lacks a generally accepted definition. However, it can be described as “a simulation of an existing location that is composed of a sequence of video images’’ (Osman, Wahab, and Ismail 2009, p, 173). The simulation is set up by a sequence of videos or pictures and is accompanied by text descriptions, audio guides, or sound effects. The simulated location, with all of its associated effects, is set up with the intention of authentically re-creating the real site experience (Aguilera, Alonso, and Gomez 2014; Spielmann and Mantonakis 2018). As can be inferred from the work of Koutsoudis, Arnaoutoglou, and Chamzas (2007), for the most part, VTs are experienced through the worldwide web using a computer, through which a visitor can see and interact with a simulated environment using a monitor and a mouse, respectively. Although, as Barbieri, Bruno, and Muzzupappa (2017) explain, VTs also may be experienced using other advanced technologies such as virtual reality. As discussed by Mah et al. (2019), VTs are popular with attraction managers because they usually require relatively little financial investment, they offer visitors a number of tools that facilitate learning, and allow for an attraction’s intangible, as well as tangible, qualities to be communicated.
Carvajal, Morita, and Bilmes (2020) state that as museums exist to communicate and provide mass access to information, VTs are one of the most potentially effective ways of achieving this purpose. Consequently, it is no surprise to find that a number of world class museums have adopted VTs to allow the public to experience their collections from anywhere in the world. For example, in 2019 the Louvre Museum partnered with HTC Vive Arts (Louvre 2019), a firm specializing in the preservation and dissemination of cultural heritage using digital innovation (Vive Arts 2020), to commemorate the 500th anniversary of Leonardo DaVinci’s death with a VT using virtual reality technologies (Louvre 2019). On a larger scale, Google Arts & Culture has partnered with museums and public institutions from all across the world to provide access to an impressive collection of VTs (Google Arts & Culture, n.d.-a). The British Museum in the United Kingdom, the Museum of Modern Art in the United States, and the Van Gogh Museum in the Netherlands all now offer VTs through this partnership, along with an ever-expanding list of specific exhibits and collections from various other museums (Google Arts & Culture, n.d.-b).
VTs can play an essential role in preventing the total suspension of many tourism activities during crisis periods (Guha 2020), by creating new business models and providing various opportunities for different entities in the tourism ecosystem. Examples of these opportunities include enabling tourists to experience and learn about different sites and destinations during times of travel restrictions and bans while staying safe at home (UNESCO 2020), enabling museums and different touristic sites to remain engaged with their public (UNESCO 2020; Sallent 2020), and providing job opportunities for employees such as tour guides through the provision of VT-based tour guiding (Ramachandran, Subramani, and Ambrose 2020).
In early 2020, the COVID-19 pandemic began to negatively impact the global travel and tourism industry (UNWTO 2020a). For Egypt, a country increasingly dependent on international tourist arrivals (The World Bank 2018; El-Said and Aziz 2019), this represented a significant economic loss (Knell 2020). In April, with hopes of maintaining traveler interest in traveling to the country at a time when cross-border movement was impossible, Egypt’s Ministry of Tourism and Antiquities launched the “Explore Egypt from Home” initiative through their social media channels (Daily News Egypt 2020). The initiative was inaugurated with the release of five VTs for five famous heritage sites and was followed by a series of other VTs for different Egyptian museums and heritage sites.
Theoretical Background
Making use of the already well-established Theory of Reasoned Action as a foundation, Davis (1985) constructed a model that would measure a person’s intention to adopt computer-based technology and named it the Technology Acceptance Model (TAM). The model mapped out the factors that would influence a person’s decision to use a particular technology. It was clear that technology usage was dependent on a whether a person’s attitude toward it was positive. In turn, a person’s attitude toward using a new technology was directly affected by two main factors: perceived ease of use (PEOU) and perceived usefulness (PU). As could be expected, PEOU was influenced by the design features of the technology, which were related to how difficult it was to learn to use, if it behaved as expected or if the user frequently made errors while using it. While PU was similarly preceded by design features of the technology, related to the way the technology improved task efficiency, outcome quality or productivity, it was also directly influenced by the other main factor, PEOU. In this first conceptual mapping, there was some experimentation to incorporate the factor of enjoyment. However, at this stage it was only “expected enjoyment” and it was not until the model was reviewed and revised in the following decade that the factor of perceived enjoyment (ENJ) was proven to be significant (Davis, Bagozzi, and Warshaw 1992). With this revision, a person’s decision to use a new technology was preceded by their “intention to use” it. Their intention to use it was, in turn, preceded by PU and ENJ. Lastly, PU and ENJ were each influenced by both PEOU and expected output quality.
Many researchers have since sought to contribute to the model. For example, Venkatesh (2000) explored the factors that influenced PEOU, even positioning the previously identified ENJ as an antecedent to PU, rather than as a parallel factor. In a similar fashion, Venkatesh and Davis (2000) explored the antecedents of PU, in addition to the moderators between the factor and its antecedents. After a few years, Venkatesh et al. (2003) demonstrated the existence of other factors, beyond the previously established PEOU, PU, and ENJ, that exhibited direct influences on intention to use new technology. In addition to identifying new factors, such as social influence, effort expectancy, and performance expectancy, Venkatesh et al. (2003) also discovered moderating factors between the intention to use new technology and its newly found antecedents, such as gender, age, experience, and voluntariness of use. Despite the extensive examination of, and additions to, the model, there remain several areas that are still in need of further investigation. Concluding their comprehensive review of the TAM literature, Marangunić and Granić (2015) presented four of the most important areas for future researchers to concentrate their efforts on: (1) to continue identifying the antecedents of PU and PEOU, (2) to verify the assumption that the relationship between technology usage and technology performance is positive, (3) to verify the validity of the model using more diverse samples (with less educated or with older persons for example), and, most relevant for the context of the current study, (4) to incorporate factors from other theories that would affect the intention to use technology.
Exploring an entirely different concept in the early 1990s, Lindell and Perry (1992) built a model that would explain how a person responds to environmental hazards and disasters (e.g., floods, earthquakes, tsunamis, pandemics, and storms or nuclear disasters), which they called the Protective Action Decision Model (PADM). Though it has had, and continues to have, a pioneering influence on research focusing on disaster response, prevention, and mitigation (Strahan and Watson 2019), the model continues to evolve over time (Lindell and Perry 2004, 2012). In their updated model, Lindell and Perry (2012) state that the PADM is a sequential process, in which social and environmental warnings influence a person’s perception of a threat, which then prompt them into making a protective action decision. In the model, decisions made with the intention of reducing the risk from hazards and disasters are called “hazard adjustments.” These are affected by “hazard-related attributes” (HRAs), the degree of perceived benefit of making the Hazard Adjustment, and the “Perception of Personal Impacts,” being a person’s expectation of the severity of a hazard or their risk perception (RP).
Therefore, a person’s adoption intention, to either use a new technology or to reduce risks from hazards, is a crucial factor for both the TAM and PADM theories. Taking Marangunić and Granić’s (2015) call for future research into consideration, the use of VTs in the context of the COVID-19 pandemic provides an unprecedented opportunity to integrate both the models together. Being technology-based substitutes for visiting touristic and cultural attractions, and as safe alternatives that allow people to visit touristic sites without increasing their exposure to the coronavirus, both theories merge on the respective factors of intention to use and hazard adjustment.
Hypothesis Development
In consideration of the objectives of this article, the TAM and PADM models were integrated together to develop the model of the current study. First, as the adoption of VTs during the COVID-19 pandemic is both a hazard adjustment and an intention to adopt technology, the authors have set this factor as the link between both models. Four antecedents were defined (two from TAM and two from PADM) to predict the intention to adopt VTs (INT), which were PU, ENJ, HRA, and RP (originally perception of personal impacts in PADM). Second, in line with the findings of previous research in the context of VT adoption (e.g., Huang et al. 2013), PEOU was defined as an antecedent for PU and ENJ. Third, in order to contribute to the literature regarding the advantage, or disadvantage, of VTs in generating demand for actual visits, the factor of tendency to visit the actual site (TenAS) has been added as the dependent variable of INT. Finally, PU and ENJ of the VTs were defined as moderators between INT and TenAS. Overall, the proposed framework will demonstrate how, together, the five antecedents of the extended TAM and the PADM constructs influence, directly or indirectly, a person’s INT at a time when travel is dangerous, which, in turn, influences their TenAS.
TAM-based antecedents for users’ adoption of VTs
Perceived usefulness
PU has been defined as “the degree to which a person believes that using a particular system would enhance his or her job performance” (Davis 1989, p. 319). Davis’s framework states that the individual’s acceptance of information technology is mainly influenced by its PU. Previous studies have investigated the antecedents and outcomes of PU in the context of tourism destination websites. Regarding antecedents, Kaplanidou and Vogt (2006) investigated the different factors that predict users’ PU of tourism destination websites in planning their trips. They found that perceived website functionality (e.g., clarity and completeness of information) was the most important predictor of PU, followed by the presence of motivating visuals (e.g., quality of pictures, content, and graphics). As for the outcomes of PU, Noor et al. (2005) investigated virtual community acceptance to share information on tourism websites and found that PU among other factors such as trust and PEOU were significant predictors of intention to share. With similar logic, M. Lee et al. (2020) found that customers’ attitude toward VTs designed by Santa Clara’s DMO were significantly influenced by their perception of the quality of the VT. Moreover, Vishwakarma, Mukherjee, and Datta (2020) and El-Said and Al Tall (2020) found that PU had an indirect impact (mediated by perceived value) on Indian tourists’ intention to adopt virtual reality (VR) for evaluating various tourist destinations and on Omani customers’ intention to use self-service kiosks in fast food restaurants respectively. Building on the above, the following hypothesis is proposed:
Hypothesis 1: Perceived usefulness of VTs for tourism sites has a positive impact on intention to adopt VTs.
Perceived enjoyment
Davis, Bagozzi, and Warshaw (1992, p. 1113) defined ENJ as “the extent to which the activity of using the computer is perceived to be enjoyable in its own right, apart from any performance consequences that may be anticipated.” Previous research has highlighted the importance of ENJ in predicting users’ intention to adopt IT applications in virtual environments. For example, Guo and Barnes (2011) found a positive relationship between users’ enjoyment of the online shopping experiences at the Second Life virtual world website and their intention to purchase items from that website. Similarly, Vishwakarma, Mukherjee, and Datta (2020) found a positive relationship between VR enjoyment and intention to adopt VR technology for evaluation of tourism destination websites. However, this positive association was mediated by users’ perceived value. Similarly, Kim and Hall (2019) found a significant positive indirect effect of VR enjoyment mediated by flow state on Korean users’ intention to continue using tourism-related VR activities. Therefore, the following hypothesis is proposed:
Hypothesis 2: Perceived enjoyment of VTs for touristic sites has a positive impact on intention to adopt VTs.
PADM-based antecedents for users’ adoption of VTs
Risk Perception from catching COVID-19
RP refers to the expectation that people have of how seriously a crisis can harm them, their homes, the city they live in, or their families, and disrupt their daily activities (Lindell and Prater 2000). Various studies have found a high correlation between the RP of crises and an individual’s motivation to prevent those threats by adopting precautionary actions (e.g., Lindell, Arlikatti, and Prater 2009). For example, Liu, Ouyang, and Cheng (2019) used PADM to identify the antecedents of customers’ willingness to adopt electric vehicles during a city smog crisis. Their results indicated that customers’ willingness to adopt electric vehicles was captured by PR, trustworthiness, and HRAs. Using a sample of Chinese tide-watchers, Wang et al. (2019) found that RP attitude had a significant positive impact on adoption of safety behaviors in the context of water-based mass adventure tourism. Moreover, Chien et al. (2017) found that higher levels of health RP among a sample of Australian outbound travelers was positively associated with self-protective behaviors, such as seeking health and travel advice. In the same vein, we propose that VTs will be adopted as a safe alternative to actual site visits that pose a potential health risk during the pandemic. Based on the above arguments, we hypothesize the following:
Hypothesis 3: Perceived risk due to the spread of COVID-19 has a positive impact on the intention to adopt VTs.
Hazard-related attributes
HRAs refer to “the efficacy of the hazard adjustment protective behavior for protecting persons, property and its utility for other purposes” (Lindell and Perry 2000, p. 493). According to PADM, people’s adoption intention of hazard adjustment protective behaviors increases when their perception of HRA is high (Lindell and Perry 2000, 2012; Lindell, Arlikatti, and Prater 2009). Findings from previous empirical research supported the previous propositions in different contexts. For example, Liu, Ouyang, and Cheng (2019) found that HRA, represented by the efficacy of electric vehicles to reduce the city smog risk and to protect people from the city smog crisis, was associated with an increased intention to purchase electric vehicles. In a tourism context, Ruan, Kang, and Song (2020) applied the protection motivation theory to understand tourists’ adoption of protective behaviors as an outcome of air pollution threat in Beijing. They found that tourists intended to adopt protective behaviors during smog days (e.g., canceling outdoor tourism activities, shortening their stay in Beijing, and using anti-smog equipment). Therefore, we propose that travelers will consider VTs as a safer alternative for actual site visits during the spread of COVID-19. Hence, we propose the following hypothesis:
Hypothesis 4: Hazard-related attributes have a positive impact on the intention to adopt VTs.
Influence of perceived ease of use on perceived usefulness and perceived enjoyment
PEOU refers to “the degree to which a person believes that using a particular technology would be free of effort” (Davis 1989, p. 320). In the context of VTs, PEOU can be depicted by factors such as ease of navigation and support of different languages. Empirically, PEOU was found to be a significant antecedent of PU rather than a direct predictor of usage or adoption intention of new technology and therefore the causal relationship should be described in the following way: “PEOU → PU → adoption → usage” (Davis 1989, p. 334). In his analysis, Goodwin (1987, p. 229) supported this argument by concluding that “usability complements functionality. It affects how and with what effectiveness a system is used, and even whether or not it is used at all.” The impact of PEOU on PU has been investigated and validated in different technology acceptance contexts within the tourism sector, such as augmented reality (AR) acceptance (Chung, Han, and Joun 2015), acceptance of mobile AR in urban heritage tourism places (tom Dieck and Jung 2018), acceptance of self-service hotel technology (Kaushik, Agrawal, and Rahman 2015), and acceptance of official tourism destination smartphone apps (Xia, Zhang, and Zhang 2018).
Empirically, PEOU represented an important predictor of people’s enjoyment of new innovations, including VTs. For example, Huang et al. (2013) investigated the antecedents of user acceptance of 3D virtual tours of destinations, and their results indicated that PEOU was an important antecedent of user enjoyment of the virtual visit. Moreover, Manis and Choi (2019) investigated the antecedents of adopting VR hardware (e.g., wearable technology such as smart watches, AR, mixed, and VR headsets). Their results indicated that PEOU of the VR hardware was indirectly linked to purchase intention, and this relationship was mediated by PU and ENJ. In support, T. Li and Chen (2019) also found a significant positive impact from PEOU on ENJ among a sample of Chinese users who experienced a VR video for the UNESCO World Heritage Site Fujian Tulou. Therefore, the following hypothesis is proposed:
Hypothesis 5: Perceived ease of use of VTs for tourism sites has a positive effect on perceived usefulness.
Hypothesis 6: Perceived ease of use of VTs for tourism sites has a positive impact on perceived enjoyment.
Intention to adopt virtual tours and tendency to visit the actual tourism site
In the revised TAM, Davis, Bagozzi, and Warshaw (1992) introduced the factor of “behavioral intention” as a mediating factor between the predictors of the model, such as PEOU and PU, and a person’s actual behavior (to use a particular technology). In a related fashion, previous studies have found that satisfaction with virtual experiences (e.g., highly useful and highly enjoyable) led to positive outcomes, such as an increased intention to adopt virtual experiences in the future, and positively affected a person’s intention to visit the real destination (Chung et al. 2018; Huang et al. 2013; Huang et al. 2016; Jeong and Shin 2020; M. Lee et al. 2020; W. Lee, Gretzel, and Law 2010; Tussyadiah et al. 2018). For example, in their study of VR experiences that presented touristic destinations, Kim, Lee, and Jung (2020) found that a person’s attachment to the technology was an important predictor of visit intention. Furthermore, they discovered that attachment to the virtual reality experience mediated the effects of other factors, such as experience authenticity, on a subject’s intention to visit the actual destination.
In the VT context, Schweibenz (2019) concludes that virtual museum tours are praised as a useful means of generating interest and attracting visitors to the real attractions or locations they represent. Empirically, Huang et al. (2013, 2016) found that people who had positive experiences with 3D virtual world tourism sites were more motivated to visit the real sites afterward. Moreover, Bogicevic et al. (2019) found that a hotel VR experience positively affected users’ mental imagery about a hotel, which in turn affected users’ sense of presence and hotel’s sensory, affective, behavioral, and intellectual brand experiences. In addition, M. Lee et al. (2020) examined the role of VR quality on customers’ behavioral intentions. In their study, they asked customers to experience the VT available on the Santa Clara DMO website and then evaluate the quality of the VT and indicate its subsequent outcomes such as attitude change. They found that different attributes of VR quality (e.g., content, system, and vividness) positively impacted customers’ attitudes toward the VT which in turn led to a more positive intention to visit Santa Clara city (M. Lee et al. 2020). Similarly, Tussyadiah et al. (2018) found that a VR positive experience, captured by VR presence and VR enjoyment, resulted in a positive attitude change toward the destination. Yet, some researchers have expressed their skepticism regarding the advantages of VTs in generating actual visits to a destination. For example, Deng, Unnava, and Lee (2019) provide evidence suggesting that VTs may actually reduce potential visitors’ interest in visiting a real site, as they may have had their visitation needs fulfilled or satisfied entirely from engaging in the virtual experience. Moreover, T. Li and Chen (2019) found that a VR experience that was perceived as highly enjoyable by travelers led to reduced travel intentions among travelers who expected low enjoyment from traveling to the destination. In the context of the current study, we propose the following hypothesis:
Hypothesis 7: The intention to adopt VTs will be positively associated with tendency to visit the actual tourism site.
The moderating effects of perceived usefulness and perceived enjoyment
When technologies that simulate real experiences are introduced to the public, the natural question has always been “Will the new technology replace the real experience?” In recent years, several researchers have concluded that the opposite is in fact more likely, and that the new technologies can rather increase a person’s desire to try the real experience. In their study of VR as a tool for attracting visitors to tourism destinations, Tussyadiah et al. (2018) discovered that the more enjoyable a potential visitor found the VR experience, the more they intended to visit the actual destination. T. Li and Chen (2019), in a comparable study, similarly observed how the more a potential visitor perceived a VR experience as useful, the greater was their intention to visit the actual destination. Interestingly, in the work of Vishwakarma, Mukherjee, and Datta (2020) both factors appear to strongly influence behavioral intentions. Their work, which seeks to understand the factors that affect a person’s willingness to adopt VR technologies as a means of evaluating touristic destinations, demonstrates how the greater a person perceives the VR as enjoyable or useful the more likely they are to adopt the technology. In their investigation of VTs, M. Lee et al. (2020) likewise found that similar factors, relating to the potential visitor’s perception of the content quality and their sensation of immersion, influenced their intention to visit the actual destination.
Although, to the author’s knowledge, no study has yet tested the moderating effect of ENJ or PU on the relationship between INT and TenAS, there is reason to believe that such an effect might exist. In the work of T. Li and Chen (2019), the relationship between ENJ of VR and travel intention was moderated by the user’s expected enjoyment of the destination. This was a logical factor to test, as ENJ of VR might become associated with, and perhaps even confirm, the potential visitor’s existing expectations of enjoying the destination in reality, thereby increasing their desire to visit the actual site, and vice versa. Similarly, the current study seeks to understand the INT as an alternative to visiting the actual site during a crisis, and the TenAS as a result once the crisis is over. In this regard, it is reasonable to suggest that the relationship between both factors may be moderated by the ENJ and PU of using VTs, as the two factors are likely to shape expectations of the enjoyment and usefulness of visiting the actual site after a person has already made the decision to adopt VTs. In line with the previous discussion, we propose the following hypotheses:
Hypothesis 8: Perceived usefulness of VTs moderates the relationship between the intention to adopt VTs and tendency to visit the actual site, such that the relationship is stronger for users who perceive the VTs as highly useful and vice versa.
Hypothesis 9: Perceived enjoyment of VTs moderates the relationship between the intention to adopt VTs and tendency to visit the actual site, such that the relationship is stronger for users who perceive the VTs as highly enjoyable and vice versa.
Figure 1 presents the study’s conceptual model.
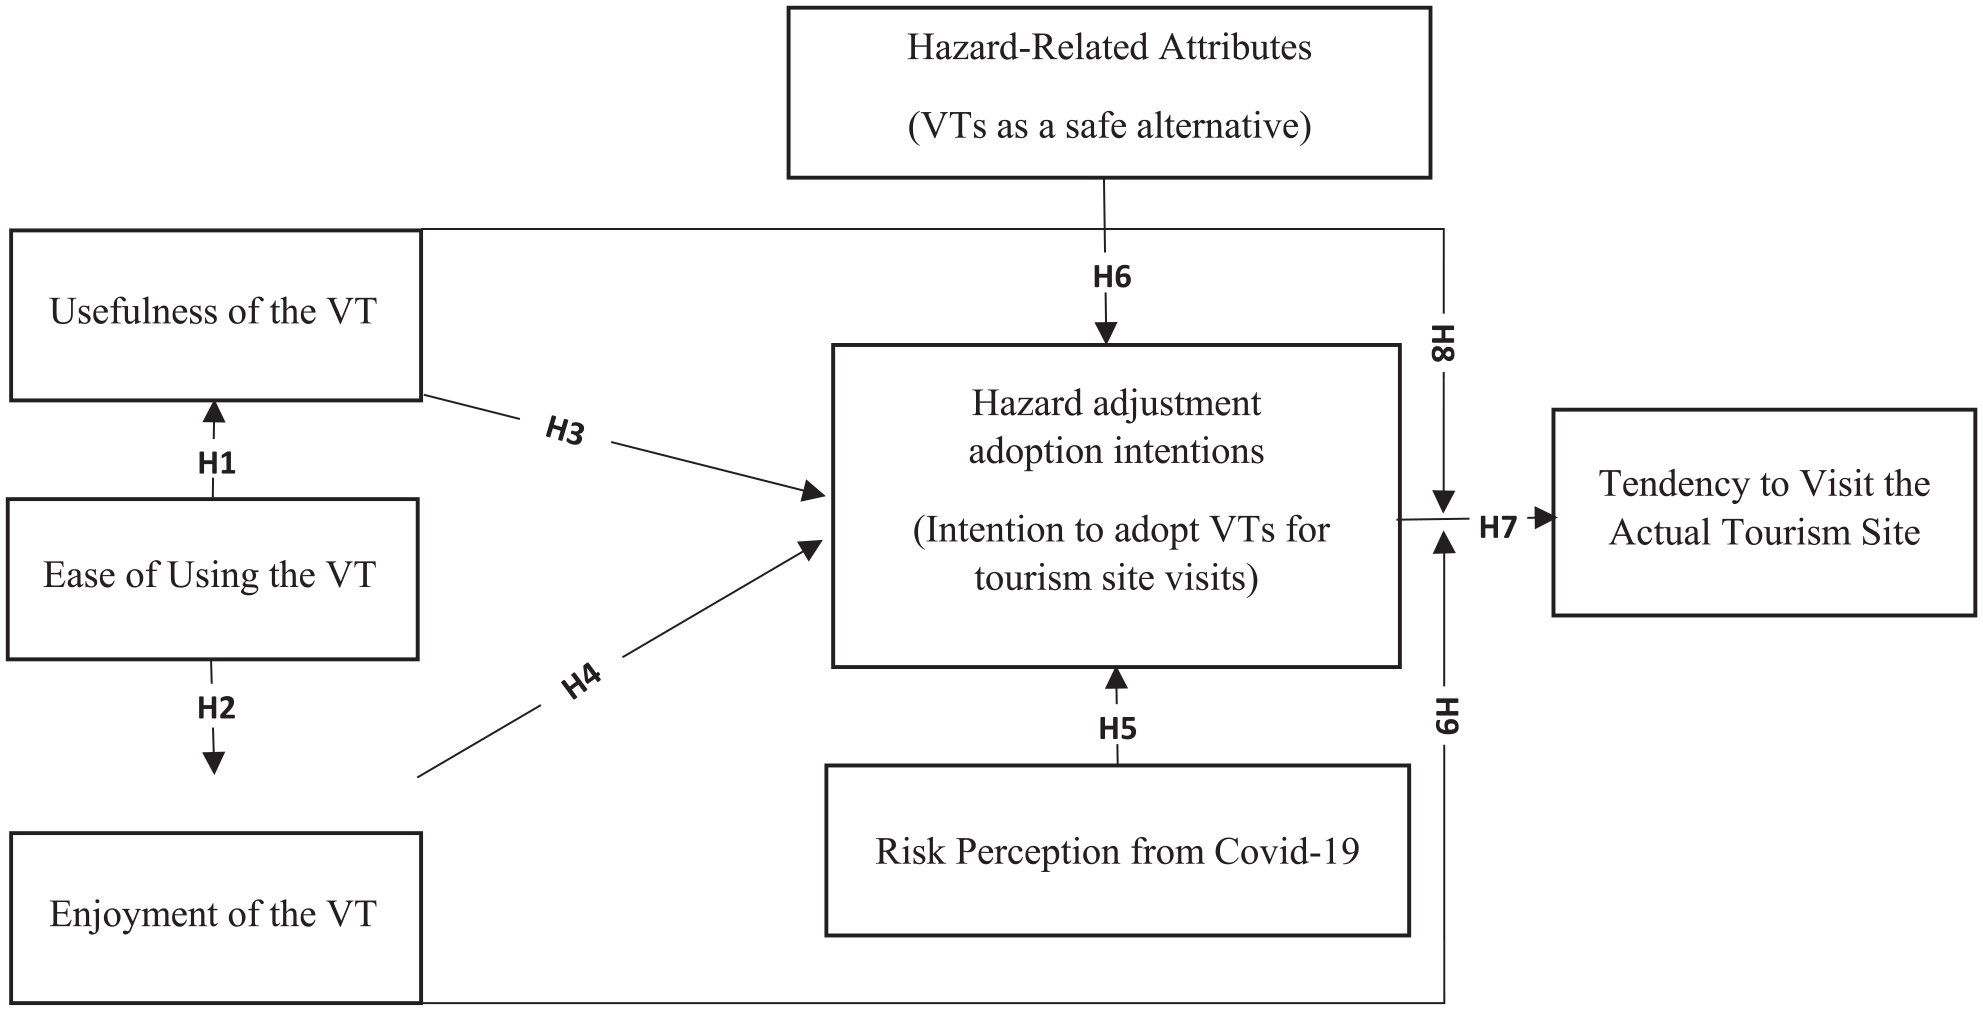
Conceptual model.
Research Methodology
Study Context
The research idea was inspired by the initiative of the Egyptian Ministry of Tourism to allow people worldwide to virtually visit different heritage sites in Egypt during the confinement period because of the COVID-19 outbreak. Those virtual tours were launched through a collaboration between the Egyptian Ministry of Tourism and its partners from scientific and archaeological institutes such as Harvard University and American Research Center in Egypt. The ministry posted the VTs on its official website and social media pages (Instagram, Twitter, Facebook, and Experience Egypt), and it was received positively by different people around the world.
Measures
The current study adopted previously validated scales from the literature to measure the different variables. First, four items for PEOU, four items for PU and four items for ENJ were adapted from previous TAM models (Davis 1989; Davis, Bagozzi, and Warshaw 1992; Venkatesh et al. 2003). For a better adaptation of the TAM model constructs to the context of the current study (VTs experience), previous studies that applied the TAM model in similar contexts were also reviewed (e.g., Vishwakarma, Mukherjee, and Datta 2020; Huang et al. 2013; Chiao, Chen, and Huang 2018). Second, three items adapted from Terpstra and Lindell (2013) and Lindell and Prater (2002) were employed to measure HRA. Third, four items based on the work of Lindell and Prater (2000) were used to measure RP during COVID-19. Fourth, four items adopted from previous research on new technology adoption were used to measure INT (e.g., Liu, Ouyang, and Cheng 2019). Finally, TenAS was measured using a three-item scale adapted from Huang et al. (2013), reflecting to which extent a person intended to visit the actual site after experiencing the VT. All the scales were measured on a Likert-type scale ranging from strongly disagree = 1 to strongly agree = 5.
Other items were used to gather the demographic data of respondents, such as education, social status, nationality, the device used to experience the virtual tour, most memorable VT, and to what extent users felt that VTs could replace actual site visits. Additionally, data related to the respondents’ age, gender, and previous experience with VTs was collected, and the three variables were treated as control variables in the final model to control their influence on the INT. However, the findings revealed that there is no effect from any of the control variables on the INT. In addition, the researchers used the open-ended question “Please share with us any suggestions or recommendations related to the research topic” to allow participants to express their opinions regarding the different parts of the survey. The answers to the open-ended question were carefully considered and categorized under the various research themes (see Appendix A) and then were used to support the discussion of the quantitative findings.
Sampling and Data Collection
Participants from two large universities of technology, one from the Sultanate of Oman and one from Germany, were identified as ideal for the purposes of this study. A convenience sampling technique was employed, and the sampling frame included all students, instructors, and employees from the two universities in question. The universities were selected based on two important considerations. First, as the current study required the participants to experience at least one VT before answering a survey, it was anticipated that universities specializing in technology would provide participants that were sufficiently well versed in technology to experience a VT comprehensively and provide reliable answers. Second, the geographic distance between the two universities, and the diverse and multinational populations within them, would increase the representativeness of the sample and the applicability of the findings. To collect the required data for the current study, a self-administered online survey was used. Nowadays, online surveys are a commonly used tool due to the fast response rate and cost effectiveness (Wright 2005). Since the current study investigates customer acceptance of virtual environments, an online survey can be considered as a particularly appropriate data collection method (Huang et al. 2013; Huang et al. 2016). The survey was developed in English and started with a cover letter explaining the initiative of the Egyptian Ministry of Tourism. A pilot test of the questionnaire was administered on two professors in Tourism Management and 10 interns from different nationalities. Several items were slightly reworded following their comments.
After getting the required permissions from the universities’ management, the electronic survey was sent to affiliates of the two universities via email with a cover letter introducing the study and its objectives. Participants were encouraged to share the online survey, using different social media platforms, with other eligible members from the two universities that were not included in the email list. Before filling the survey, participants were asked to try at least one of the VTs that was launched by the Egyptian Ministry of Tourism and Antiquities. The researchers suggested three VTs that represented three sites from the rich Pharaonic heritage of Egypt. Also, respondents were informed that they could try any other VT through the Egyptian State Information website where a collection of those VTs was presented (https://sis.gov.eg/Story/145863?lang=en-us). After the introduction and the invitation to experience the VTs, the survey started with an eligibility question asking respondents if they experienced any of the recommended VTs or any other VT from the SIS website. Participants who selected one of the following answers were eligible to participate in the survey: “Yes I tried one or two of them,” and “Yes I tried all of them,” and “No, but I tried another VT developed by the Ministry of Tourism.” On the other hand, those who answered “No, I did not try any of the recommended VTs or any other VT” were not eligible to participate in the survey. The online survey was distributed from the 14th of April to the end of June 2020. In total, 519 responses were received. However, 118 responses were removed as a result of incomplete responses and outliers. Accordingly, 401 questionnaires were included in the final analysis.
Data Screening and Analysis
Before starting with the data analysis, the data were screened to check for issues such as normality, multicollinearity, and common method bias. First, the skewness and kurtosis were used to test the normal distribution of the data as recommended by Hair et al. (2010). As reported in Table 2, all the skewness and kurtosis values were below ±2, confirming that the data followed normal distribution (Hair et al. 2010; Byrne 2010). Second, variance inflation factor (VIF) was used to investigate collinearity and all the VIF values were less than 2, confirming the absence of multicollinearity issues in this study (O’Brien 2007). Third, to test for potential common method bias, Harman’s one-factor test was used. The results indicated that no single factor accounted for more than 40% of the variance, confirming the absence of common method bias in the current study (Podsakoff et al. 2003). Fourth, given the diversity of the current study’s sample, there was a risk that culture would influence the results. To ensure homogeneity, the researchers compared the results along the lines of cultural similarities. To do this, the survey participants were categorized based on their nationalities under one of the eight World Cultural Regions devised by Schwartz (2009), which are (1) West European, (2) East-Central European, (3) East European, (4) Latin American, (5) English-speaking, (6) Confucian, (7) South-East Asian, and (8) African & Middle Eastern. While a number of cultural region categorizations exist, the ones presented by Schwartz (2009) were selected on the basis that they are supported by persuasive empirical evidence, build strongly on the work of well-known researchers in the field of cross-cultural studies, and employ a comprehensive set of dimensions to map the regions. Consequently, a Leven’s test was used to test for homogeneity of variance for all of the study variables, using the World Cultural Regions as a grouping variable. Results of the Leven’s test indicated insignificant differences in variance among different cultural groups in all of the study’s variables (P > .05).
To test hypotheses 1–7 of the study, Anderson and Gerbing’s (1988) two-step approach was followed and AMOS 24 program was used to perform the analysis. First, confirmatory analysis (CFA) was performed to check the reliability and validity of operationalized constructs. Different indicators such as factor loadings, Cronbach’s alpha, average variance extracted, composite reliability (CR), and interconstruct correlations were used. Second, a structural model was assessed to test the direct and indirect relationships between the variables of the study. To test hypotheses 8 and 9, related to the moderation analysis, the PROCESS macro for SPSS, version 3.2, was used.
Results
Demographic Analysis
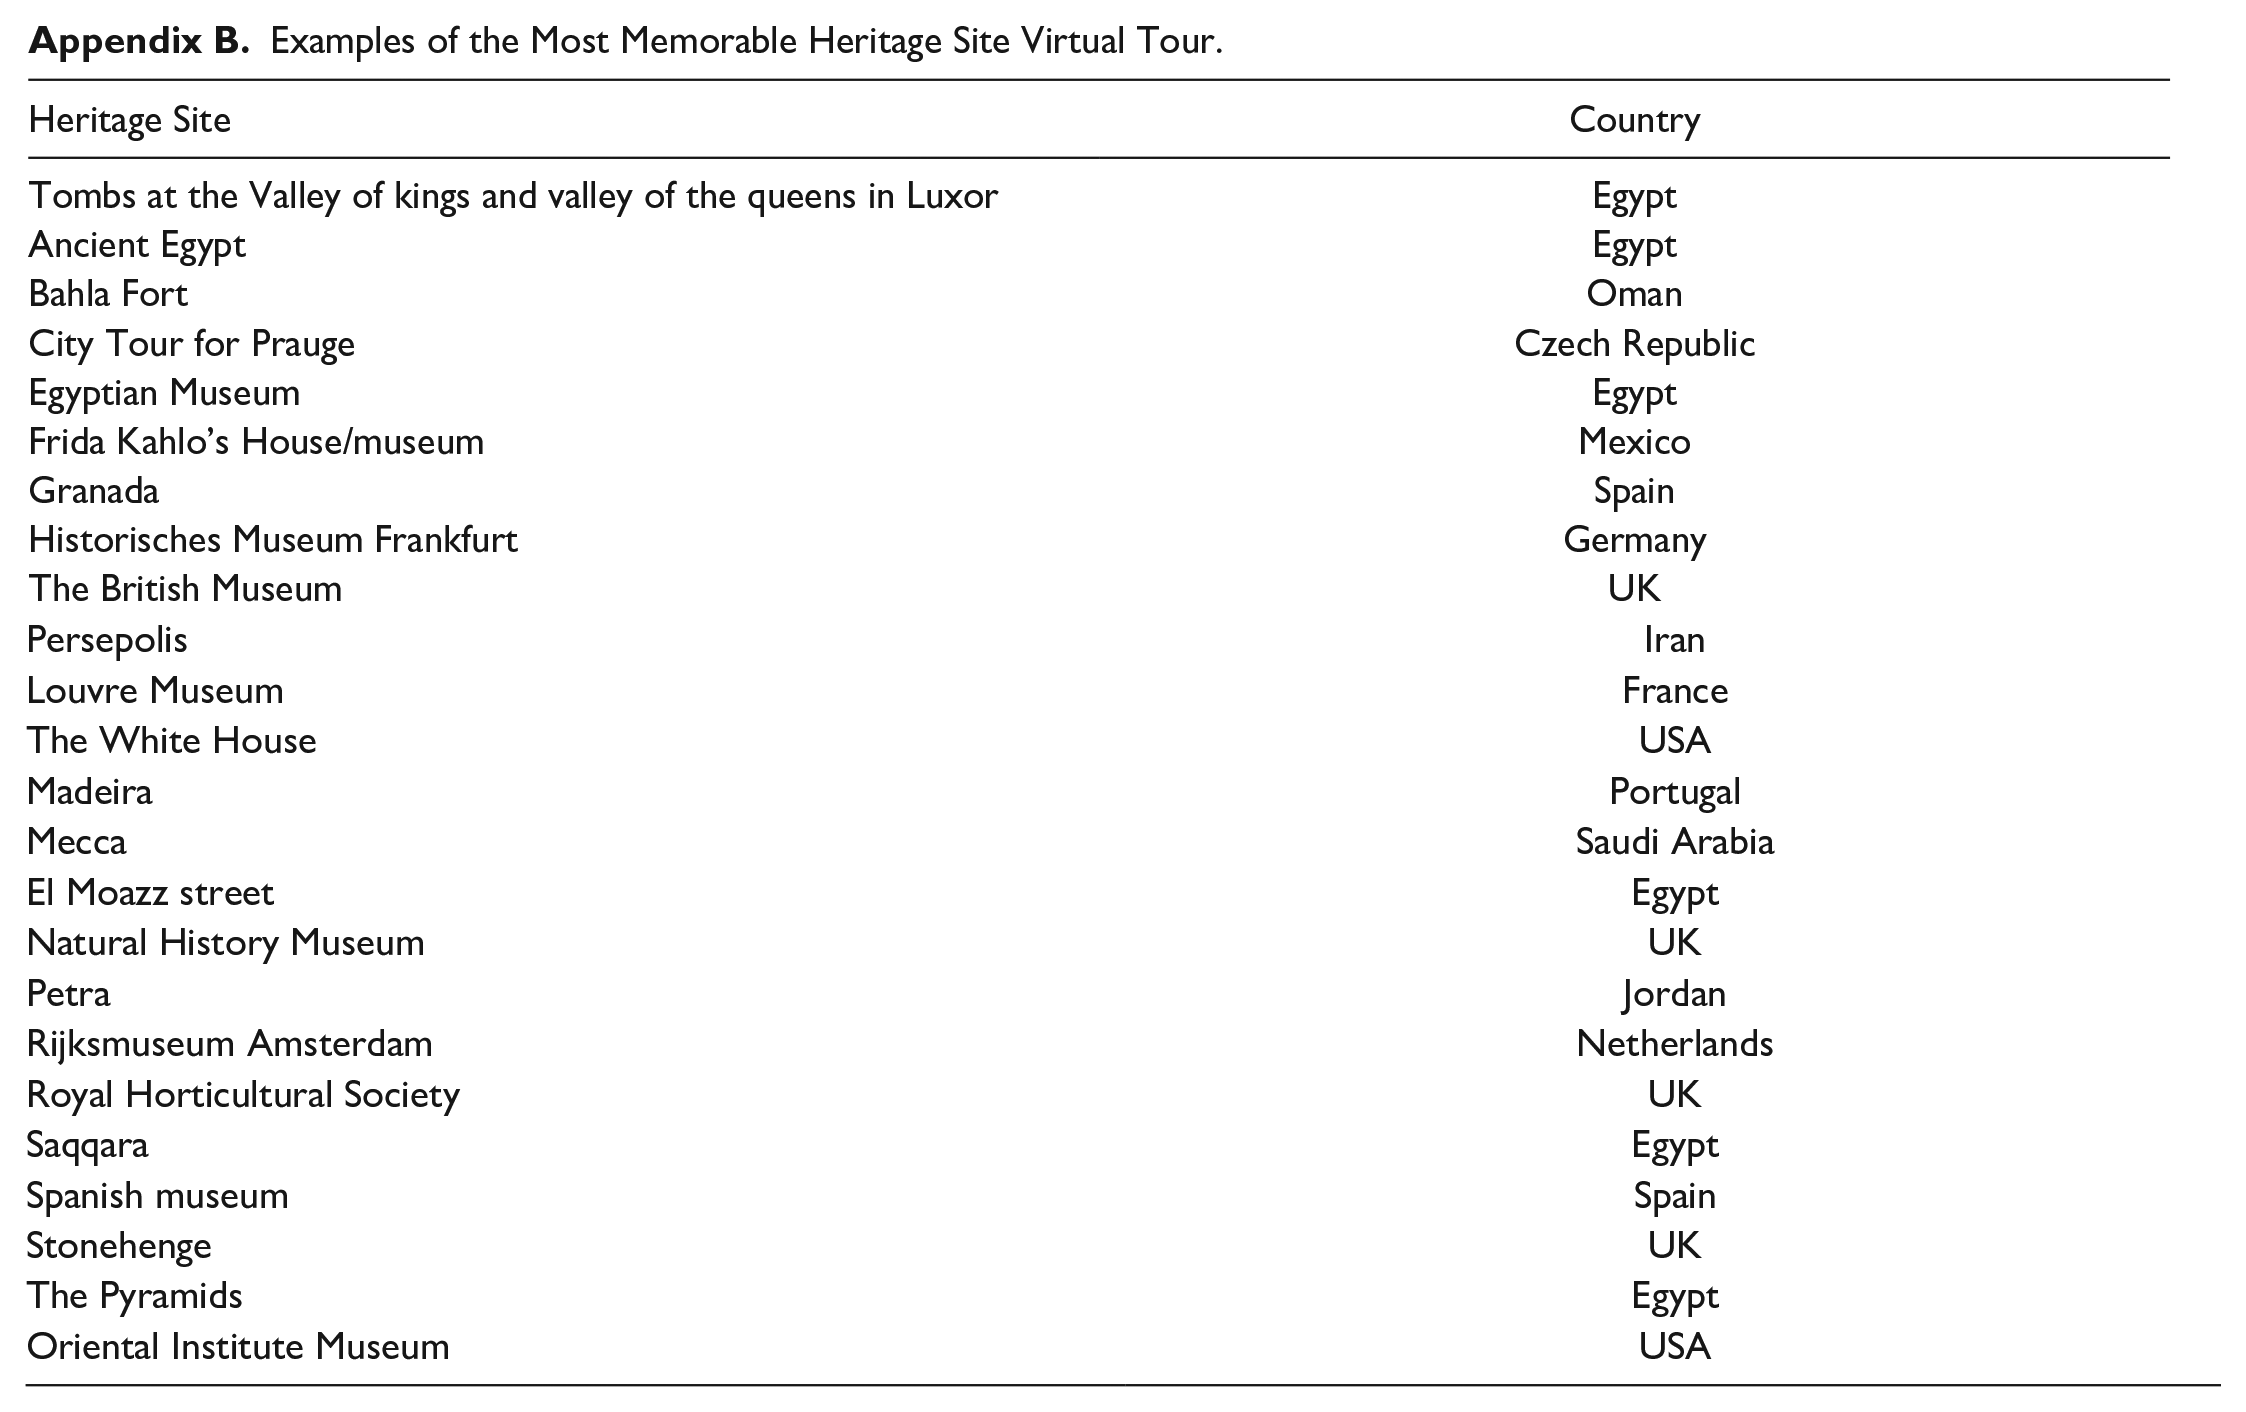
Table 1 shows the demographic profile of the respondents. From the 401 respondents, 58.4% were female and 41.6% were male. In terms of marital status, 55.9% of the respondents were single and 37.7% were married. In addition, 50.4% of the respondents were between 18 and 30 years old, followed by those who were between 31 and 50 years old (37.2%). For educational level, 33.4% of the sample were either enrolled or had completed bachelor’s degree, 36.7% were graduates or postgraduates, 18% had completed high school education, and 12% had attained a diploma. In terms of previous experience with VTs, most of the respondents had no previous experience of trying VTs (70.8%), compared with 29.2% who had tried VTs before. With respect to the device used to experience the VT, about half of the respondents used smartphones (54.9%), followed by laptop (27.2%), desktop computer (12%), and iPad or tablet (4.7%), and only 1.2% experienced the VT using other methods such as smartphone + VR headset. Finally, the largest percentage of respondents (61.1%) did not think that VTs could ever replace the actual experience of visiting a site, 31.4% thought that VTs might replace the actual visit and only 7.5% thought that VTs could replace the actual site visit. Respondents from more than 40 nationalities participated in the survey (e.g., Germans, Americans, Omanis, Spanish, Mexican, Algerian, Canadian, Croatian, Malaysian, Russian, etc..). Also, Appendix B presents the respondents’ answers to the question about the most memorable VT.
Profile of Respondents (total N = 401).
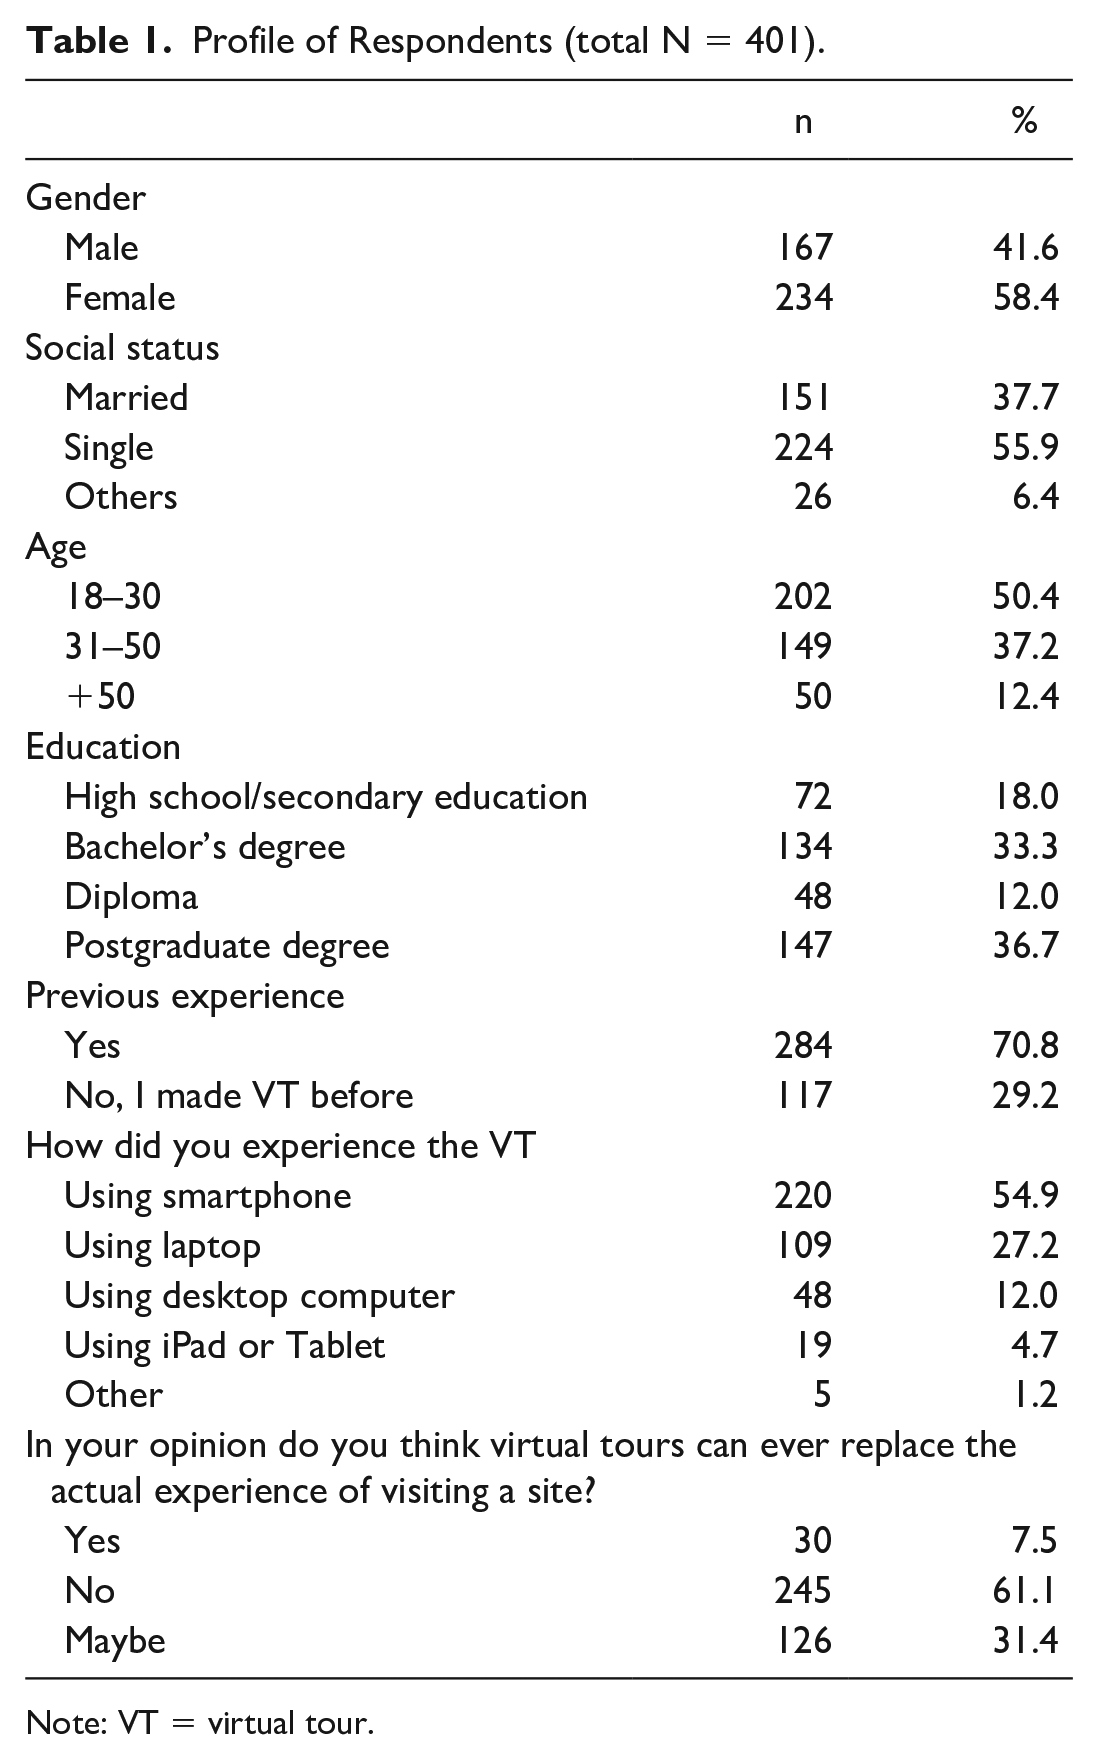
Note: VT = virtual tour.
Confirmatory Factor Analysis
After running the first CFA analysis for the first model, the fit indices indicated average fit to the data. Factor loadings and modification indices indicated that one item of PU, one of ENJ, one of PEOU, one of RP and one of INT needed to be deleted either because of low loadings (below 0.6) or high cross loading with other factors. After excluding the five items, the final analysis was performed for 20 items as shown in Table 2. The second CFA results indicated that the model showed a good fit to the data (χ2 = 315.945, df = 163, p < .001, χ2/df = 1.938, goodness of fit index (GFI) = 0.931, comparative fit index (CFI) = 0.966, Tucker–Lewis index (TLI) = 0.956, standardized root mean square residual (SRMR) = 0.0333, root mean square error of approximation (RMSEA) = 0.048 [90% confidence interval (CI) = 0.040, 0.056; PCLOSE = 0.616]). These criteria prove the adequacy of the measurement model as recommended by Hu and Bentler (1999).
Means, SDs, Factor Loadings, CR, Cronbach’s α, and AVE.
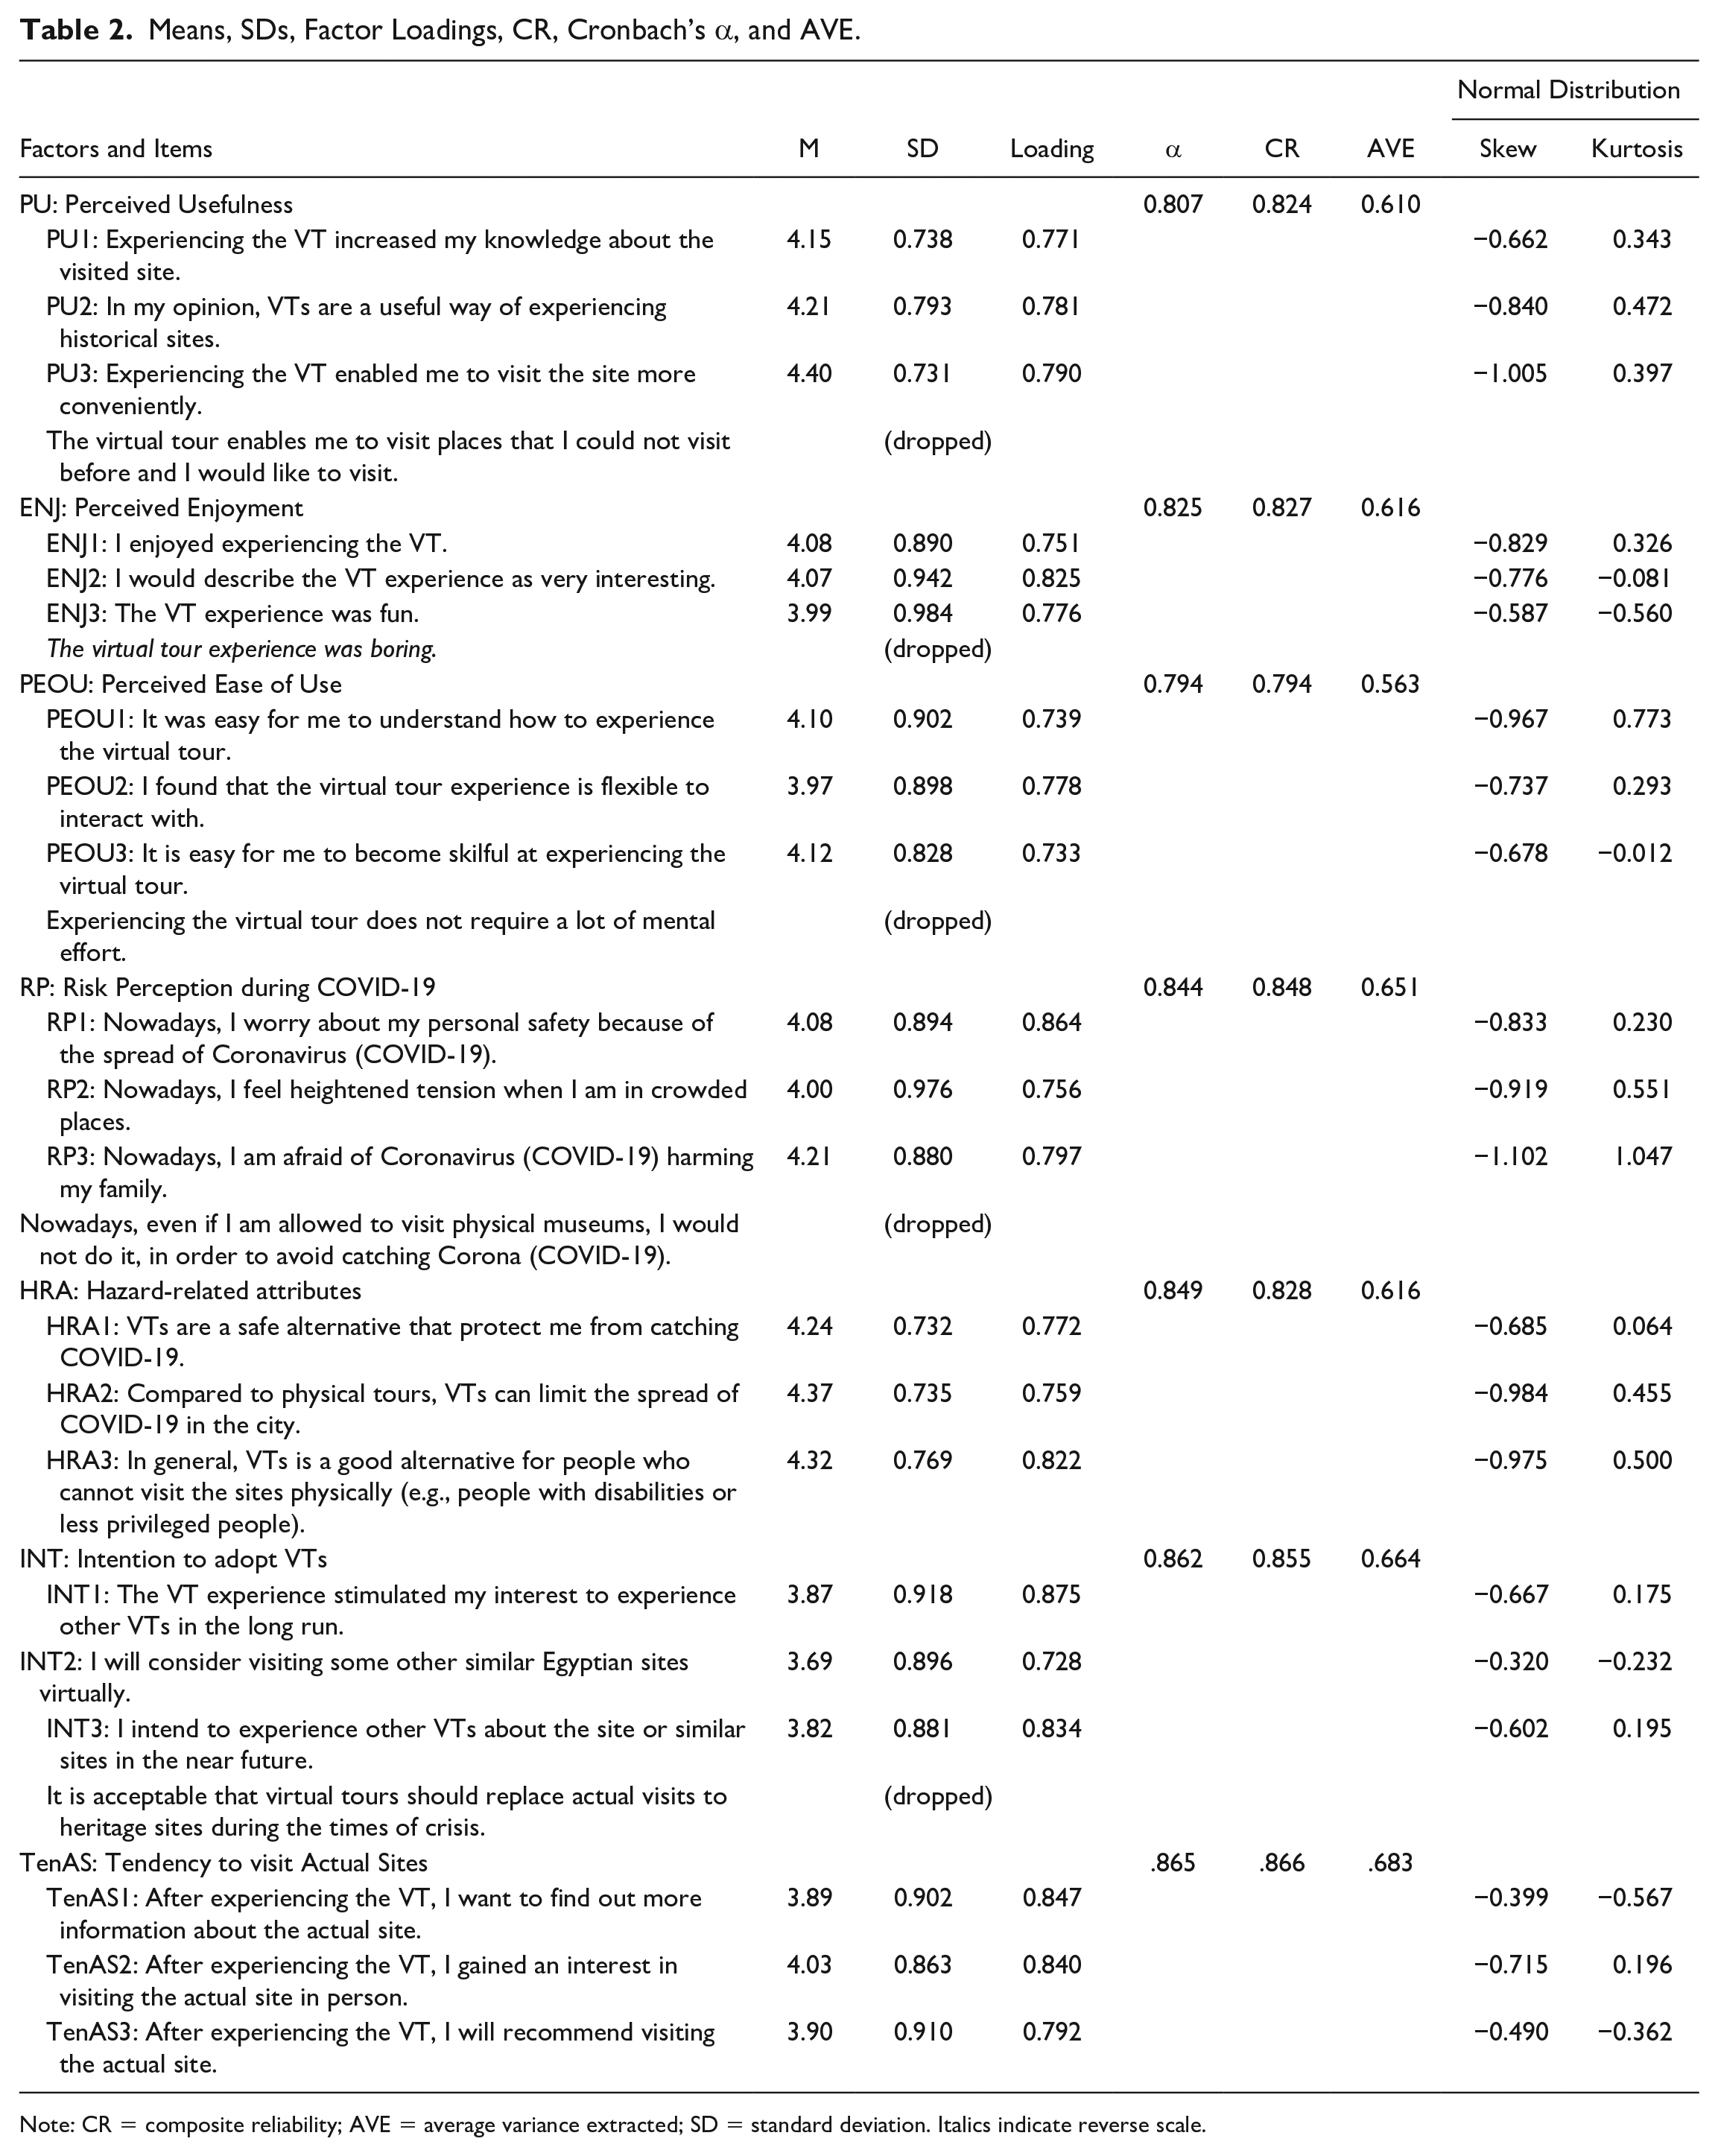
Note: CR = composite reliability; AVE = average variance extracted; SD = standard deviation. Italics indicate reverse scale.
As recommended by Hair et al. (2010, 2014), the final model was also examined by assessing the reliability and the validity for each construct of the study. Tables 2 and 3 summarize the different reliability and validity indicators for the measurement model. First, α and CR for all constructs were higher than 0.7, indicating acceptable reliability for all constructs as recommended by Campbell and Fiske (1959) and Hair et al. (2010, 2014). Second, all the factor loadings’ values were higher than 0.7, and the value of the AVE of all the measures was >0.5, confirming convergent validity of the measures (Fornell and Larcker 1981; Malhotra and Dash 2011). Finally, as shown in Table 3, each construct’s AVE was higher than its correlation with any other construct, confirming discriminant validity (Fornell and Larcker 1981; Hair et al. 2010).
inter Construct Correlations and Square Roots of AVE.
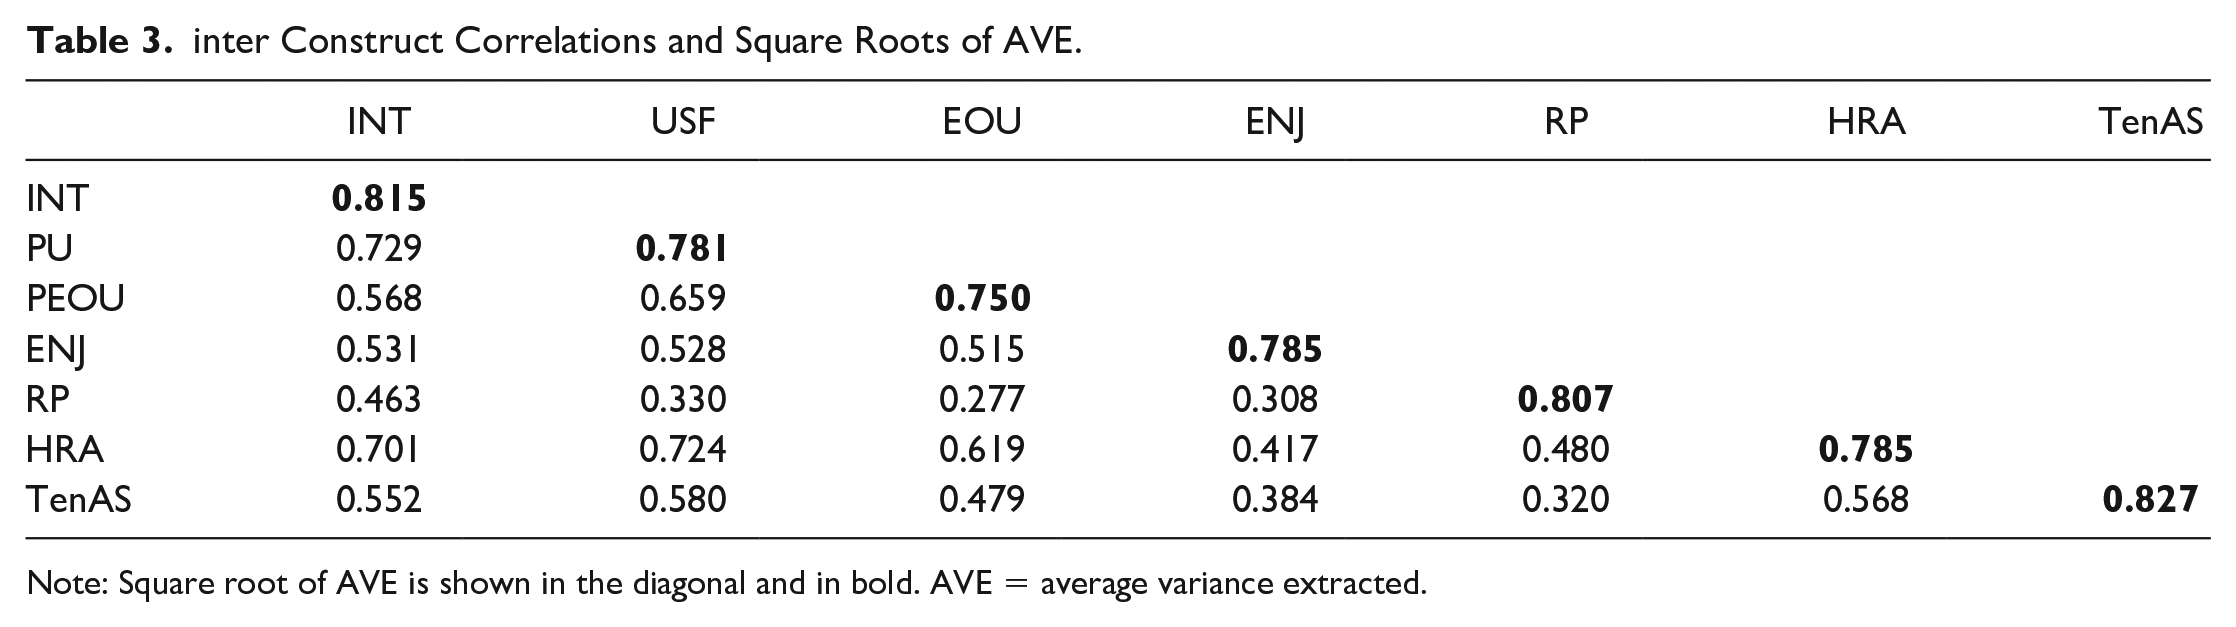
Note: Square root of AVE is shown in the diagonal and in bold. AVE = average variance extracted.
Hypotheses Testing
A structural model was designed and tested to examine the relationship among the seven constructs of the study: PEOU, PU, ENJ, RP, HRA, INT, and TenAS. The results of the structural model are presented in Table 4 and Figure 2. The structural model showed a good fit to the data (χ2 = 343.668, df = 171, p < .001, χ2/df = 2.010, GFI = 0.926, CFI = 0.961, TLI = 0.953, SRMR = 0.0427, RMSEA = 0.050 [90% CI = 0.043, 0.058; PCLOSE = 0.468]). Table 4 presents the results of hypotheses testing. First, PEOU had a positive effect on PU (β = 0.838, t = 8.867, p < .001) and ENJ (β = 0.595, t = 7.486, p < .001) of VTs, thus providing support for hypotheses 1 and 2. Second, the results indicated that PU (β = 0.432, t = 5.569, p < .001), ENJ (β = 0.159, t = 3.077, p < .01), RP (β = 0.140, t = 2.902, p < .01), and HRA (β = 0.297, t = 3.732, p < .001) had a significant positive impact on INT. Therefore, hypotheses 3–6 were supported. Third, a significant and positive effect was also identified for the impact of INT (β = 0.625, t = 11.232, p < .001) and TenAS, providing support for hypothesis 7.
Results of Testing the Structural Equation Model.
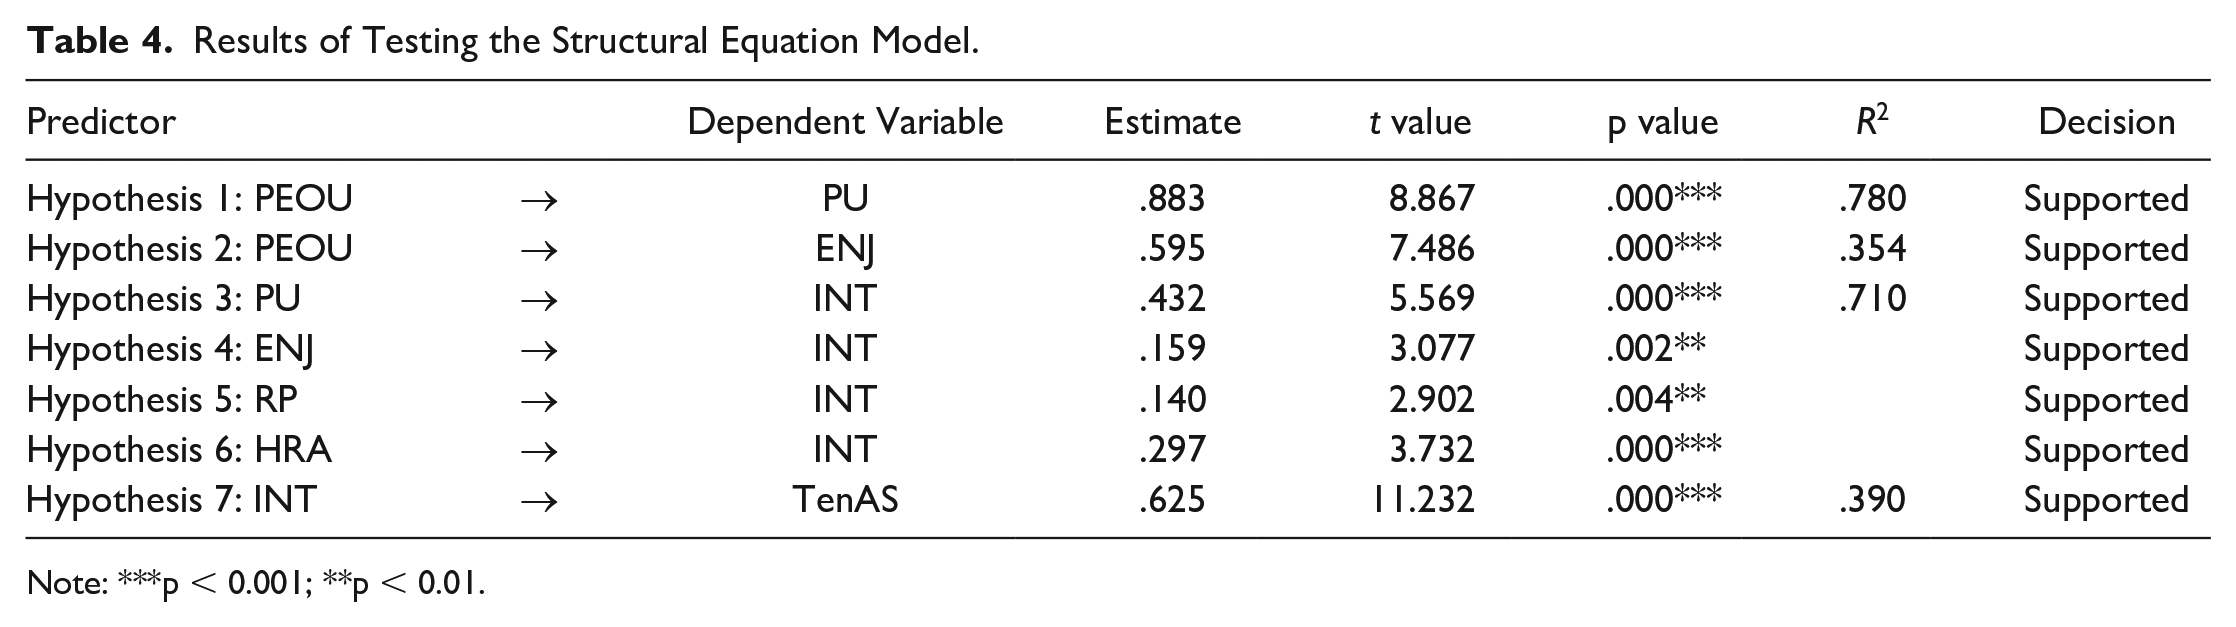
Note: ***p < 0.001; **p < 0.01.
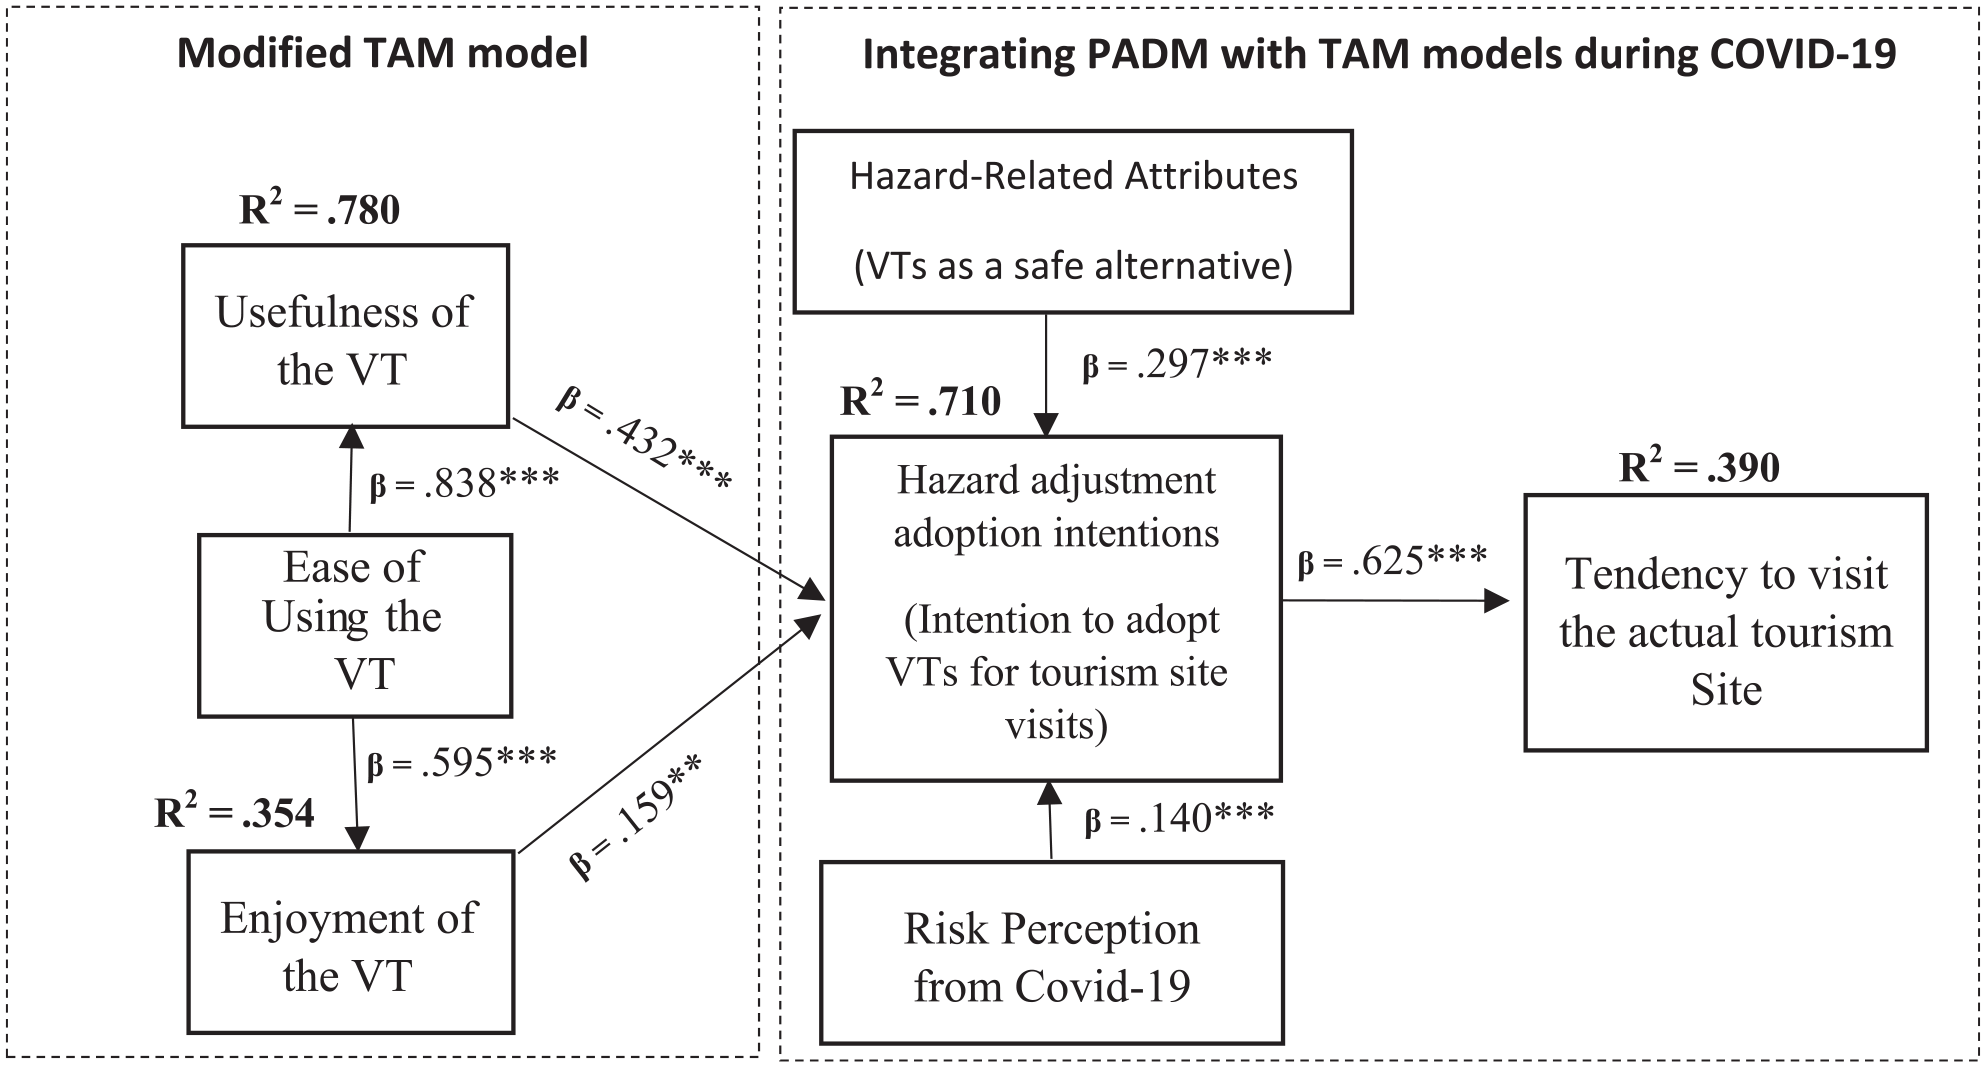
Structural model.
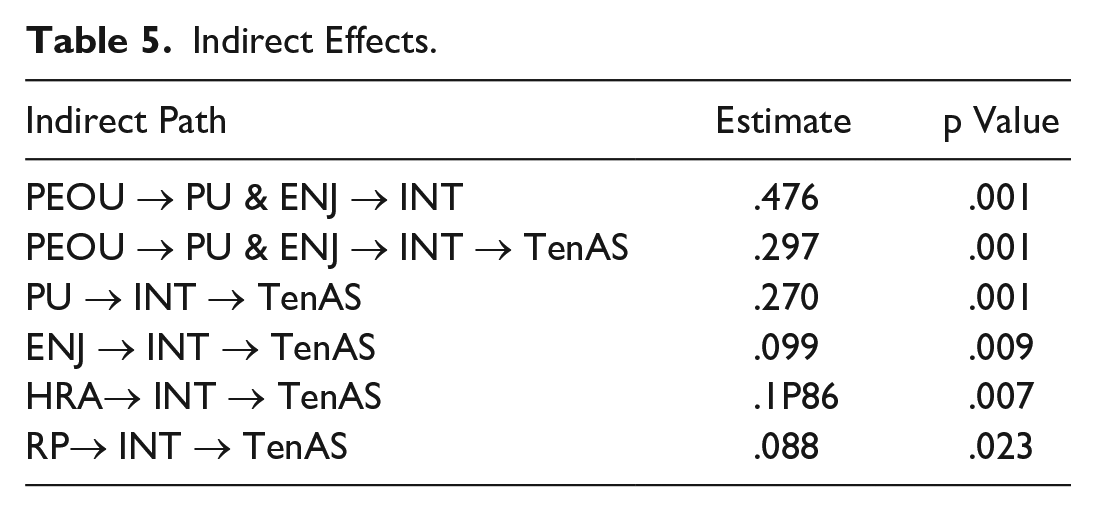
Further, the recommended bootstrapping method with n = 2,000 bootstrap resamples was used to estimate the standardized indirect effects and the p values between the different variables (Hair et al. 2014; Preacher and Hayes 2008) (see Table 5). A significant positive indirect effect was found between PEOU (mediated by PU and ENJ) and INT (β = 0.476, p < .01); PEOU (mediated by the PU, ENJ, and INT) and TenAS (β = 0.297, p < .01); PU (mediated by INT) and TenAS (β = 0.270, p < .01); ENJ (mediated by INT) and TenAS (β = 0.099, p < .01); HRA (mediated by INT) and TenAS (β = 0.186, p < .01); and RP (mediated by INT) and TenAS (β = 0.088, p < .05).
Indirect Effects.
Hypotheses 8 and 9 related to the moderating effect were tested using PROCESS macro (Hayes 2017). Results of the binary interaction are plotted in Figure 3 and Figure 4. First, results of the unconditional effect indicated that the interaction between PU and INT was significant and resulted in a significant improvement in the relationship between INT and TenAS: R2-chng = 0.0173, F(1, 397) = 9.91, p < .01. Moreover, as plotted in Figure 3, results of the conditional analysis indicated that when PU was high, the positive impact of INT on TenAS increased (b = 0.384, t = 5.96, p < .001), but when PU was low, the positive impact of INT on TenAS decreased (b = 0.176, t = 2.93, p < .01). Hence, hypothesis 8 was supported. Second, the overall binary interaction between ENJ and INT was significant and resulted in a significant improvement in the relationship between INT and TenAS: R2-chng = .0217, F(1, 397) = 11.64, p < .001. As plotted in Figure 4, the positive impact of INT on TenAS increased when ENJ was high (b = .601, t = 8.06, p < .001) and decreased when ENJ was low (b = .322, t = 6.02, p < .001). Therefore, hypothesis 9 was supported.
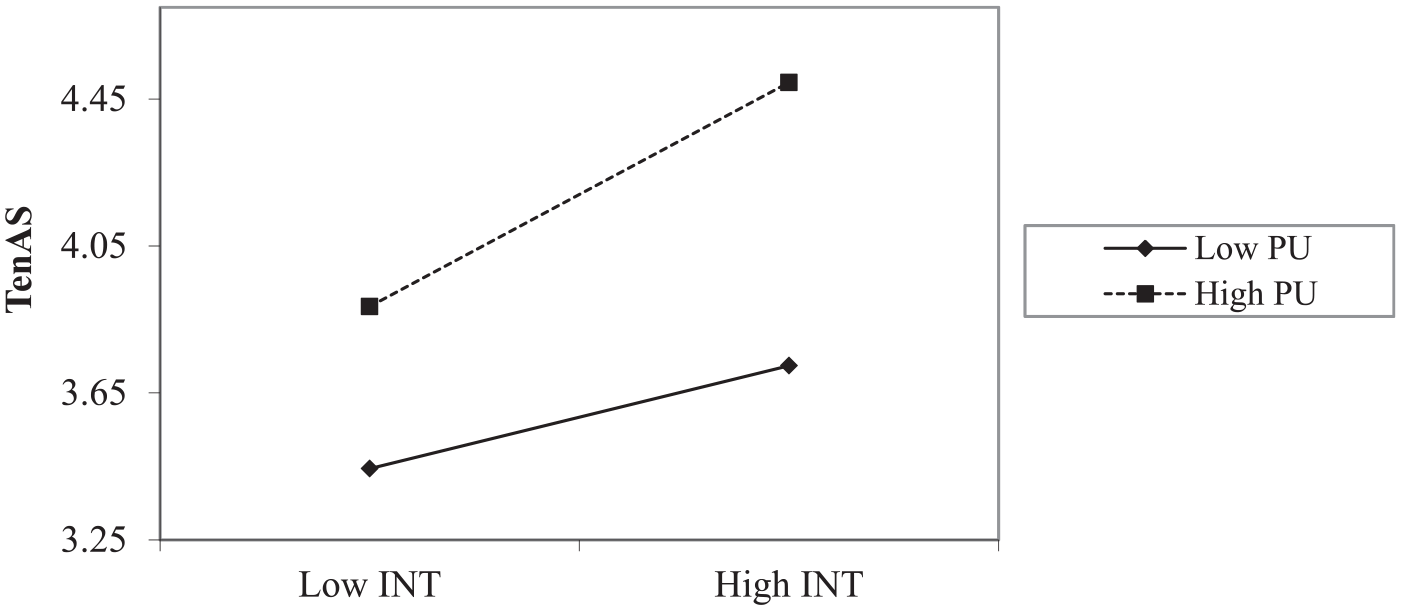
Interaction of PU and INT on TenAS.
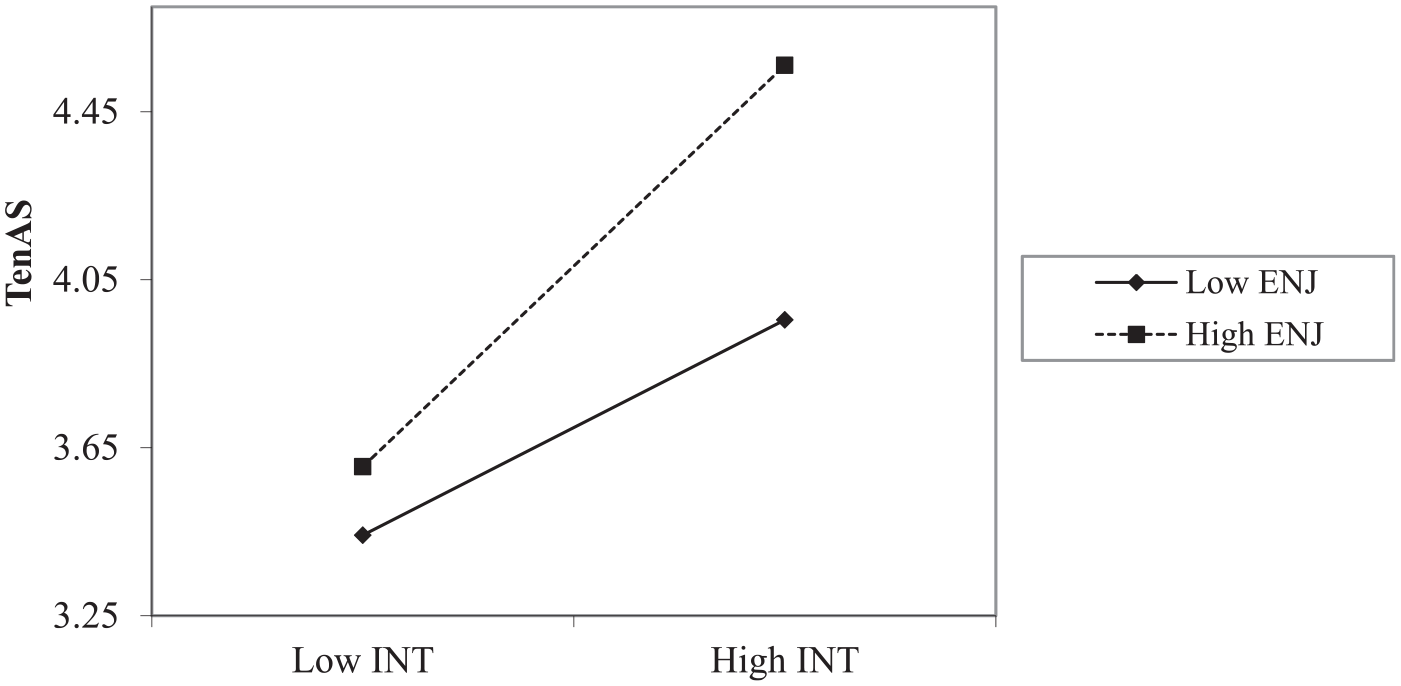
Interaction of ENJ and INT on TenAS.
Discussion
First, the results proved that PEOU is a significant predictor of PU and ENJ. This result is in line with the findings of previous studies that confirmed the significant impact of PEOU on PU (e.g., Chung, Han, and Joun 2015; tom Dieck and Jung 2018; Xia, Zhang, and Zhang 2018; Kaushik, Agrawal, and Rahman 2015) and ENJ (e.g., Huang et al. 2013; Manis and Choi 2019; T. Li and Chen 2019). Second, the results indicated that 71% of the INT is predicted through the combined effect of the four antecedents included in the model, which indicates the strength of the developed model in predicting the INT during periods of crisis such as COVID-19. When comparing the individual impacts of different antecedents, it can be noted that PU had the highest impact on the INT. This result is consistent with the results of Davis (1989) and Huang et al. (2013) in the context of human–computer interactions, and 3D virtual world tourism sites respectively, where it was found that PU was the main antecedent behind the adoption of computers and 3D virtual world tourism sites. Similarly, many of the qualitative comments of the survey focused on the importance of the usefulness of the VTs. One of the respondents stated: VR is going to be more useful if they are supported with a voice information. Virtual tours may be combined with an introductory video giving background and describing what these sites include. It is very important to add sound (audio) explanation to the virtual tours as it is more convenient than reading. In addition, adding some background music related to site would improve the experience.
Similarly, a significant impact of ENJ on INT was confirmed. This result is similar to the findings of Tussyadiah et al. (2018) in the context of VR experiences for tourism destinations, who found that the ENJ of tourism destination VR experiences was a significant predictor of users’ attitudes and intentions to travel to the destination afterward. Moreover, consistent with previous findings in other contexts (e.g., Lindell, Arlikatti, and Prater 2009; Liu, Ouyang, and Cheng 2019), the findings of the current study confirm the significance of HRA, or, in other words, perceptions of VTs as a safe alternative to actual site visits during the spread of COVID-19, in predicting the INT. This significant impact implies that VTs can be considered as safe alternatives to actual site visits during crises such as the spread of COVID-19, and can also serve other functions, such as marketing the destination, providing a convenient substitute to actual site visits for less privileged people, and enhancing the sustainability of the destination by enabling some people to visit the sites virtually rather than physically. Qualitative comments of the survey support the previous findings. A sample of respondents’ notes are stated below: At least with current technology, I think a virtual tour can only offer a fraction of the experience of an actual visit. However, depending on the circumstances, it might be more feasible to visit virtually than physically. Social distancing is just one (topical) reason but accessibility concerns for people with disabilities, environmental impact of travelling to sites, and affordability for less privileged people are also valid reasons to explore and offer alternative ways of experiencing sites. I think accessibility of virtual tours (in terms of ease of use, necessary equipment, visual impairments, etc.) are important to consider in this regard as well.
In addition, RP exhibited a significant direct effect on INT, confirming that people’s perception of danger, to themselves and their families, of crowded places, such as tourism sites, during the spread of COVID-19 drives them to adopt safer alternatives, such as VTs. This result is in line with the previous findings of Parady, Taniguchi, and Takami (2020) who found that RP during the COVID-19 pandemic induced Japanese people to adopt self-protective behaviors, such as eating out less frequently, reduced trip frequencies, and reduced participation in leisure activities. The same was proved by de Bruin and Bennett (2020), who found that RP of COVID-19 was associated with protective health behaviors, such as canceling or postponing air travel plans.
Third, a significant positive impact of INT on the TenAS was found. This implies that when users perceive VTs as enjoyable and useful, this stimulates their desire to try other VTs about the site or similar sites in the future, which in turn increases their desire to visit the actual site. This result is similar to those of previous researchers studying virtual tourism environments, who identified positive correlations between attitudes toward the destination, captured by the enjoyment of the VR experience and intention to visit the destination (Tussyadiah et al. 2018), and attitudes toward the VR experience captured by VR content quality, VR system quality, and VR vividness on the intention to visit the destination (M. Lee et al. 2020). Samples of the respondents’ notes supporting this result are stated below: I found the virtual tours very easy to do even with my limited understanding of technology. I think virtual tours can provide a lot of information in a much more fun way than reading about a site and give the participant a feeling of the atmosphere in a place. They can also motivate people to actually visit the site. I don’t think that they can ever fully replace the experience of visiting the site in person. In the present situation of the virus and if there is no way to go there personally, virtual tours can be a good substitute. As much as it was a phenomenal experience to visit and know about a site through a virtual tour with just the use of a smartphone, but the actual experience of visiting a site would always be the more engaging, meaningful and memorable experience. However, I feel like idea of VTs would really interest many people to actually consider and visit the site itself.
Finally, PU and ENJ had a moderating effect on the positive relationship between INT and TenAS. This confirms that VTs can be considered as catalysts for tourism site visitation and that tourist destinations should be highly concerned with the quality of their VTs in terms of ENJ and PU. This result is consistent with findings of previous researchers who found that virtual tourism experiences could stimulate, rather than hinder, tourists’ willingness to visit the real tourism sites (e.g., Tussyadiah et al. 2018; M. Lee et al. 2020).
Research Implications
Theoretical Implications
Overall, the current study has made a significant and original contribution to the existing literature by answering the call of Marangunić and Granić (2015) to incorporate factors from other theories into the TAM framework. Specifically, the researchers have demonstrated how the TAM and PADM theories integrate to explain the adoption of technological alternatives in times of crisis. Furthermore, the current study has made a substantial addition to the TAM. Beyond reaffirming the influence of PU and ENJ on behavioral intention, the current study has demonstrated, for the first time, that the aforementioned factors also exhibit moderating effects. Finally, by combining the two theories into one framework, the factors that are most influential, regarding the INT during times of limited access to touristic and cultural attractions, may be determined.
The results have revealed that, in general, characteristics related to the VT itself, such as how easy it is to use, how enjoyable the experience is, and, particularly, how useful the tour is, bears the most influence on whether a person will adopt VTs. Though still effective determinants, it has been found that, in general, characteristics related to the tourist, such as their perception of risk and their belief that VTs are safer alternatives to actual site visits, are less influential. Such information is critical for touristic and cultural site managers as it becomes more important than ever to engage with potential visitors online.
Practical Implications
Given its importance for the model, site managers who intend to develop VTs should prioritize the PEOU factor. It is clear from the respondents’ comments that two issues in particular should be addressed. First, VTs should be accessible. This means that people from different backgrounds and from different devices should be able to use it. Second, as interest in a tourist site will attract people with various levels of computer literacy, navigation in the VTs should be designed to be as simple as possible, and an orientation, tutorial or practice session should be included at the start of the tour.
The factor of PU has also proven particularly important in the model, both directly and as a moderator. It is necessary to appreciate the different reasons that a person would want to experience the VT. It may be that a person has a specific interest in the site’s qualities (history, culture, architecture, etc.), that they are anticipating a holiday and determining whether the site will suit their interests, or that they are simply interested in the novelty of the technology. Whatever the reason, the VT should possess qualities that will appeal to visitors of all these interests. First, for those persons using the VT to gain more knowledge about the site, the VT should make the most of its “informative” aspect and incorporate attributes of the site that would not necessarily be included in a physical tour, such as music samples, video clips, pictures, or local stories. Furthermore, the VT could have “information points” that provide more comprehensive details of the site, or “special access points” that allow visitors to enter “restricted” areas or places that may not even exist anymore.
Second, for those persons deciding if they would like to visit the site for an upcoming holiday, an introductory video should be presented before the tour is undertaken. This video should provide an overview of the site, its importance and, as with any product, the benefits of visiting. Furthermore, different tour modes could be made available based on the level of freedom that the user prefers, with a predetermined path option and an unguided option for example. Third, for those persons interested in the VT as a technological novelty, it is important to make the most of the digital format, in which a person is not necessarily limited by real-world physics. This could be done a number of different ways, by enabling the user to view places and objects from a variety of different angles, offering “X-ray” vision to see different layers of buildings or streets, or having “time travel” at various places to see what the site looked like in the past.
In much the same way, the factor of ENJ should be strongly considered when designing VTs. To achieve this, VTs should be interactive. For example, the user could “uncover” artifacts with some brush-like strokes of their mouse/finger or gain access to different areas by solving puzzles. The VT could allow for a certain degree of personalization, and the visitor could be allowed to leave virtual messages for others to read, modify the color and pattern of virtual objects, and even customize their own characters and avatars. The VT should also be stimulating. By making the VT compatible with other technologies like virtual reality, the VT could be multisensory and provide a greater sense of immersion. Accordingly, for those with the appropriate equipment, the site could be touched, heard, and navigated in a realistic, but enhanced, fashion.
This research has also demonstrated how VTs are particularly popular during crises. But beyond COVID-19, site managers should keep in mind the potential of using VTs as a promotional tool for generating future demand during any time of temporary closure, be it for renovation, weather, and climate considerations, or when conservation requirements limit the number of visitors at any one time. In addition, VTs allow the site to be discovered by people who would otherwise never have the chance of visiting the real site, such as those with mobility issues or underprivileged people, thus serving a very important social and educational function. Therefore, site managers should contact the relevant authorities and organizations to ensure that these people have the opportunity to access the VT and ensure that the appropriate equipment is made available if necessary (computers, tablets, virtual reality gear, etc.). In this context, VTs could be of relevance to educational curriculum at school and university levels—allowing students to experience the site, especially when visiting the actual sites proves to be difficult.
Lastly, the most important finding in this research for site or destination managers is that VTs do not replace the experience of a real visit. However, in order to capture the benefit of VTs as a promotional tool, an incentive, linking the VT to the actual site, could be established in the form of discount vouchers or other freebies to be enjoyed at the site once the visitor has already experienced the VT. Furthermore, as can be understood from the moderators, the more enjoyable and the more useful the VT is, the more a person will want to visit the actual site. Therefore, site managers should invest in creating VTs and allocate resources and effort toward making them attractive, informative, and fun. The VTs should be displayed on official websites and major communication channels and be easy to find when potential visitors are entering relevant keywords or key phrases into different search engines.
Limitations and Future Research
The current study has some limitations that can be addressed by future researchers. First, the results of the study were based on one form of virtual tourism, which is VTs. Therefore, future studies should test the current model across different types of virtual tourism experiences. Second, the current study identified only one factor (INT) as an outcome of the VT experience, which in turn predicts the TenAS. Future research should test the efficacy of some other important factors (e.g., perceived value and satisfaction with the virtual experience) in predicting the TenAS. Third, the current study investigated only one background factor, PEOU, that predicted PU and ENJ. Future studies should investigate other background antecedents of PU and ENJ in the context of virtual tourism. Finally, the data gathered for testing the research hypothesis was relevant to only one crisis, which is COVID-19. The efficacy of the model to predict the INT across different types of crisis (e.g., terrorism, city pollution, actual site damage, natural disasters, and other health risk crises such as SARS and Ebola) needs to be tested and validated.
Conclusion
This research was conducted in response to the sudden release of VTs by cultural and touristic attractions during the COVID-19 pandemic, who had no other way of maintaining visitor interest during the travel restrictions. The researchers wanted to highlight the factors that would influence the INT during this time and investigate the effect that this adoption would have on the TenAS in the future. In this regard, the results have been overwhelmingly successful. Following a thorough review of the existing literature, an integrated framework combining the TAM and PADM theories together was, for the first time, successfully developed and tested. Using an online survey, the researchers demonstrated that three factors from the TAM, being PEOU, PU, and ENJ, and two factors from the PADM, being RP of catching COVID-19 and HRA, determine a person’s INT as a safer alternative to actual site visits. Furthermore, the research revealed that the INT increases a person’s TenAS at a later stage, providing much needed evidence to suppress misconceptions that VTs are competitors or substitutes for actual site visits. In this regard, the research made another novel discovery, and both PU and ENJ of the VT experience were found to moderate the relationship between INT and TenAS.
Footnotes
Appendix
Examples of the Most Memorable Heritage Site Virtual Tour.
| Heritage Site | Country |
|---|---|
| Tombs at the Valley of kings and valley of the queens in Luxor | Egypt |
| Ancient Egypt | Egypt |
| Bahla Fort | Oman |
| City Tour for Prauge | Czech Republic |
| Egyptian Museum | Egypt |
| Frida Kahlo’s House/museum | Mexico |
| Granada | Spain |
| Historisches Museum Frankfurt | Germany |
| The British Museum | UK |
| Persepolis | Iran |
| Louvre Museum | France |
| The White House | USA |
| Madeira | Portugal |
| Mecca | Saudi Arabia |
| El Moazz street | Egypt |
| Natural History Museum | UK |
| Petra | Jordan |
| Rijksmuseum Amsterdam | Netherlands |
| Royal Horticultural Society | UK |
| Saqqara | Egypt |
| Spanish museum | Spain |
| Stonehenge | UK |
| The Pyramids | Egypt |
| Oriental Institute Museum | USA |
Declaration of Conflicting Interests
The author(s) declared no potential conflicts of interest with respect to the research, authorship, and/or publication of this article.
Funding
The author(s) disclosed receipt of the following financial support for the research, authorship, and/or publication of this article: Open access publication for this article was supported by a fund from the German University of Technology in Oman (GUtech).