
Abstract
This study proposes a dynamic model for identifying the optimal amount of tourism taxes at the different stages of a destination’s lifecycle. Based on the Ramsey-Cass-Koopmans model of economic growth, we reformulate the Cobb-Douglas function to incorporate new variables to estimate the optimal level of tax that could maximize the total output of the tourism industry while maintaining below the critical point of the destination’s carrying capacity. We illustrate the model with an empirical study using time series data collected from 31 administrative regions in mainland China from 2000 to 2016. The results suggest that the proposed model has satisfactory goodness of fit, and the estimated tax amount was congruent with the trends of tourism development at the destinations. The study offers practical implications for destination policymakers.
Keywords
Introduction
Tourism taxes are an important measure implemented in many countries to reconcile the conflict between tourism development and sustainability (Schubert 2010; Zhang and Zhang 2018). It is a valuable instrument to tackle many of the problems induced by tourism, such as land occupancy, sewage discharge, solid waste generation, ecological destruction (Mbaiwa 2003), greenhouse gas emissions (Perch-Nielsen, Sesartic, and Stucki 2010), energy consumption and depletion of natural resources (Becken and Simmons 2002). Modeling tourism tax for sustainability is an emerging topic in tourism studies and dedicated research is still growing (Heffer-Flaata, Voltes-Dorta, and Suau-Sanchez 2021; Palmer and Riera 2003; Piga 2003; Rey-Maquieira, Lozano, and Gómez 2009; Schubert and Schamel 2020).
Previous studies have predominantly focused on examining the impact of various tourism taxes in general (Ihalanayake 2012; Mahadevan, Amir, and Nugroho 2017; Sheng and Tsui 2009), or in specific such as carbon taxes (Dwyer et al. 2013), departure taxes (Falk and Hagsten 2019; Forsyth et al. 2014; Seetaram, Song, and Page 2014), and accommodation taxes (Heffer-Flaata, Voltes-Dorta, and Suau-Sanchez 2021; Lee 2014; Sharma, Perdue, and Nicolau 2020). However, there is a lack of theoretical integration in the literature to develop a dynamic model of tourism taxes for sustainable development. Economic theories such as externalities and public goods are often cited as the theoretical foundation for tourism tax modeling (Allan et al. 2014; Kilimani, Heerden, and Bohlmann 2015; Schubert 2010), yet concepts such as destination lifecycle (Butler 1980) have rarely been integrated with the research on tourism tax. The current tourism taxation policies around the world are mostly based on static equilibrium, which does not consider the changes in the dynamic evolution of a destination, as a result, cannot arrive at the optimal level of taxes (Jensen and Wanhill 2002; Schubert and Schamel 2020).
This study thus aims to develop a dynamic tax model for the estimation of optimal tax amount based on the destination lifecycle. We argue that the optimal tourism taxation policies should be a dynamic regime, which balances tourism development and its resultant externalities, and achieves the goals of economic development, social welfare and environmental conservation. Based on the Ramsey-Cass-Koopmans (RCK) model of economic growth, we employ the Cobb-Douglas production function (CDPF) to calculate the optimal tax amount. We examine the proposed model using a time series dataset (from 2000 to 2016) of 31 administrative regions (including provinces, municipalities, and autonomous regions) in mainland China. The optimal tax amount was estimated for each of the administrative regions along the respective stages of their destination lifecycle. The results suggested that the proposed model had satisfactory goodness of fit.
This study makes several contributions to tourism literature. First, this study proposes a dynamic taxation model for sustainable tourism development based on the destination lifecycle, and establishes an optimal threshold of tourism tax. The study illustrates the idea that the equilibrium of tourism tax at a certain stage of the destination lifecycle is a dynamic one. Second, the study provides fresh insights into leveraging the taxation system for a destination’s tourism development while maintaining its carrying capacity. Finally, the dynamic taxation model is particularly important in times of large perturbations or crises (Ponjan and Thirawat 2016), as it may support the resilience and recovery of the tourism industry.
Theoretical Background
Destination Lifecycle
Tourism destinations evolve over time, akin to a product that goes through the process of a lifecycle (Butler 1980; Oreja Rodríguez, Parra-López, and Yanes-Estévez 2008; Toh, Khan, and Koh 2001). Butler (1980) suggests that the lifecycle of a tourism area usually evolves through six stages. At the first stage, the exploration stage, the number of tourist arrivals is small. Tourism has little impact on either the physical or social environment, and the economic contributions of tourism are very limited. As tourist arrivals increase steadily, the destination evolves to the second stage, the involvement stage. Residents start to be involved in the provision of facilities and services for tourists. The first two stages can be considered as a sustainable zone, as the social-ecological system is self-sustainable (Boyd 2006). Later as more investments come in, the number of tourists keeps increasing, the destination enters the third stage, the development stage. The impact of tourism is noticeable, particularly in the physical environment, and some negative social impacts can also be felt. Residents’ tolerance of the negative tourism impacts slowly decreases (Boyd 2006).
As the investments in tourism supply and the number of tourists keep growing, the arrivals of tourists in the destination reach the critical range of the destination’s carrying capacity, which includes the fourth and fifth stages. At the fourth stage, the consolidation stage, there is increasing tension between tourism activities and the environment. Residents start to protest against the large numbers of tourist arrivals that have caused intolerable impacts on their daily life. Although the number of arrivals is still growing, the rate of growth reduces. As the destination enters the fifth stage, the stagnation stage, tourist arrivals reach the peak number, the social, economic, and environmental problems are prevalent. Eventually, the popularity of the destination declines and enters the final stage, the decline stage, or if proper measures and resources are available, it may rejuvenate (Butler 1980).
The critical point in the evolution process is the destination’s carrying capacity (Butler 1980). Carrying capacity is commonly defined as the maximum number of tourists that a destination can support, without suffering unacceptable negative impacts on the ecological, economic, socio-cultural environment (Cupul-Magaña and Rodríguez-Troncoso 2017; Wang et al. 2020). Within the limit, the destination has the ability to absorb and manage an increasing number of tourists without causing social and ecological degradation. Therefore, to be sustainable, it is suggested that tourism development at a destination should be limited to the first three stages of exploration, involvement, and development (Weizenegger 2006).
Externalities of Tourism Growth and Pigouvian Tax
It is well acknowledged that tourism development has both positive and negative effects (Heffer-Flaata, Voltes-Dorta, and Suau-Sanchez 2021). Tourism contributes positively to the destination’s employment, transportation infrastructure, resident income, and cultural heritage. However, a large number of tourist arrivals could bring negative effects on the ecological, social, and cultural environment, including issues such as overcrowding, traffic congestion, a saturation of construction projects, noise, litter, increased costs of living, income inequality, crime, damage to cultural resources, depletion of wildlife, and environmental degradation (Schubert and Schamel 2020).
In economics, the term “externality” is used to describe the impact caused to the third parties that are not directly involved with the production and consumption activities. The externalities of tourism growth can be economic, social, cultural, or ecological. The economic externalities are generally positive, while the social, cultural, and ecological externalities tend to be negative (Schubert and Schamel 2020). If the overall externality changes from positive to negative when tourism production and consumption activities reach a certain threshold, the costs of tourism outweigh its benefits. Depending on the stage of a destination’s lifecycle, the relationship between tourism and the destination’s social-ecological environment can be in symbiosis, coexistence, or conflict (Budowski 1976; Yang et al. 2018). Many tourist destinations (e.g., Venice, Florence) have suffered from over-tourism, that is, tourism activities have exceeded the destination’s carrying capacity (Gössling, McCabe, and Chen 2020). Consequently, the experiences of both tourists and residents suffer (Chen, Cottam, and Lin 2020; Lin, Chen, and Filieri 2017).
The externalities usually are not included in the factors that tourism businesses and tourists would consider in their decision process (Palmer and Riera 2003). The price of tourism products and services does not reflect the cost of these negative externalities. As the price in the market equilibrates supply and demand, the results are not optimal for society as a whole. This is what is considered a market failure (Gooroochurn and Thea Sinclair 2005; Pigou 1920). To correct this problem, the Pigouvian theory (Pigou 1920) argues for imposing a tax that is equivalent to the cost of the negative externalities on the producers or users, so that the tax is factored in as a cost of the production or consumption, and consequently is reflected in the price of the product or service. In this way, the market becomes efficient, and optimum social benefits can be achieved. However, the Pigouvian tax design has practical limitations, for instance, it is difficult to quantify the negative externalities, particularly those non-economic externalities (Schubert and Schamel 2020), resulting in inaccurate tax calculation (Witkin 2019).
Tourism Taxes
Tourism taxes exist in various forms such as accommodation tax, air passenger duty, and value-added taxes, and it is estimated that there are about 40 types of tourism taxes around the world (Heffer-Flaata, Voltes-Dorta, and Suau-Sanchez 2021). Taxes imposed on the tourism businesses (e.g., for air pollutants and solid wastes) can internalize the environmental cost into the production cost and market price. Increased tourism prices may subsequently reduce tourist demand. With reduced production and consumption activities, the negative impact of tourism decreases. Similarly, when taxes are imposed on tourists (e.g., departure tax and accommodation tax), the higher cost of travel may reduce the number of visitors and consequently the associated carbon footprints (Falk and Hagsten 2019; Forsyth et al. 2014; Heffer-Flaata, Voltes-Dorta, and Suau-Sanchez 2021).
In addition to internalizing externalities, taxes have other objectives such as promoting social justice, improving efficiency, reducing income inequality, and generating employment opportunities (Deng 2007; Do Valle et al. 2012; Forsyth et al. 2014; Nguyen et al. 2021). In times of crisis, tourism taxes can help the industry to recover (Ponjan and Thirawat 2016). Tax-related policy instruments are often considered to be superior to other policy tools because they not only serve the purpose of rectifying the negative externalities but can also generate revenue to reduce distortion in the existing tax system (Kilimani, Heerden, and Bohlmann 2015; Palmer and Riera 2003).
Scholars have recognized that tax regulation may deviate from economic rationality and degrade efficiency (Mayor and Tol 2007). Over-taxation will result in a reduction of economic and social welfare (Dwyer et al. 2013; Ihalanayake 2012) and the destination may lose its competitiveness in the market (Durbarry 2008). Developing a model of optimal tax for sustainable tourism development has long been one of the most perplexing issues facing both academics and policymakers (Jensen and Wanhill 2002). An optimal tax is one that maximizes social welfare and minimizes the risk of inefficiency. Most existing taxation policies are based on static equilibrium, neglecting the changes in the dynamic evolution of a destination (Schubert and Schamel 2020), which cannot arrive at the optimal level that is efficient in mitigating externalities and maximizing social welfare (Jensen and Wanhill 2002). Moreover, inefficient taxes can also be inequitable, and face resistance from tourism businesses and consumers (Gooroochurn and Thea Sinclair 2005).
We argue that two critical issues should be considered in a tourism tax model, that is, the time and scale of the dynamics of a destination’s tourism development stage. At the initial stage of the destination lifecycle when negative externalities are minor, taxation at this time may be premature and could hinder the progress of the tourism industry. Overreaction should be avoided when the negative externalities are well below the critical level. On the other hand, a belated tax when the destination’s carrying capacity has been exceeded, the policy may lead to irreversible repercussions. However, previous studies have rarely incorporated the concept of destination lifecycle (Butler 1980) into the study of tourism taxes. Therefore, we propose a tax model that considers both the timing and the optimal amount of tourism tax along the different evolution stages of a destination’s lifecycle.
Model Development
Determining the Timing of Optimal Tax
We propose that the timing of a tourism tax is determined by the stage of a destination’s lifecycle. We assess the stages of the destination lifecycle by the number of tourist arrivals. This is because most studies in the literature use the maximum number of visitors that a tourism destination can support as a measure of its carrying capacity (Ma and Hassink 2013).
The mathematical model for the destination lifecycle curve
We use a logistic equation to model the evolution of the destination lifecycle. Formula 1 below represents the growth rate of tourist arrivals F(N).

Where
N = number of tourist arrivals
t = time
r = constant
At the early stage, tourism resources are under-exploited and the destination has sufficient capacity to accommodate the growing number of visitors. As tourist arrivals increase, the growth rate tends to slow down until the number of tourist arrivals reaches its maximum volume

Solving the above equation gets the value of N.

Where
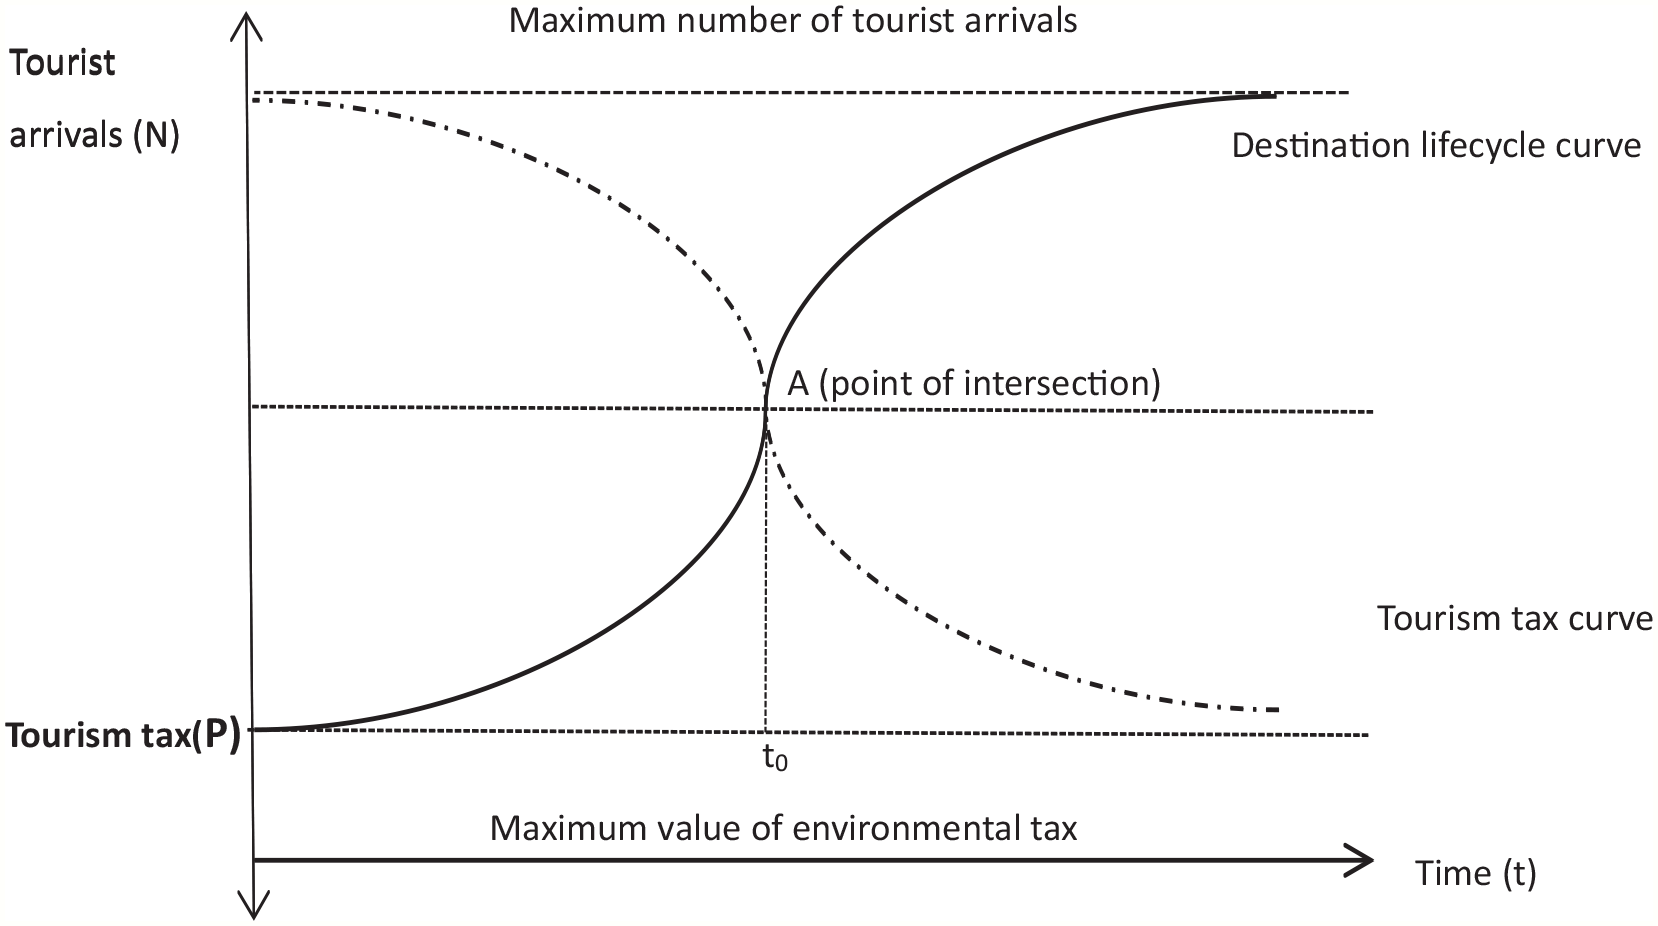
Destination lifecycle (the solid line) and tourism tax curve (the dotted line).
The mathematical model for the tourism tax curve
The mathematical model of the tourism tax was deduced according to the changes in tourist arrivals at the destination. Based on Formula 1, the growth rate of tourist arrivals is in proportion to N. Thus, we obtain:

It is also in proportion to

Formula 5 can be transformed into proportional function as:

Where
After transformation, the integral equation of Formula 6 becomes:

Using the method of undetermined coefficients to solve the above integral equation, we obtain:

Formulas 3 and 8 reveal that the tourism tax curve moves in the opposite direction of the destination lifecycle curve. It is an inverted S-shaped curve illustrated with the dotted line in Figure 1. The two curves cross each other at a threshold point when t =
Estimating the critical time for tax intervention
The intersection point of the two curves is a threshold for keeping the balance between tourism development and conservation of the carrying capacity. It can be defined by Formulas 3 and 8. Therefore, we have:

The above equation holds when
As illustrated in Formulas 3 and 8, the two curves have the common element of
Determining the lifecycle stages
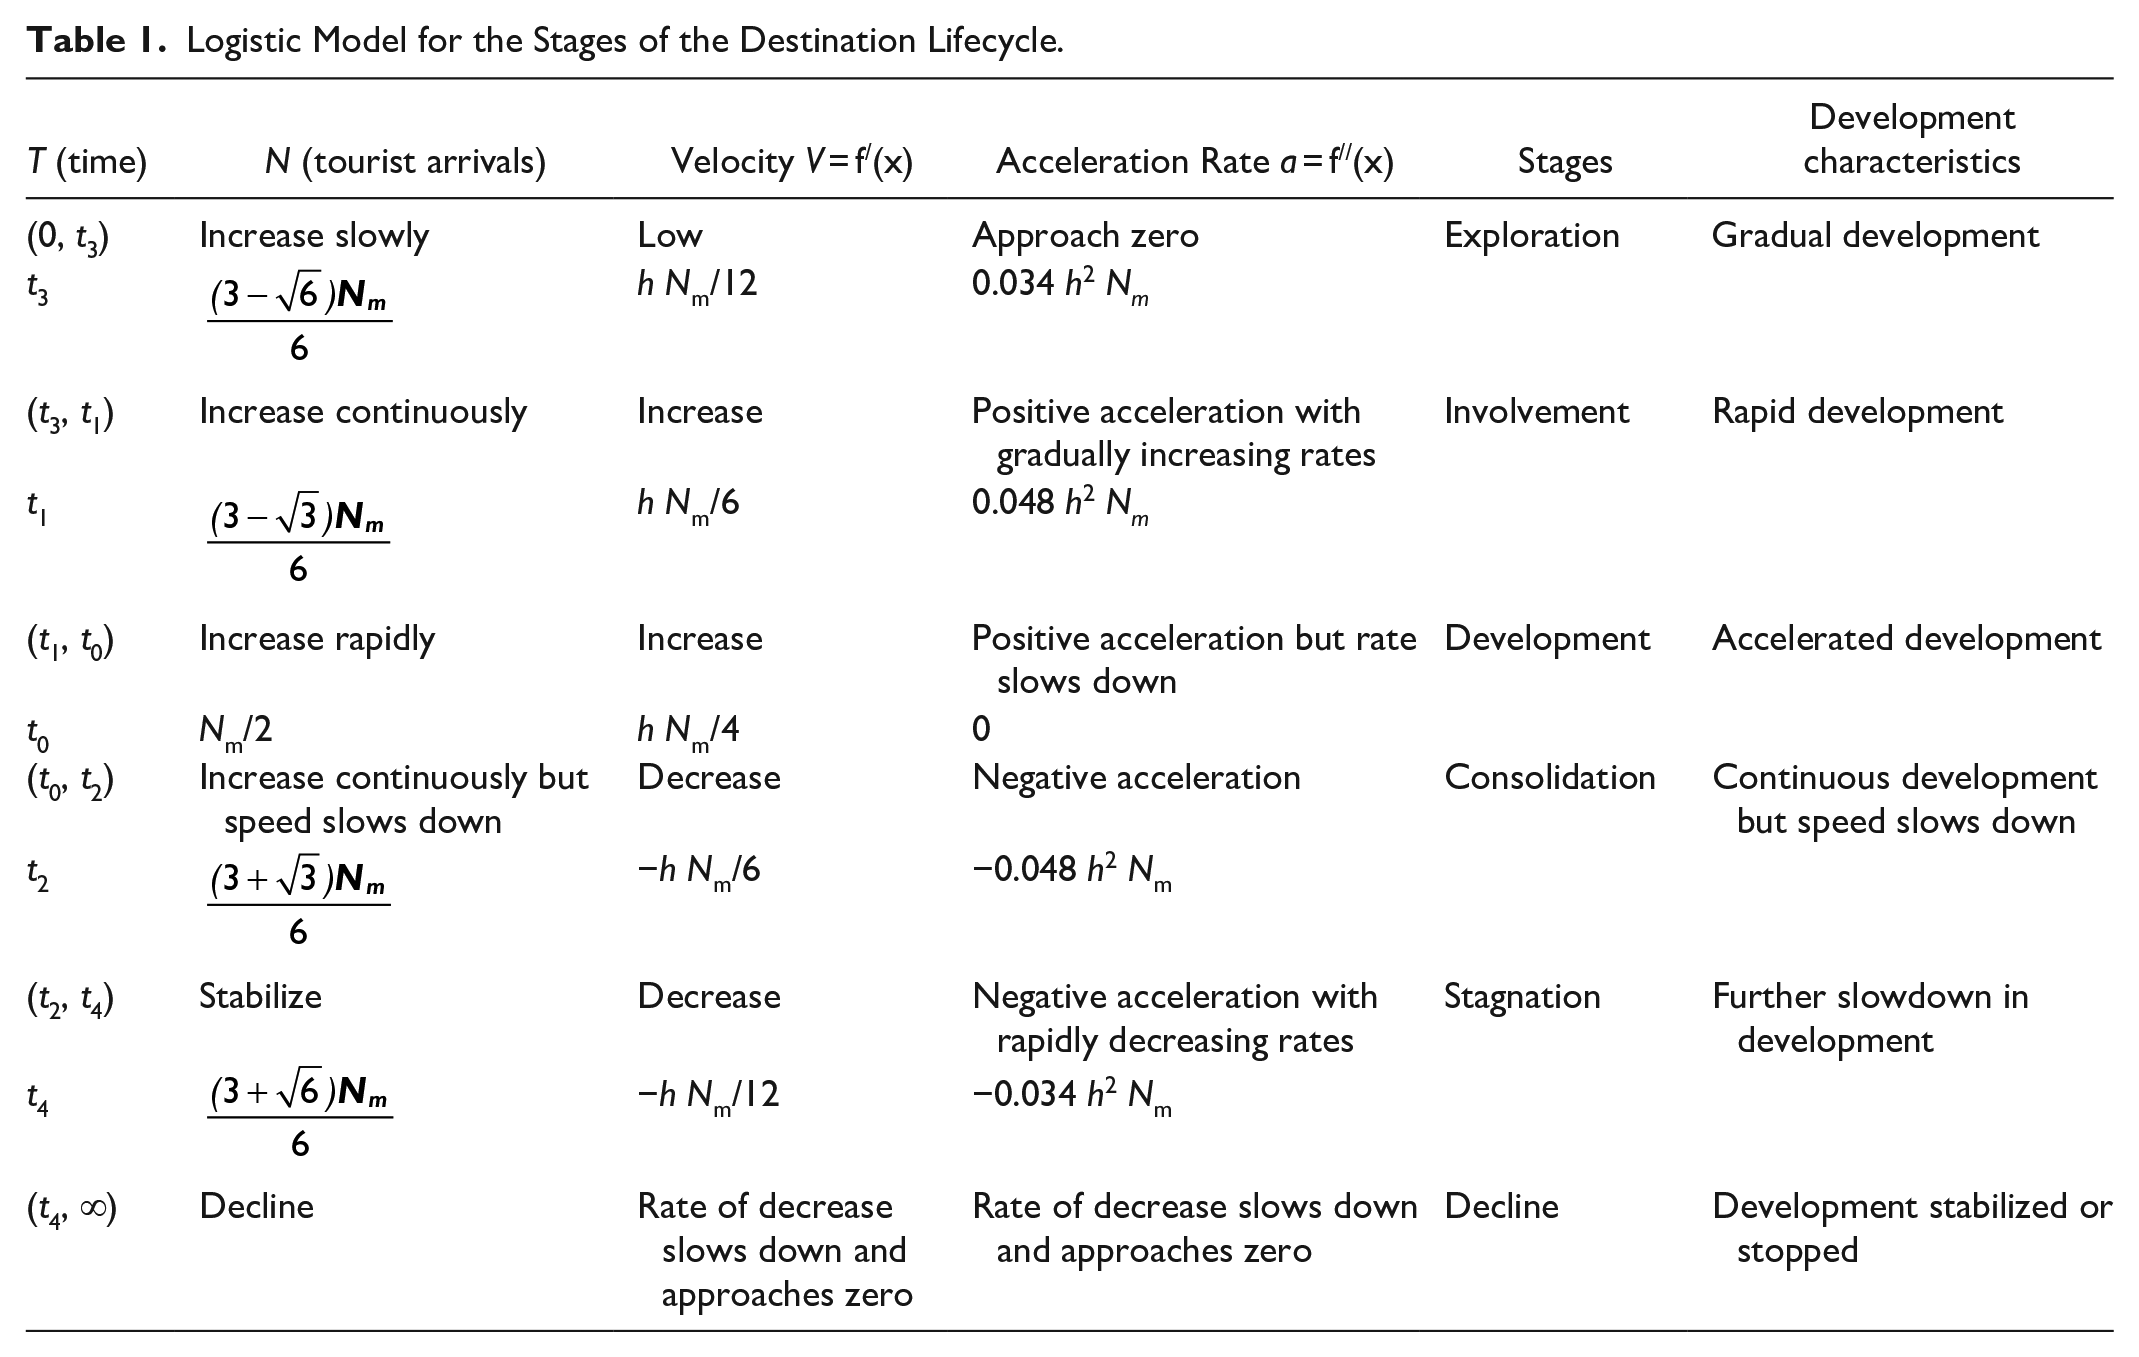
Based on the logistic model of destination lifecycle (Lundtorp and Wanhill 2001), we use the velocity and acceleration rate of the growth in tourist arrivals to determine the lifecycle stages. Table 1 shows the evolution of the destination lifecycle based on the changes in tourist arrivals.
Logistic Model for the Stages of the Destination Lifecycle.
The logistic model could be divided into two phases at the point when
The velocity of growth in tourist arrivals is represented by:

The acceleration rate of growth in tourist arrivals is defined as:

If the growth rate of tourist arrivals is uniform, then V is a constant. Thus, the formula for the number of tourist arrivals becomes


If the growth rate of tourist arrivals is not constant but its acceleration rate a is constant, then we have


If the acceleration rate a is not constant, we can use the average acceleration rate

If the acceleration rate is negative, the number of tourist arrivals becomes:

In the description hereinafter, the velocity and acceleration refer to their respective average values. Suppose in one period, the velocity and acceleration of the growth in tourist arrivals are:


By solving the derivative of

When

At this time, tourist arrival reaches its peak value Nm:

Determining the Tax Amount
At the early stage of tourism development, negative externalities are not an issue of concern. However, when tourism growth exceeds the carrying capacity, negative externalities make it unsustainable. Therefore, the production function should not only factor in the investment in capital and labor, but also internalize the costs of the negative externalities as an input. Based on the above argument, the Cobb-Douglas production function was reformulated as:

Where
Yt = total production of tourism industry at time t
Ly, t = tourism industry labor input (measured by the number of people employed in the tourism sector)
β, θ are the coefficients of output elasticity of capital and labor, respectively.
With the imposition of tourism tax, profit for the firms is given by the following function:

where Ut,

The optimal tax amount is represented by Formula 26, where

This is the optimal tax amount proposed as it could maximize the profit of the production sector, and simultaneously regulate the firms’ behaviors for conservation of the destination’s carrying capacity (The detail of deriving the formula is presented in Appendix B).
Empirical Examination
Data
The data were collected from 31 administrative regions in mainland China. The dependent variable of the Cobb-Douglas production function is tourism receipt (Y). It is the total tourism revenue of a region, representing the overall output and the development status of the region.
Capital input is based on the investment in fixed assets of the tourism industry (K). The data was obtained from the China Tourism Statistical Yearbooks for the years from 2001 to 2017, which publish the fixed assets of tourism enterprises including tourist attractions, hotels, and travel agencies, as well as the total fixed assets of these tourism enterprises in each province, city, or autonomous region. The total fixed assets of the tourism enterprises in a destination were used as a proxy. Labor input (L) refers to the total number of person-hours worked in the tourism industry and the total number of employees in the tourism industry was used as a proxy. The data for the above variables were collected from the National and Regional Statistical Yearbooks and the Tourism Industry Statistical Communiques published from the year 2001 to 2017. Table 2 presents a sample of the dataset at the national level. Although regional differences exist, a region’s development is generally consistent with the overall trend at the national level. Therefore, the parameters of the Cobb-Douglas production function were estimated using the data at the national level. The data for all variables in 2003 were considered as outliers due to the outbreak of SARS epidemic in that year and removed from the empirical estimation.
Data for the Tourism Production Function at the National Level.
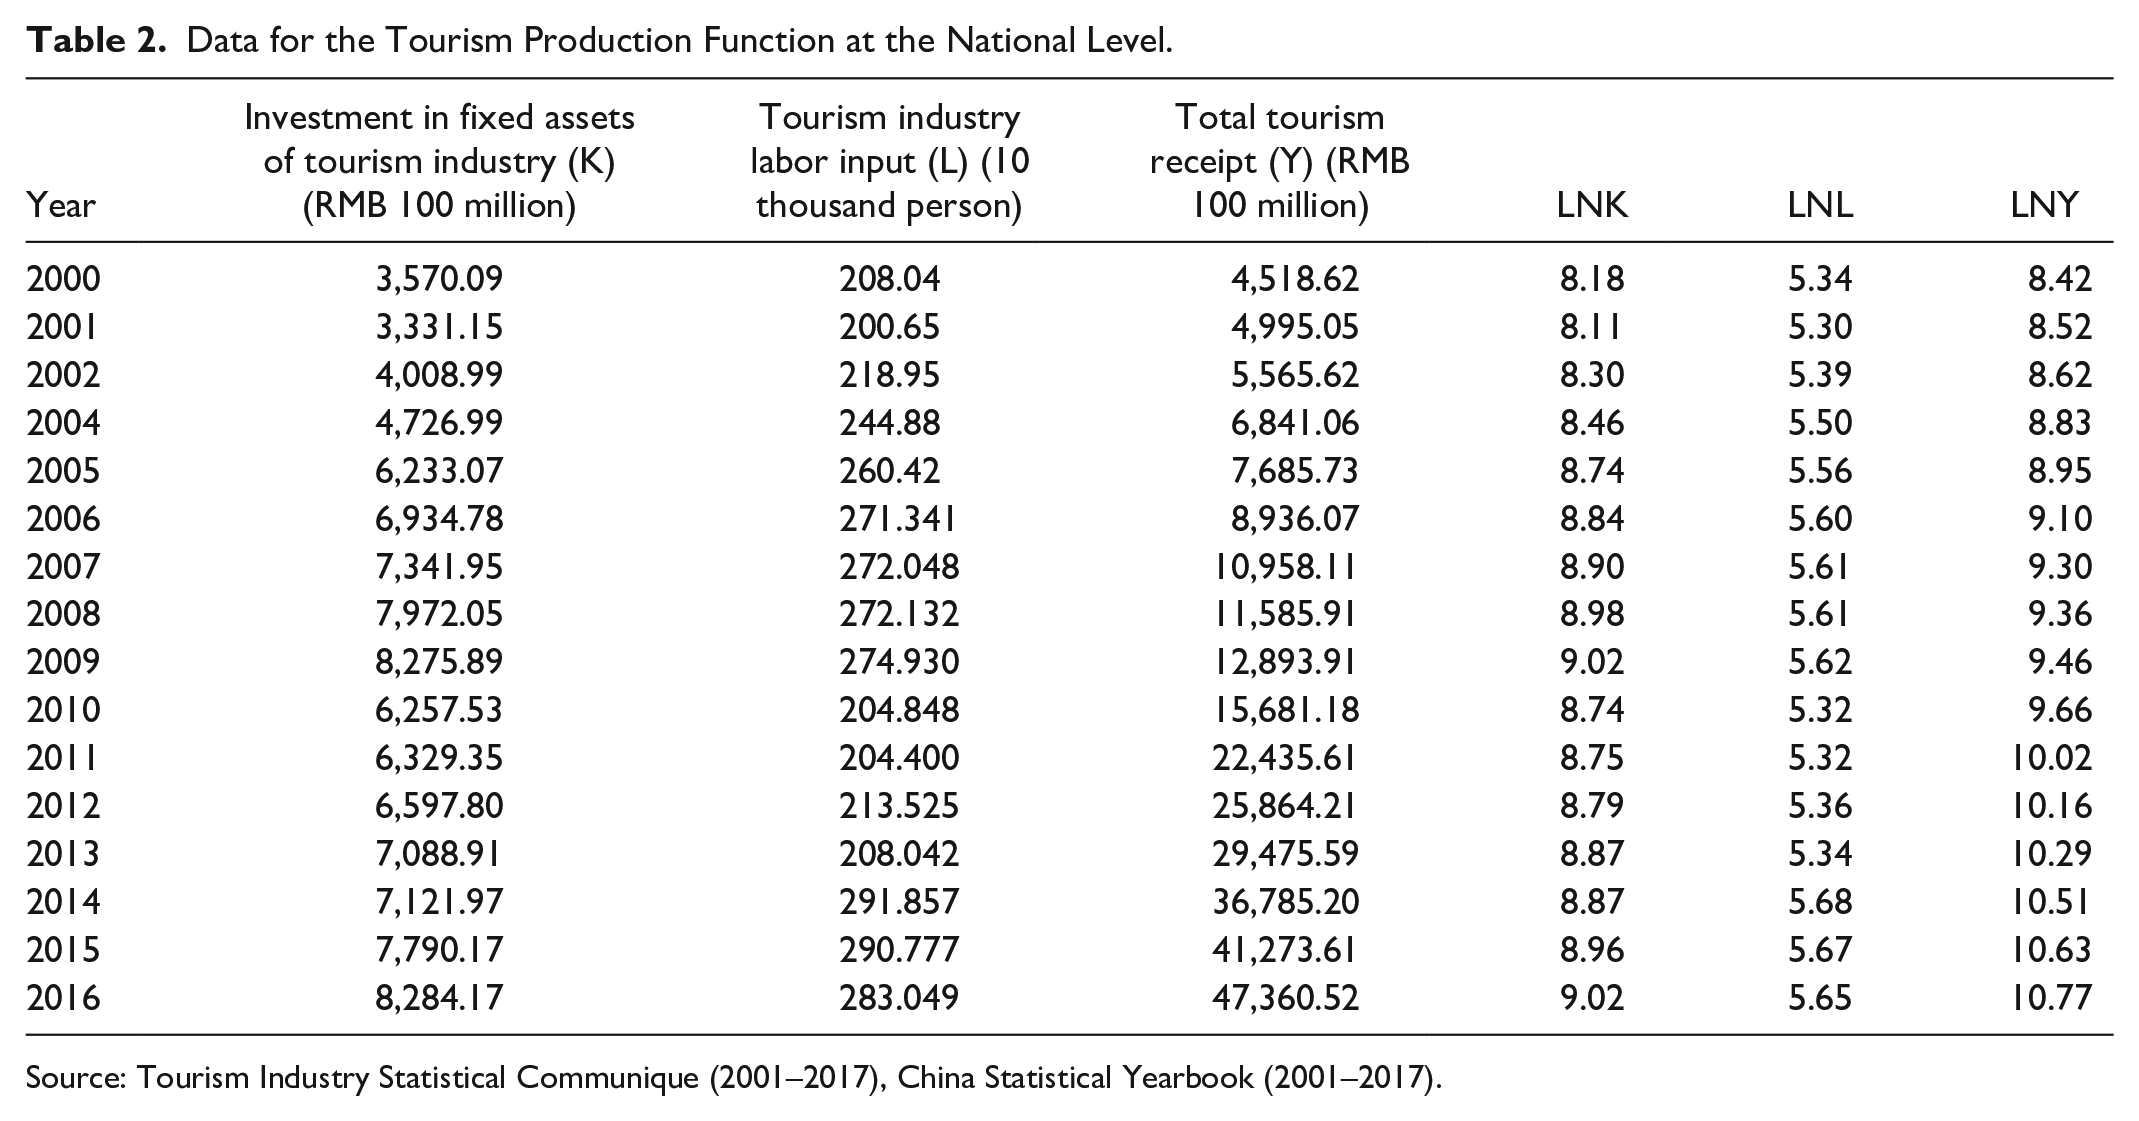
Source: Tourism Industry Statistical Communique (2001–2017), China Statistical Yearbook (2001–2017).
Estimating the Tourism Tax Amount
We employed Eviews7.2 to estimate the parameters of the function and test the goodness-of-fit of the model. First, by taking logarithm on both sides of the function, we get:

Then by applying the least square method, we obtain the estimated production function:

Some of the independent variables are highly correlated (0.855, and 0.884), indicating a multicollinearity problem. We, therefore, used ridge regression to re-estimate the equations (See Appendix C for the coding used for the estimation in R language). Ridge regression is an improved least-squares method. When applied to data that suffer from multicollinearity, the tolerance of ridge regression is much stronger than that of the ordinary linear least squares regression, and thus can provide a more precise parameter estimate (Assaf, Tsionas, and Tasiopoulos 2019). The modified model becomes:

The estimation results are optimized, and the LNK coefficient was positive. The estimated and actual values of the fitted model are shown in Figure 2.
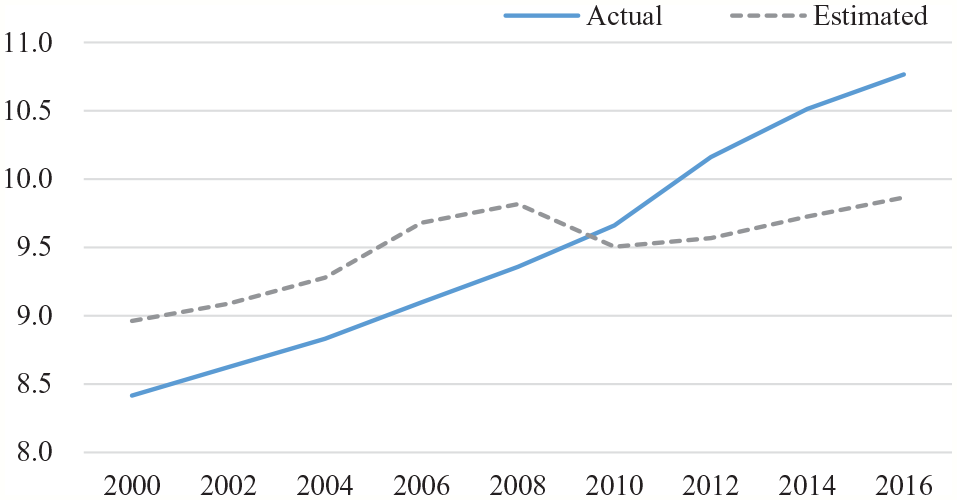
Estimated and actual values.
The final production function is represented by Formula 30.

Based on Formula 26, the estimated optimal tax amount is given by:

Identifying the Lifecycle Stages
Based on the formulas illustrated in the previous section (Formula 10–20), the evolutionary stages for the 31 destinations were estimated using Eviews7.2, and the results were presented in Table 3.
Estimation of Stages of Tourism Development and Tourist Arrivals.
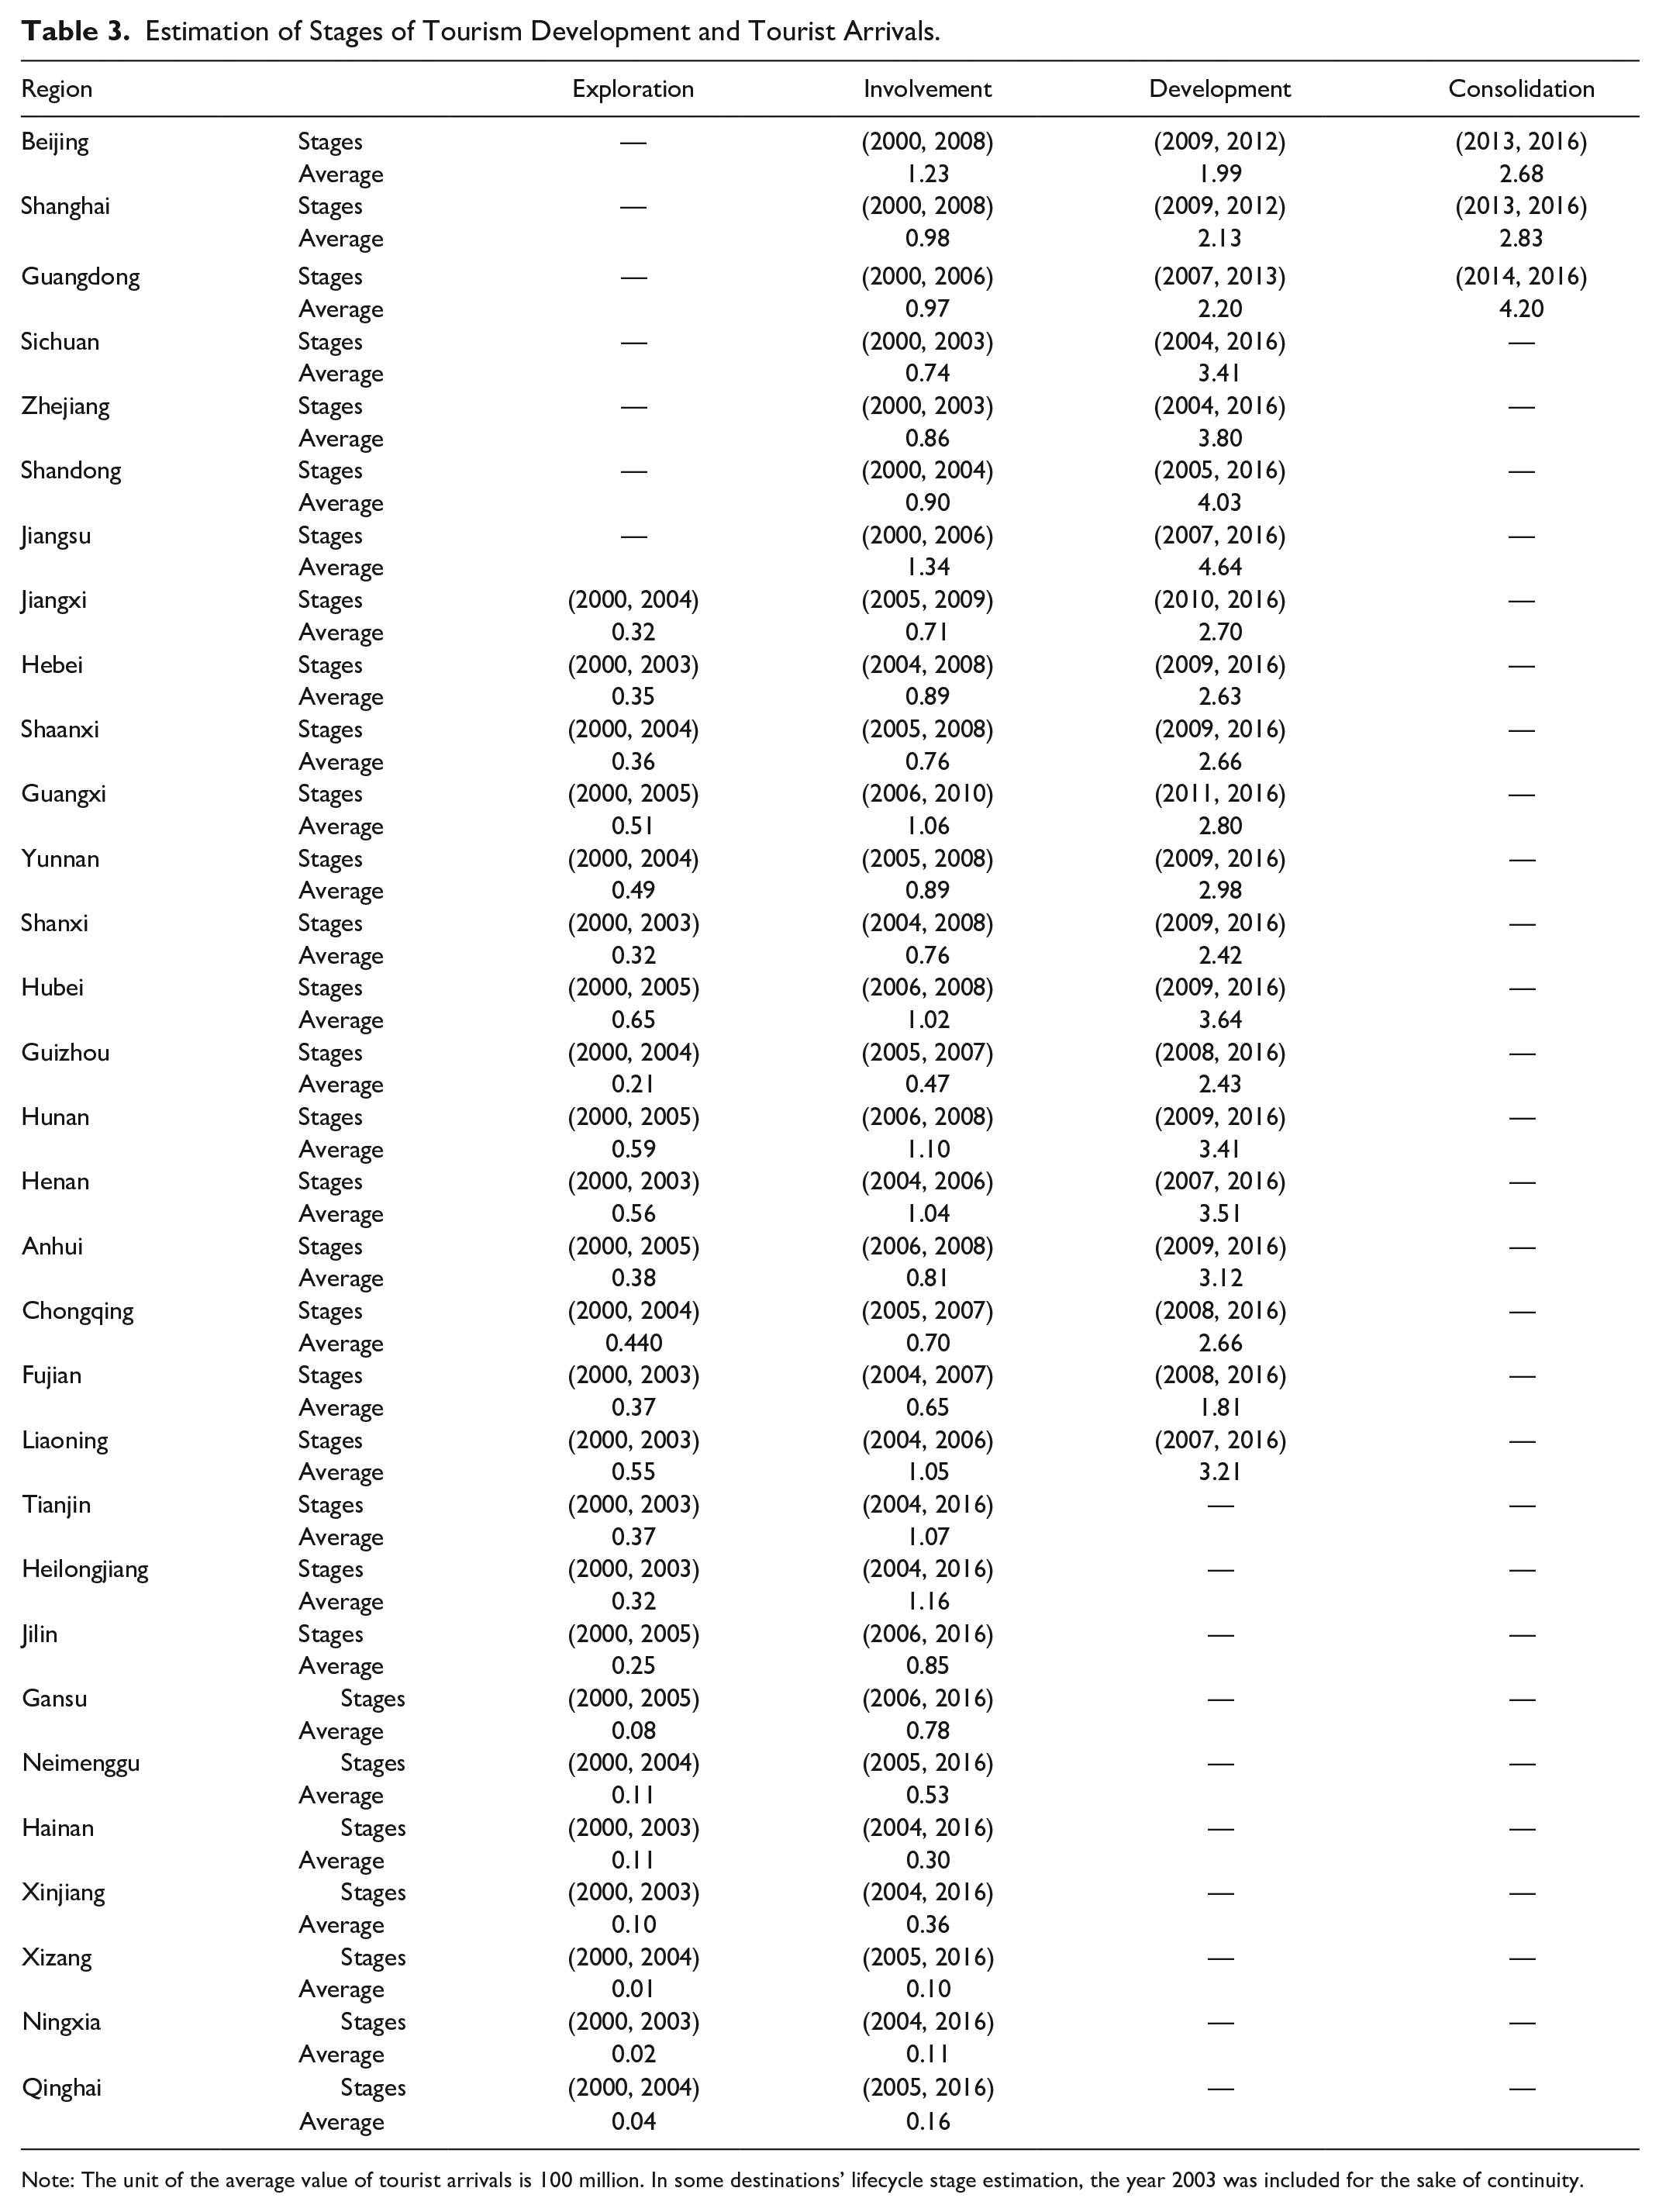
Note: The unit of the average value of tourist arrivals is 100 million. In some destinations’ lifecycle stage estimation, the year 2003 was included for the sake of continuity.
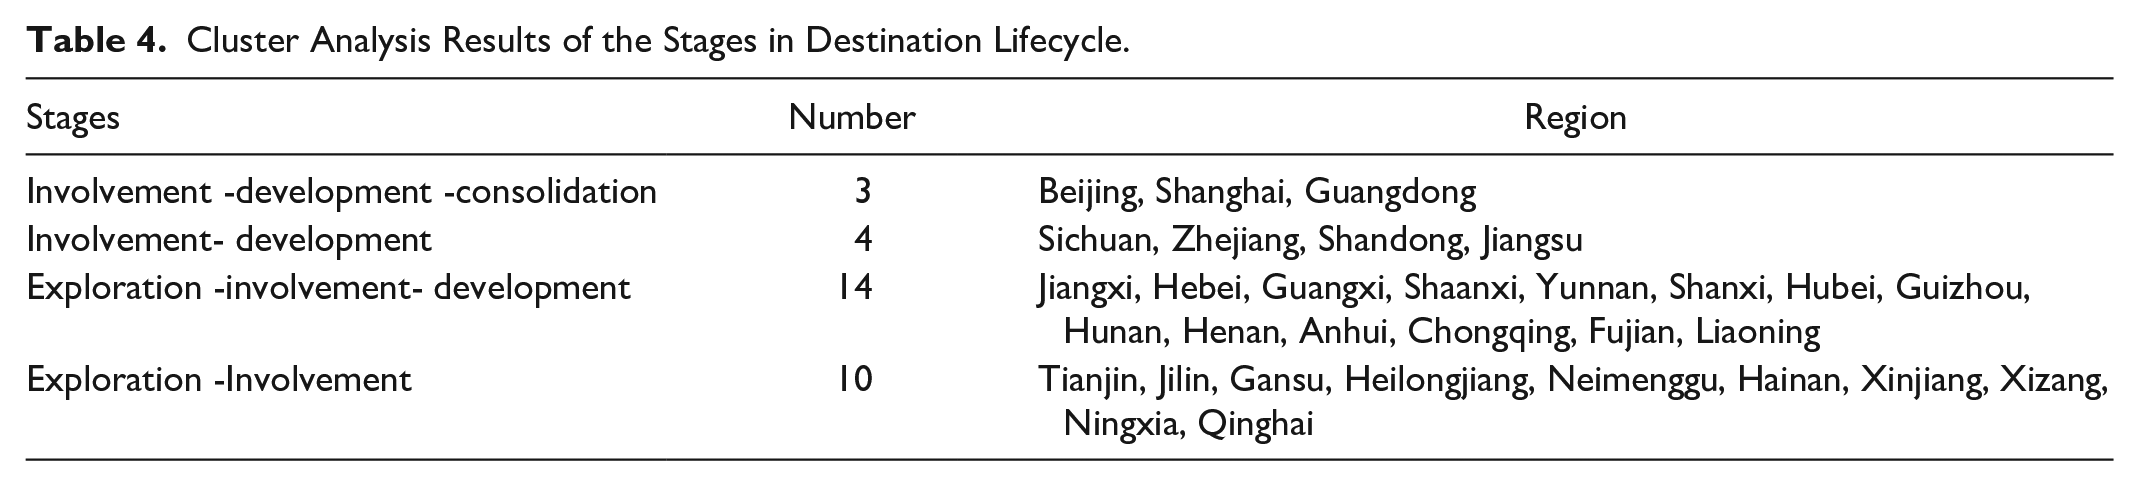
A hierarchical cluster analysis was conducted with the 17-year tourist arrival data. The results are shown in Table 4, which indicate that three regions (9.7% of the total) had reached the consolidation stage, 18 regions (58.1%) have entered the development stage, and 10 regions (32.3%) were at the involvement stage.
Cluster Analysis Results of the Stages in Destination Lifecycle.
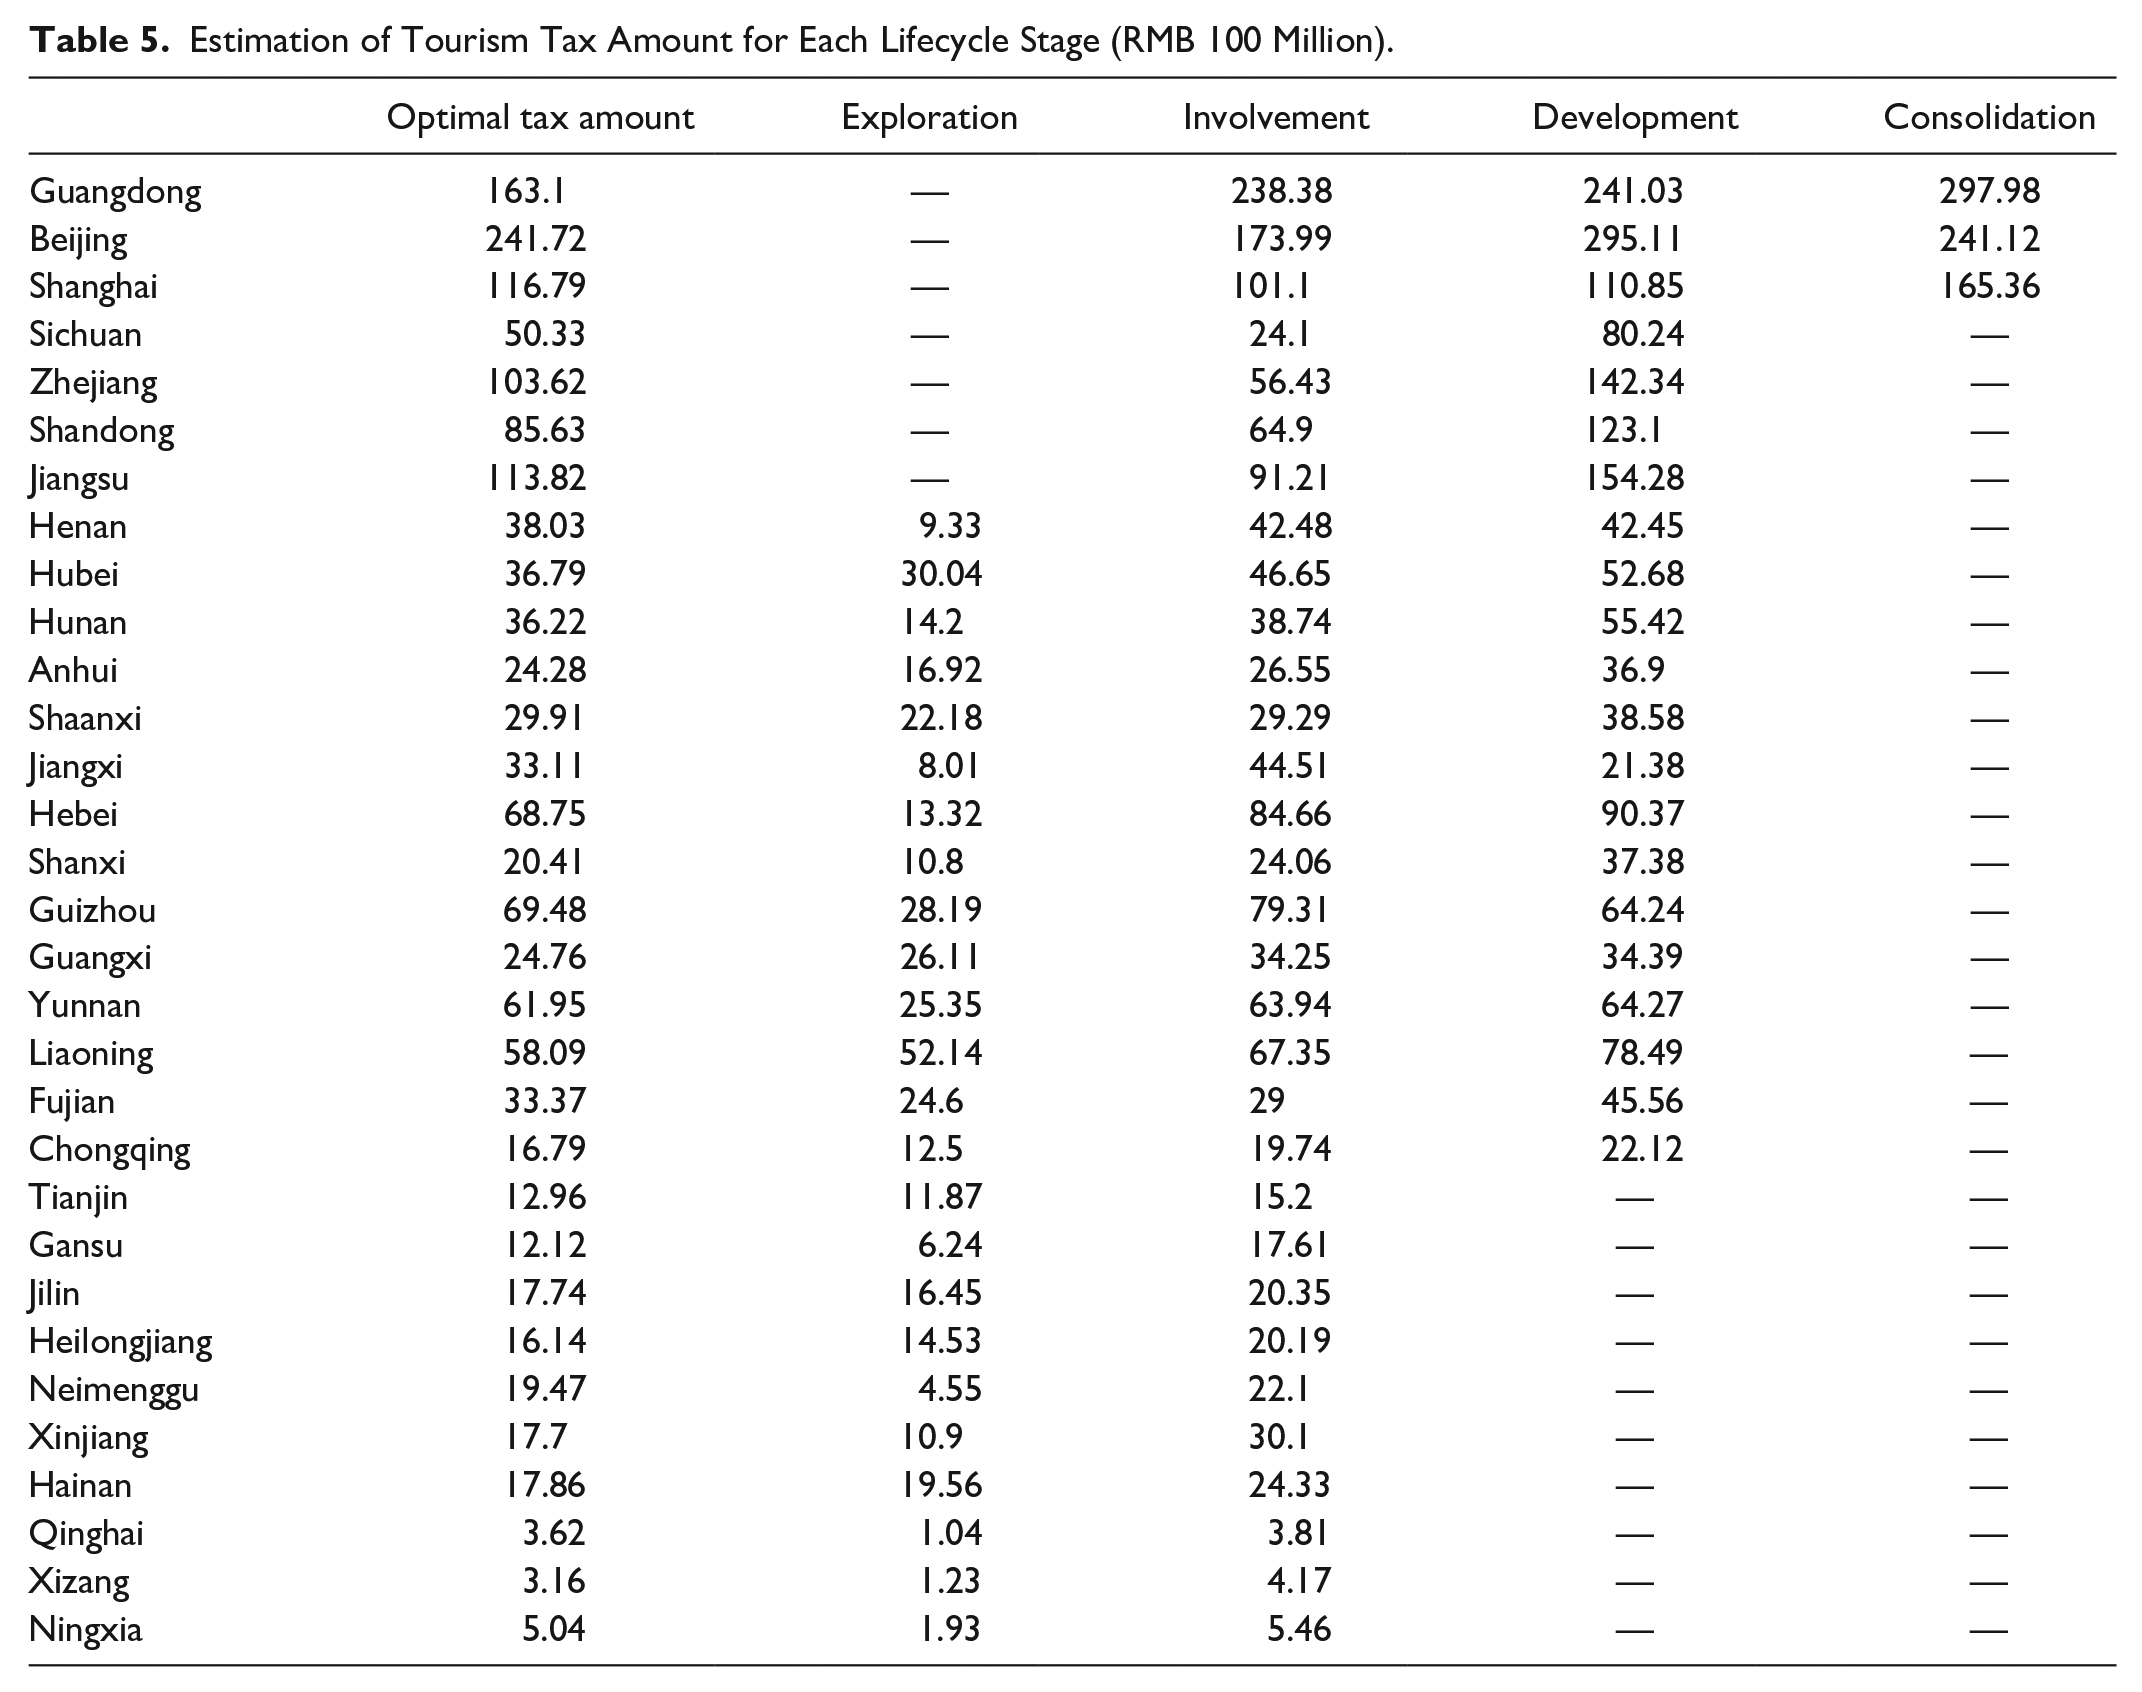
Estimation Results of the Tax Amount
The tax amount was the aggregate amount for a region at each stage of its lifecycle. Table 5 shows the estimated tax amount for each stage as well as the optimal tax amount at the critical time point for each of the 31 regions.
Estimation of Tourism Tax Amount for Each Lifecycle Stage (RMB 100 Million).
Validity Test
To test the validity of the estimated tax amount, we fitted the estimated tax amount to the model of destination lifecycle. If the estimated tax amount changes in accordance with the evolution of a destination along with its lifecycle evolution, then the validity of the model can be partially confirmed. The formulas for fitting the estimated tax amount into the destination lifecycle model are presented below.
Exploration stage
Estimation is not attempted for this stage, because the base value of tourist arrivals is small, and the minor environmental repercussion may not require the intervention of taxation at this stage.
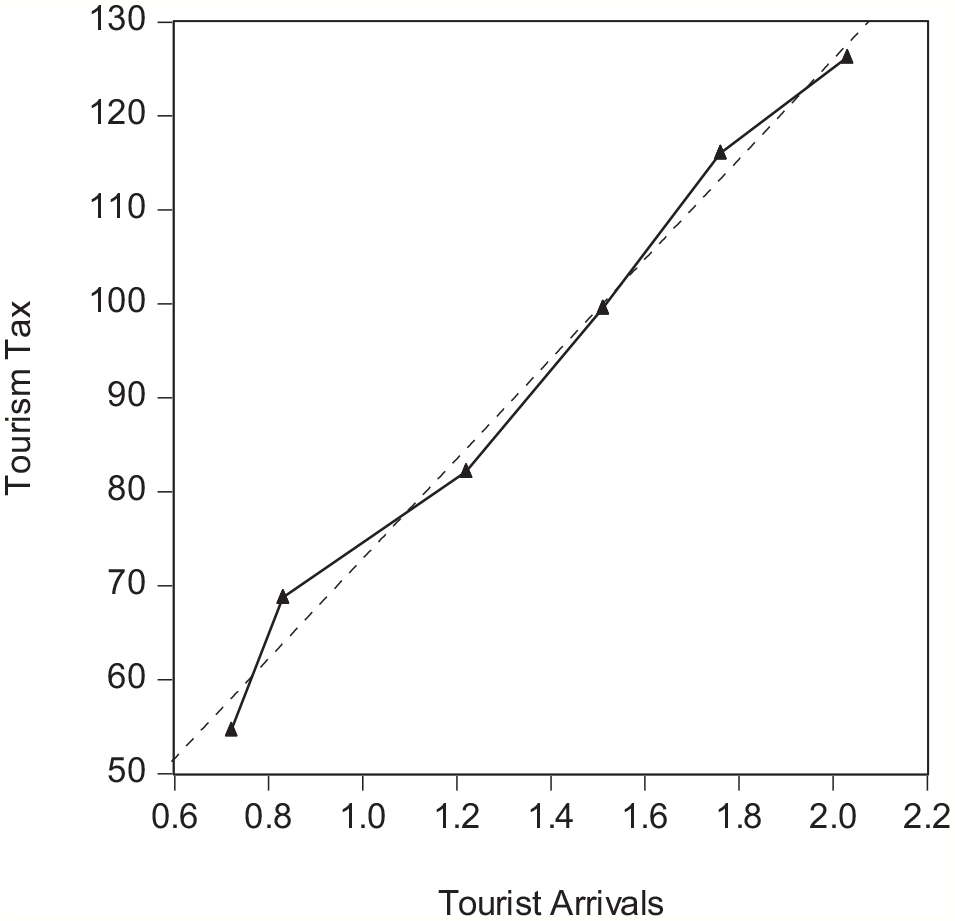
Involvement stage
The acceleration rate of tourist arrivals is small, and thus the velocity of tourist growth can be approximately regarded as a constant. In line with the change of tourist arrivals, tourism taxation should also follow the pattern of a linear equation. Thus, the tax amount could be represented by the following formula:

Where A corresponds to
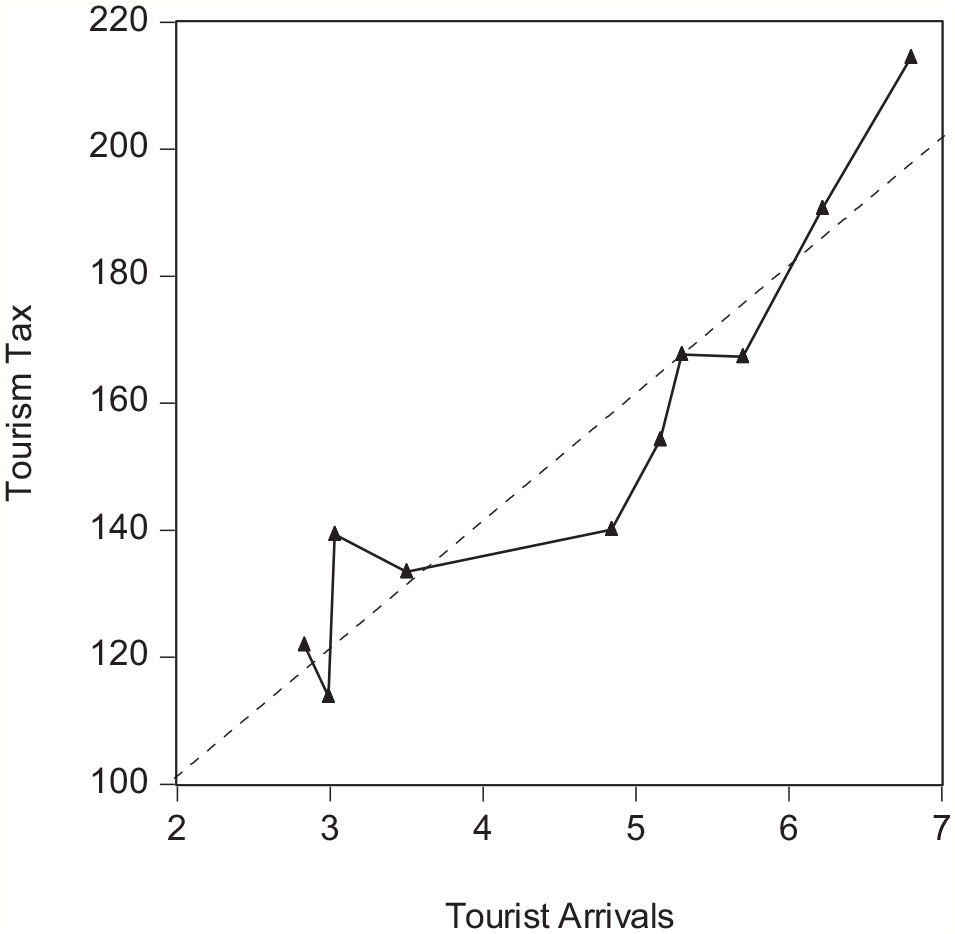
Development stage
The acceleration rate of tourist growth is positive, and tourism develops rapidly in this stage. The function of tourist arrivals is a parabola opening to the top. In line with the growth of tourist arrivals, taxation should also increase with a positive acceleration rate and the tax amount can be formulated as:

Where A corresponds to
Consolidation stage
The acceleration rate of tourist growth turns negative, and velocity begins to decline. The function of tourist arrivals is a parabola opening to the bottom. Correspondingly, the function for tax amount estimation becomes:

To assess the validity of the proposed model, we applied the above functions to data from two sample regions in China, namely Beijing and Jiangsu. Beijing is selected as an example of regions entering the consolidation stage and Jiangsu as one entering the development stage. For those regions that have just entered the involvement stage, the optimal tourism taxes cannot be accurately estimated, hence model evaluations are not conducted.
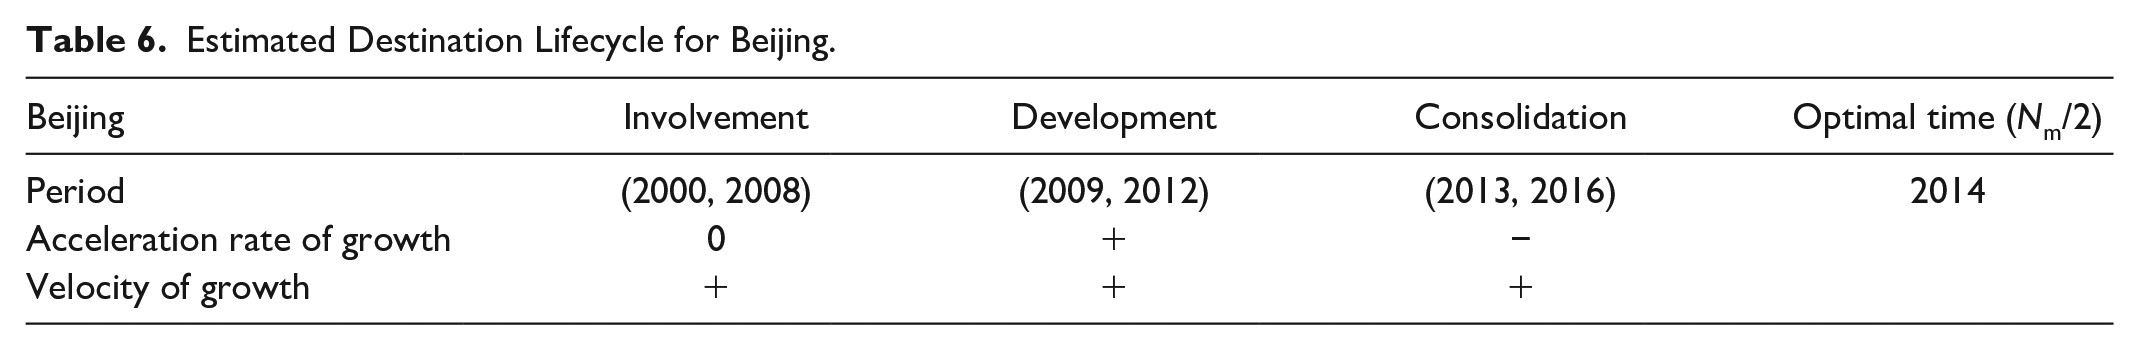
Beijing
As shown in Table 6, the period from 2000 to 2008 for Beijing was the involvement stage. The number of tourists increased, but the acceleration rate was approximately zero. It came to the development stage between 2009 and 2012, during which both the velocity and acceleration rate of the growth in tourist arrivals were positive. From 2013 to 2016, it reached the consolidation stage. Although tourist arrivals still increased, the acceleration rate turned negative.
Estimated Destination Lifecycle for Beijing.
The fitted trends of tourism taxes and tourist arrivals for the three lifecycle stages are shown in Figures 3 to 5 for the years 2000–2008 (involvement stage), 2009–2012 (development stage), and 2013–2016 (consolidation period), respectively. The fitted correlation coefficients for each stage are 0.98, 0.89, and 0.97. The fitted regression lines in the three figures show that the fit between tourism environmental tax and the number of tourists at each stage is high, indicating that the evolutionary trend of tourism tax is generally consistent with the evolutionary trend of the tourism lifecycle.
Fitted trendline between the number of tourist arrivals and estimated tourism tax: Beijing from 2000 to 2008.
Fitted trendline between the number of tourist arrivals and estimated tourism tax: Beijing from 2009 to 2012.
Fitted trendline between the number of tourist arrivals and estimated tourism tax: Beijing from 2013 to 2016.
Overall, the estimated amount of tourism tax in Beijing shows an upward trend, which was consistent with the overall trend of tourist arrivals. By 2012, the estimated tourism tax reached its peak value of RMB 48.44 billion. Then
Jiangsu
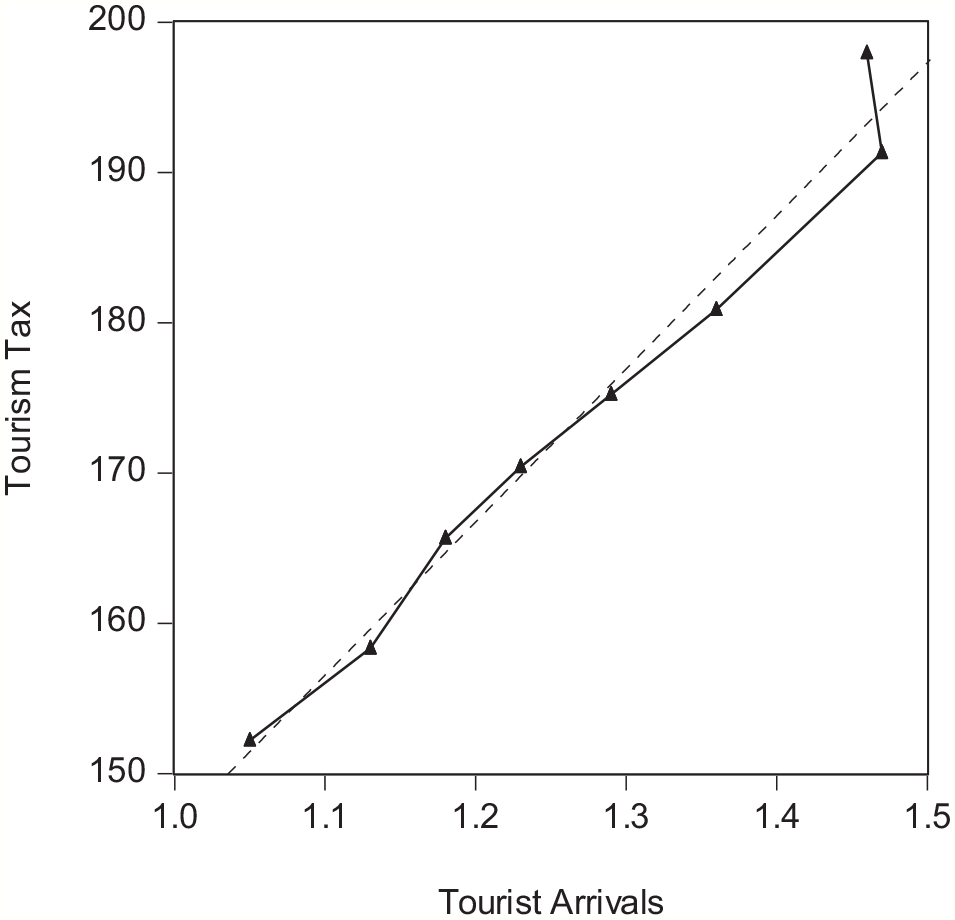
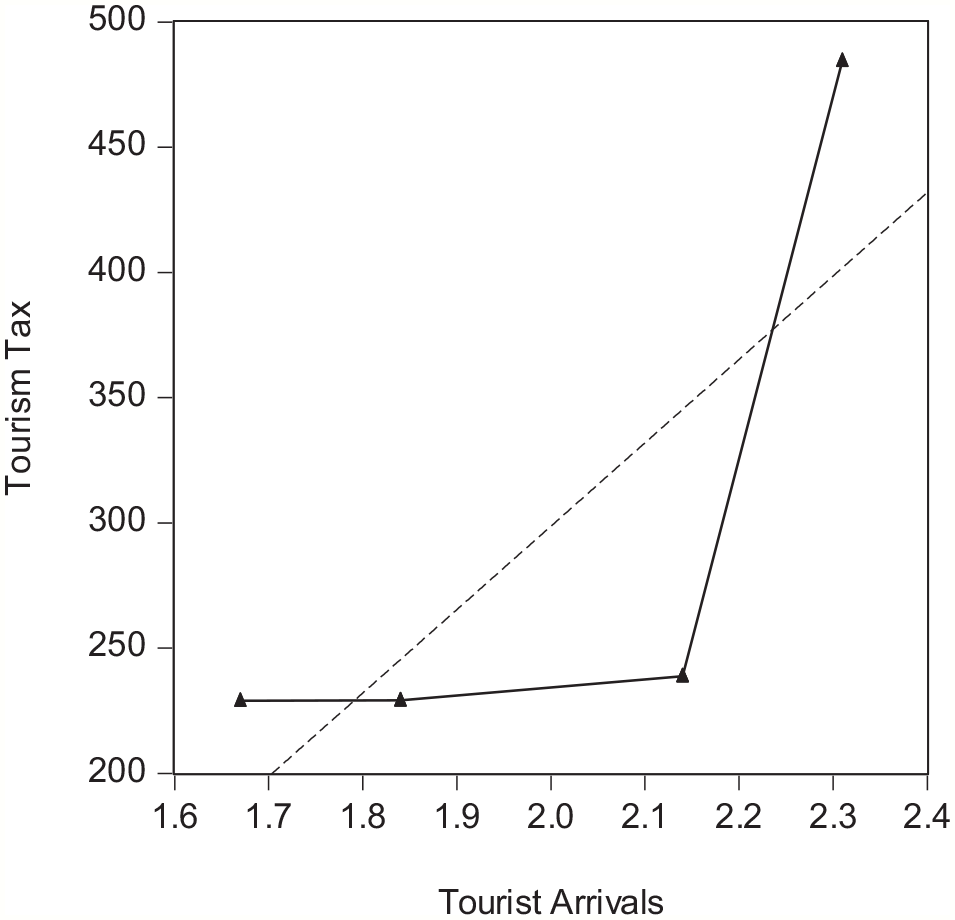
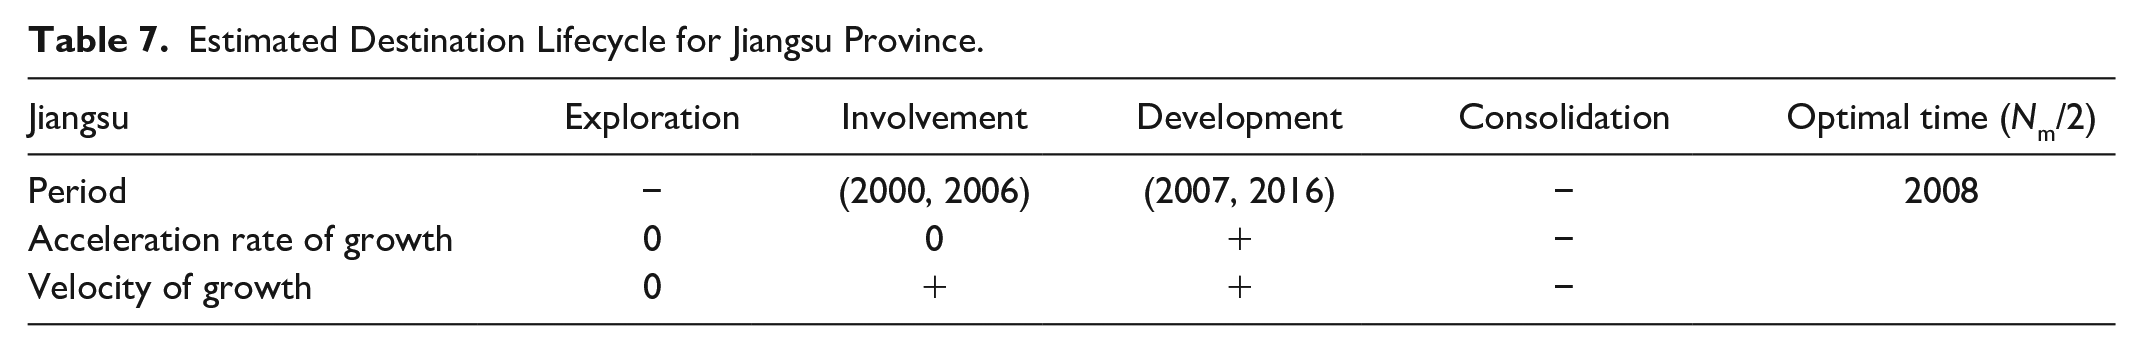
As shown in Table 7, the province had grown from the involvement (years 2000–2006) to the development stages (years 2007–2016), with correlation coefficients between tourism tax and tourist arrivals equaling 0.98 and 0.94 respectively. The trend of tourism tax evolution is basically consistent with that of the evolution of lifecycle stage from involvement (years 2000–2006, Figure 6) to development (2007–2016, Figure 7). For the study period, the estimated tourism tax reached the highest value in 2016, which is RMB 21.44 billion. Then
Estimated Destination Lifecycle for Jiangsu Province.
Fitted trendline between the number of tourist arrivals and estimated tourism tax: Jiangsu from 2000 to 2006.
Fitted trendline between the number of tourist arrivals and estimated tourism tax: Jiangsu from 2007 to 2016.
The above analysis suggests that the predicted tourism taxes are generally consistent with the evolution of the destinations’ lifecycle, confirming the validity of our proposed model. Nevertheless, it should be noted that the optimal amount of tourism tax is a theoretical value, and the actual amount of tax in practice may fluctuate with the optimal value.
Discussion and Conclusion
The present study proposes a dynamic model that helps to quantify the optimal tax amount for the sustainable tourism development of a destination. The model considers both the tax amount and the timing of taxation based on the destination lifecycle and offers practical implications for destination management.
This study contributes to the tourism literature by incorporating the concepts of destination lifecycle into modeling tourism tax. We establish a coupled-evolution model of both tourism lifecycle and tourism tax curves based on the shared research indicators (the number of tourist arrivals). As illustrated in Figure 1. The point of intersection of the two curves (i.e., Point A in Figure 1) is a critical point in time. Before this time point (t0), the destination is in a growth stage and the social-ecological system is kept in relatively good conditions that are capable of self-sustaining. After this time point, the development of tourism exceeds the destination’s carrying capacity. We provide the mathematical models for estimating the timing of the intersection point A and the corresponding tax amount, thus extending the research on destination lifecycle (Butler 1980; Oreja Rodríguez, Parra-López, and Yanes-Estévez 2008; Toh, Khan, and Koh 2001). Specifically, we incorporate tourism tax as an important parameter into the RCK model, and solves the problem of maximizing the benefits of each stakeholder in the tourism environment under the tourism tax policy by incorporating the changes in the number of tourist arrivals at different stages in the lifecycle of the destination into the production function of the tourism sector. Therefore under the dynamic optimal tourism tax policy, we ensure all stakeholders will benefit from the tourism activities at the destination from a long-term sustainable perspective.
This study further extends the line of research on tourism tax (Heffer-Flaata, Voltes-Dorta, and Suau-Sanchez 2021; Palmer and Riera 2003; Schubert and Schamel 2020), by highlighting that tourism taxation needs to dynamically interact with other constituents of the destination system, that is, the level of tax needs to adapt to the changes in the tourism system at different stages as the system evolves. Unlike most of the prior studies that adopt static methods for researching tourism taxation, we introduced a dynamic model that incorporates the two dimensions of changes in time and space, based on a synthesis of two theoretical bases, that is, the systems thinking and the lifecycle of the tourism area. Our proposed model addresses two key tax policy issues for the sustainable development of a destination, that is, the point in time and the optimal amount of tourism tax. Specifically, to determine the point in time, we analyze the intersection point between the lifecycle curve of the destination and the tourism tax curve. Based on the changes in the number of tourist arrivals in different stages of the lifecycle evolution of the tourist destination, we can determine the intersection point of the two curves where the tourism tax is levied at the optimal level, which ensures that the social-ecological environment of the tourism area is in a good condition, while the tourism resources can be effectively used without exceeding the destination’s carrying capacity.
The essence of a tourism tax model is to factor in the negative externalities as a cost of the production function so that the behaviors of the tourism service producers and consumers are adjusted to reduce negative externalities (Palmer and Riera 2003). By formulating tax as a cost in the production function, the optimal tax estimated is a volume that could simultaneously maximize the total output of the tourism industry and maintain the social-ecological integrity of the destination.
The study offers practical implications for destination policymakers. To maintain the sustainable development of tourist destinations, policymakers should decide the timing and amount of tourism tax at different stages of the destination lifecycle evolution through estimating the dynamic optimal threshold of the tourism tax using our proposed model. Economic modelers and destination policymakers should consider tourism tax as an endogenous variable in managing the sustainable development of a destination.
Tourism tax can play a significant role in reducing demand and improving carrying capacity if it is designed and applied properly (Dwyer et al. 2013; Heffer-Flaata, Voltes-Dorta, and Suau-Sanchez 2021; León, Hernández, and González 2007). However, taxation is not the only approach to rectifying the damages caused by tourism development. Policymakers may need to set up regulations or standards and stakeholders must be committed to taking sustainability actions, for example, the use of green technologies, voluntary carbon offsetting, and energy-saving schemes (Zhang and Zhang 2018).
The world is currently facing a global coronavirus (Covid-19) pandemic, which is an unprecedented, unpredictable but major perturbation to the social-ecological system. In such a dire environment, the importance of adopting the dynamic taxation model becomes highly prominent, not only for the tourism industry but also for the economy as a whole. Based on our model, the tourism tax at the current stage must match the drastic decline in the number of tourists. Thus, not only should there be no tax for the industry, there should be tax rebates and bailout funds in place to help the industry to survive the harsh time and recover when it is over. It is expected that the outbreak of a large-scale crisis such as the Covid-19 pandemic will not interrupt the long-term cyclical development trend of the world tourism industry. Tourism taxes must also evolve with short-term derails as well as the long-term cycle of the tourism industry.
The focus of the present study is to determine the optimal tax amount at an aggregate level. This is an important but only one of the many factors that need to be coordinated to ensure that the tourism taxes contribute to the sustainable development of the destination. For example, how the aggregate tax amount can be allocated to enhance social welfare and ecological conservation is a topic that deserves further investigation. Moreover, the actual taxation policy is often the result of a political bargaining process involving various interest groups (Sheng and Tsui 2009). Future research may explore to what extent the intended tax objectives can be achieved, taking into consideration of different political systems and power relations of the stakeholders in a destination. Additionally, future studies can improve the modeling of tourism tax by accounting for other co-existing factors that intervene with the tax system, such as the destination’s resource management policies, the types of tourists and the intensity of tourist usage of natural resources, the elasticity of tourism demand, and the development in environmental technology. Finally, future research may aim to develop a model that provides an early warning mechanism that enables the regulators to timely adjust their tourism tax policies.
Footnotes
Appendix A
Derivation of Formula 25
The firm’s profit is maximized when the following conditions are met:
It can be seen from the above:
When
Thus, it can be obtained that the first-order condition for maximizing the profit of tourism firms is:
Appendix B
Derivation of Formula 26
Appendix C
Coding used in R for the ridge regression analysis
## Ridge Regression
# install.packages(“glmnet”)
library(glmnet)x <- model.matrix(lny~.,tm[,-1])[,-1]
class(x)
y <- tm$lny
fit <- glmnet(x,y,alpha = 0) # ridge regression
plot(fit,label = TRUE) # coefficient path
plot(fit,xvar = “lambda,”label = TRUE) # use lambda as x-variable
fit
head(fit)
fit_data <- print(fit)
head(fit_data,3)
tail(fit_data,3)
coef(fit) # Coefficient matrix for different values of lambda
dim(coef(fit))
coef(fit)[,50] # Coefficients associated with the 50th lambda
coef(fit,s = 0.1) # Coefficients for lambda = 0.1
##Find the optimal solution
set.seed(1)
cvfit <- cv.glmnet(x,y,alpha = 0)
plot(cvfit) # CV along with upper and lower standard deviation curves
cvfit$lambda.min # lambda.min that minimizes CV
cvfit$lambda.1se # the most regularized model such that error is within one standard error of the minimum
coef(cvfit, s = “lambda.min”)
Declaration of Conflicting Interests
The author(s) declared no potential conflicts of interest with respect to the research, authorship, and/or publication of this article.
Funding
The author(s) disclosed receipt of the following financial support for the research, authorship, and/or publication of this article: This project was partly supported by National Natural Science Foundation of China, Grant No. 42161035.