
Abstract
This paper examines the effects of tax policies on international tourist arrivals to the Maldives using the fully modified ordinary least squares (FMOLS) panel data method. The Maldives is chosen as a case study because the nation is heavily dependent on tourism and earn up to 70% of total government revenue in tourism tax. As expected, the estimated tax elasticities show that tourism tax adversely influences inbound travel, but significant differences across source markets are observed. Specifically, a 10% increase in tourism tax reduces demand by 5.4%. The degree of responsiveness of tourism demand to changes in taxes is essential for tourism policy since a change in the cost of visiting a destination resulting from a change in tourism tax policies affects inbound tourism demand. Consequently, the effectiveness of current fiscal policies is a matter of concern for attracting international tourists to the Maldives.
Introduction
Tourism destinations are subject to negative externalities, which contributes to the deterioration and depletion of local resources and a decline in the welfare of the people and the economy. To address such externalities one of the measures resorted to by the government is taxation. This involves the government charging tourism taxes directly or indirectly to tourists (UNWTO 1998). According to Mak (2006, 253), these taxes are charged to “expand and diversify their tax base; export taxes to non-resident tourists; tax away excess profits or economic rents from tourism to benefit residents, or to correct for market failure.” In general, tourism taxes include entry and exit taxes such as visas, travel permits or resident departure taxes; air travel tax such as air passenger duty or airline fuel tax; airports, seaports and road border charges; road taxes, gambling; value-added taxes on restaurants, coaches, car rental, visitor attractions, training, and hotels, or accommodations such as bed tax and occupancy taxes; and environmental taxes (UNWTO 1998, 32). Tourists, however, also incur other general taxes imposed at the destination such as user charges, fines, and fees. While the revenue raised is useful in financing government expenditures, taxation nevertheless can have a detrimental effect on the economy, therefore there is a need to assess their impacts especially in small island developing states which tend to be economically more vulnerable.
Small island destinations depend more heavily on the importation of basic consumer products and having very little market power they tend to be price takers in the world market making them very susceptible to changes in the international market. However, because tourism products are differentiated across countries, and small islands have some degree of monopoly power over their products, the price of their tourism products are not given, and they have a certain degree of control over it. This implies that they may have better control over price changes that may occur because of changes in taxation policies. However, small islands which are heavily dependent on tourism may be more reluctant to incur a shortfall in export revenue that may occur due to an increase in taxes if demand is more elastic than expected. Thus, it is essential to evaluate the effect of tourism tax on small island destination economies that are tourism-dependent. Furthermore, revenue from such taxes comprise a large portion of the economies’ revenue base, affect the welfare of the people, and go a long way to determine the gross domestic product, employment, resource utilization, and in some cases, tourism demand. Also, tourism revenue is necessary to sustain the local communities’ environmental and economic necessities that may have suffered degradation based on massive tourist activities.
Despite the government’s justification for imposing tourism taxes, literature has varying opinions on the importance of tourism tax on the economy. Bakhat and Rosselló (2013), Mayor and Tol (2007), and Seetaram, Song, and Page (2014) all suggest a reduction or removal of tourism tax due to its negative impact on the tourism industry. In related studies, Palmer and Antoni (2003) advocate for abolishing tourism taxes, asserting it is merely an instrument to generate additional revenue. However, other studies, such as Falk and Hagsten (2019) in the case of Austria, and Gago et al. (2009) in the case of Spain, demonstrate a need to either introduce tourism taxes or increase the rate of existing tourism taxes. In the case of tourism-dependent economies, Gooroochurn and Chris (2005) argue in favor of the imposition of tourism taxes because it is a socially efficient means of generating tax revenue. While in the case of small island economies, Sinclair, Blake, and Gooroochurn (2005) demonstrate mixed impacts, with an increase in tourism taxes bringing in more revenue but eroding resources from efficient to inefficient sectors.
Moreover, a mix of tourism tax policies tends to raise tax revenue but can have a detrimental impact on the economy, focusing on tourist arrivals and competitiveness. However, the current study argues that merely imposing tourism taxes is not a sophisticated tool of public policy in countries that largely depend on tourism if such countries’ objective is to boost inbound tourism and, by extension, contribute to their economic development.
Therefore, this study aims to develop a tourism demand model for international travelers to the Maldives to assess tax policies effect on tourist flows. The focus of the study is on Maldives island, and this is because tourism contributes to about 29% of GDP, 60% of foreign exchange and over 90% of tax revenue is generated from import duties and tourism-related tax imposition. The economy derives its growth mainly from tourism (Carlsen and Zulfa 2017). In 2015, Maldives introduced a green tax of US$6, following a series of increases in tourism goods and service taxes from 3.5% in 2011 to 12% in 2014. Apart from these, since 2017, international tourists have had to pay up to US$50 when departing the Maldives.
This paper contributes to research on tourism taxation. Firstly, there are few studies on the impact of tourism tax on international tourist arrivals, to which this study will contribute. Secondly, this study reports a tourist tax impact on inbound tourism from individual source markets to an Island destination, which remains an underdeveloped research area despite the volume of academic literature on tourism demand. Apart from notable studies on environment-related tourism tax (Forsyth et al. 2014; Seetaram, Song, and Page 2014), few papers on general tourism taxation (Ponjan and Nipawan 2016), but none which focus on a tourism-dependent country. To achieve this study’s aim, panel cointegration analysis and a fully modified ordinary least squares (FMOLS) method are employed using yearly data from 1996 to 2017 for the 20 tourist originating countries that account for 81% of total international tourists arrivals. They are China, Germany, the United Kingdom, Italy, India, Russia, France, Japan, the USA, the Republic of Korea, Australia, Austria, Malaysia, Saudi Arabia, Singapore, Spain, Sri Lanka, Sweden, Switzerland, and Thailand.
As a small island economy dependent on tourism, this paper illustrates that the volume of inbound tourism to the Maldives is adversely affected by tourism tax and is a protracted problem that requires careful modeling and analysis of public policy options rather than crude and unsophisticated policy instruments such as introducing new tourism taxes or increasing the rate of existing ones. Further examination suggests that among the top 10 tourist arrival countries, China, the UK, Italy, Russia, and France show a negative response to an increase in the Maldives’ tourism tax on average. At the same time, Germany and the US respond positively and significantly to an increase in tourism tax on average holding other variables constant. This implies that Germany and the US, among the top 10 countries, would visit the Maldives more in the advent of an increase in tourism tax. In the other 10 countries that occupy the bottom as far as the Maldives tourist market is concerned, aside from Thailand and Switzerland, which recorded the negative but insignificant impact of tourism tax increase, all other countries exhibit a positive and significant relationship between tourist tax and tourist arrivals. These countries would visit the Maldives even with an increase in tourist tax on average.
It is worth noting that the Maldivian economy is a small island economy with capacity constraints in its public sector and is geographically remote with limited land area and a narrow resource base. The Maldives has gone through a series of structural changes due to its vulnerability to exogenous shocks. For example, the fall in international tuna prices between 1999 and 2000 combined with the cost of oil imports almost doubling contributed to introducing a costly recovery and reconstruction program that merely resulted in substantial fiscal deficits (Asian Development Bank 2011). Consequently, tourism was ultimately determined to be the largest industry in the Maldives, with an average tourism balance over GDP of a little above 50% within two decades (see Figure 1). The economy derives its growth mainly from the tourism industry. Figure 1 depicts the contribution of tourism to the economy of Maldives. The trend shows an upward movement of the tourism industry’s contribution to the gross domestic product with a peak of over 80% in 2014. Surprisingly, the expenditure of the government does not show a commensurate increase. With a peak of about 50% in 2005, the governments expenditure on the industry has experienced a downward trend even in the phase of increasing contribution of the industry to the total revenue generated in the economy.
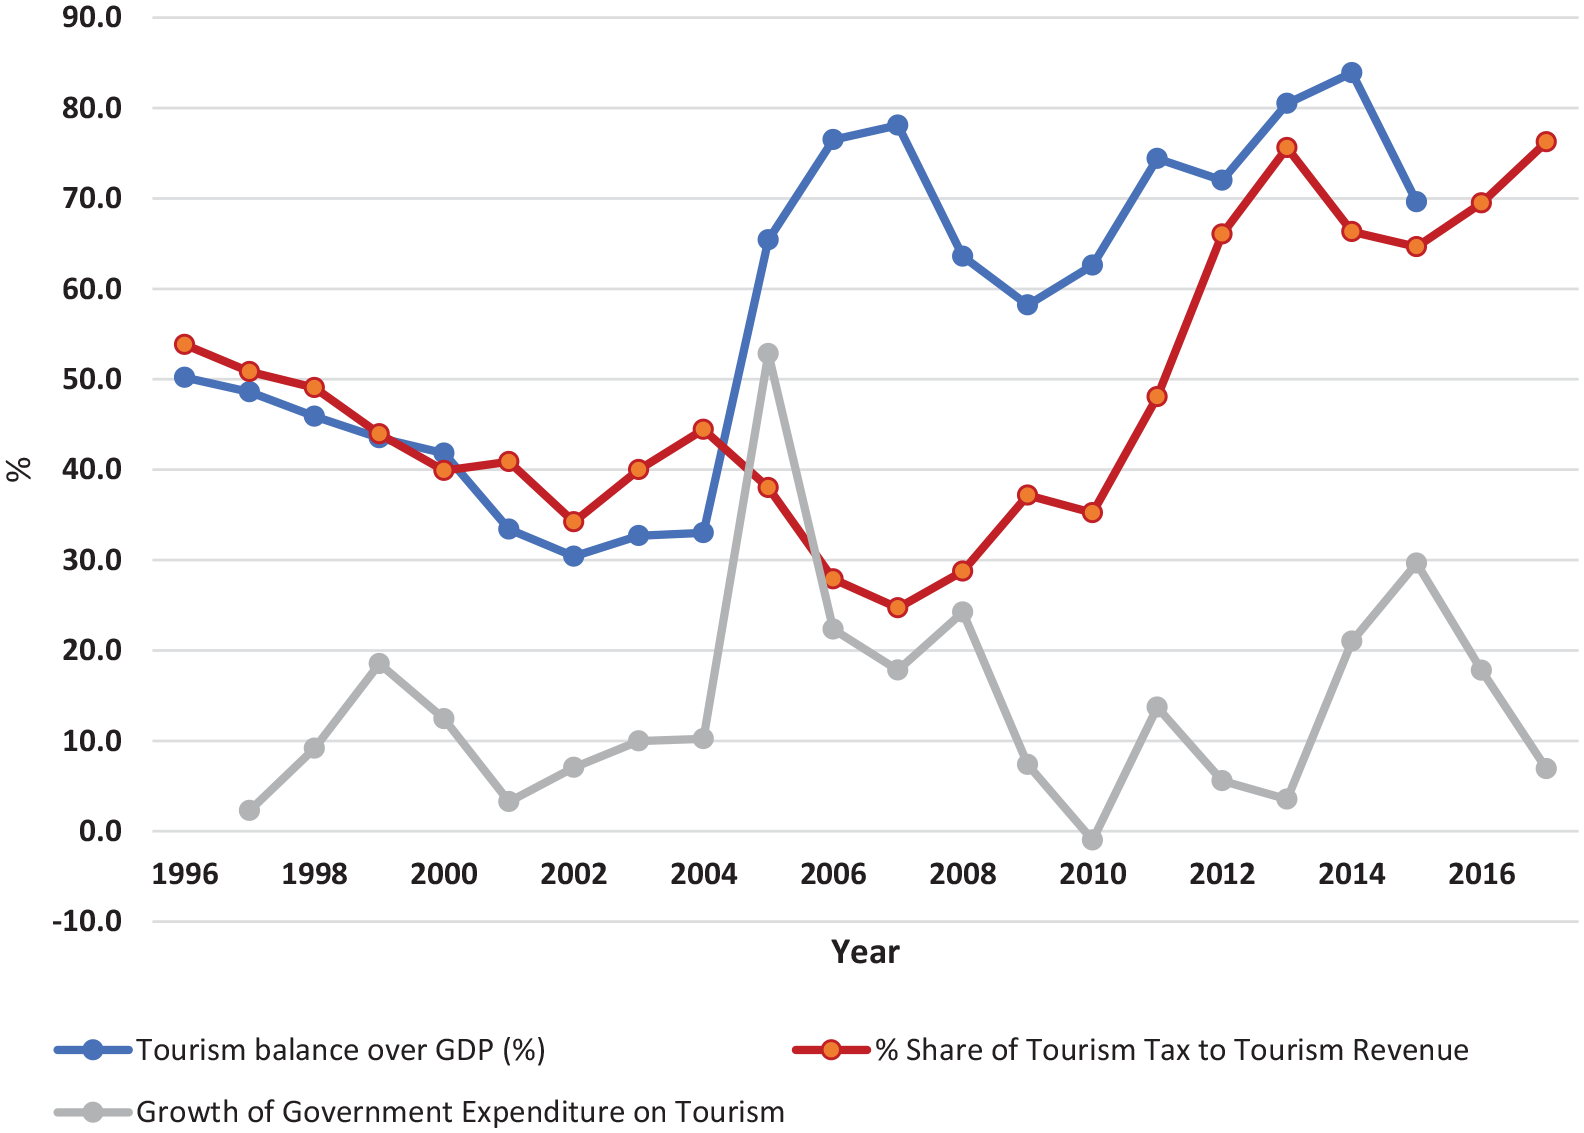
Contribution of tourism to the economy of Maldives.
With a growing tourism industry, the Maldives government introduced specific economical instruments, including fiscal policy changes. In particular, the introduction of taxes on the tourism industry was not matched by a significant government expenditure increase (see Figure 1). Tourism taxes have evolved significantly in the last two decades to raise direct income for the government. From 1996 to 2004, tourism tax revenue was limited to a bed tax of US$6 charged from all tourist-accommodating establishments (such as resorts/marinas, hotels, guest houses, and safari vessels) for every night spent by a tourist (Ministry of Tourism 2001). With tourism revenue as the primary source of foreign earnings to the Maldivian economy and contributing 29% of the GDP, the government increased the bed tax to US$8 in 2004. However, this increase was quickly followed by the tsunami disaster of December 2004, thereby necessitating a mix of expansionary fiscal policies. Apart from the 52% increase in government spending on the tourism industry, the government relaxed resort lease rent and bestowed 100% duty exemption on imports to the resorts damaged by the disaster. As shown in Figure 2, following the tourism industry’s shock, tourism tax revenue dropped by 15.4% in 2005, but this decrease was outweighed by the 36% fall in international tourist arrivals.
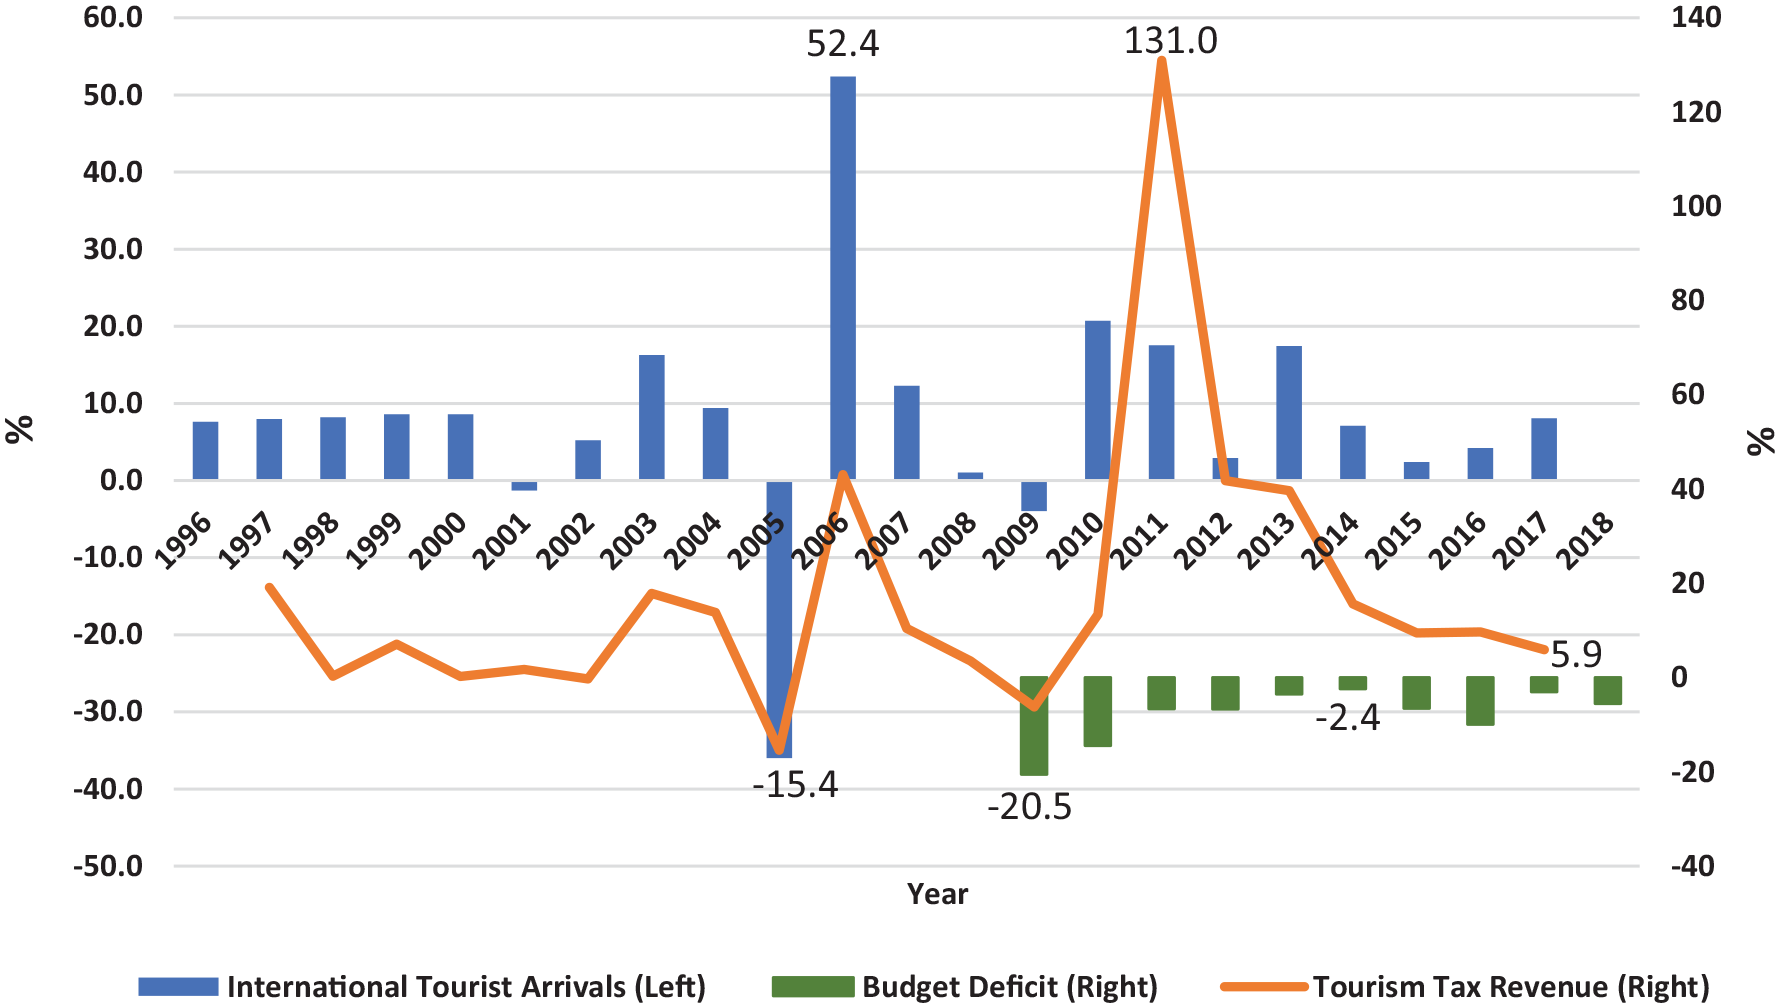
Tourism tax revenue and inbound tourism in the Maldives (annual percentage change).
Other policies to revamp the tourism industry to its pre-tsunami levels included intensive marketing campaigns and an increased government budget. As a result, both international tourist arrivals and tourism tax revenue increased by 52.4% and 43.1%, respectively. However, a new airport service charge of US$25 per passenger departing from an airport in the Maldives was levied in 2007, and another US$25 for airport development fee was levied in 2017 for every passenger departing from Velana International Airport. Although international tourist arrivals declined significantly in 2007 and 2008, this tax policy’s effectiveness is questionable and ambiguous when levied because of the global economic recession. Since 2013, there have been further significant changes to the Maldives’ tourism tax policy. The tourism goods and sales tax (T-GST) was increased from 3.5% in 2011 to 6%, then 8%, and finally 12% between 2012 and 2014, accounting for over 50% of tourism revenue in 2014 (Ministry of Tourism 2018).
Whilst this reduced the budget deficit to −2.4% in 2014 (Figure 2), there was a subsequent increase in 2015 and 2016, attributable to the decrease in arrivals. Furthermore, the tourism bed night tax was abolished from 1st December 2014, and a Green Tax of US$6 was introduced on 1st November 2015. The T-GST is essentially a price instrument expected to influence the cost of a holiday in the Maldives, while the airport charges such as entry and exit charges are included in the airline tickets. This has implications on transport cost and repeat visits, as evidenced by the falling trend in international tourist arrivals’ growth between 2010 and 2013 (see Figure 2). Compared to other similar Island destinations dependent on tourism, these tax policies may hamper competitiveness, as the Maldives government introduces a new tourism tax every year (Maldives Times 2017). This study examines how these tourism taxes have influenced demand and whether they have made any significant difference to travel behavior across different Maldives’ tourist markets.
The next section presents a review of the existing literature on taxation and tourism demand. The data used and a descriptive statistical analysis of this data is presented in section 3, followed by a detailed discussion of the econometric models and techniques used in section 4. Section 5 discusses the long-run and short-run inbound tourism demand models’ empirical findings and examines the estimated demand elasticities. Finally, section 6 concludes this chapter, highlighting future research areas and some of the findings’ policy implications.
Literature Review
Theoretical Framework
Tourism destination countries are prone to externalities (negative). This externality results in the decline of natural resources in the destination countries’ local communities, especially non-renewable resources. The degradation of the local environment resulting from tourism activities has generated an economic decline in many tourist destinations and given rise to depletion or non-renewable scarce resources issues (Pazienza 2011). This is the consequence of tourism. Due to the pressure for renewal, sustainability, and development, ensuring continuous economic benefit of tourism will involve having a systematic process of replacing depleted resources and taking measures to better preserve the remaining ones (Pazienza 2011). Regardless of the financial benefit economies derive from tourism, it may lead to overexploitation of resources at destination countries. This creates an external cost that needs to be met because it has consequences for the resident who depend on tourism for their livelihood.
To address the situation, taxation is often the instrument that is used to internalize the external cost to reduce demand to a more socially acceptable level. In the economic theory of production (Sickles and Zelenyuk 2019), when production or consumption of goods and services create negative externalities not accounted for in the market price, tax imposition can raise social welfare via more efficient utilization of resources and accounting for the external cost. According to Pigou (1920) to properly account for this external cost, the tax levied should be one in which the gross benefit from the resulting degrading activity minus the private and external costs gives a positive net social benefit. This is referred to as an optimum tax level and can be achieved when the tax levied is in addition to effective resource use for tourism. In other words, the optimum level of resource use can be obtained by combining the Pigouvian tax and other policy tools (Piga 2003).
Concerning whether tourism tax can enhance the welfare of the people, the literature has provided varying opinions. According to Gooroochurn and Thea Sinclair (2005), because the tax burden is exportable it has the potential for increasing social welfare. However, taxing tourism by destinations can potentially reduce welfare because of deviation from economic rationality since tourism tax is seen as easy money. This can ultimately affect the utilization of scarce resources and channeling to other activities. For example, Sheng and Yanming (2009) found that tourism tax can improve or reduce welfare depending on the market power of the destination. Socially, taxing tourism is welfare improving even though there can be a reduction in the gross domestic product. What determines whether tourism tax is welfare-enhancing or not is the inherent political and power relations and social groups within the destination economy (Pazienza 2011).
Empirical Findings
Within the global economy, the tourism industry has become strategically crucial and has experienced unprecedented and continuous growth in many countries. In 2018, the total international tourist arrivals grew by 7%, representing the highest growth in seven years since 2010, alongside a 5% increase globally in the total international tourism receipts (UNWTO 2018). While the US, Spain, France, and the UK are among the top earners, the Maldives, British Virgin Islands, Macau, and Seychelles are mostly reliant on revenue from the tourism industry as a significant driver of economic growth. With the further interconnectedness of economic unions and regions, tourism activities revolve around capital and labor movement for pleasure and business purposes and stimulate investment in the infrastructure, human capital, and urbanization of tourism destinations and create employment. Since tourism remains one of the primary drivers of the global economy and a large contributor to international trade, its importance cannot be overemphasized. Thus, given the growth of tourism, it is pertinent to ask questions about the factors that affect international tourism demand, emphasizing the gaps in the literature.
Research on international tourism demand has increased substantially in the last two decades. Many of these studies focus on examining the determinants of tourism demand, and in some cases, forecasting future tourist flows. Hence, there are commonly used traditional determinants in the literature, which include the income of the source country, relative prices, travel costs, exchange rates, and marketing expenditures (Lim 1997; Peng et al. 2015). However, recent research on tourism demand has also examined the importance of other factors such as migration, culture, weather, and natural disasters (Petit and Seetaram 2019; Seetaram 2012).
Previous studies suggest that tourism taxes can significantly influence both inbound and outbound tourism demand. For instance, in the UK, a travel tax (air passenger duty) charged directly to outbound tourism residents is expected to reduce departures but only marginally (Seetaram, Song, and Page 2014). Also, destinations that depend on tourism will see a reduction in international arrivals arising from a carbon tax (Tol 2007). A similar result also holds in Australia’s case for a departure levy referred to as a ‘passenger movement charge’ (Forsyth et al. 2014). On the other hand, it is found that setting an emissions trading system aimed at increasing the cost of visiting the Caribbean from the EU does not necessarily reduce arrivals (Blanc and Winchester 2013). Seetaram et al. (2018) show that tourists are willing to pay for travel taxes, and Song, Seetaram, and Ye (2019) show that British consumers adjust their expenditure at the destination to finance the air tax incurred for their international trip. Tsvetanova and Seetaram (2018) find that consumers are more responsive to an increase in air taxes as opposed to a fall. An increase can be expected to lead to a higher decline in arrivals than the increase in demand that may result from a fall in such taxes.
There is an ongoing debate on the impact of tax on tourism demand. While some studies report a negligible impact on tourist arrivals or argue against levying tourism taxes, other studies present a mixed result. These mixed results arguably arise due to assumptions about the price elasticity of demand for tourism products (Forsyth et al. 2014); the market power of the destination (Sheng and Yanming 2009); or the share of tourism demand component of a commodity consumed by both domestic residents and tourists (Gooroochurn 2009). Another consideration is the form of a tourism tax in place—specific (such as carbon tax) or general (indirect tax such as VAT). Although the use of a specific tourism tax such as an air passenger duty is discriminatory and generates price distortions (Seetaram, Song, and Page 2014), other general tourism taxes increases the risk of tax evasion but can be welfare-enhancing when levied on the consumption of luxury goods which are targeted at households (Gago et al. 2009).
There are other studies on tourism taxation which focus on environmental taxes. According to Sun (2016), the use of technically efficient means of production to reduce carbon emissions from tourism-based activities is superior to the government imposition of tourism taxes to correct emissions that have negative externalities. Also, there are growth effects on the economy that eventually decrease tourism-based activities’ environmental impacts (Qureshi et al. 2017). Furthermore, in accounting for tourism emissions, an essential component of tourism’s environmental impacts is highlighted: the level of development of the tourism destination (Tao and Huang 2014). Thus, to mitigate tourism’s effect on the environment, green technologies and the efficient management of tourism resources are recommended, but this is often more pronounced in developed than developing countries (Alam and Paramati 2017).
Consequently, the literature suggests a gap for investigating the links between tourist flows, travel costs, and the tourism tax intended to correct negative externalities. A summary of the information gleaned from the review of the existing literature is that an environmental-based tourism tax adversely affects vital macroeconomic variables: slows down the growth of real GDP; contracts tourism output; and has a negative spill-over effect on the global economy (Dwyer et al. 2013). Additionally, tourism arrivals decrease due to an emissions trading system earmarked to curb negative tourism’s environmental effects (Blanc and Winchester 2013).
Despite the existing studies on the impact of tourism tax on the economy, there is insufficient evidence about its impact on inbound tourism. Hence, the current study contributes to the research on tourism taxation in two aspects. Firstly, there are not enough studies on the impact of tourism tax on international tourist arrivals. Secondly, this study reports on the tax impact on inbound tourist arrivals from individual source markets to an Island destination, which remains an underdeveloped research area despite the volume of academic literature on tourism demand. Apart from few papers on general tourism taxation (Ponjan and Nipawan 2016), none focuses on a tourism-dependent country.
Data
The sample is made up of a panel of arrivals from the top 20 markets of the Maldives from 1996 to 2017. Due to the availability of data, the 20 markets selected are China, Germany, the United Kingdom, Italy, India, Russia, France, Japan, the USA, the Republic of Korea, Australia, Austria, Malaysia, Saudi Arabia, Singapore, Spain, Sri Lanka, Sweden, Switzerland, and Thailand, with data from 1996 to 2017 (Table 1). These countries account for the bulk (81%) of international tourist arrivals in the Maldives. The dataset is balanced as all countries have annual data for the period under consideration. For more details on the application of panel data analysis in tourism research please refer to Seetaram and Petit (2012).
International Tourist Arrival in the Maldives by Country of Origin (2017).
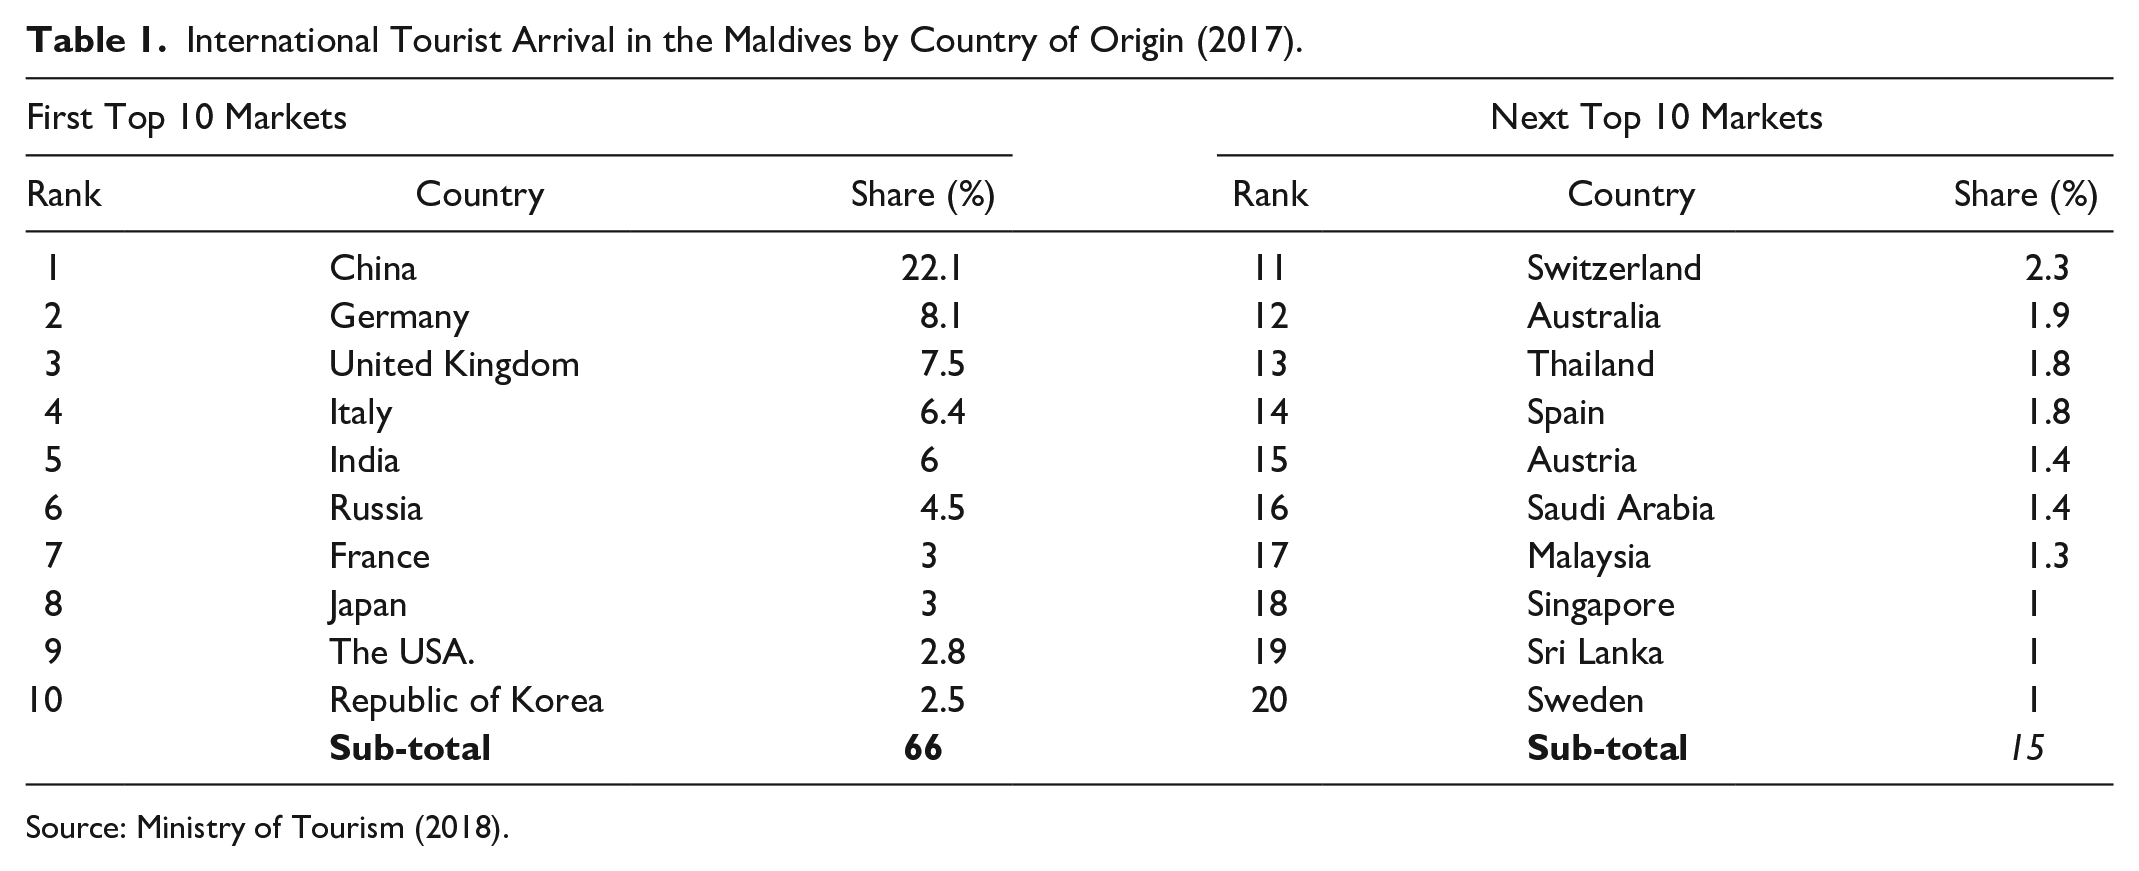
Source: Ministry of Tourism (2018).
The number of tourist arrivals is obtained from the UNWTO database. Tourism Tax is sourced from the Ministry of Finance & Treasury and the Maldives Inland Revenue of the Ministry of Tourism. It excludes lease rent from tourist resorts but includes the bed tax of US$6 charged from all tourist-accommodating establishments for every night spent by a tourist. The tourism revenue description is adjusted in 2017 to include earnings received from Goods and Service Tax from the Tourism Sector (T-GST), the newly introduced Green Tax, Tourism Land Rent and Lease Period Extension Fee. The resort lease rent formula was revised in 2011 from a bed capacity-based rent to a land-based rent, where US$8 is charged per square meter of the island. The T-GST, which was introduced in 2010 at a rate of 3.5%, was also increased to 6% from 1st January 2012, and subsequently, from 1st January 2013, it was again increased to 8%. From 1st November 2014, the rate was further increased to 12%. The tourism bed night tax was abolished from 1st December 2014; Green Tax was introduced on 1st November 2015.
Income is proxied by GDP per capita based on purchasing power parity (PPP) (US$). PPP GDP is the gross domestic product converted to international dollars using purchasing power parity rates. An international dollar has the same purchasing power over GDP as the US dollar has in the United States. GDP at purchaser’s prices is the sum of the gross value added by all resident producers in the economy, plus any product taxes, and minus any subsidies not included in the product’s value. It is calculated without making deductions for the depreciation of fabricated assets or the depletion and degradation of natural resources. The data is in constant 2011 international dollars and is sourced from the World Bank.
Price is measured by combining the Consumer Price Index (CPI) (2010 = 100) and the dollar exchange rate. The CPI reflects changes in the average consumer’s cost of acquiring a basket of goods and services that may be fixed or changed at specified intervals, such as yearly. The Laspeyres formula is used in this study which involves the data expressed in period averages and sourced from the World Bank’s World Development Indicators. The dollar exchange rate is the local currency units per dollar. It is calculated as the official exchange rate refers to the exchange rate determined by national authorities or the rate determined in the legally sanctioned exchange market. It is calculated as an annual average based on monthly averages (local currency units relative to the US dollar) and is sourced from the International Monetary Fund. The substitute price of a competitive and similar destination (Mauritius) is calculated using the CPI and the dollar exchange rate mix. The Caribbean, Seychelles and Mauritius are usually considered the alternative destinations to the Maldives. According to Shareef and McAleer (2008), Mauritius is located around the Indian Ocean and possesses very similar climatic features as the Maldives. Also, transportation costs from these tourist markets to Mauritius are like the Maldives. A progressively exact technique for distinguishing a substitute market will be to examine the data on each source market’s main destinations yearly. However, a massive volume of data would be required for this activity and is not accessible for the 22 years selected for this study.
The population is measured as each market’s population size (million). The total population is based on the de facto definition of the population, which counts all residents regardless of their legal status or citizenship. The values shown are midyear estimates and are sourced from the United Nations Population Division. Transport cost is omitted from this analysis as no appropriate indicator is available, that is a potential measure of the airfare from the main international airport of the origin countries to Velana International Airport in the Maldives (Dwyer et al. 2014; Seetaram 2010b, 2012; Seetaram and Dwyer 2009; Seetaram, Peter, and Larry 2016). However, data on this was not available. Another widespread consideration is the distance between the origin country and the Maldives. See Seetaram (2010a) for a thorough discussion on the estimation of transport elasticities in tourism demand models. However, such proxy is time-invariant, and a fixed-effect model can adequately control for this.
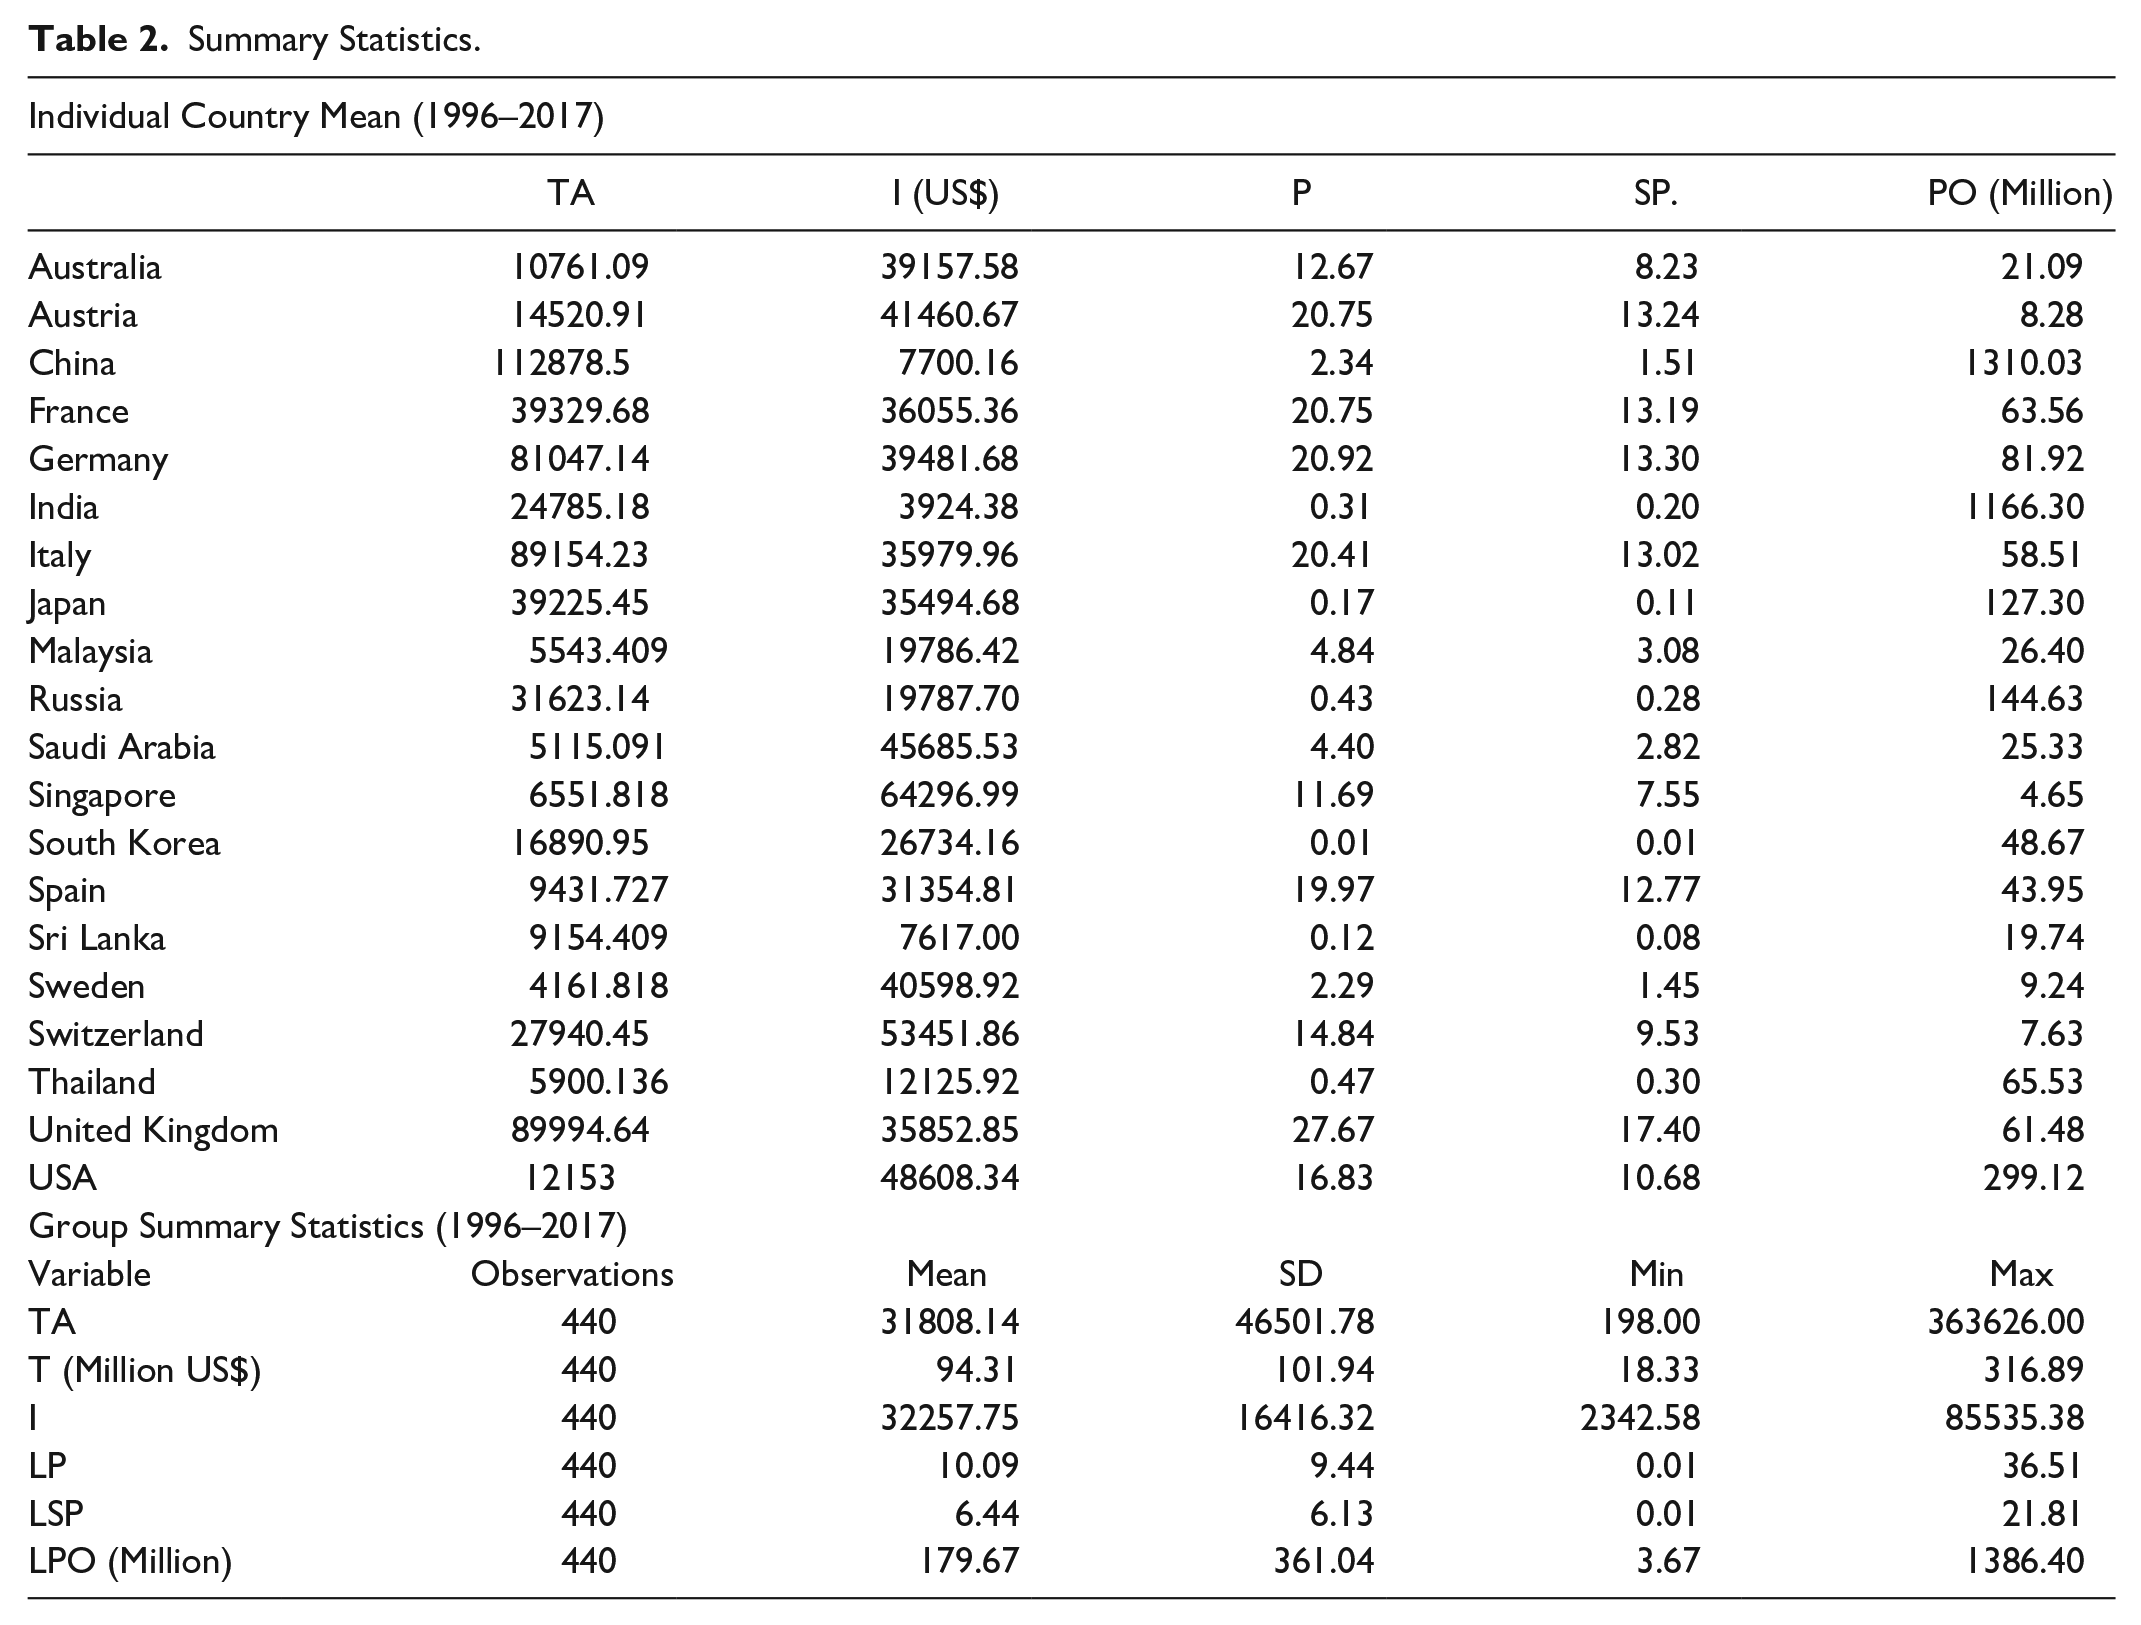
Summary Statistics
Table 2 presents the descriptive characteristics of the variables considered in the empirical analysis that is, tourist arrivals (number); tourism tax (million US$); relative income; price; substitute price and population. Tourism tax was an average of US$94.31 million between 1996 and 2017, with a minimum value of US$18.33 million and a maximum value of US$316.89 million. The average tourist arrivals volume was 31,808 tourists with minimum and maximum values of 4,161 and 112,878 from Sweden and China, respectively. One factor that may account for the difference in the volume of arrivals from these countries is their population size. For the complete sample, the average population over the period was 179.67 million, with minimum values from Singapore (4.65 million) and maximum value from China (1,310.03 million). However, Sweden also presented a low average population over the sample period. In terms of relative income measured by GDP per capita, the countries included in the sample recorded an average of US$32,257.75 within the period of the study, with minimum and maximum values of US$3,924.38 and US$64,296.99 from India and Singapore, respectively. The average relative price was US$10.09, which was higher than the US$6.44 relative substitute price of an alternative destination, that is, Mauritius. Additionally, both the average relative price and substitute price were the highest and lowest in the United Kingdom and South Korea. Specifically, the relative and substitute price for South Korea was the same at US$0.01; nevertheless, the relative price was higher than the substitute price for the United Kingdom at US$27.67 and US$17.12, respectively.
Summary Statistics.
Correlation Matrix
To show the descriptive relationship among variables, Table 3 reports the coefficients of the correlation matrix for the log of tourist arrivals (LTA); lagged tourism tax (LTt−1); relative income (LI); relative price (LP); substitute price (LSP), and population (LPO). The lagged dependent variable (LTAt−1) is also included to account for the correlation between current and repeat visits. The analysis indicates that the lagged dependent variable, tourism tax in the previous period, relative income, relative price, and population in the source country are positively correlated with tourist arrivals. At the same time, the substitute price has a negative association with tourist arrivals to the Maldives. Furthermore, the lagged dependent variable is strongly correlated with tourist arrivals compared to all other variables.
Correlation Matrix.
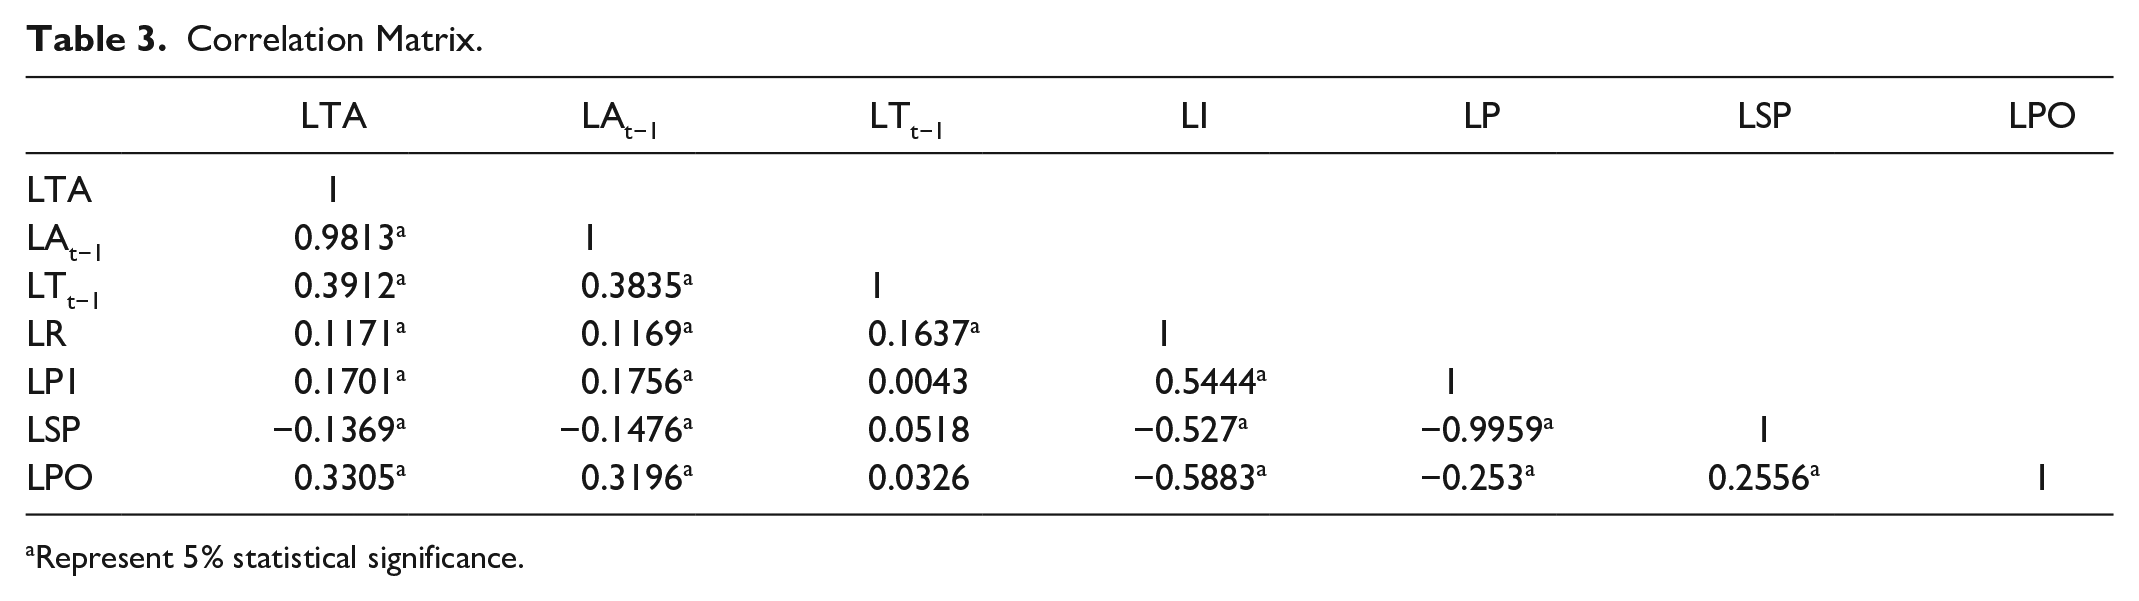
Represent 5% statistical significance.
Trend of Variables
Figure 3 plots the yearly trend of the variables for each country. Tourist arrivals have been consistently high from the UK, Italy, and Germany. Arrivals from China have also increased continually; however, much fluctuation is seen in Spain, South Korea, and Sri Lanka. Relative income is high in many developed countries in the sample, while there has been an increase in relative income for countries such as China, India, and Thailand. Relative price is higher in European countries such as France, Germany, Italy, the UK, and the US, but the lowest in South Korea and Thailand.
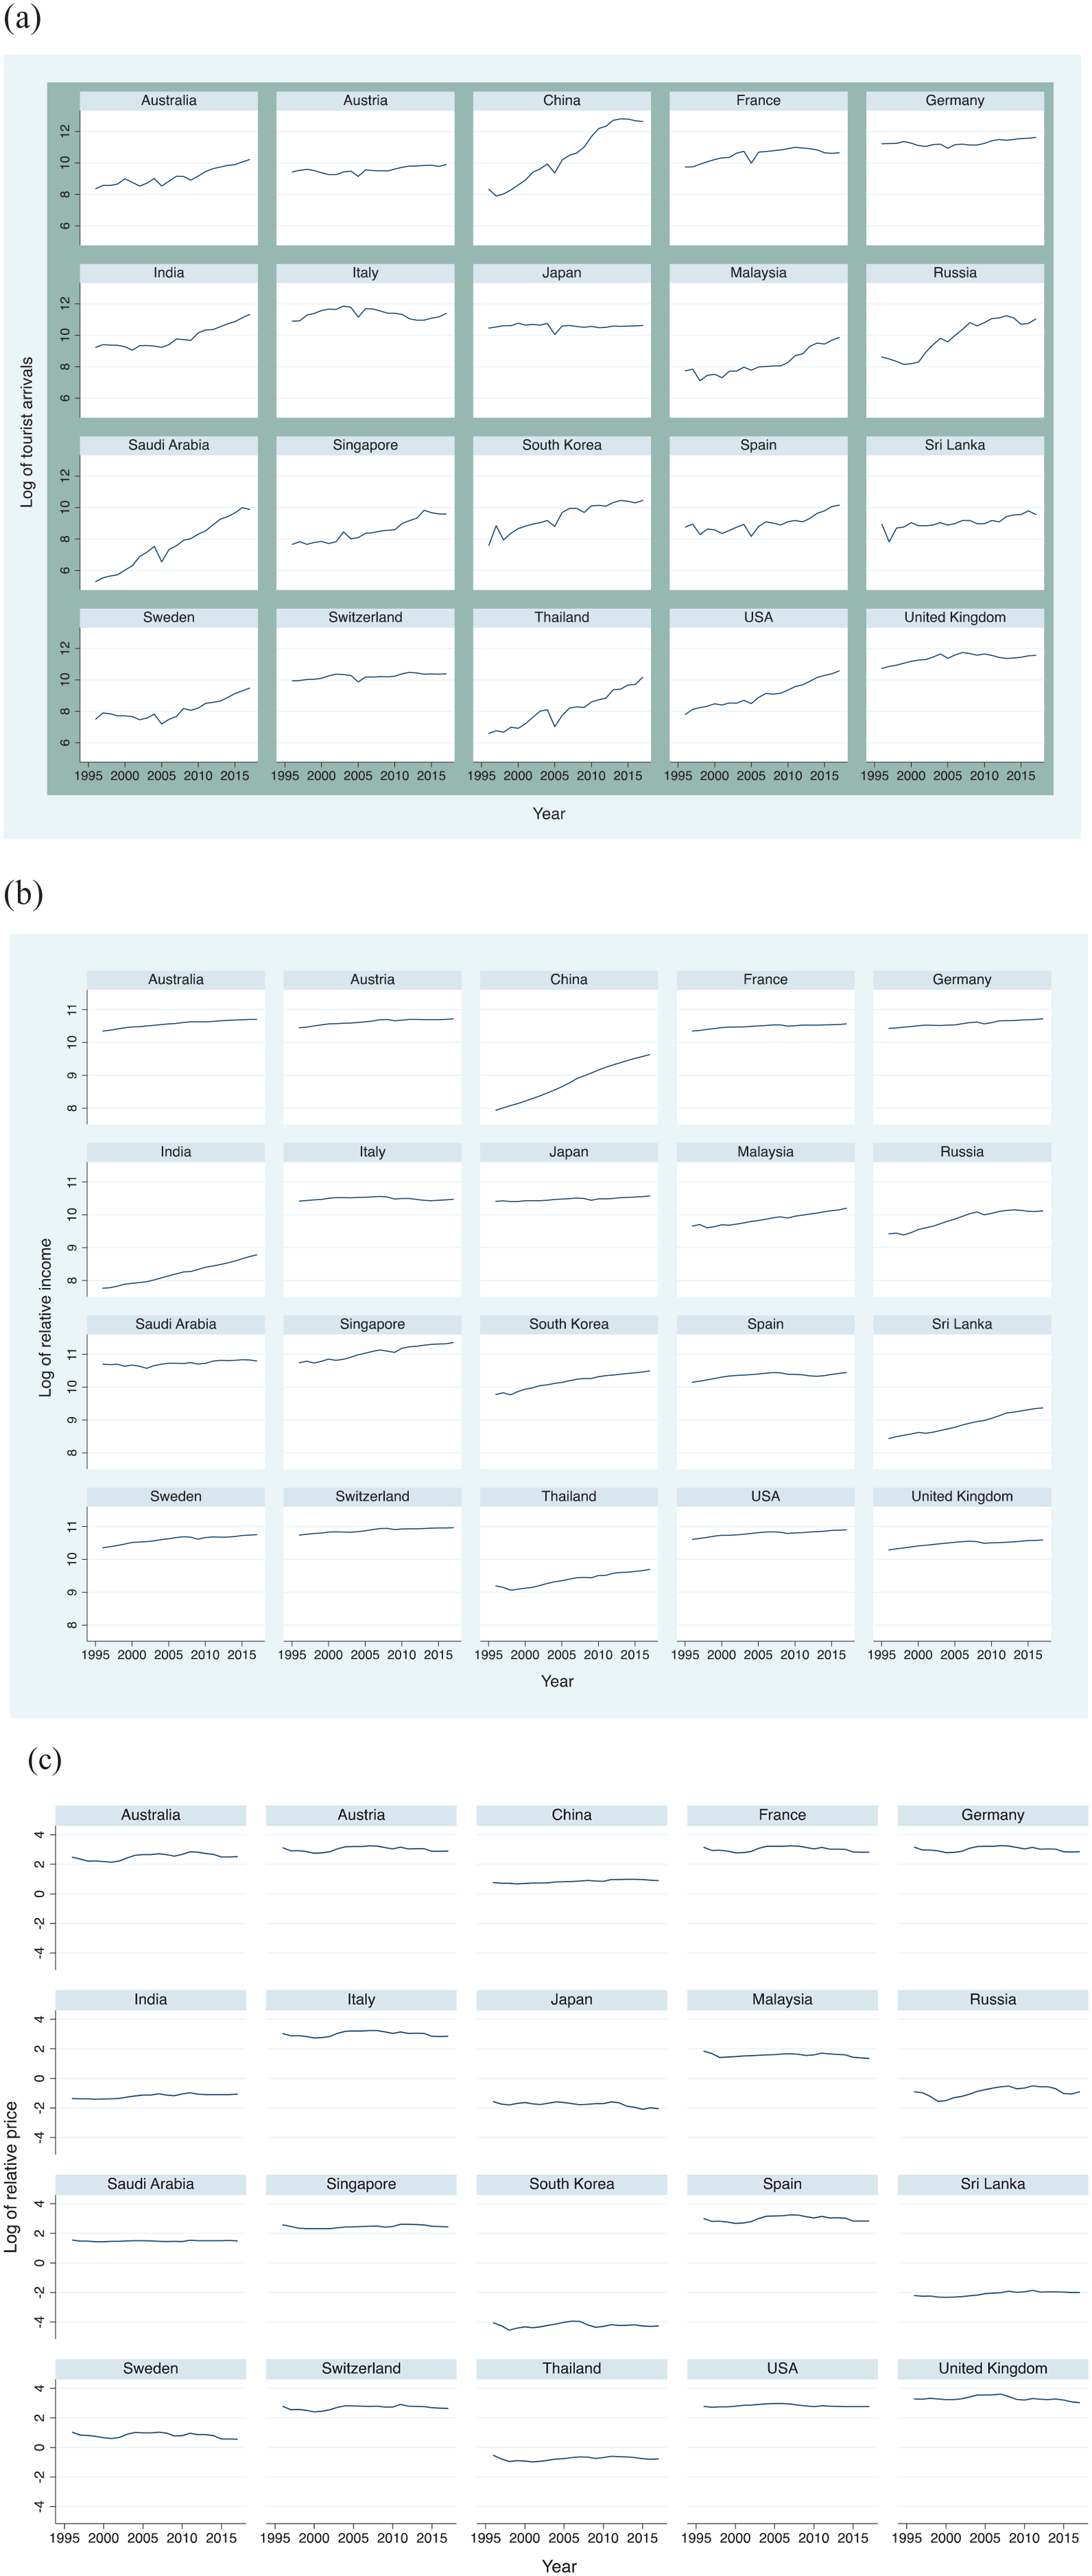
Trend of variables. (a) Trend of Log of Arrivals (LTA). (b) Trend of Log of Income (LI). (c) Trend of Log of Relative Price (LP).
Models and Methods
Modeling Tourism Taxation
In assessing the impact of tourism tax, past studies have often used partial equilibrium models. Bakhat and Rosselló (2013) used the partial adjustment model to evaluate a seasonal fuel tax in a mass tourism destination, using a case study of the Balearic Islands, while Seetaram, Song, and Page (2014) employed the autoregressive distributive lag model (ARDL) to examine the air passenger duty and outbound tourism demand from the United Kingdom. The Chi-squared intuitive interaction detecting (CHAID) model was applied by Do Valle et al. (2012), and the multivariate transfer mode by Bonham and Byron (1996) have also been applied in assessing the impact of tourism tax.
Tourism Demand Model
Based on the review of the existing literature, Model (1) is developed. It includes tourism tax as the explanatory variable of interest and income, relative and substitute prices, and lagged dependent variables as control variables. Additionally, dummy variables are introduced to account for financial crises, health crises and natural disasters which may have affected the number of arrivals to the Maldives. The model is expressed as:
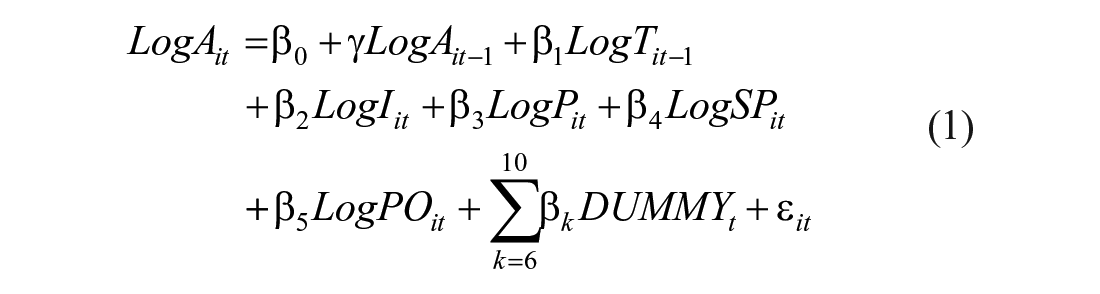
where:
where LogAit is the log of the number of tourist arrivals from source i to the Maldives at time t, while LogAit-1 is the lagged dependent variable; Tourism Tax LogTi(t-1) is the log of sufficient tourism tax directly (or indirectly) charged to tourists from origin country i at time t; the effective tourism tax rate is calculated by dividing the tourism tax revenue by the tourist arrivals; Income LogIit is the log of real GDP per capita (in US$PPP) of origin country i at time t; Relative price LogPit is the log of relative price adjusted by exchange rates at time t. In tourism demand studies, international tourist arrivals from different source markets to a single destination are analyzed; hence the real exchange rate is used as a proxy for price. Therefore, the price is calculated as:

CPIiMD and CPIti are the consumer price index of the Maldives and the ith origin country, respectively, at time t; and EXti is the exchange rate indices for the ith origin country, at time t.
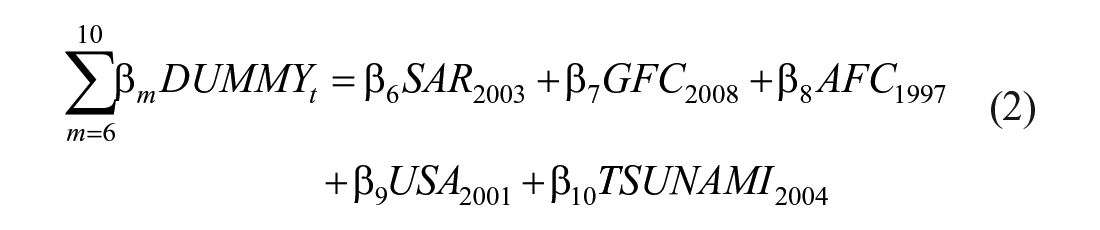
Substitute Price LSPit is the log of substitute price at an alternative destination for a tourist from origin i at time t, and since transportation costs from Maldives’ tourist source markets to Mauritius are similar to the Maldives, we use this destination as a substitute; Population LPOit is the log of population-level in origin country i at time t; Dt represents a list of dummy variables which include the following: SARS03, which represents the outbreak of SARS in 2003, where 1 is assigned if an observation is in the year 2003; 0 – otherwise; GFC08 represents the effect of 2008/2009 global financial crisis where 1 is assigned if an observation is in years 2008 and 2009; 0 – otherwise; AFC97 represents the 1997/1998 Asian financial crisis where 1 is assigned if an observation is in years 1997 and 1998; 0 – otherwise; USA01 represents the U.S.A. 11th September 2001 attacks where 1 is assigned if an observation is in the year 2001; 0 – otherwise; TSUNAMI04 represents the December 2004 tsunami disaster in the Maldives where 1 is assigned if an observation is in years 2004 and 2005; 0 – otherwise; and
Estimation Techniques
The study first adopts the fully modified ordinary least squares (FMOLS) method for estimation and comparison of the relationship between the dependent and independent variables. This technique mitigates the risk of bias and the inconsistency of estimates, as well as concerns for endogeneity problems, which may arise due to capturing of reverse causality of cointegrating regression or the effect of omitted variables (e.g., geographical characteristics, culture, and so on), and the possibility of measurement error.
The Fully Modified OLS (FMOLS), technique, developed by Phillips and Hansen (1990), also has the benefit of modifying the OLS estimator to rectify the problems of serial correlation and endogeneity (Pedroni 2001). Also, since the panel members potentially have diverse characteristics, there is a high likelihood that they will produce different coefficient estimates. Accordingly, two FMOLS estimations are conducted: first, demand elasticities of all markets in the panel are estimated using a pooled FMOLS (i.e., pooled coefficient which assumes panel members are homogenous); and second, individual market demand elasticities (i.e., country-specific estimates which assumes panel members are heterogenous) were estimated using the Group-Mean FMOLS estimator (GM-FMOLS). GM-FMOLS tests the null hypotheses for each of the panel markets independently and provides country-specific coefficient estimates by allowing the cointegrating vector to be heterogeneous. The FMOLS group-mean estimator produces different demand elasticities for nine-country/market origins in this study, which is crucial to developing market-specific policies and strategies.
Before choosing these estimation methods, a pre-test to examine panel cointegration was conducted using tests by Pedroni (1999), Kao (1999) and Johansen (1991). All three tests provide significant evidence of cointegration, that is, the long-run relationship among the variables. Consequently, equation (4) gives the group-mean panel FMOLS estimator as:


Also, the dynamic OLS equation which includes lead and lag differences of the independent variable and controls for endogenous feedback effect is given as:
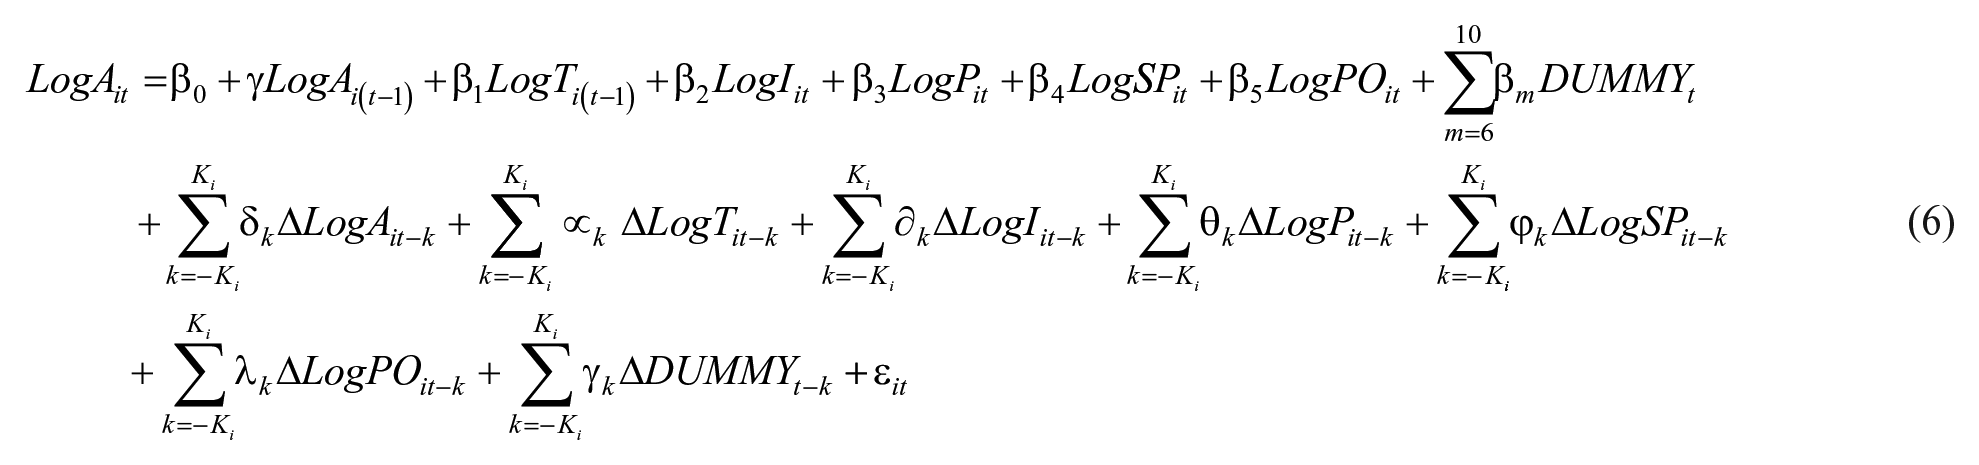
Where Ki and -Ki are lead and lag orders, respectively. Stata 15 statistical software was used. Results from FMOLS techniques are reported in Table 4 for comparison purposes. Long-run elasticities were manually calculated using the following formula
Results of Panel Unit Root Tests Results.
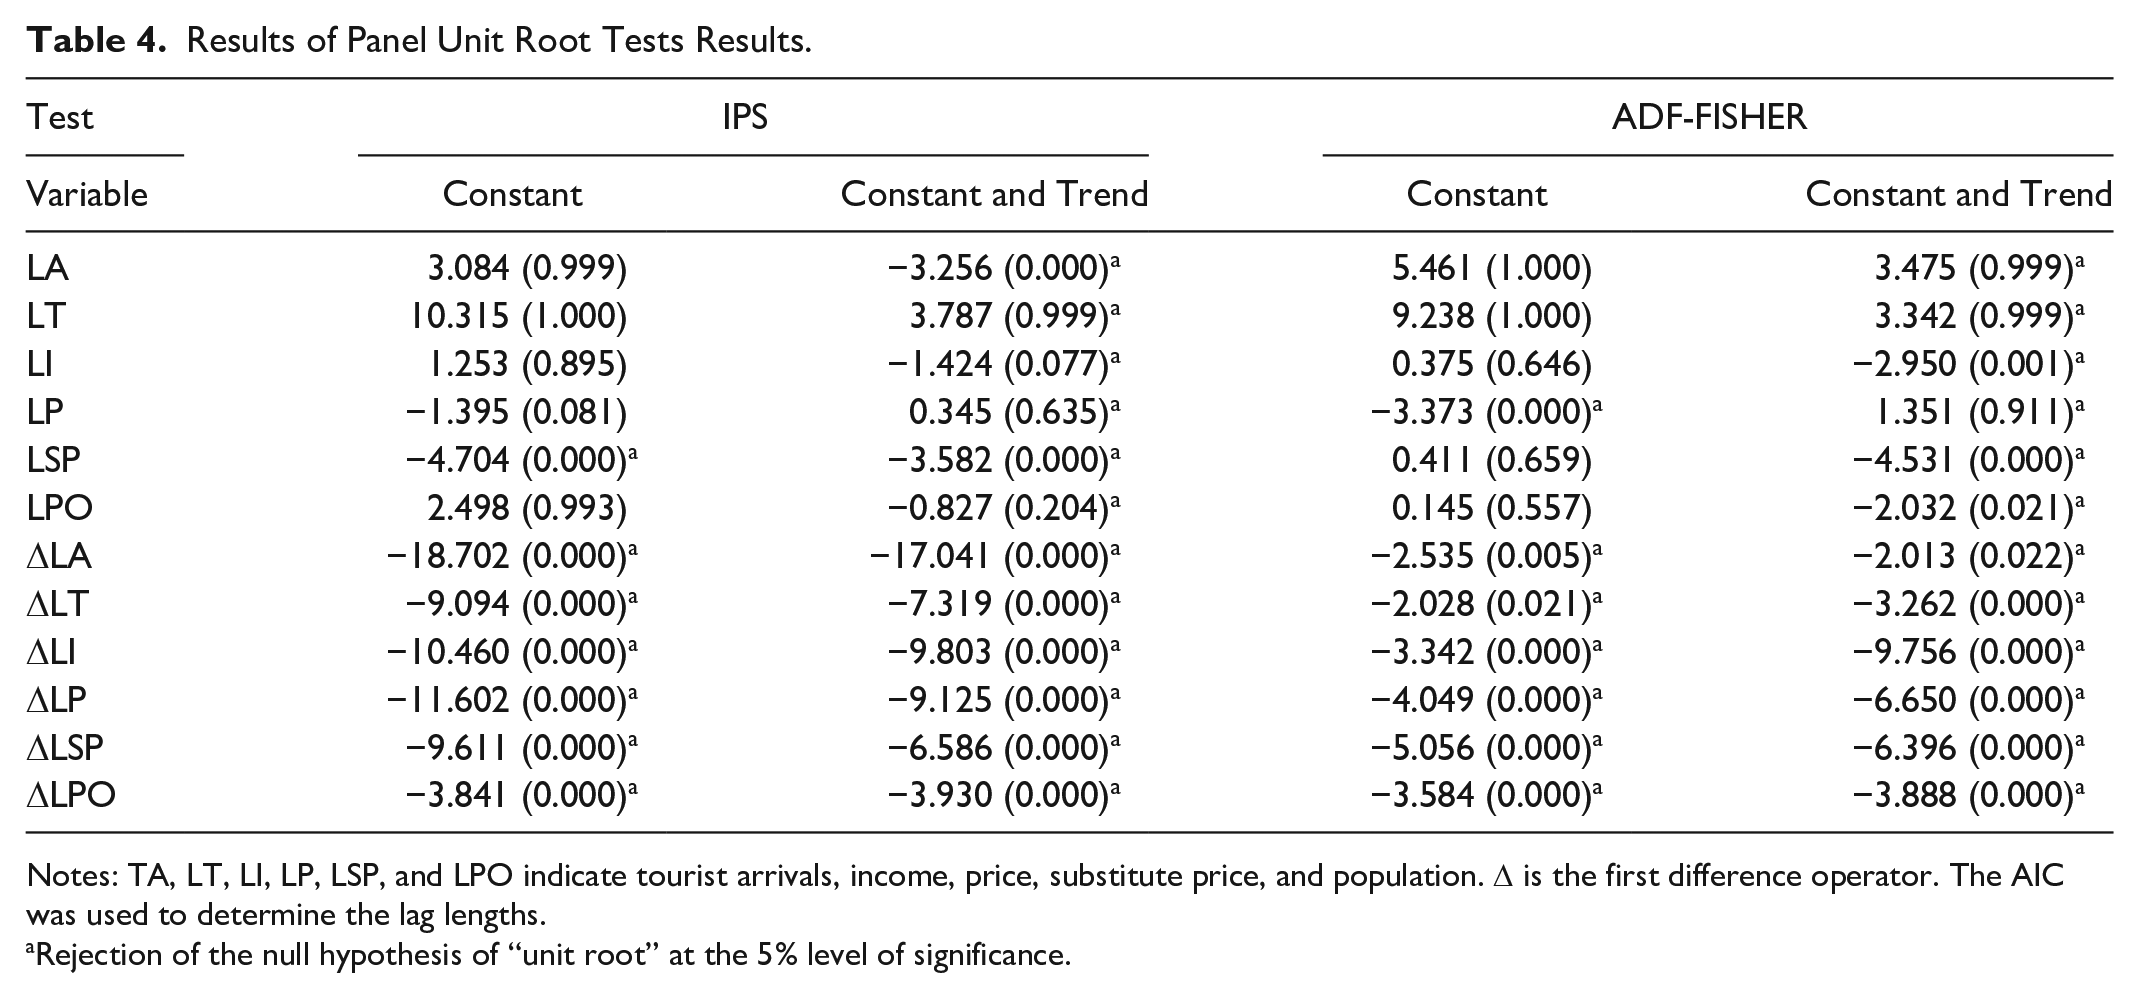
Notes: TA, LT, LI, LP, LSP, and LPO indicate tourist arrivals, income, price, substitute price, and population. Δ is the first difference operator. The AIC was used to determine the lag lengths.
Rejection of the null hypothesis of “unit root” at the 5% level of significance.
Results and Discussion
Tests for Stationarity and Cointegration
To avoid spurious regression, it is vital to examine whether the series has a constant variance and mean reversion characteristics. Consequently, the IPS test created by Im, Pesaran, and Shin (2003) and the ADF-Fisher test created by Maddala and Wu (1999), are used to examine stationarity in this study on the level and first differenced forms of the variables. The null hypothesis in the IPS and ADF-Fisher tests is that variables have a unit root at level I (0). Table 4 represents the panel unit root test result for the variables. As indicated by the results, all factors contain unit root at level I (0). This denotes that the use of static regression techniques like OLS will yield spurious regression problems. However, the series are stationary in their first difference I (1), which suggests that the cointegration relationship between the dependent variable and its regressors can be estimated.
Pedroni and Pedroni (2004), Pedroni (1999) panel cointegration test is employed. The output presents seven test statistics with a null hypothesis of no cointegration and an alternative hypothesis of the long-run co-integrating equation. Table 5 presents the cointegration test results. The cointegration tests’ consequences demonstrate the rejection of the null hypothesis of no cointegration relation in both the constant and trend form. This, therefore, signifies that the variables move together in a unidirectional manner and international tourism demand in the Maldives converges to its long-run equilibrium by redressing any conceivable deviation from its short-run equilibrium levels. Once the cointegration connection is determined, the regressors’ long-run coefficients could be assessed by utilizing the FMOLS.
Results of Panel Cointegration Tests.
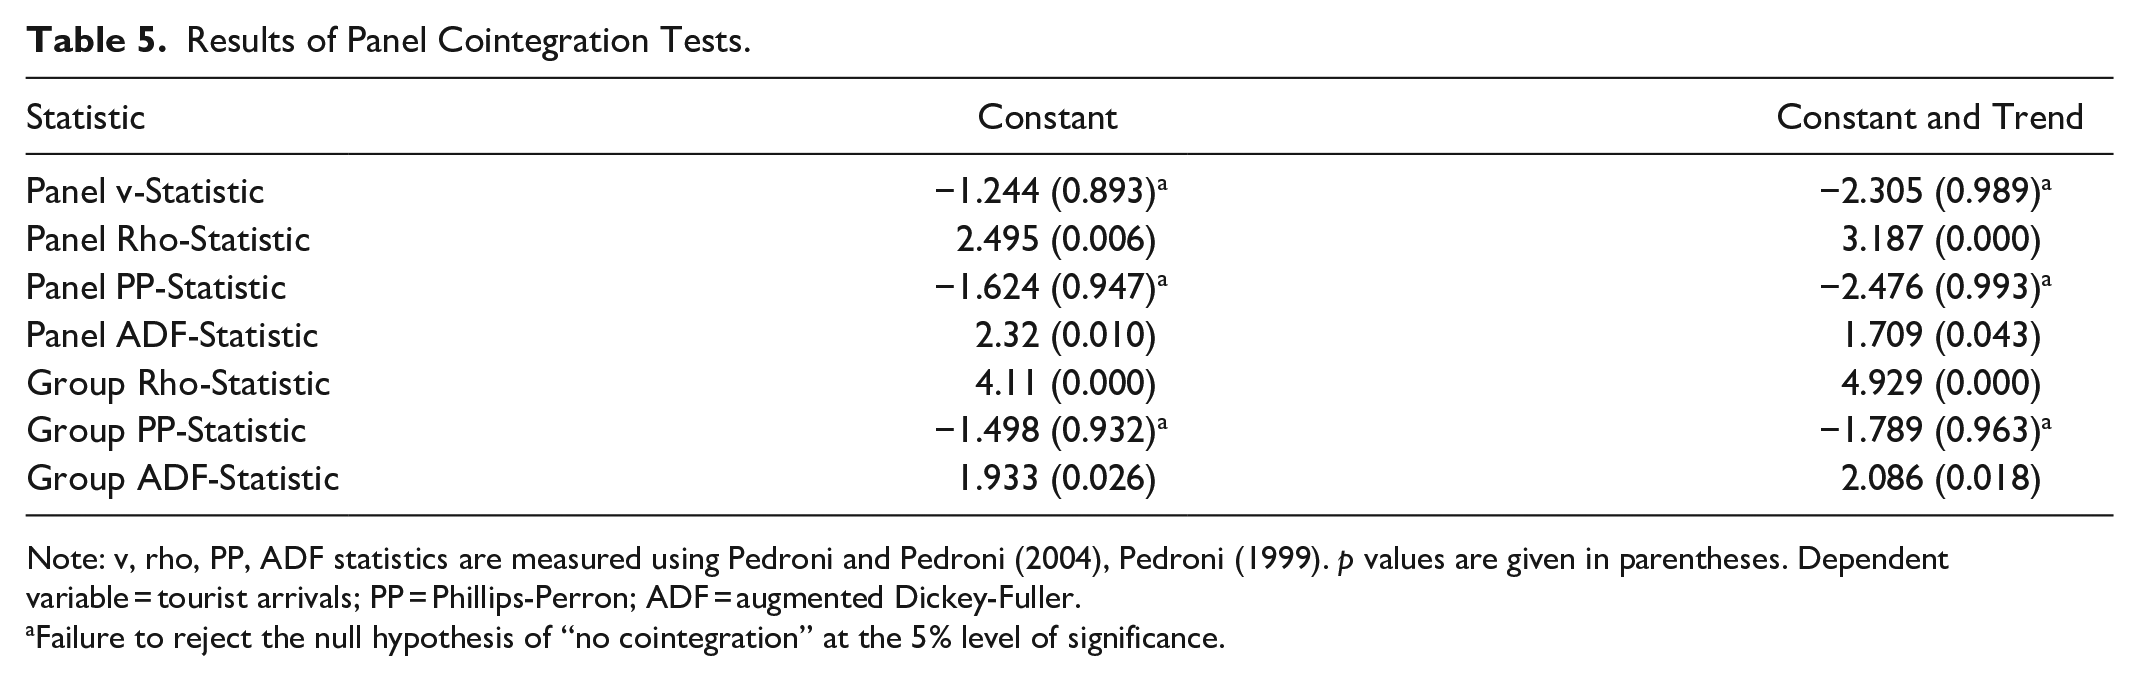
Note: v, rho, PP, ADF statistics are measured using Pedroni and Pedroni (2004), Pedroni (1999). p values are given in parentheses. Dependent variable = tourist arrivals; PP = Phillips-Perron; ADF = augmented Dickey-Fuller.
Failure to reject the null hypothesis of “no cointegration” at the 5% level of significance.
For an additional diagnostics test, the model specification test was conducted. The results show that the model is correctly specified as expected with a p-value of .000. This means that the squared prediction does not have much explanatory power. Besides, the Ramsey RESET test using powers of the fitted values of the Log of tourist arrivals was conducted. The results show F (3, 405) = 0.38 and Prob > F = 0.7710. This means that the model has no omitted variables.
The Impact of Tourism Tax on Tourism Demand – All Panel
In line with this study’s objectives, results from FMOLS are presented in Table 6, while results from pooled OLS and fixed effects regression are presented for comparison purposes only. As expected, the tourism tax’s coefficient has a negative sign and is statistically significant (at 1%, 5%, and 10% levels). This indicates that an increase in tourism tax results in a decline in the number of inbound tourists. Specifically, a 10% increase in tourism tax reduces demand by 5.4%. The degree of responsiveness of tourism demand to changes in taxes is essential for tourism policy since a change in the cost of visiting a destination resulting from a change in tourism tax policies affects inbound tourism demand. Given these empirical results, it is essential to highlight these results’ implications on the tourism industry in the Maldives. The impact of tourism tax on the tourism industry relies upon a few factors. Stakeholders in the tourism industry argue that the industry attracts new forms of taxes. Consequently, such tax contracts output across other businesses in the economy, not just the tourism industry. In other words, the cost base of other businesses that are substitutes for the tourism industry will also be expanded. Additionally, the degree to which the tourism tax will decrease industry output depends significantly on the pass-through effect of taxes on prices of tourism goods and services compared to prices of other non-tourism industries.
Pooled Panel Estimation Results (Dependent Variable: Log Tourist Arrival).
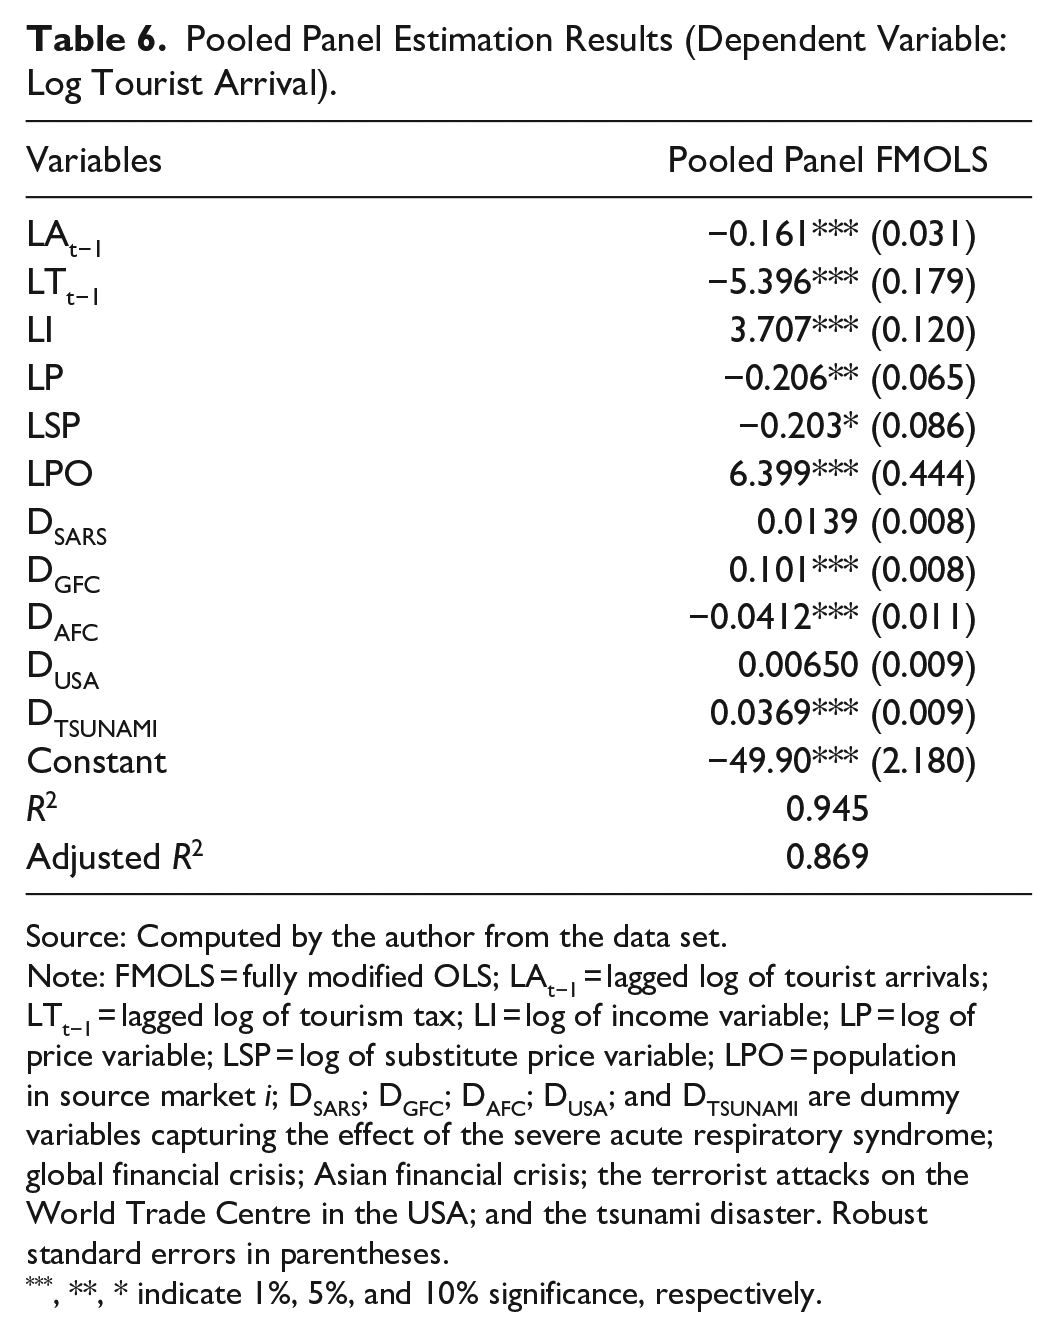
Source: Computed by the author from the data set.
Note: FMOLS = fully modified OLS; LAt−1 = lagged log of tourist arrivals; LTt−1 = lagged log of tourism tax; LI = log of income variable; LP = log of price variable; LSP = log of substitute price variable; LPO = population in source market i; DSARS; DGFC; DAFC; DUSA; and DTSUNAMI are dummy variables capturing the effect of the severe acute respiratory syndrome; global financial crisis; Asian financial crisis; the terrorist attacks on the World Trade Centre in the USA; and the tsunami disaster. Robust standard errors in parentheses.
**, * indicate 1%, 5%, and 10% significance, respectively.
The tourism tax unfavorably affects critical macroeconomic variables, slows down real GDP growth, contracts tourism output, and has an adverse spillover effect on the global economy (Dwyer et al. 2013). Palmer-Tous, Antoni, and Jaume (2007), found that a tax on rental cars, in a bid to make tourists bear part of the costs they create, only increases tourists’ expenditures, thereby making tourism destinations less competitive rather than serving as a corrective mechanism to the environmental damage. Although the adverse impact of tourism tax on inbound tourism demand is in line with previous studies, Seetaram, Song, and Page (2014) found that the responsiveness of outbound tourism demand is not substantial, given that tourists are willing to pay more. In the same vein, depending on the elasticity of demand, a tourist eco-tax not met by improved quality of tourism products can only reduce tourists arrivals in the short run but may stabilize in the long run with a mix of other tourism management policies (Logar 2010).
Furthermore, tour operators’ role in discussing the impact of tourism tax on tourism demand is essential. For example, travel agents and online travel firms can drive tourists’ expectations with a great understanding of specific tourism products and services tailored to the needs of their clients (Buckley and Mossaz 2016). Hence, tourism tax may affect the nature of tourism demand and how much supply can be available at a tourist destination over time.
The Impact of Other Determinants of Tourism Demand
International tourist arrivals also show responses to changes in other variables’ coefficients in the tourism demand model. First, the coefficients of price measure the degree of responsiveness of inbound tourism demand to a price change. The estimate of the price variable in Table 6 shows that inbound tourism demand is price-inelastic in the Maldives. This means that changes in price result in a less than proportionate change in inbound tourism (
Consequently, a 10% rise in the real GDP per capita of a source market is expected to boost arrivals from that market by 37%. This high-income elasticity is consistent with most previous studies (Lim 1997; Peng et al. 2015; Song, Qiu, and Park 2019) and for studies with tourism-dependent countries as its case study (Croes and Vanegas Sr 2005). Furthermore, the important implication is that economic growth in the origin country substantially boosts the Maldives’ inbound travel market.
Moreover, consumers choose alternative tourism destinations depending on their budget and which selection maximizes their satisfaction. The cross elasticity measures the degree of responsiveness of inbound tourism demand to the Maldives because of a change in an alternative destination’s price. The sign of the coefficient of cross elasticity of demand is essential in the interpretation. A negative sign indicates that the two destinations are regarded as complements or joint inbound tourism demand. Consequently, a rise in the price of one reduces the number of arrivals to the other. With statistical significance, as shown in Table 6, Mauritius is considered an alternative destination by inbound tourists to the Maldives when deciding on a destination. A rise in the cost of a trip to Mauritius by 10% suggests that the number of arrivals to the Maldives can be expected to fall by 2.9%. These results imply that tourists consider Island destinations in a similar lens in terms of tourism price competitiveness, and tourists will consider reducing visits to similar and nearby destinations.
Furthermore, since tourism demand is dynamic, earlier studies justify the use of lagged dependent variables (Seetaram 2010b). The lagged dependent variable’s coefficient represents habit persistence (also regarded as word-of-mouth effect) and is statistically significant in explaining arrivals into the Maldives. Contrary to expectation, adjustments of tourism demand to a new equilibrium in the current year after changes in its determinants are delayed by 16%. This signifies a reduction in tourist arrivals due to the word-of-mouth effect. Hence, visitors from these countries spread information about their trip to the Maldives, which leads to an increase in tourist arrivals from these countries in the subsequent period. Accordingly, destination managers in Island economies dependent on tourism can significantly boost visitor experience to a high level of satisfaction, subsequently generating growth in the number of arrivals from these markets.
The dummy variables’ coefficient is significant but positive for the global financial crisis and the Tsunami, but negative for the Asian financial crisis variable. The positive coefficient of dummy variables suggests that different from expectation, in periods of crisis (such as SARS, GFC, US attacks, and Tsunami), consumer confidence is not affected. Instead, demand rises, but insignificantly. However, across markets, demand for tourism in the Maldives responds differently to various crisis events. Notably, the Asian and global financial crises and the Tsunami negatively affected demand from 16 source markets.
Of particular interest is China, a country with a tremendous demand for tourism in the Maldives. Apart from the Asian financial crisis, all crisis events negatively affect China’s arrivals, especially the Tsunami. The impact of these crises is felt more in this region as an important market for the Maldives. This implies that the Maldivian tourism authority needs to diversify its market base, to offset reduced demand from one region with arrivals from others. Additionally, stakeholders imply that future strategies should reduce any overreliance on a single market or a single group of homogenous markets (Seetaram 2010b, 2012).
Individual Market Analysis – GM-FMOLS
Group A: Top 10 markets positioned 1-10
The impact of the determinants of inbound tourism to the Maldives were distinct from one source market to another. For the top 10 markets presented in Table 7, the lagged dependent variable’s coefficient has the expected sign for five markets. This suggests that the word-of-mouth effect is significant. Thus, tourists from China, India, Russia, France, and the US tend to repeat their Maldives visits. However, this variable does not effectively explain arrivals from Italy and South Korea. Tourism tax coefficients are significant for China, Germany, the UK, Italy, Russia, France, and the US.
Panel FMOLS Estimation Results Based on Panel Members (Dependent Variable: Log Tourist Arrival).
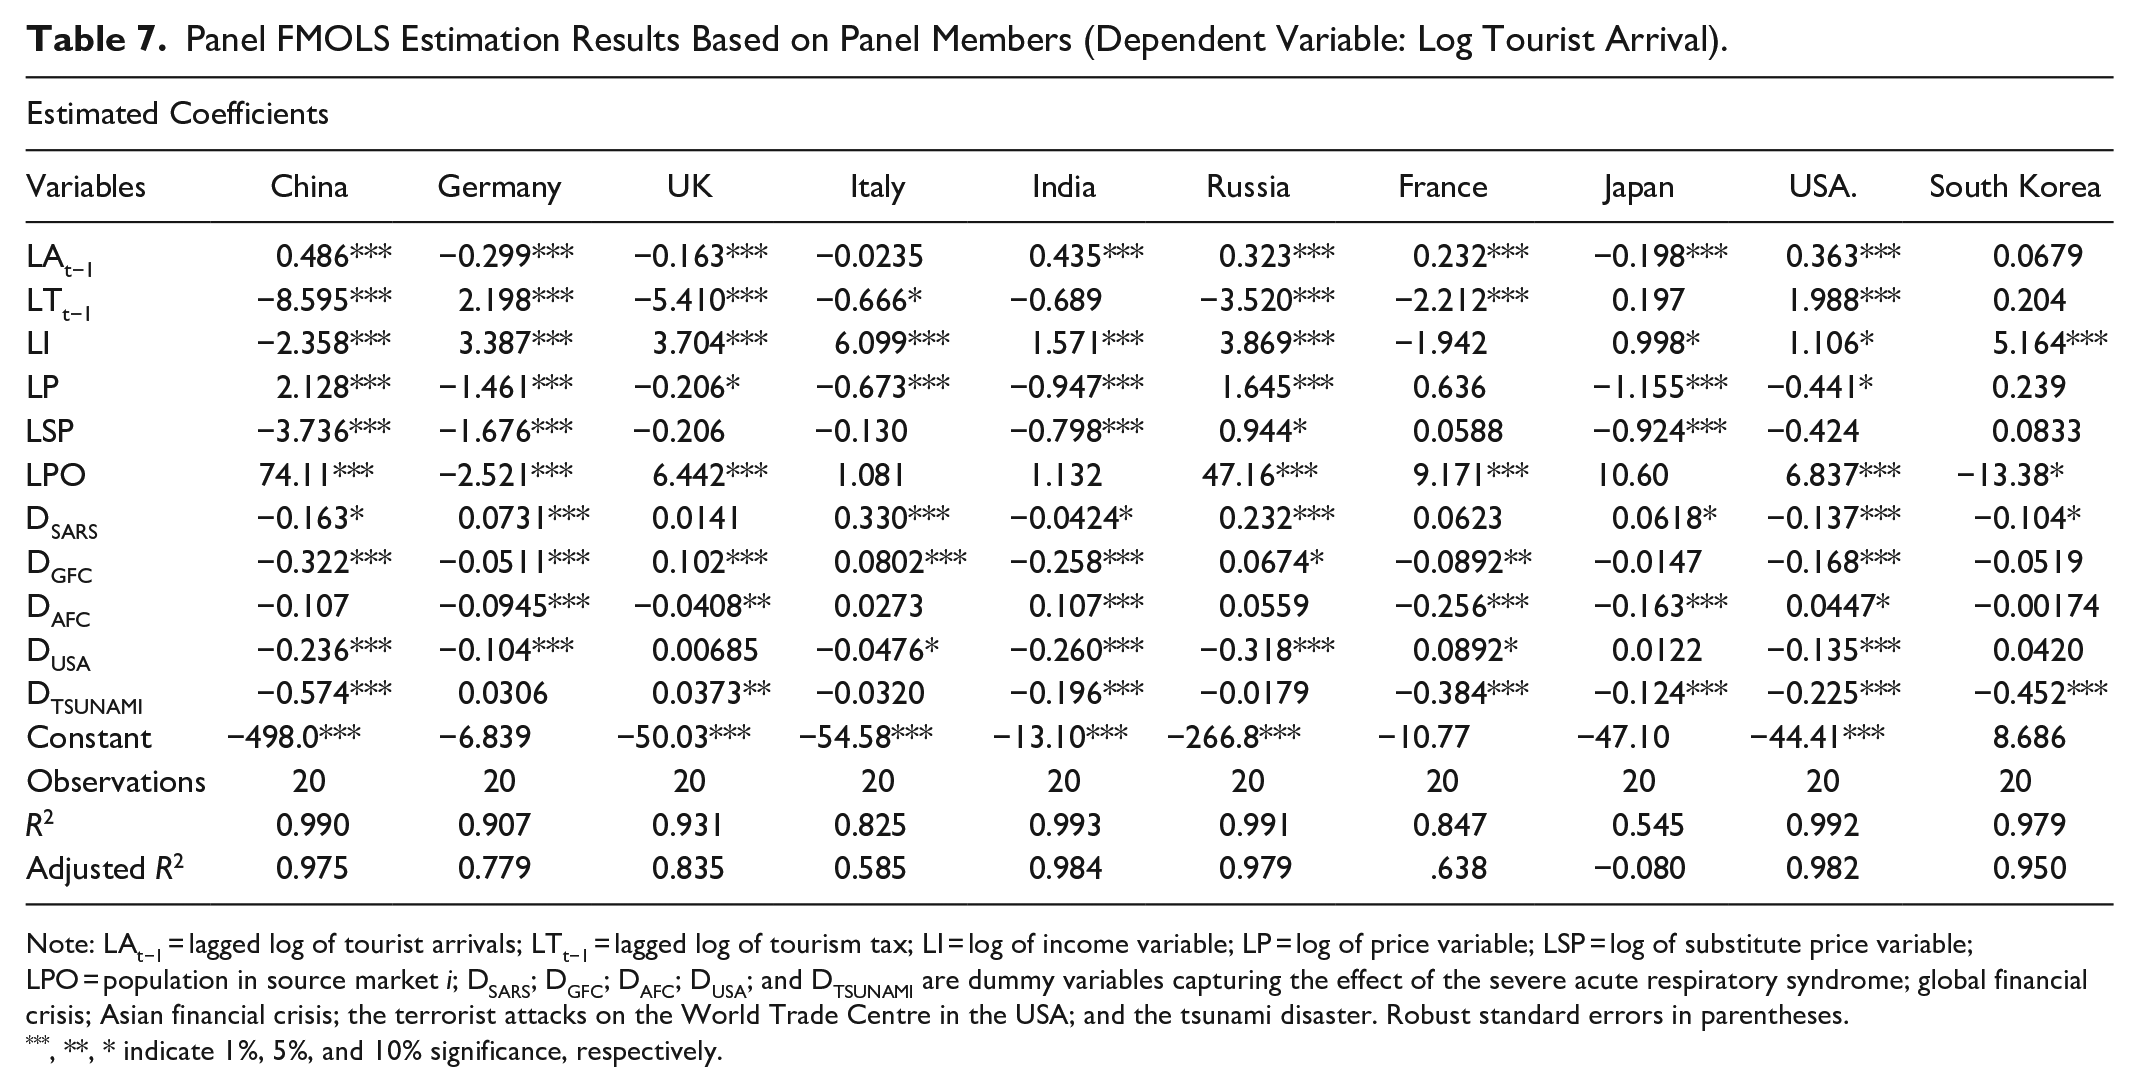
Note: LAt−1 = lagged log of tourist arrivals; LTt−1 = lagged log of tourism tax; LI = log of income variable; LP = log of price variable; LSP = log of substitute price variable; LPO = population in source market i; DSARS; DGFC; DAFC; DUSA; and DTSUNAMI are dummy variables capturing the effect of the severe acute respiratory syndrome; global financial crisis; Asian financial crisis; the terrorist attacks on the World Trade Centre in the USA; and the tsunami disaster. Robust standard errors in parentheses.
**, * indicate 1%, 5%, and 10% significance, respectively.
In contrast, the tourism tax coefficient is not significant for India, Japan, and South Korea in this category. A 1% increase in tourism tax leads to an 8.6% decrease in China; a 5.4% decrease for the UK; 3.5% for Russia and a 2.2% decrease in arrivals from France. The income variable is significant for all countries in this category, except France, and the coefficient is above unity. Also, price is significant for all countries except for France and South Korea. Substitute price is not significant for arrivals from the UK, Italy, France, the US, and South Korea. In terms of population size, a percentage increase in population variable for countries with a larger population (e.g., China and Russia) significantly enhances arrivals.
Group B: Markets positioned 11 to 20
The impact of the determinants of inbound tourism was also distinct from one source market to another among the markets positioned 11 to 20. As shown in Table 8, the lagged dependent variable’s coefficient has the expected sign and is positive for only four markets. This denotes that only tourists from Switzerland, Thailand, Spain, and Singapore tend to repeat their Maldives visits. Nonetheless, the lagged dependent variable does not explain arrivals from Austria. Furthermore, the tourism tax coefficient is significant at the 1% level for all countries in this category apart from Thailand and Switzerland.
Panel FMOLS Estimation Results Based on Panel Members (Dependent Variable: Log Tourist Arrival).
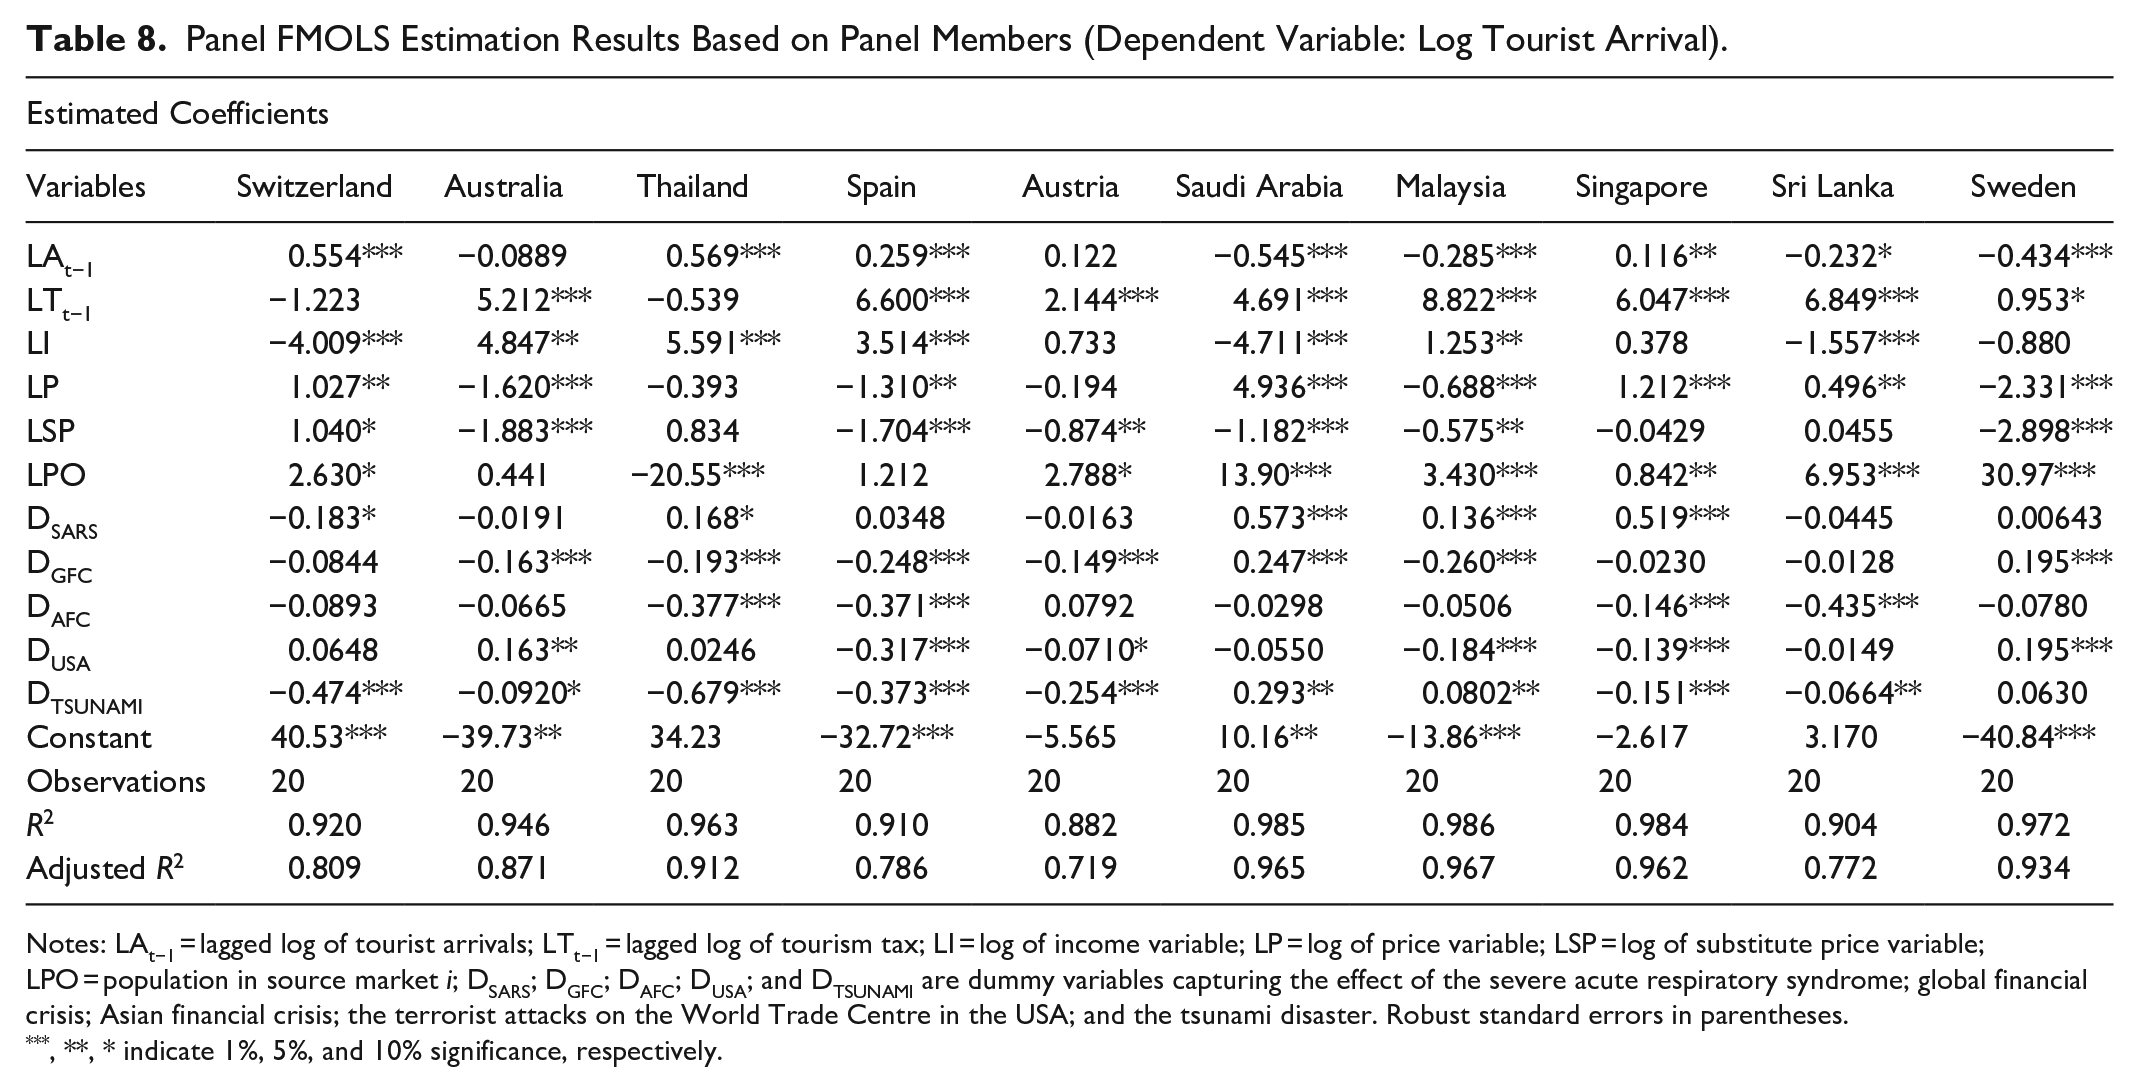
Notes: LAt−1 = lagged log of tourist arrivals; LTt−1 = lagged log of tourism tax; LI = log of income variable; LP = log of price variable; LSP = log of substitute price variable; LPO = population in source market i; DSARS; DGFC; DAFC; DUSA; and DTSUNAMI are dummy variables capturing the effect of the severe acute respiratory syndrome; global financial crisis; Asian financial crisis; the terrorist attacks on the World Trade Centre in the USA; and the tsunami disaster. Robust standard errors in parentheses.
**, * indicate 1%, 5%, and 10% significance, respectively.
Moreover, except for Switzerland and Thailand, the tourism tax coefficient is positive for all countries in group B. This is a notable distinction from the tourism tax coefficient of countries in the top 10 markets (group A). A 10% rise in tourism tax is expected to lead to a surge in arrivals, ranging from 1% to 6.3%. This suggests that tourism demand does not reduce in these countries due to tax changes, as tourism tax may account for only a small proportion of the overall trip cost (Seetaram, Song, and Page 2014) and motivation to travel to an island destination the Maldives. Apart from Austria and Sweden, the income variable is significant for all countries in this category, and the coefficient is above unity in most countries.
Tables 7 and 8 report tourism demand elasticities for the source markets separately using the FMOLS group-mean estimator. This estimator provides for the estimation of long-run relationships for each member of the panel. Table 7 reports estimates of the top 10 source markets, while Table 8 reports the source markets from positions 11 to 20. As shown in both tables’ bottom sections, the data fits the model very well in all cases since both R2 and adjusted R2 are relatively high. The only exception is Japan, with a negative adjusted R2, but this can be improved by increasing the sample size.
Sensitivity Analysis: Price, Tourism Tax and Price Competitiveness Index
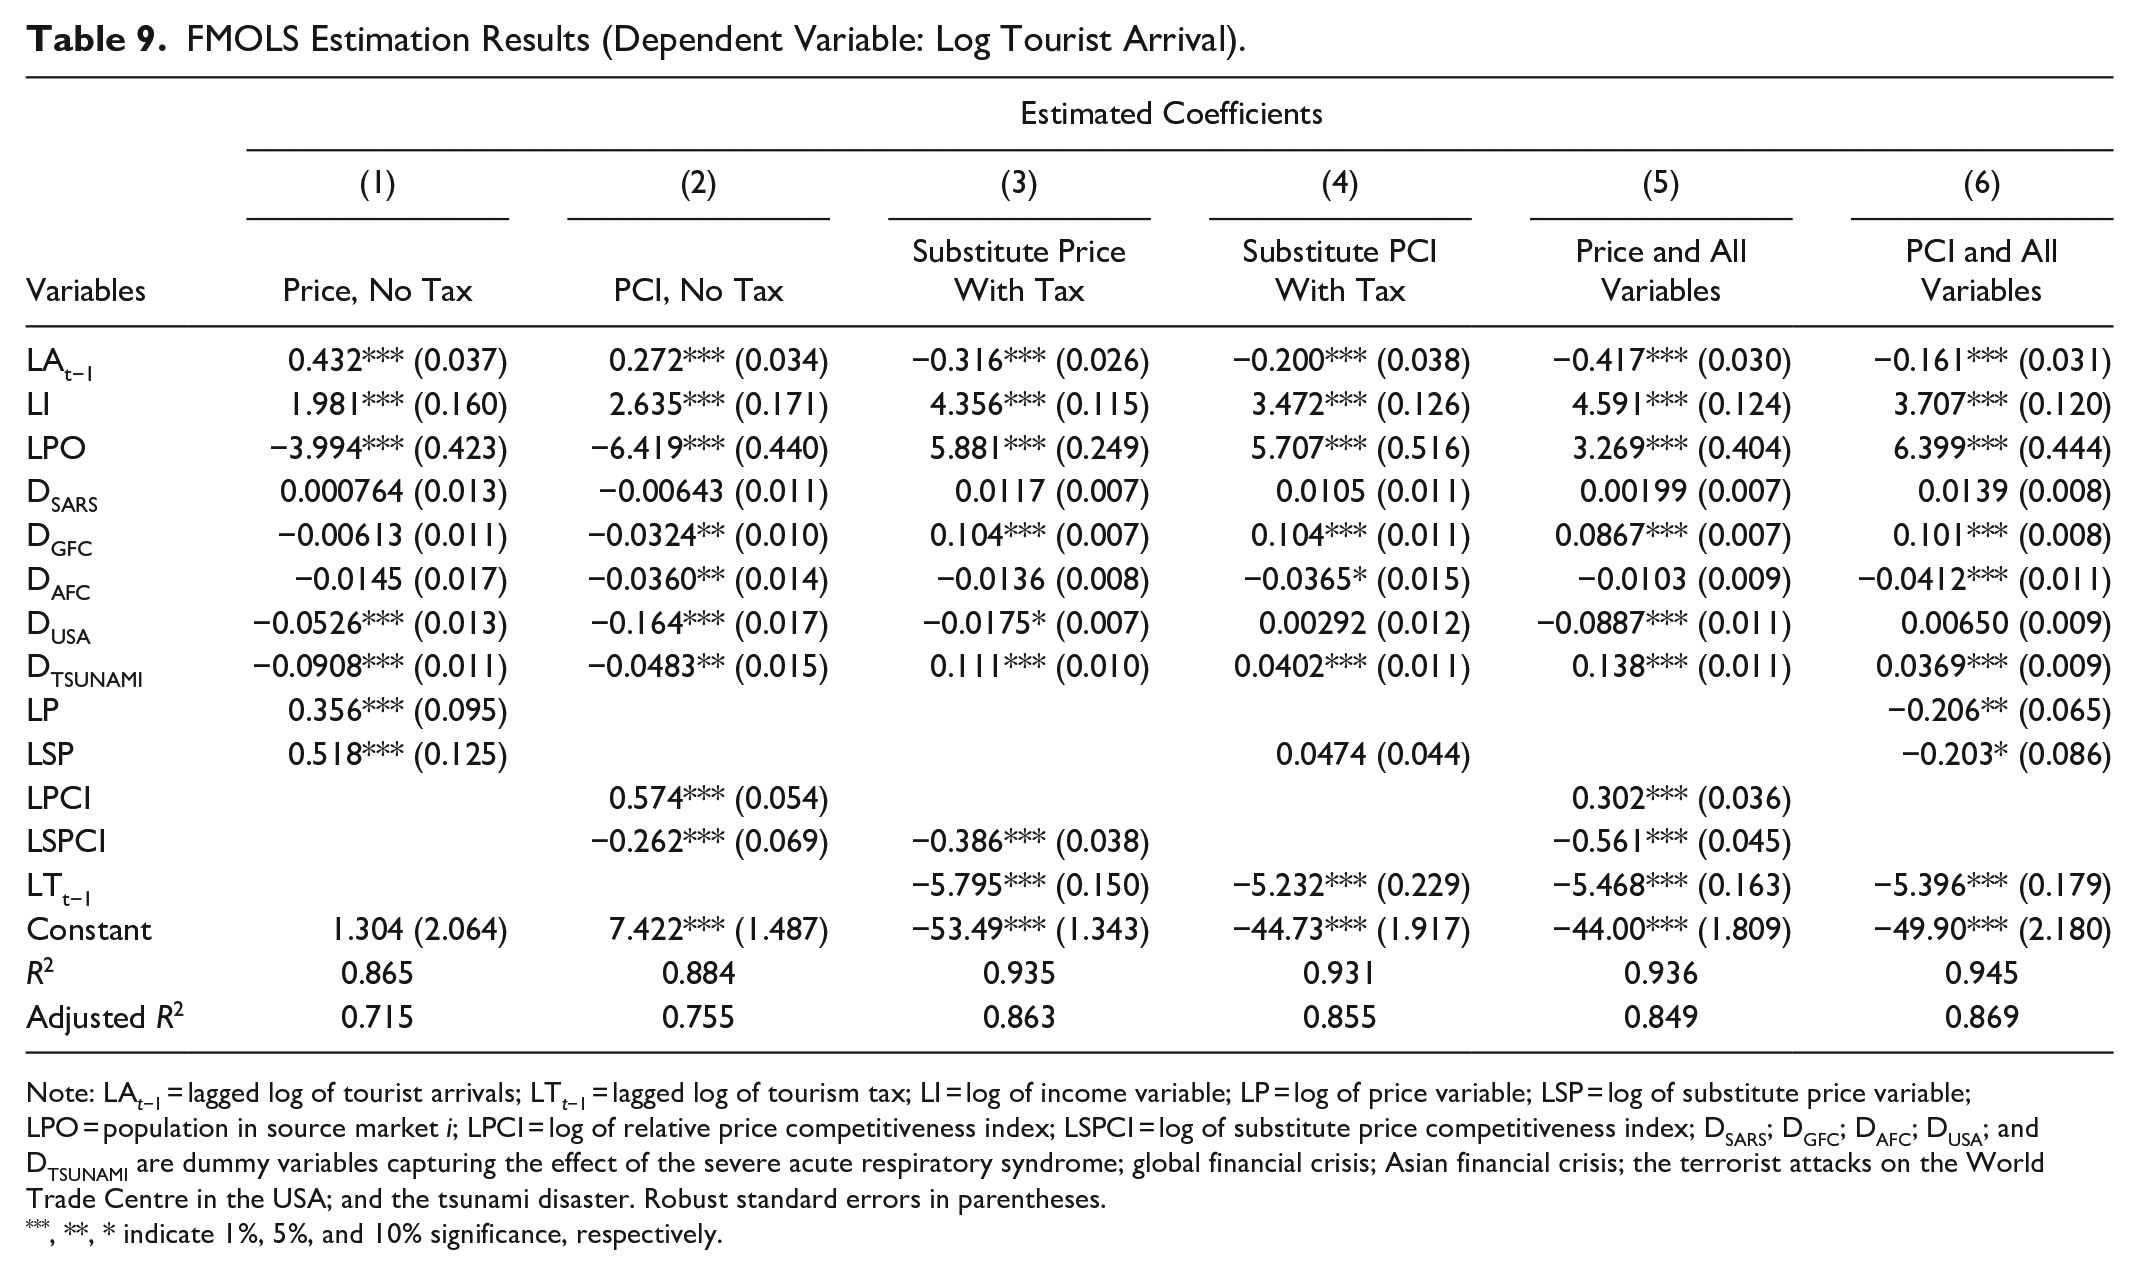
To check the results’ robustness, this study modifies the baseline model in equation (2) to estimate five additional regression models. In columns 1 and 2, the tourism tax variable is excluded from the baseline model, and the own price variable is also excluded in columns 3 and 4. Columns 5 and 6 present the model with both tax and price variables but use different own and substitute prices. Seetaram, Song, and Page (2014) noted that the inclusion of both price and tax variables might affect the magnitude of estimated coefficients. The tourism tax is also regarded as one aspect of the price or cost of tourism products services.
Additionally, this study estimates tourism demand models with the standard tourism price variable measured by CPI and exchange rate, and the price competitiveness index (PCI) measured by relative price level (calculated using the ratios of unadjusted and adjusted GDP per capita PPP) as introduced by Seetaram, Peter, and Larry (2016). According to the study, the price competitiveness index outperforms real exchange rate measures when determining the price effect in tourism demand models. It can effectively monitor changes over time, although this is the first study to present the use of this index in the context of an inbound tourism demand case. In summary, this study attempts to mitigate the problem of multicollinearity. These sensitivity analysis results are presented in Table 9, including the main results from Table 6 for comparison.
FMOLS Estimation Results (Dependent Variable: Log Tourist Arrival).
Note: LAt−1 = lagged log of tourist arrivals; LTt−1 = lagged log of tourism tax; LI = log of income variable; LP = log of price variable; LSP = log of substitute price variable; LPO = population in source market i; LPCI = log of relative price competitiveness index; LSPCI = log of substitute price competitiveness index; DSARS; DGFC; DAFC; DUSA; and DTSUNAMI are dummy variables capturing the effect of the severe acute respiratory syndrome; global financial crisis; Asian financial crisis; the terrorist attacks on the World Trade Centre in the USA; and the tsunami disaster. Robust standard errors in parentheses.
**, * indicate 1%, 5%, and 10% significance, respectively.
From the estimation results in Table 9, without the tax variable in the model, the price competitiveness index surpasses the standard tourism price variable in terms of income elasticity and price effect. It also has the expected sign for cross elasticity. Furthermore, apart from the tourism goods and sales tax (T-GST), the Maldives’ tourism taxes are charged separately from their own price, for example, departure tax, airport maintenance charge, and bed taxes. Results in columns 3 and 4 indicate that PCI has the correct sign for substitute price and tax variables, and income elasticity is higher than the standard own price variable. The tourism tax coefficient is negative and higher but is not significantly different from the other estimations’ coefficient. Generally, the use of PCI is worth considering when modeling tourism demand. Also, both income elasticity and the decrease in repeat visits volume are higher when modeling tourism demand using PCI. Overall, the results for the impact of past tourist arrivals, per capita income, and adjusted relative prices are robust to the inclusion of additional and alternative variables.
Conclusion and Policy Implications
This study’s focus is to evaluate the impacts of imposing taxes on tourism and the implications for inbound tourism. Using the fully modified OLS, the studies show a negative and significant relationship between tourism tax and tourist arrival in the Maldives using the panel countries. This result is confirmed the alternative methods used for comparison purposes. More specifically, in the top 10 tourist arrival countries, China, the UK, Italy, Russia, and France show a negative response to increased tourist tax in the Maldives. At the same time, Germany and the US respond positively and significantly to an increase in tourist tax on average holding other variables constant. On the other hand, in the bottom ten countries, aside from Thailand and Switzerland who recorded a negative but insignificant impact of tourist tax increase, all other countries exhibit a positive and significant relationship between tourist tax and tourist arrivals. That is, these countries would visit the Maldives even with an increase in tourist tax on average.
The findings have significant implications. Amending tax policies by increasing existing rates or introducing new ones negatively influences tourist arrivals from five source markets (China, the UK, Italy, Russia, and France), accounting for up to 44% of the total international tourist arrivals in the Maldives. This implies that tax policy directly affects international tourist arrivals’ volume for destinations dependent on tourism. Also, inbound tourism in the Maldives is inelastic
In line with previous studies (Dogru, Sirakaya-Turk, and Crouch 2017; Seetaram, Song, and Page 2014; Seetaram, Peter, and Larry 2016), after population, income is the largest driver of inbound tourism. As expected, demand’s income elasticity is positive and greater than or equal to unity in 12 source markets. Thus, for these markets, the estimates of income elasticities suggest that travel and tourism are luxuries, strengthening the justification that they could be taxed. In contrast, China, Switzerland, Saudi Arabia, Sri Lanka all have negative income elasticities. In other words, as income rises in these tourist source markets, there is a decrease in the demand for tourism in the Maldives. This finding is in line with previous studies demonstrating the possibility of negative income elasticity of demand (Fredman and Daniel 2018; Ketenci 2010). However, a negative income elasticity may be due to each country’s sample size, nearness to the destination, making the Maldives a luxury to farther source markets. The potentials for visiting other competing and cheaper destinations with similar features as the Maldives. As an essential determinant of tourism demand, own price variable is significant in all destinations except for France and South Korea; it is negative
The findings also suggest that the use of tourism tax revenue to remedy budget deficit and grow the economy has implications for tourism policy in an island economy dependent on tourism regarding managing the volume of inbound tourism despite high taxes and budget deficit issues. Thus, an increase in tourism tax not matched by a significant increase in government tourism expenditure is contractionary and consequently harms the tourism industry by decelerating international tourist arrivals. Thus, policies that can integrate tourism tax revenue benefits by enhancing the destination image and competitiveness are highly desirable. Also, for individual countries, employing different tourism tax rates for different source markets may help maximize the total tourism tax revenue while ensuring that the number of tourist arrivals is sustained.
There is still a lack of strong evidence about the degree of price sensitivity of demand for inbound tourism to the Maldives and how tourists will respond to specific tourism taxes. Hence, further empirical evidence on how tourists respond to governments’ fiscal policies is necessary. One way of achieving this may be to conduct a sectoral analysis of each tourism tax type and the sector’s performance in terms of tourist expenditure. Also, the agenda for future research is to further monitor changes in tourism taxes in small island dependent countries post-COVID-19 pandemic.
Footnotes
Author Contributions
Festus Fatai Adedoyin: Conceptualization, Methodology, Writing- Original draft preparation. Neelu Seetaram: Conceptualization, Investigation, Supervision, Writing- Reviewing and editing. Marta Disegna: Supervision, Methodology, Validation, Writing- Reviewing and editing. George Filis: Supervision, Writing- Reviewing and editing.
Declaration of Conflicting Interests
The author(s) declared no potential conflicts of interest with respect to the research, authorship, and/or publication of this article.
Funding
The author(s) disclosed receipt of the following financial support for the research, authorship, and/or publication of this article: This research was funded by Bournemouth University Doctoral College Studentship Research Fund.