
Abstract
Despite the progressive introduction of accommodation taxes in many European cities, there is no consensus in the literature as to whether they have positive or negative effects. This may be related to the lack of estimates of the elasticity of visitor demand to accommodation taxes. To fill this gap, we carry out two panel-data regressions using a data set of airline travelers from UK cities to Spanish, French, and Italian destinations between 2012 and 2018. The results from the two-stage least squares regressions indicate that UK international travelers are indeed sensitive to hotel taxes. However, the impact of these taxes differs between peak and off-peak periods and across destination countries, with French destinations showing the most negative effect on visitor flows. The analysis of tax elasticities at a destination level also reveals the lack of a significant negative impact on visitor flows to major cities like Venice or Barcelona.
Keywords
Introduction
Before the 1960s, there were no tourism-specific taxes. However, after the strong development of this sector during the last 50 years, there are now approximately 40 types of taxes levied on tourism (WTO 1998). According to the World Tourism Organization, countries that are highly dependent on tourism can generate up to 50% of their total revenue from this source. Tourist taxes can be implemented in two ways: (1) directly on the tourists or tourism businesses, and (2) on complementary sectors, such as travel and accommodation. Gago et al. (2009) discussed four key rationale for taxing tourism: the opportunity for significant revenue, lowering the fiscal burden on local residents, the tax acting as a price substitute for the goods and services that tourists consume, and, lastly, to correct negative externalities, such as the strain on the destination’s natural resources, public transport, and general infrastructure. Taxes help mitigate negative externalities by reducing demand or generating revenue that can be invested in environmental preservation initiatives (Sheng 2017).
Most publications on tourist taxes focus on estimating the impact on tourism demand and social welfare. Corthay and Loeprick (2010) noted that the strong competition among destinations brings with it a significant price elasticity of demand. This should make the industry sensitive to taxes, which can erode the competitiveness of a destination (Durbarry 2008) for both international and domestic visitors (who are also taxed). Despite that, looking at the 20 most visited cities in Europe, we find that approximately 75% of them have some sort of tax levied on tourism (Europarl.europa.eu 2017; Etoa.org 2019; Rhodes and Tyler 2019). In spite of their popularity, there is no clear consensus in the literature as to whether tourism taxes have positive or negative effects. This might be attributed to the fact that there is such a wide range of tourist taxes, which can also be implemented differently and, therefore, have varying impacts across different destinations. Biagi, Brandano, and Pulina (2017) also notes the scarcity of publications about the impact of taxes on visitor flows. Furthermore, the available studies, which typically employ computable general equilibrium (CGE) methods (e.g., Dwyer, Forsyth, and Spurr 2012; Ihalanayake 2012), rely on assumed price elasticities of tourism demand to determine the impact of tourism taxes. However, to the best of our knowledge, there are no available estimates of accommodation tax elasticities. This is the main research gap we aim to cover. We argue that it is a significant contribution since it allows us to provide a specific assessment of the impact of taxes on visitor demand, which may be different from the impact of other visitor living costs bundled within the general price elasticity.
To that end, we carry out two panel-data regressions (for peak and off-peak periods) using a data set of airline travelers from cities in the United Kingdom to Spanish, French, and Italian destinations (both with and without tourism taxes) between 2012 and 2018. The value of the daily accommodation tax for three-star hotels is used as a proxy for overall tourism taxes in each destination. The results from the two-stage least squares regressions indicate that UK international travelers are indeed sensitive to hotel taxes, which have a significant negative impact on visitor flows during the peak summer periods. The same strong negative impact was not found during off-peak winter periods. Furthermore, the impact of the taxes differs across destination countries, with French destinations being the most affected. The analysis of tax elasticities at a destination level also reveals the lack of a significant negative impact on visitor flows to major cities like Venice or Barcelona.
The remainder of this article is structured as follows: the second section provides a literature review on the impact of tourism taxation on travel demand. The third section presents the UK case study, explains the process of data collection, and the panel data regression approach. The fourth section presents the results and discusses their main implications. The fifth section concludes with a summary of the main findings.
Literature Review
Since the introduction of tourism taxes in the 20th century, there has been an increasing amount of research on the subject. The earliest research on the implications and impact of tourism taxes is mostly focused on the United States. However, in the last 20 years, many studies concerning European countries have been published.
The overexploitation of public resources involved in tourism activity to the point of congestion can reduce the value of a destination (Lukashina et al. 1996) and threaten the long-term sustainability of tourism-related economic activity (Hernández-Martín, Álvarez-Albelo, and N. Padrón-Fumero 2015). One way to tackle congestion is to reduce visitor numbers with the introduction of tourism taxes (so visitors can internalize the congestion externality). These taxes generate revenues that can be invested in the preservation of local tourism resources (Palmer and Riera 2003).
The positive and negative aspects of tourism taxes are well established, though the literature is far from consensus on which effect dominates. On one hand, tourist taxes shift the burden of the tax away from locals, making it a more efficient source of revenue, since the tourists are made to bear the welfare loss associated with taxes (Gooroochurn and Sinclair 2005). The additional environmental benefits of “eco-taxes” in tourism areas are noted by Gossling et al. (2005), despite the possibility of taxes leading to increased prices for locals in goods such as fuel. On the other hand, the seminal paper of Mak and Nishimura (1979) argues that the relatively high price sensitivity of visitors implies that tourist taxes can have a negative impact on demand and revenues (also noted by Durbarry 2008). This was confirmed by do Valle et al. (2012), who found that the typical sun-and-beach tourist (a dominant segment of demand in many destinations) is not willing to pay accommodation taxes, and only the smaller segments of environmentally conscious and nature-oriented tourists are receptive to taxation.
Sheng and Tsui (2009) stated that the impact of tourism taxes on social welfare depends on the market power of the given destination (which can mitigate the price elasticity effect), and that they are more likely to be welfare-enhancing when considered in a broader social context (thus adding the environmental benefits). Bird (1992) also argues for the imposition of tourist taxes in developing countries, where tourism may be one of the fastest-growing sectors. These views stand in contrast to Clarke and Ng (1993), Dwyer, Forsyth, and Spurr (2012), and Ihalanayake (2012), who concluded that taxes have a negative impact on welfare and GDP, but that governments implement them because they are easy sources of income. Overall, the aggregation of these points creates an interesting paradox, since a tax can reduce competitiveness if the destination does not have enough market power, yet the revenue generated from a tax can increase competitiveness and market power if invested effectively, for example, in environmental protection or quality improvements (Litvin et al. 2006).
Biagi, Brandano, and Pulina (2017) pointed out that even though there have been many publications discussing tourism taxes since the 1970s, there is a scarcity of studies that estimate the impact on visitor flows. Most studies have focused on indirect tourism taxes such as carbon taxes or departure taxes on air travel. For example, Tol (2007) estimated the impact that carbon taxes on aviation would have on international travel demand. The author concluded that any decrease in long- and short-haul flights would be offset by an increase in medium-haul flights. Therefore, the overall demand will not be significantly affected. Dwyer et al. (2012), on the other hand, concluded that carbon taxes in Australia would lead to a “small but significant” contraction of most tourism-related industries, particularly in the accommodation, transport, and catering sectors. Turning their attention to airline departure taxes, Forsyth et al. (2014) confirmed the negative impact on Australian tourism but also a positive impact overall on the Australian economy because of the tax working as a transfer of income from tourism to other sectors. Looking at taxes for departing flights in Germany and Austria, Falk and Hagsten (2019) found a 9% reduction in departures in the first year of implementation and a 5% in the next. They highlighted that the airports that are dominated by low-cost airlines carry most of this reduction, suggesting that consumers of these airlines are more price-elastic. Seetaram, Song, and Page (2013) concluded that the UK airport passenger departure tax only has a slight negative effect on demand in approximately half of the international destinations, whereas the demand is inelastic concerning the other half. We can also mention Durbarry (2008), who concluded that, in a context of strong price elasticity, UK passenger departure taxes will affect outbound tourism demand negatively.
There is another body of literature that focuses specifically on accommodation taxes and clearly documented the sensitivity of hotel guests to these surcharges. We can mention the early contributions by Mak and Nishimura (1979) or Hiemstra and Ismail (1992), who both argued about the negative impact of taxation on hotel occupancy rates in the United States. More recently, Lee (2014) concluded that hotels with bed taxes experience some degree of competitive disadvantage due to high substitutability with hotels in close regions that did not charge a tax. When evaluating the impact on visitor numbers at a city or regional level, there are a few studies about the Balearic Islands (Spain), which is a very strongly seasonal destination that is prone to congestion during the summer months. Aguiló, Riera, and Rosselló (2005) concluded that a tax of €1 per tourist per day would lead to a decrease in annual visitor arrivals of 117,000 to the region. This value was calculated from estimated price elasticities of tourism demand (including relative prices and exchange rates) but did not employ tax data since the study was carried out before the implementation. Palmer and Riera (2003), on the other hand, concluded the opposite. They expected the impact of tourism taxes to be low in the Balearics because of low price elasticities. Rosselló and Sansó (2017), with a post-implementation study, concluded that the current tax led to a decrease in tourist stays in the Balearics of 0.4% to 0.8%. Again, this estimate is based on assumed price elasticities of demand. This paucity of studies indicates that there is room for more contributions, particularly if they are carried out post-implementation using data on the actual taxes. Moreover, none of the studies above estimated the elasticity of demand to accommodation taxes but, instead, relied on estimates of the overall price elasticities of tourism demand, which bundles different components of the tourists’ living costs. We find this to be a weakness in the assessment of the specific impact of accommodation taxes on visitor numbers.
The use of assumed price elasticities to approximate the economic impact of tourism taxes is very common in the literature. From a methodological perspective, the majority research is grounded in neoclassical economics (Song et al. 2012), which explains the popularity of demand analyses made via computable general equilibrium (CGE) methods. GCE is commonly used to model the behavior of multiple markets simultaneously in the presence of external shocks. CGE methods are an efficient way to explore and study the impact of taxation on tourism (see, e.g., Gooroochurn and Sinclair 2005; Sheng 2011; Ihalanayake 2012; Ponjan and Thirawat 2016), though they do not allow researchers to obtain a formal expression of demand from which to derive demand elasticities. On the contrary, the econometric estimation of demand functions allows for elasticities to be calculated and has become increasingly popular in tourism research over the last decades (Durbarry 2008). This is the approach we use in this paper.
The most common dependent variable is tourist arrivals, typically proxied by inbound air passengers (Durbarry 2008; Morley, Rosselló, and Santana-Gallego 2014) if the origin or destination regions are geographically isolated (i.e., islands). Alternatively, past authors have used tourist expenditures, overnight stays, length of stay (Rosselló and Sansó 2017), or the overall revenue of the tourism sector (Song and Li 2008). Income is the most common explanatory variable, typically proxied by a measure of GDP per capita for either or both origin and destination countries (Song et al. 2012). There is a broad consensus about the fact that international tourism is a normal good (i.e., positively linked to income) and income-elastic, which makes it a luxury good (Morley 1992; Crouch 1994). It is also important to account for the visitors’ travel and living costs. The use of consumer price indexes (CPIs) for the destination (possibly specific to accommodation and catering services) is the established approach in combination, if relevant, with exchange rate fluctuations (Martin and Witt 1987). Crouch (1992) also recommended adjusting destination prices with origin prices to obtain a measure of relative prices that is more representative of the information that outbound tourists would take into consideration when deciding to travel abroad. In the absence of detailed price information for a diverse set of origin and destination countries, there are publications that simply use exchange rates as a proxy for living costs (Su and Lin 2014) and jet fuel prices as a driver of airfares (Wadud 2015). Still, there is no separation between accommodation taxes and other elements of travel and living costs in past econometric approaches to estimate tourism demand.
Regarding tourism taxes, past contributions have looked at different types of taxes, which include air passenger duty (APD) (Seetaram, Song, and Page 2013; Falk and Hagsten 2019), value-added taxes (VATs) (Jensen and Wanhill 2002), and accommodation taxes (Mak and Nishimura 1979; Rosselló and Sansó 2017; Aguiló et al. 2005). We focus on the latter, while adopting past authors’ approach of collecting data on tax amounts per person and night, as it is the type of direct tourist tax that has received the most attention in the general press over the last decade and, in addition, it is a tax that most outbound UK travelers cannot avoid paying when traveling to popular European destinations.
Despite using established variables and empirical approaches, by separating accommodation taxes from other components of tourists’ travel costs in an econometric specification, we aim to estimate the tax elasticities of demand directly. This is a novel approach to determine the impact of accommodation taxes on visitor numbers and represents the main contribution of this paper.
Data and Methodology
Case study
We study the impact of tourist taxes on the UK outbound travel demand between 2012 and 2018. The destinations analyzed are the three major European ones for UK international travelers: France, Italy, and Spain (Rhodes and Tyler 2019). As it is common in the literature on tourism demand, the number of outbound airline passengers will be used as a proxy of the overall demand for outbound travel. Since our data set (Official Airline Guide [OAG]) provides information on both country-of-sale of the airline tickets as well as their booking class, we restrict our dependent variable to include only tickets sold in the United Kingdom and traveling on economy class, in order to better approximate the number of outbound UK travelers who would be most sensitive to accommodation taxes. Since the unit of observation is defined at a city level (in order to match our data on accommodation taxes) and with semiannual frequency, the airline traffic data (from the United Kingdom to the three selected countries) have been aggregated for all airports in the same city. Two time periods are defined: the “Summer” period comprises from May to October and represents “peak” demand, while the “Winter” period covers from November to April and represents “off-peak” demand. The data include both direct (i.e., nonstop) and indirect air travel itineraries, which allows us to uncover additional places of origin for airline passengers who may depart from cities that do not have international airports. This is clearly illustrated in Figure 1, which provides an overview of our sample. Air travelers depart from 38 cities in the United Kingdom and arrive in 129 destination cities across France (56), Italy (33), and Spain (40).
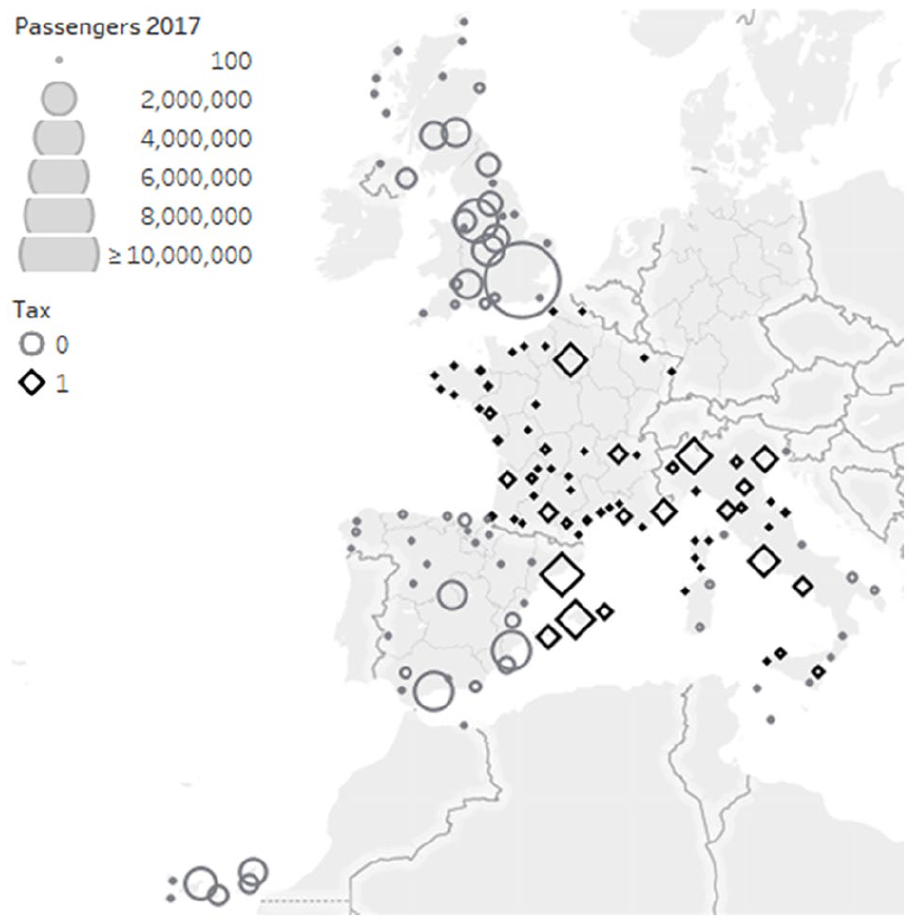
Origin and destination cities in the sample.
Despite the plethora of destinations, there is a clear concentration of travelers around popular places. This information is expanded in Table 1, which shows the top 10 origin and destination cities in all sample countries, as well as the respective three-star accommodation taxes per person night during the Summer of 2017. London dominates originating travel from the United Kingdom, followed by Manchester and Birmingham, which is not surprising given the high population of these cities as well as the size of their respective airports. Overall, Spain is the most popular destination among the selected ones, with 8.47 million passengers in 2017 (61.8% of the total traffic). One reason for this popularity is the diversity of destinations available, with the capital and most populated city (Madrid) in seventh place, surpassed by coastal destinations in the Mediterranean (e.g., Alicante, Málaga, Barcelona) as well as in the Canary Islands. With more evenly distributed traffic shares across cities, the Spanish market has a Hirschman-Herfindahl Index (HHI) of 949. In France (2.25 million travelers and 16.4% of traffic), Paris is the main destination followed by Nice, which is the main gateway to the tourist hotspots in the Mediterranean Coast. The traffic share of other French destinations decreases quickly, leading to a more concentrated market (HHI of 1,202). The Italian market (2.96 million travelers and 21.6% of traffic) is even more concentrated around Milan, Rome, and Venice, with an HHI of 1,432.
Top 10 Origin and Destination Cities per Country (2017).
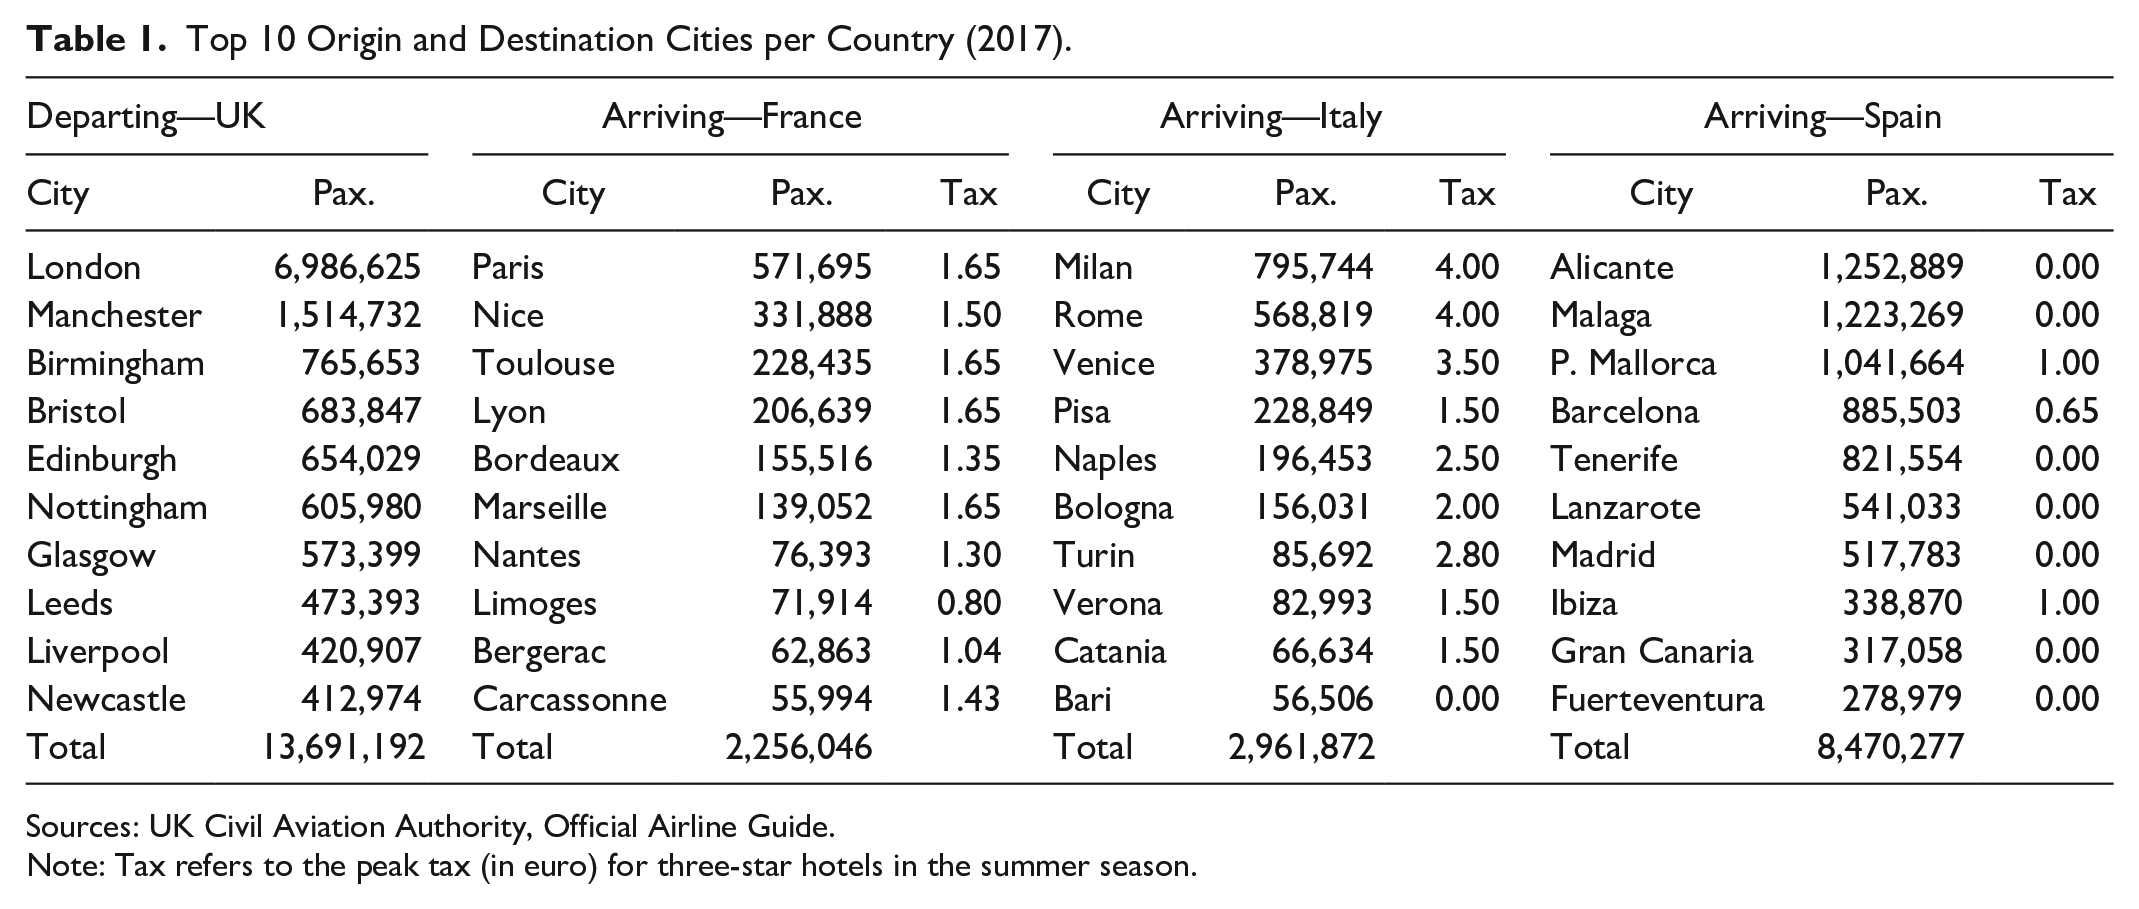
Sources: UK Civil Aviation Authority, Official Airline Guide.
Note: Tax refers to the peak tax (in euro) for three-star hotels in the summer season.
Figure 1 also reveals that the three destination countries have different approaches to tourism taxation: (1) France has a widespread coverage, with taxes present for all destinations and years in the sample. (2) Italy has taxes in most major destinations, all of which received 88% of the UK visitors (in 2017). The values differ across destinations, with Catania or Genoa having smaller taxes than Rome or Venice. (3) Accommodation taxes are only present in two regions in Spain: Catalonia (including the main airport in Barcelona and the secondary entry points in Girona and Reus) and the Balearic Islands (Mallorca, Menorca, and Ibiza), all of which received 35% of the UK traffic to Spain. The taxes had been introduced (or were already in place) by Summer 2012. The tax amounts for Girona and Reus are lower than the Barcelona ones but, since there is a substantial proportion of travelers to these secondary airports that stay in Barcelona, these cities are given the Barcelona tax values for the determination of tax elasticities. The Balearics doubled the amount in 2017.
Besides the city taxes, it is worth nothing how major events, such as the Brexit vote in June 2016, may have had an impact on UK outbound tourism demand. Figure 2 provides an overview of the annual change in international air passengers from the UK to the three selected countries against the changes in national income per capita and exchange rate (in euros per pound). We clearly see that the outbound UK travel market was showing clear signs of stagnation between 2012 and 2015, but, from 2016 onwards, has shown higher rates of growth despite the negative economic environment (with a greatly devaluated pound and reduced income per capita). This seemingly irrational behavior after a market shock (particularly in view of the high income elasticity traditionally associated to tourism demand) justifies the use of advanced statistical methods to disentangle the impact of city taxes (as a separate component of living costs) on outbound travel demand in the United Kingdom.
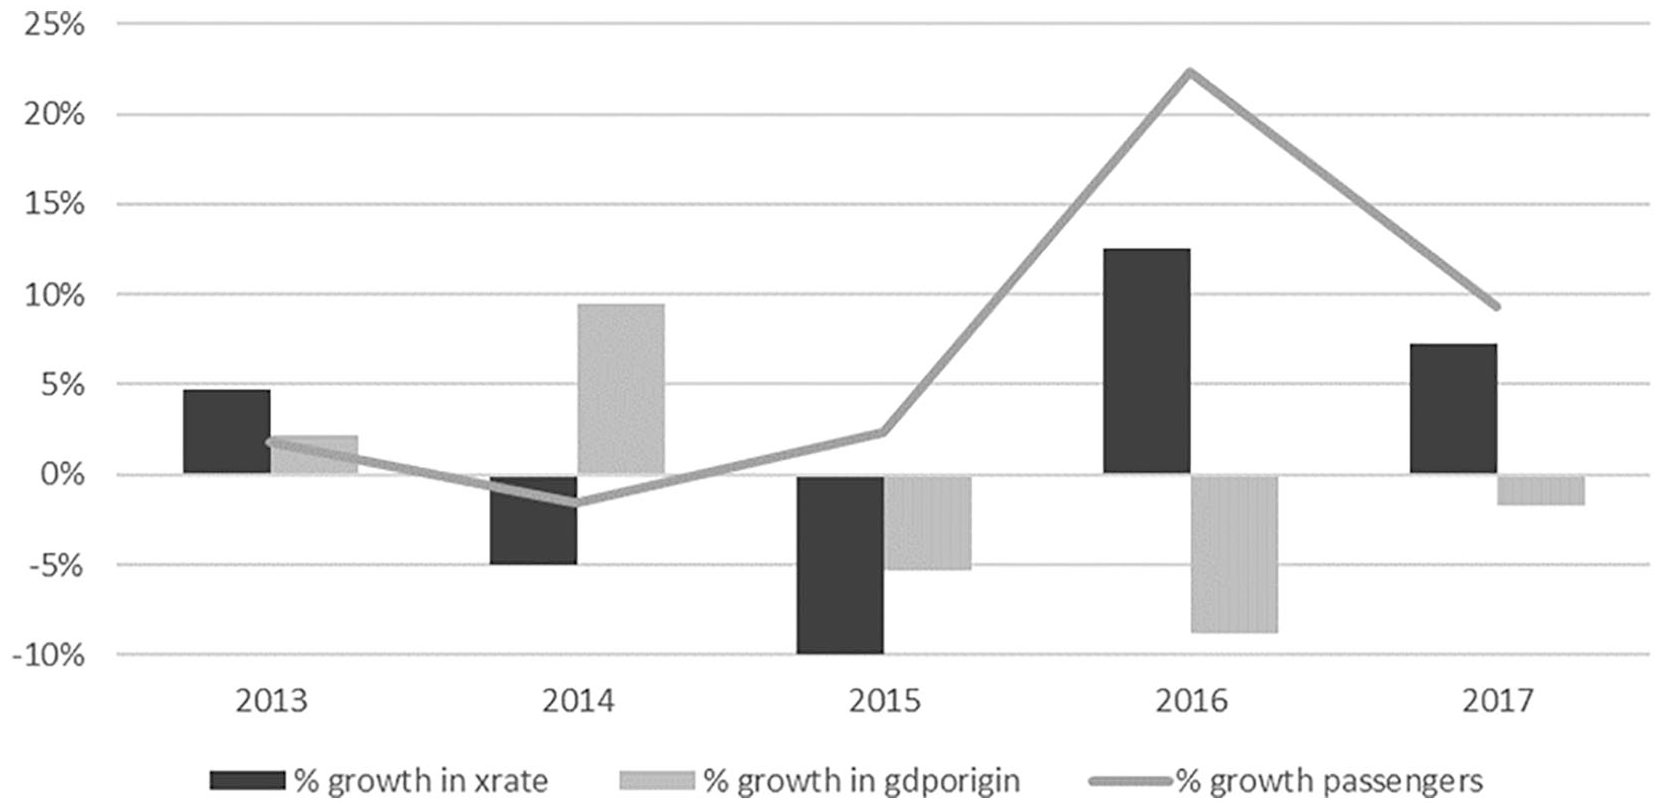
Annual change in UK outbound air travel, GBP/EUR exchange rate, and GDP per capita 2013–2017.
Panel-Data Regression
An unbalanced panel data set of 13,071 observations was obtained. This includes a cross-section of 1,867 origin–destination airport pairs over 12 semiannual time periods, from Summer 2012 (May 2012 to October 2012) to Winter 2017 (November 2017 to April 2018). We argue that the use of panel data is justified since the tax amounts change over time and we combine destination cities with and without hotel taxes. Thus, there is variability in both cross-section and time-series dimensions in our data, which is beneficial for our research aims. Still, origin–destination markets with zero traffic were removed. In order to facilitate the interpretation of some of the coefficients as demand elasticities, a double-log / log-linear specification was employed (with variables that take zero values left unlogged). Our basic model is shown in Equation 1:
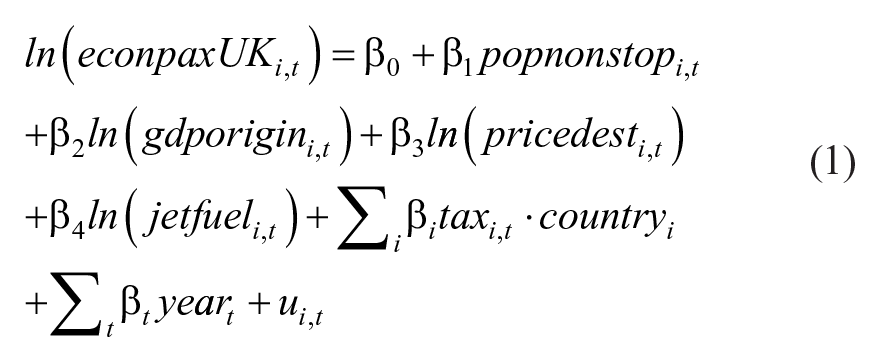

where i = (1, . . ., 1867) denotes an origin–destination city pair and t = (1, . . ., 12) refers to the time period. The usual random error is denoted by ε, and β refers to the vector of coefficients to be estimated. Finally,
While there is no clear consensus in the literature about the drivers of demand for tourism, there are, however, some factors that have always been considered by past studies, which are income and price levels (Crouch 1994). We include the origin income (gdporigin), measured as GDP per capita at the NUTS2 area (we use the European Union’s Nomenclature of Territorial Units for Statistics) where the origin city is located. This coefficient is expected to be positive, according to the past literature, since tourism demand is widely accepted to be a normal, luxury good (Peng, Song, and Crouch 2014).
The role of “price” is included in the model in two ways: first, the visitors’ travel costs are proxied by the average jet fuel prices over the respective period (jetfuel), sourced from the US Energy Information Administration and, second, the visitors’ living costs (pricedest) are proxied by the destination city’s GDP per capita multiplied by the exchange rate measured at the end of each period. The logic is that living costs (not only accommodation but also catering and transportation) will be more expensive in richer regions and cities. While the literature recommends using consumer price indexes for the destination, possibly adjusted by the origin prices (Crouch 1992), there is not a consistent source of data available at a city or NUTS2 level for the three sample countries. Historical hotel rate data were not available for the sample period either. We collected information on purchasing power parity (PPP) exchange rates at a NUTS2 level, which can serve as proxies for regional price indexes. However, these indexes ended up being strongly correlated with the regional incomes. In support of using an exchange rate adjustment to obtain a traditional price–demand relationship, we can mention the lack of endogeneity problems, which are common when estimating tourism demand functions for destinations that are highly dependent on tourism (as many cities in the Mediterranean coast are) and for which the assumption of a perfectly price-inelastic tourism supply is not tenable (Crouch 1992).
Tourist taxes (tax) are measured as the accommodation tax per person-night in a three-star hotel for each year in the sample, and they have been collected mainly from online sources (Taxesejour.impots.gouv.fr 2019; Grouptravel-europe.com 2019; Italyvacations.com 2019; Fernández 2019; Rosselló and Sansó 2017). The amount of hotel taxes to be paid is explicitly shown to customers of major online platforms (such as hotels.com or booking.com) at the time of booking. Hence, we assume that travelers are informed of the existence of these taxes and thus, they can have an impact on travel choices. According to the results from past studies, a negative coefficient can be expected since tourism demand is negatively affected by trip costs (Rosselló and Sansó 2017). An interaction between the tax coefficient and a dummy variable for the arrival country was added to the specification in order to obtain disaggregated results. For the discussion section, the tax coefficient was further subdivided in order to obtain city-specific tax elasticity estimates.
Because of the United Kingdom’s insular nature, the quality of air connectivity can be considered a key driver of the number of outbound international visitors to a given destination. The proportion of nonstop airline frequencies in each market (pnonstop) is the chosen metric for that factor. The potentially endogenous relationship between air connectivity and international visitors is addressed by employing two instruments at a city-pair level: the share of low-cost bookings (slcc) and the market concentration, measured as the sum of the airlines’ squared market shares, which is known as the Hirschmann-Herfindahl index (hhi). The low-cost instrument refers to the well-established notion that low-cost operators only sell nonstop connections, as opposed to full-service carriers that may offer indirect airline itineraries via their hub-and-spoke networks (Dobruszkes 2013). A market that is more competitive (i.e., with a lower HHI) will pressure the airlines to offer nonstop connections to capture a higher market share. All these air traffic variables were sourced from OAG.
The specification is completed with a set of dummy variables for each sample year to capture time–trend effects and other demand shocks, such as those linked to the Brexit vote discussed in the previous section.
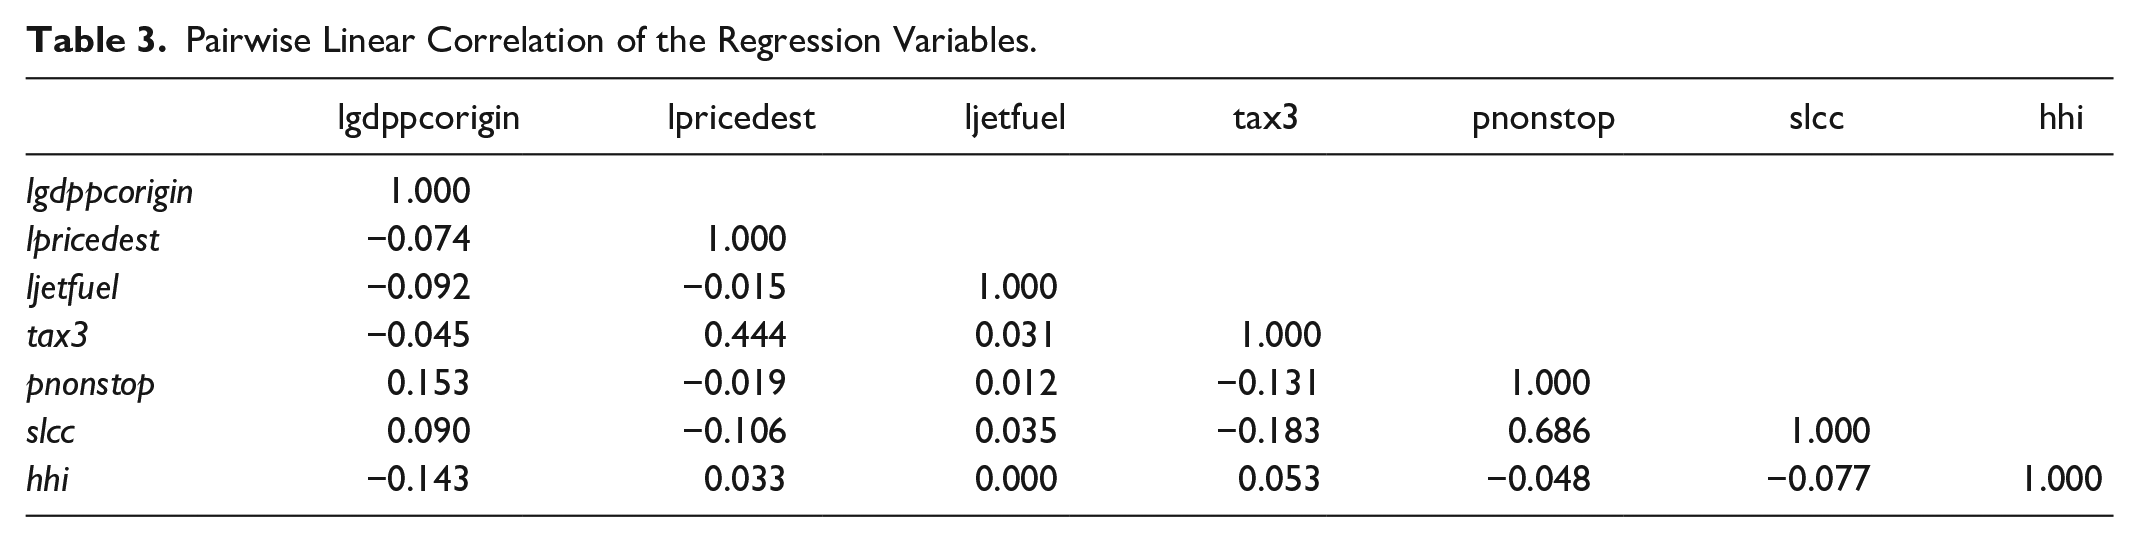
Table 2 provides descriptive statistics of the chosen variables for the summer and winter subsamples. The large variability in market sizes (shown by the passenger variable) suggests that our specification is likely to present heteroskedasticity and, thus, we employ robust standard errors in the econometric regression. Table 3 shows the pairwise linear correlation coefficient among the right-hand-side variables, which allows us to discard any issues with multicollinearity, as well as to confirm that the low-cost instrument is strongly correlated with the nonstop connectivity factor.
Descriptive Statistics of the Regression Variables.
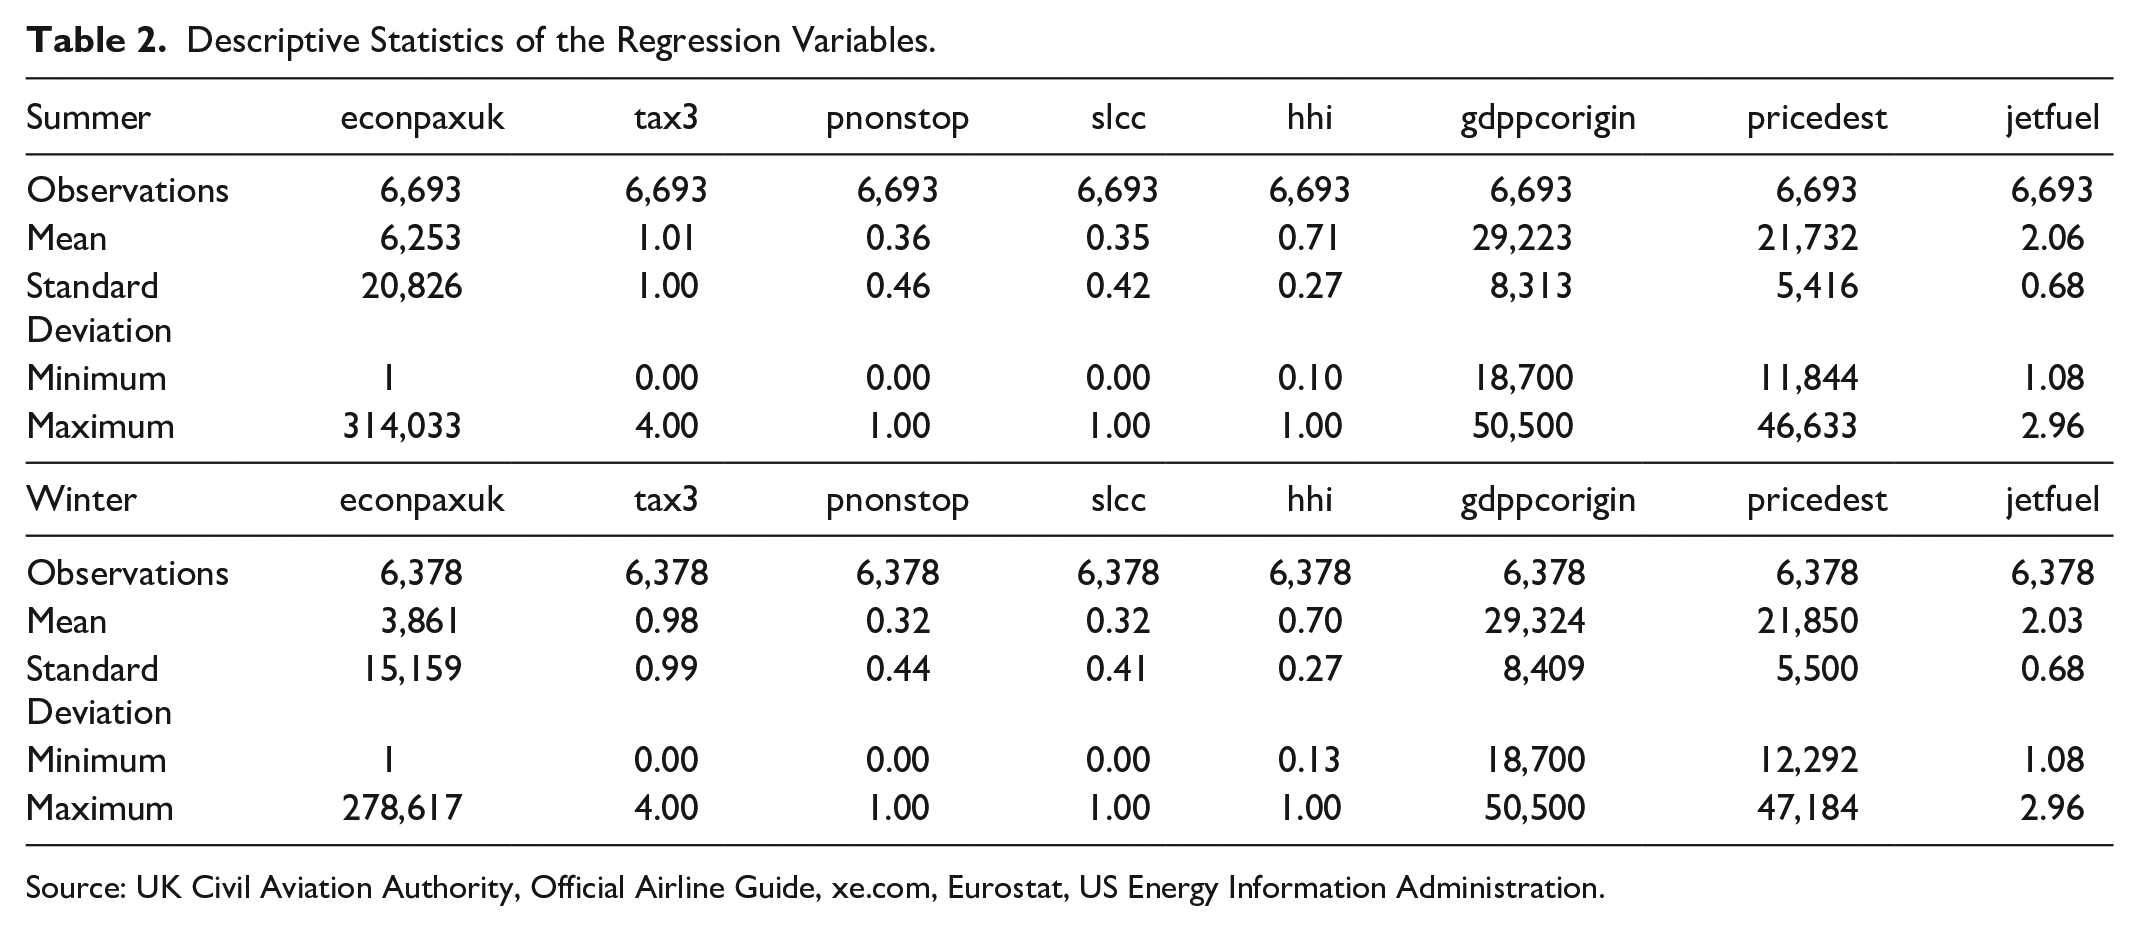
Source: UK Civil Aviation Authority, Official Airline Guide, xe.com, Eurostat, US Energy Information Administration.
Pairwise Linear Correlation of the Regression Variables.
The Breusch–Pagan multiplier test supports the use of a panel-data versus the pooled approach with 1% significance. The Sargan–Hansen test concludes that an endogenous relationship exists between econpaxUK and pnonstop with 1% significance, thus supporting the use of a two-stage least squares (2SLS) regression method. The results of a Hausman test recommend that the estimation is carried out under a fixed-effects framework in order to account for the influence of nonobservable factors, such as different levels of destination loyalty, possibly as a consequence of migration flows under the freedom-of-movement provisions of EU treaties. Finally, a White test does not reject the presence of heteroskedasticity at 1% significance, which means that we will estimate the model with robust standard errors.
Results and Discussion
The results from the 2SLS regressions (shown in Table 4) indicate that UK international air travelers are slightly price-inelastic during the peak summer period and slightly elastic during winter. These results agree with the long-run price elasticity of British visitors to Spain from Álvarez-Díaz et al. (2015), as well as with the inelastic estimate from Garín (2011), respectively. The impact of jet fuel prices on visitor flows is not significant at 5% level in either model. As expected, the quality of nonstop air connectivity has a positive and significant on impact on visitor flows, regardless of season. Our UK income coefficients (around 0.53 in both models) disagree with the traditional view that international travel is a luxury good (Crouch 1992) and agree with the recently documented trend of decreasing income elasticities due to an ongoing saturation process (Gunter and Smeral 2016) and the impact of the economic recession during the last decade (Smeral 2017).
2SLS Regression Results.
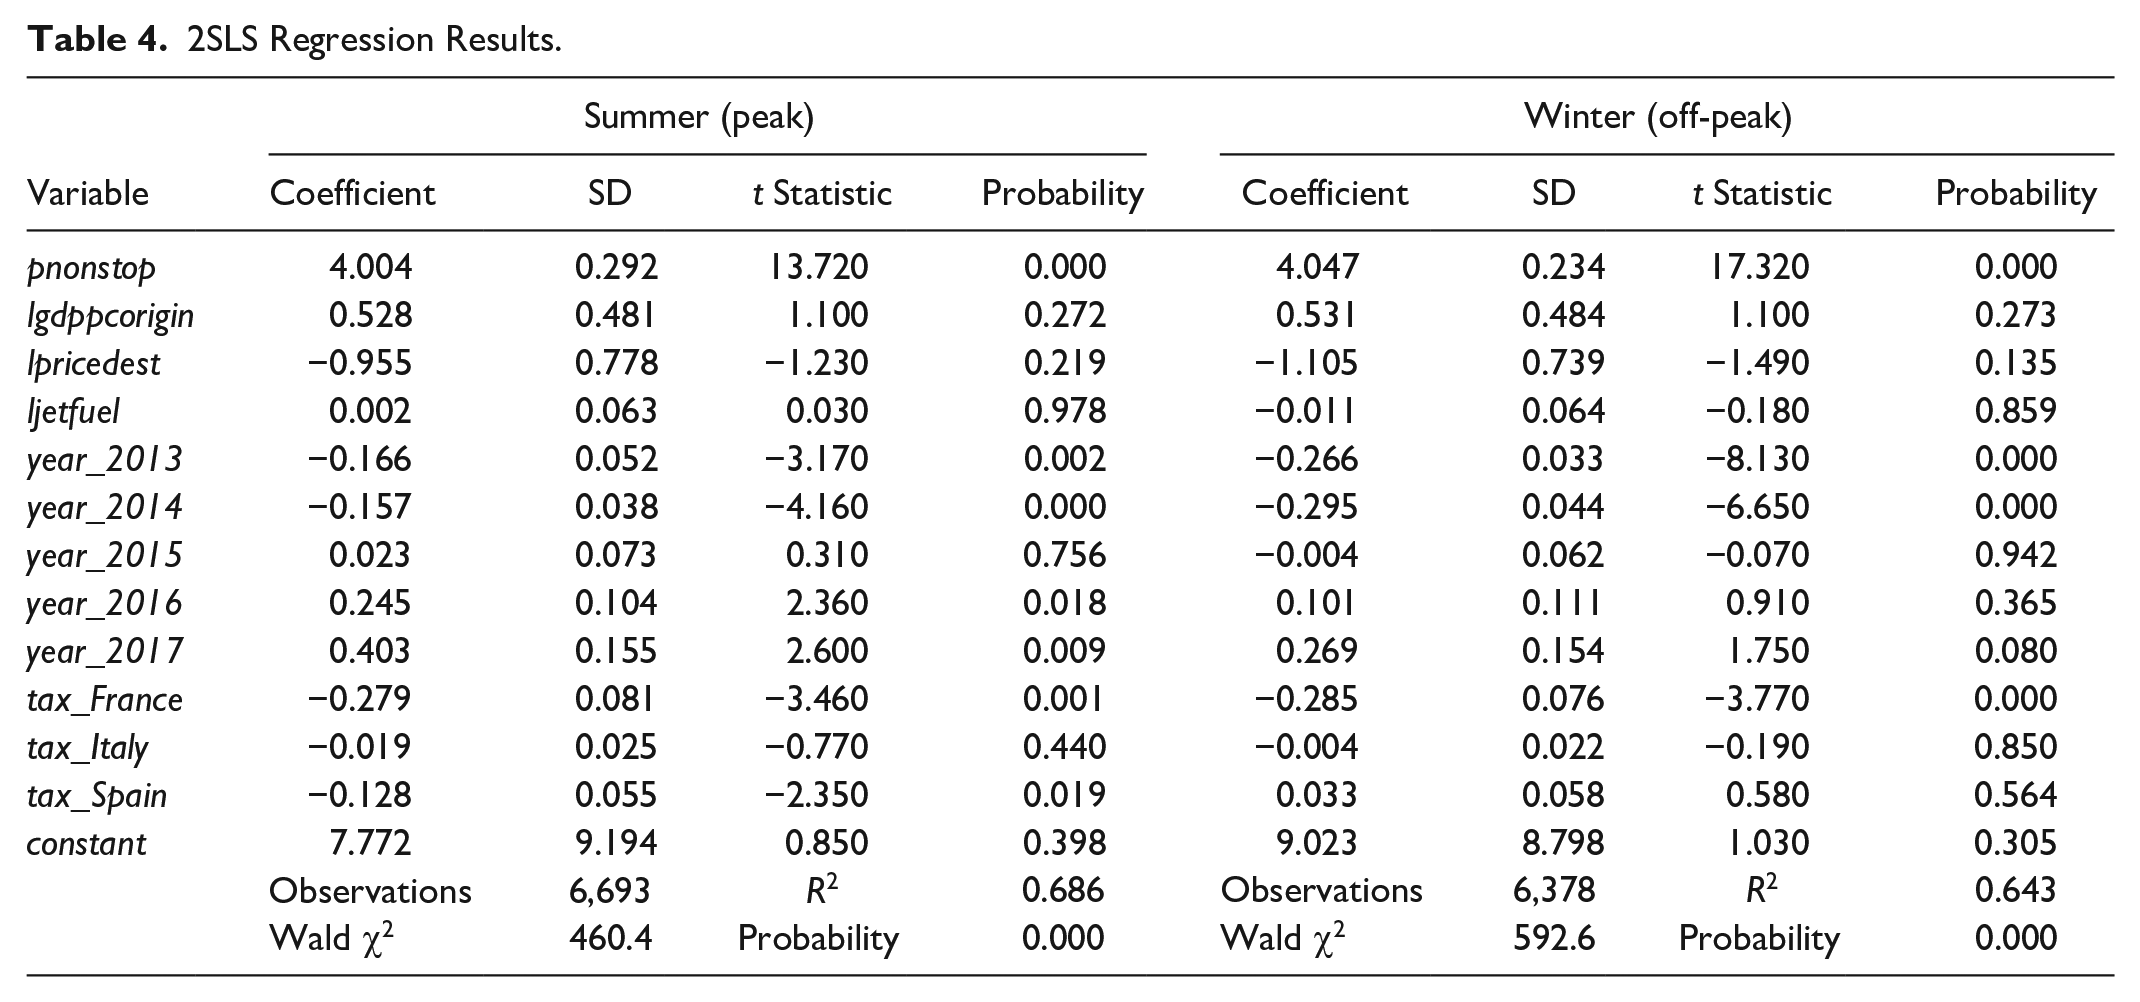
The values of the year dummies are consistent with the main trends shown in Figure 2, where the UK outbound traffic increased, in a counterintuitive way, during 2016 and 2017. We explain these increases to the alarmist views expressed (at the time) by the airline companies (BBC 2016) about the Brexit process taking the United Kingdom out of the EU single market. This can have troubling consequences for major carriers that, at the time, claimed that they would not enjoy the necessary traffic rights to continue their operation of routes between the United Kingdom and the EU. The existence of potential market restrictions in the horizon may have boosted outbound travel demand between the United Kingdom and Spain, France, and Italy, particularly during the peak summer periods.
Regarding the impact of accommodation taxes, our model concludes that during the peak summer period, both French and Spanish cities are, overall, negatively affected (the tax coefficients are significant at the 5% level), while the impact on Italian destinations is not significant. On a per-euro basis (i.e., looking at the log-linear estimated coefficient), the percentage impact is higher in France than in Spain. During the off-peak period, only French destinations present a significant and negative impact on visitor flows. The impact on Spanish destinations is consistent with a reduced differentiation in the tourism product among Spanish cities, most of which target the sun-and-beach segment and, thus, they experience a higher degree of substitutability among them. Italian destinations, which do not have such a strong focus in that type of tourism (note the non-coastal nature of many top destinations), enjoy a higher degree of market power that could make their visitor flows more resilient to a rise in travel costs. In relation to France, we link the significance of the negative impact to the more widespread implementation of taxes, which can make visitors more aware of their existence and end up representing a larger proportion of the visitor’s living costs, particularly if staying in a relatively small city with lower overall prices.
Table 5 reports the negative tax elasticities estimated for the sample destinations with more than 10,000 summer arrivals in 2017. Since the specification was log-linear in taxes, the elasticities are determined by multiplying the estimated coefficient by their 2017 peak tax value. Despite the results from the country-level specification, most city-level elasticities are not significant at the 5% level. In France, Nice and Lyon are the most important destinations where accommodation taxes have a negative and significant impact on visitor flows. In Italy and Spain, we only found a significant tax elasticity in Naples and Girona, respectively. In all these four cases, visitors are tax-inelastic. The negative impact of accommodation taxes on economy-class UK arrivals to Naples and Girona can be clearly linked to the low-cost nature of the airlines that dominate the airports (Ryanair and Easyjet), which links well with a profile of visitor that is highly sensitive to travel and living costs.
Estimated Tax Elasticities for Major Destinations (Summer 2017).
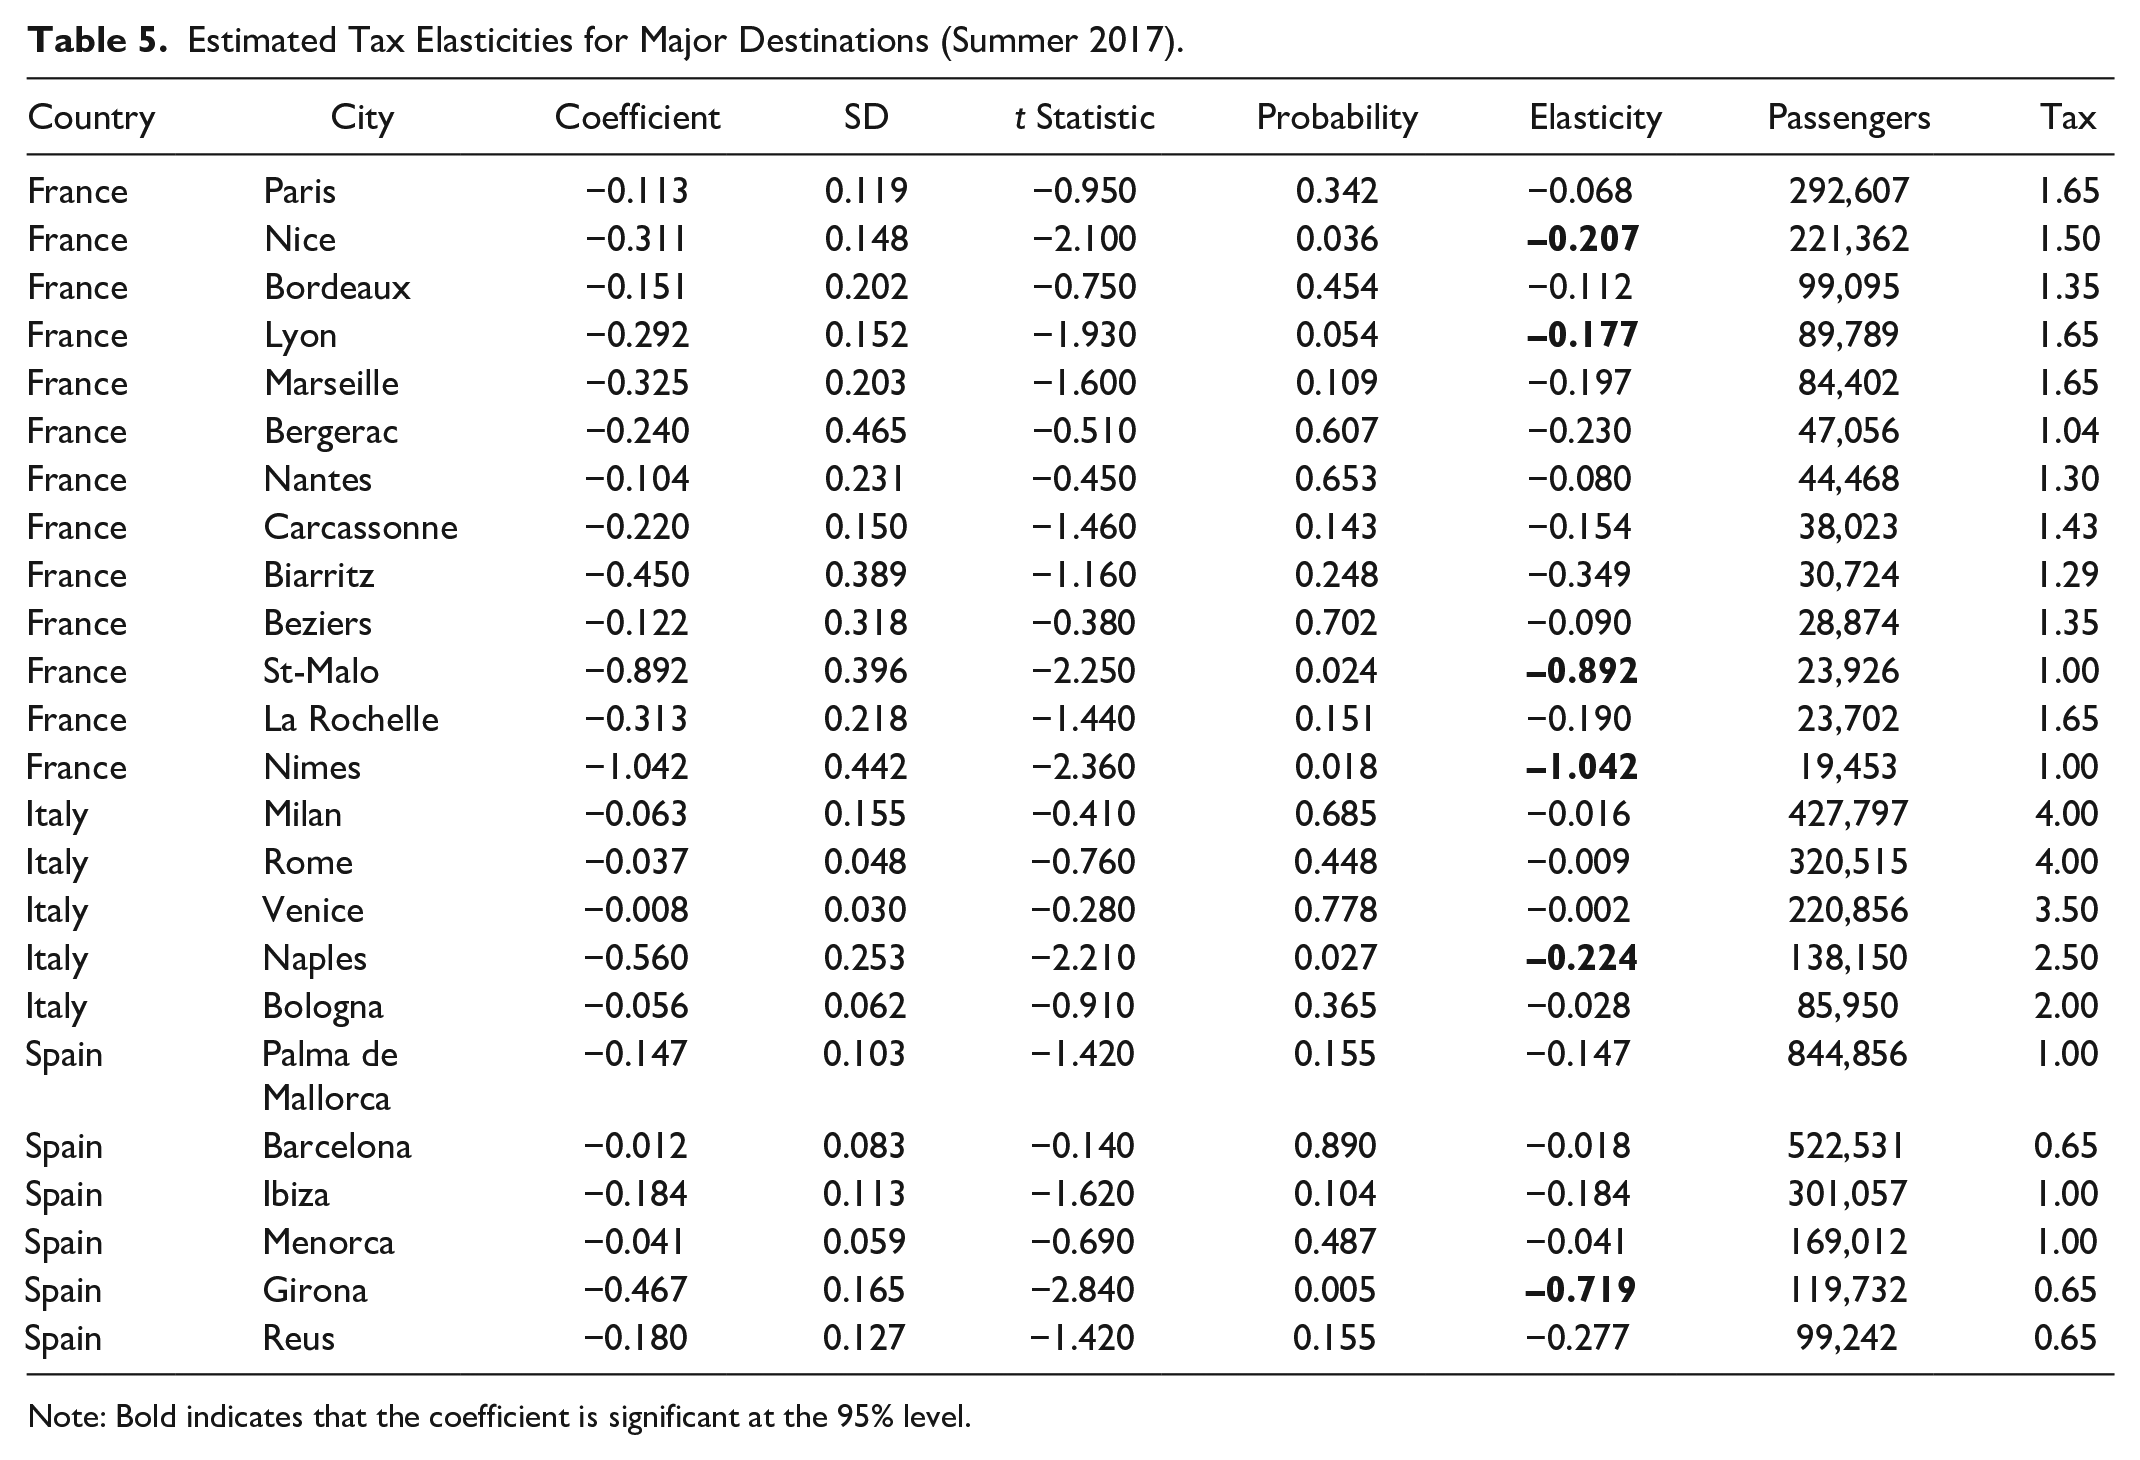
Note: Bold indicates that the coefficient is significant at the 95% level.
Nevertheless, the numbers of UK arrivals to the largest taxed destinations in each country (Paris, Milan, or Palma de Mallorca) do not seem to be significantly affected by the taxes. This agrees with the point made by Sheng and Tsui (2009) about the impact of taxes on tourism being dependent on market power. Like the argument above, popular destinations with loyal visitors can be expected to experience a less than proportional reduction in visitor flows when taxes increase. An alternative explanation from the theory of consumer demand could be that city taxes will represent a lower proportion of the visitors’ trip budget when traveling to popular destinations, if indeed those budgets are higher than for secondary destinations. That reduces price sensitivity for smaller travel expenses.
Our results are particularly relevant for the city of Venice, which, for Summer 2017, has the smallest estimated tax elasticity in the sample (–0.002), and, furthermore, it is far from being statistically significant. Therefore, tourist taxes are a very effective way to generate income for the city, which can be reinvested in preservation initiatives. However, at their current level, they are not a strong instrument to rationalize demand, which is the declared objective of local authorities. In accordance with that goal, the further increases in accommodation taxes that have been implemented since 2017 can be justified to effectively reduce the tourism pressure in Venice, particularly if they are raised to a level in which they represent a significant proportion of the tourists’ living costs during their stay in the city, so visitors become more tax elastic.
It is also worth highlighting the lack of a significant tax elasticity in the largest taxed cities in the Mediterranean coast: Barcelona and Palma de Mallorca. The nonsignificant impact of city taxes in the Balearic Islands is in direct disagreement with the results from Aguiló, Riera, and Rosselló (2005) and Rosselló and Sansó (2017). However, we defend our conclusion since we have more recent data than past studies, in combination with the conclusion from Falk and Hagsten (2019) that identified a sharp decrease in tax elasticity of demand between the first and second year of implementation. Indeed, after several years, visitors to the Balearics can become accustomed to these taxes, to the point in which their impact on demand is negligible. The same applies to Barcelona, which is also facing problems with an “excessive” level of tourism activity (according to local officials) that results in noise and waste disposal problems, as well as episodes of violence against visitor groups. One cannot forget the process of gentrification, as long-term residents are pushed away from city-center areas where short-term tourist rentals are more lucrative for landlords. In this context, tourism taxes may be ineffective to rationalize demand because of the boom of unregulated supply of tourism accommodation in recent years (Font-Garolera, Colom-Oliva, and Ribera 2018), which defeats the purpose of accommodation taxes in the first place. More stringent controls, including regular inspections of city-center properties, as well as strong fines to non-compliant properties, need to be implemented by the City Council.
Summary
This article aims to contribute to the literature about the effects of tourism taxation by studying the impact of accommodation taxes on outbound travel demand in the United Kingdom. To that end, we estimate two demand function specifications (for peak and off-peak travel) using a data set of UK airline travelers to Spanish, French, and Italian destinations between 2012 and 2018.
The results from the 2SLS regressions indicate that UK international travelers are more price-elastic in off-peak periods but still they remain relatively close to unitary elasticity. Regarding the impact of accommodation taxes, visitor flows to both France and Spain are negatively affected during peak summer periods, yet only French destinations are negatively affected during the winter. We link this result to a more widespread implementation of accommodation taxes all over the country in combination with lower living costs at smaller destinations in France. Despite a much more restricted implementation, the sensitivity of UK visitor flows to Spanish destinations is consistent with a reduced level of differentiation in the tourism product among Spanish cities, most of which target primarily the sun-and-beach segment and, thus, they experience a higher degree of substitutability with nontaxed destinations. Italian destinations, many of which do not have a such a strong focus in sun-and-beach tourism, clearly enjoy a higher degree of market power that makes their visitor flows more resilient to accommodation taxes. The argument of tax sensitivity due to substitutability between destinations in the same country relates to a key aspect of tourism taxation, which is the scope of implementation. Indeed, if tourism taxes are set at a municipal level, then the local authorities must take into consideration the competition from untaxed destinations in the area, particularly if the focus is on massive sun-and-beach tourism, rather than cultural tourism. If taxes are set at a national level, the different tax elasticities between primary and secondary cities as well as the elasticity gap between peak and off-peak travel justify further differentiation in accommodation tax schemes, which can vary according to the category of the city and the period of the year.
The analysis of tax elasticities at a destination level also reveals the lack of a significant effect in major cities, such as Venice, which is at odds with the local authorities’ declared objective to rationalize demand. Visitors to Venice are found to be tax-inelastic, which we link to the great degree of market power, uniqueness, and visitor loyalty to the destination. Thus, the increases in accommodation taxes that have been implemented since 2017 are justified to keep generating revenues that can be used for the preservation of the city. The lack of a significant impact of tourist taxes in the city of Barcelona suggests that (1) visitors have become accustomed to paying these surcharges and (2) the boom of unregulated tourism supply in recent years may defeat the purpose of accommodation taxes in the first place. More stringent controls, including strong fines, need to be implemented by the City Council.
The conclusions of this article, however, must be taken with caution, as our data and method present some limitations. First, the limited time-series dimension of our data set, which does not cover preimplementation periods, coupled with the little variability of taxes over time can be a shortcoming. By sacrificing point-of-origin information, our airline data (that combine both leisure and business travel) could have been replaced by tourist/visitor data from local statistical offices. This is a more specific dependent variable for the effect we aim to measure, though not as readily available for the scope of analysis presented here. Finally, our data set only covers scheduled travel but not charter flights, which traditionally serve passengers with packaged holidays and are very popular in the United Kingdom. The sensitivity of these travelers to accommodation taxes may be different because of the lack of information about the different cost elements in the trip. Future research can address these issues as the required data become available. Applications of this method to other origin and destination markets would also be interesting to expand the body of literature on the effect of accommodation taxes on travel demand.
Footnotes
Declaration of Conflicting Interests
The author(s) declared no potential conflicts of interest with respect to the research, authorship, and/or publication of this article.
Funding
The author(s) received no financial support for the research, authorship, and/or publication of this article.