
Abstract
The No Surprises Act (NSA), implemented in 2022, has protected patients nationally from surprise medical bills in most settings. However, out-of-network care resulting in arbitration between insurers and providers under the NSA may result in very high costs for this care. The objective of this paper is to characterize payments for out-of-network care resulting from disputes that underwent arbitration under the NSA and compare the settlement amounts to in-network prices. Using 2023 dispute and claims data from Elevance Health (EH), we described insurer and provider bids, and compared the final settlement amounts to the qualifying payment amount (QPA) – which is used in arbitration and is intended to represent average in-network market rates – and to in-network prices for similar procedures. Lastly, we compared settlement amounts to Medicare rates. 7076 disputes between EH and providers with arbitration under the NSA were analyzed, eighty percent of which were won by providers. Median (mean) final arbitration amounts were 3.72 (4.99) times the QPA, 2.04 (3.23) times actual median local in-network commercial rates, and 4.5 (5.8) times Medicare rates for the same services. This analysis shows that settlement amounts were substantially higher than QPA and median in-network prices, indicating that out-of-network providers are receiving substantially higher payments than in-network providers when they go through arbitration under the NSA. This contrasts with the Congressional Budget Office’s prediction of savings through arbitration settlements close to average in-network prices.
● This study compares final settlements for disputes that underwent arbitration under the No Surprises Act (NSA) in 2023 to three benchmarks: qualifying payment amount (QPA), in-network prices from the same insurer, and Medicare rates.
● Not only were settlements higher than QPA and Medicare prices, but they were several times higher than in-network prices for the same services.
● Before the NSA passed, the Congressional Budget Office predicted that arbitration outcomes would be close to in-network rates, which would lead to a decrease in overall healthcare costs. While the NSA protects patients from surprise medical bills, the final arbitration amounts are high relative to accepted in-network payment rates for similar procedures.
Introduction
The No Surprises Act (NSA), implemented in 2022, protects patients nationally from surprise medical bills (out-of-network [OON] bills for care that patients could not anticipate or prevent) in most settings by requiring their insurer and provider to negotiate payment for the OON care. 1 When an agreement cannot be reached, the case may be brought to arbitration. The arbiter chooses either the provider’s or the insurer’s bid as the final settlement amount (ie, “baseball-style arbitration”), similar to how surprise bill payment amounts are resolved under some state surprise billing laws, including New York, New Jersey, and Texas.2 -5 The Department of Health and Human Services estimated in 2021 that approximately 17 000 disputes would be brought to the federal dispute resolution process each year, 6 however, close to 1 million disputes were initiated in the first 5 months of 2025. 7
Original federal regulations instructed arbiters to presume the qualifying payment amount (QPA), which reflects the median in-network market contracted rate, is likely close to the appropriate OON payment, though this requirement was struck down in court. 8 Unlike arbitration under some state systems, the NSA bars arbiters from using information on billed charges or Medicare or other public payer reimbursement rates as benchmarks. In addition to the QPA, factors specific to the case such as the training, experience, and market share of the provider, and patient acuity and complexity may be considered by the arbiter. 9
Previous research using data from the Centers for Medicare and Medicaid Services (CMS) has shown that providers have won 85% of disputes as of 2024, 10 and final settlements from arbitration have far exceeded QPAs; a study with data from 2023 demonstrated a median settlement of 2.7 times the QPA, 11 and most recently, analyses have shown that in 2024, settlements were approximately 4 or more times the QPA.10,12 Work by Fiedler and Adler also provided an estimate comparing outcomes to published in-network rates, suggesting similar ratios (2.6 to 3.0). 13 Nevertheless, some have argued that the algorithm for calculating QPA results in estimates lower than the true average of in-network provider rates, making the QPA benchmark too low,11,13 necessitating a study comparing final settlements to historical in-network rates. Using data from Elevance Health (EH), a large national insurer, our study describes the characteristics and arbitration outcomes of OON claims that were decided by arbitration under the NSA, comparing settlement amounts to QPA, in-network, and Medicare prices for similar services.
Methods
Data Sources and Study Population
Our analysis consisted of emergency and non-emergency care disputes from EH in 2023. We matched the dispute data to the associated claims (based on a claim identifier) to identify the 3-digit ZIP code, and then matched the dispute to all 2023 (January-December) in-network commercial claims with the same CPT code(s), 3-digit ZIP code, and facility/professional claim type to compare the disputed services to in-network claims for the same procedures in the same geography. Finally, we matched the CPT code(s) and ZIP code from the disputes to the 2023 Medicare Fee for Service (FFS) payment rates provided by CMS. 14
We excluded disputes where information necessary for the analysis, such as at least 1 CPT or ZIP code, was missing or invalid. Since claims are submitted for arbitration together under a dispute, we also excluded disputes where the settlement amount differed across claims or was missing or the arbiter decision in the data varied because we were not able to determine the final outcome of the dispute. We also excluded disputes with ZIP code/CPT code combinations where we could not identify sufficient in-network claims as a comparison. For the Medicare analyses, we excluded some disputes where the match to FFS Medicare data by CPT code(s), ZIP code, and claim type was not possible.
Analysis
Our analysis was conducted at the dispute level, aggregating payment for all claims in the same dispute. In some cases, multiple claims/claim lines with the same CPT code were bundled together, and in other cases, distinct CPT codes may be part of one dispute. We described the dispute winner and how the arbitration settlement amounts compared to the QPA, to the mean and median allowed amounts (final provider payments) of the matched in-network claims, and to Medicare payments for the same service(s). In the calculation of the median and mean allowed in-network amounts, each relevant claim line was counted once, so high-volume providers with more disputes were counted more times than low-volume providers. Of note is that the QPA provides a different ratio than a claims-weighted median in-network ratio because QPA is a median non-claims weighted rate calculated in the same geographic market. All ratios were Winsorized at the 1/99% level to mitigate the influence of outliers on means in our main results, and we also provide non-Winsorized results in the appendix.
Principal Findings
Dispute Sample
The original EH dataset included 9956 disputes. We excluded the following: 906 disputes where at least 1 CPT code within the dispute or the ZIP code on the matched claim was missing or invalid; 1818 disputes where the total settlement amount differed across claims within a dispute or was missing, or where the arbiter decision varied across lines in the dispute; and 156 disputes with ZIP code/CPT code combinations where we could not identify sufficient in-network claims as a comparison. This left us with 7076 disputes for our main analyses. Of these, we were able to identify Medicare FFS prices for 6588 disputes.
Dispute Characteristics
Each dispute had an average of 1.25 claims. Only 2.3% of disputes involved facility claims (ie, 97.7% were from professional claims only). Emergency department care comprised most disputes, making up 88.4% of the services, followed by surgery (3.7%) and imaging and lab tests (3.4%). There were 146 unique billing providers (Tax IDs) in the 7076 disputes. The top 6 providers represented more than half of the disputes and appeared to be emergency physician groups or staffing companies.
Providers won 5671 (80.1%) disputes. The median and mean settlement awards were $564 and $1333, respectively. Table 1 provides additional detail on non-Winsorized mean offers, QPA, in-network commercial costs, and settlements for the most common service types; Supplemental eTable 1 provides the same information but with other statistics about the distribution (ie, medians, interquartile range, and 90th percentile).
Dispute Cost Characteristics, Total and by Common Service Type.

Note. Mean costs are not Winsorized.
HOPD = hospital outpatient department; QPA = qualifying payment amount.
Data from 2023 for in-network claims in the same 3-digit ZIP code for the same CPT code and the same claim type (professional or facility).
Settlements Compared to QPA, In-Network Prices, and Medicare Prices
Providers offered a median (mean) of 4.11 (6.95) times the QPA. This ratio was slightly higher for disputes won by insurers – 4.86 (8.25) – indicating that more extreme bids were slightly less likely to be chosen by the arbiter. Overall, settlements were substantially higher than the QPA, with a median (mean) of 3.72 (4.99) times the QPA (see full distribution in Figure 1). These ratios in EH disputes are higher than our own calculation of a median of 2.9 when using CMS public data for all insurers (Supplemental eFigure 1), which is consistent with other literature using CMS data. 11

Ratio of the settlement amount to QPA, by winner.
Relative to median 2023 in-network rates in the same 3-digit ZIP code, the median (mean) settlement was 2.04 (3.23) times higher (see Figure 2, and the comparison to mean in-network rates in Supplemental eFigure 2). When providers won, the settlements were a median (mean) of 2.45 (3.82) times in-network medians, while when insurers won, the settlements were 0.73 (0.85) times in-network medians. Altogether, 16.4% of disputes had a final settlement lower than the median in-network rate.
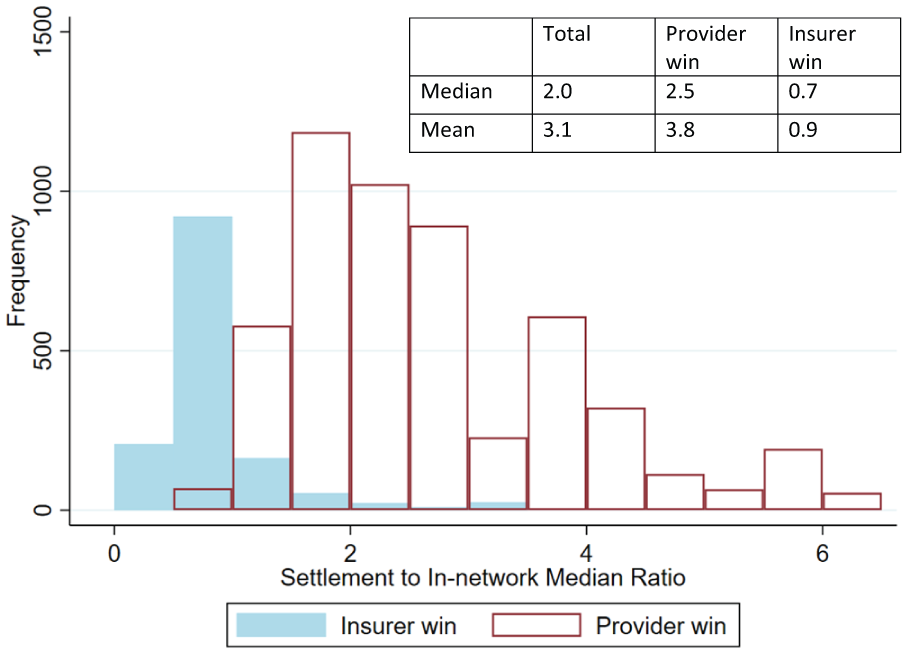
Ratio of the settlement amount to median local in-network rates, by winner.
Overall, settlements were substantially higher than the Medicare rate, with a median (mean) of 4.46 (5.79) times the Medicare rate (see full distribution in Figure 3). Providers offered a median (mean) of 4.47 (6.72) times the Medicare rate. The median ratio was lower for disputes won by the insurer – 1.47 (2.05) – though bids by the insurer still generally exceeded payment rates from the Medicare program.

Ratio of the settlement amount to Medicare rates, by winner.
Non-Winsorized summary statistics of these 3 main outcomes, stratified by provider versus insurer wins, are provided in Supplemental eTable 2. The results are similar to the Winsorized results, with slightly higher means (as expected). Furthermore, additional calculated ratios of the provider offer to QPA, provider offer to in-network median, provider offer to Medicare, QPA to Medicare, and QPA to in-network median are provided in Supplemental eTable 3. These ratios show that the median QPA is approximately 30% lower than the in-network median rates but somewhat higher than Medicare rates.
Heterogeneity
We also explored heterogeneity of outcomes by the most common CPT codes, state, and service type; see summarized findings in Supplemental eTables 4-6. Emergency department CPT codes 99283, 99284, and 99285 accounted for at least 1 claim line in 86% of all disputes. While ratios were similar to the main results across these 3 codes, disputes for other CPT codes had substantially higher ratios – particularly when comparing means – of the settlement to the QPA, median in-network prices, and Medicare prices (Supplemental eTable 4). The analysis by state shows some variation, with New York and California in particular having higher ratios than other states (Supplemental eTable 5). Finally, we observed variation by service type, with imaging and lab, surgery, and other services tending to have higher ratios of settlements to the 3 benchmarks than emergency room and anesthesia services (Supplemental eTable 6). Approximately half of the “other” services came from assistant surgeons, who had substantially higher fees and awards (data not shown).
Finally, we analyzed the data of the 10 most common billing providers, who represented 4407 (62.3%) of the disputes. They all provided emergency department services, in contrast to 70% of the other providers. These providers won the disputes more often – 82.1% of disputes compared with 76.9% of other providers. However, their offers and settlements were of lower dollar value, and the ratio of their settlements to the QPA (median 3.62, mean 3.67) and median in-network prices (median 2.03, mean 2.33) were lower than other providers (QPA median 3.83, mean 9.78; and in-network median 2.18, mean 5.97; see Supplemental eTable 7).
Discussion
In this sample of EH dispute data, arbiters predominantly decided in favor of providers, with settlement amounts multiple times the QPA, actual median and mean local in-network amounts, and Medicare prices. The ratio of the settlement to the QPA was somewhat higher than the ratio of the settlement to in-network amounts, indicating that the QPAs tend to be lower than the actual recent in-network payments to providers in the same ZIP code, when weighted by volume (ie, each claim counted once rather than each negotiated provider rate being counted once). Nevertheless, through the NSA arbitration process, the insurer paid OON providers substantially higher rates – on average 2 or 3 times higher – than in-network peers (and on average 4-6 times higher than Medicare rates). Furthermore, based on a review of published literature, the Congressional Budget Office (CBO) and a report by RAND have estimated that commercial insurers’ prices among a wide variety of services are approximately between 129% and 184% of Medicare FFS prices for physician services and 223% to 254% of Medicare FFS prices for hospital services.15,16 The payments resulting from these arbitration cases far exceed those ratios.
These results are consistent with other recent analyses that suggest that providers receive significantly higher payments through the NSA arbitration process than their in-network counterparts. As noted previously, studies of CMS data calculated settlements having a median of 2.7 times the QPA in 2023 11 and over 4 times the QPA in 2024.10,12 Furthermore, the Fielder and Adler (2024) analysis showed that the median settlement amount was at least 3.7 times the Medicare payment amount – which is slightly lower than what we found – and at least 50% higher than the top range estimates of past in-network commercial prices. 14 Our findings are new in that they link disputes to actual concurrent in-network payments by the same insurer for the same procedure in the same location across all emergency and non-emergency dispute types. This analysis shows an even larger discrepancy between settlement amounts and in-network prices for the same procedures. Our findings, together with these other recent studies, demonstrate that arbitration under the NSA is at odds with the CBO’s expectations of settlements being approximately in-network rates 17 and with Congress’ intention to increase affordability, as dispute payments are substantially higher than in-network payments.
While the findings show that settlements are multiple times higher than the QPA and median and mean in-network rates, higher ratios of provider bids relative to QPA are to be expected; providers would not have an incentive to enter the arbitration process if they were asking for the QPA or perhaps even the in-network rate, as the initial out-of-network payment – or at least an offer during negotiation prior to arbitration – is typically approximately the QPA. Existing cost barriers for providers to enter the arbitration process limits arbitration to cases where providers expect substantially higher payment than what they originally received from the insurer for the out-of-network care.18,19 Most providers accept the insurer’s initial payment, and an analysis of national data showed that less than 7% of eligible out-of-network claims went to arbitration in the first 3 quarters of 2023. 20 On the other hand, the majority of disputes are brought by a small number of ER physician firms, which prior literature shows are often backed by private equity; for these providers who have more administrative resources and capacity to absorb arbitration fees, bringing large volumes of cases to arbitration may just be a strategy for higher payment for them.10 -12
While the percentage of providers bringing cases to arbitration is relatively small compared to all eligible out-of-network claims nationwide, it has grown exponentially in the past couple of years, from 288 810 disputes in the first 6 months of 2023 to 980 681 disputes in the first 5 months of 2025. 7 It is possible that the favorable results for providers in the arbitration cases – both high win rates and high settlement amounts – are encouraging more providers to enter disputes. Furthermore, it is to be seen if providers’ successes in the arbitration process may incentivize more providers to leave networks to receive higher payment through arbitration under the NSA.
Limitations
The study sample uses 2023 data, and outcomes from arbitration are constantly evolving. Furthermore, the sample size is small compared to the number of cases that have undergone arbitration to date; between June 2024 and May 2025, more than 146 000 disputes with EH alone were submitted. Additionally, EH data represent less than one quarter of all disputes nationally and may not reflect dispute outcomes across payers, particularly as the EH sample appears to have a larger average difference between settlements and QPAs than national data during the timeframe that was studied; this may decrease external validity. The QPA is calculated on 2019 rates and inflated to 2023, complicating a comparison between QPA and in-network rates as medical inflation may have varied by procedure. Finally, this analysis describes the outcomes of arbitration under the NSA, but does not assess the overall impact of the NSA on out-of-network or total costs.
Conclusion
Before the NSA passed, the CBO predicted that arbitration outcomes would be close to in-network rates, which would lead to a decrease in overall healthcare costs. 17 With the de-emphasis on QPA in arbitration under the NSA, awards are substantially higher than what in-network providers receive for the same services. While the NSA protects patients from surprise medical bills, the final arbitration amounts are high relative to accepted in-network payment rates for similar procedures in negotiated contracts between insurers and providers. Future research should investigate if the current decision structure may encourage additional providers to submit claims through the NSA dispute process – the volume of which is already much higher than originally anticipated – or even leave networks to increase payment. Such implications can likely result in eventual increases in healthcare spending.
Supplemental Material
sj-docx-2-inq-10.1177_00469580251401475 – Supplemental material for “Arbitration Outcomes for Out-of-Network Medical Bills Under the No Surprises Act”
Supplemental material, sj-docx-2-inq-10.1177_00469580251401475 for “Arbitration Outcomes for Out-of-Network Medical Bills Under the No Surprises Act” by Benjamin Ukert and Aliza S. Gordon in INQUIRY: The Journal of Health Care Organization, Provision, and Financing
Supplemental Material
sj-xlsx-1-inq-10.1177_00469580251401475 – Supplemental material for “Arbitration Outcomes for Out-of-Network Medical Bills Under the No Surprises Act”
Supplemental material, sj-xlsx-1-inq-10.1177_00469580251401475 for “Arbitration Outcomes for Out-of-Network Medical Bills Under the No Surprises Act” by Benjamin Ukert and Aliza S. Gordon in INQUIRY: The Journal of Health Care Organization, Provision, and Financing
Footnotes
Acknowledgements
The authors would like to thank Tanya Kayani, who previously worked at Elevance Health, for organizing and providing the Elevance Health arbitration data to us. The authors would also like to thank Jennifer Kowalski for her insightful feedback.
Ethical Considerations
Not applicable, as no patient/member data were included in this analysis.
Consent to Participate
Not applicable, as no patient/member data were included in this analysis.
Author Contributions
Both authors contributed to the conception and design. BU cleaned the data and both authors performed data analysis and interpreted the data. Both authors drafted the manuscript and read and approved the final manuscript.
Funding
The authors received no financial support for the research, authorship, and/or publication of this article.
Declaration of Conflicting Interests
The authors declared the following potential conflicts of interest with respect to the research, authorship, and/or publication of this article: ASG is employed by Elevance Health, Inc, and BU was at the time of some of the analysis and manuscript drafting affiliated with Elevance Health, Inc. Authors conducted this study as part of employment duties and did not receive any additional funding for the work. ASG holds Elevance Health stock.
Data Availability Statement
The Elevance Health arbitration data are private and cannot be shared. Other data sources (CMS arbitration data, Medicare prices) are publicly available.
Supplemental Material
Supplemental material for this article is available online.
References
Supplementary Material
Please find the following supplemental material available below.
For Open Access articles published under a Creative Commons License, all supplemental material carries the same license as the article it is associated with.
For non-Open Access articles published, all supplemental material carries a non-exclusive license, and permission requests for re-use of supplemental material or any part of supplemental material shall be sent directly to the copyright owner as specified in the copyright notice associated with the article.