
Abstract
Community violence intervention street outreach (CVI-SO) strategies are growing in popularity as non-punitive approaches to solving the public health problem of community gun violence. Evidence on the effectiveness of CVI-SO on rates of violence is mixed and faces challenges due to concerns with documentation and data privacy, intentional selection bias in program design, and variation in participant risk and needs. Effective evaluation requires methods that accurately capture the scope and delivery of services, starting with a greater understanding of the services CVI participants receive and how they vary based on individual characteristics. This study explores the services that participants received from a coalition of Chicago CVI organizations from 2017 to 2023. Considering administrative and programmatic data from over 4000 participants’ nearly 200 000 interactions with providers, we examine patterns in demographics, network-based risk factors, and service provision and dosage. We then use descriptive and latent profile analyses to characterize the “typical” participant in Chicago. Results show that CVI work relies heavily on long-term mentoring relationships. Service patterns show that latent groups exist with varying dosage: higher dosage participants with higher risk for gun violence receive more frequent contacts over longer periods, demonstrating how organizations adjust their approach based on participant needs. Low Dosage, Medium Dosage, and Behavioral Services profiles also emerge. Findings underscore the need for evaluation frameworks that capture both the strategic variation in service delivery and the multiple pathways through which CVI programs influence participant outcomes.
Keywords
Introduction
Community violence intervention (CVI) strategies have risen in prominence in the past decade due to a reconceptualization of gun violence as a public health issue and an active search for non-punitive interventions.1,2 CVIs are community-driven and designed to engage those at highest risk of involvement in gun violence through direct outreach, intervention and prevention, and wraparound services. 3 At the core of many CVI efforts is the practice of street outreach where trusted neighborhood experts use their credibility and lived experience to intervene in conflicts and build peace. Outreach workers aim to reduce gun violence by engaging small networks of high-risk individuals, quelling imminent threats, and connecting participants to life-saving resources and services. 4
Empirical research on CVI programs suggests mixed impact on violence, with some program evaluations demonstrating promising reductions, and others finding limited or no effects.5 -9 Such impact variation across participants and contexts is common in many interventions and CVI street outreach (CVI-SO) is no exception. Accordingly, effective CVI evaluation requires research techniques that accurately capture the scope and delivery of services, aligning methods and metrics with the on-the-ground work. 10 CVI operates at community, group, and individual levels, extending far beyond efforts to quell violent disputes. Outreach workers also navigate variation in participant risk and needs, with some participants requiring daily crisis intervention and other, less active, individuals needing preventive support. This spectrum of involvement demands different service combinations ranging from crisis response to employment assistance, housing, counseling, and education. Outreach workers calibrate both service type and intensity based on individual risk, community context, immediate group dynamics, and participant readiness for change. 11
Quantitative studies of the effectiveness of CVI-SO have struggled to measure such variation in participants and services. Several key challenges arise when attempting to measure the impact of street outreach work. First, CVI organizations rarely employ standardized recruitment criteria. Instead, workers assess risk and “readiness” through their deep community knowledge. 11 Outreach workers can spend months building relationships before a participant formally enrolls in a program, creating a selection bias for participants considered “ready” because they were deemed more likely to “succeed.” This process also generates a measurement gap as the pre-enrollment work goes unrecorded. Second, and relatedly, even after participants are enrolled in programming, many of the services participants receive go unrecorded, either due to challenges with data entry or the informal nature of participant-provider relationships. 11
Third, even after enrollment, imprecise treatment metrics fail to capture the strategic variation in service intensity across participants, failing to account for the possibility of a dosage response among participants of different risk levels or backgrounds. Street outreach participants are often selected because of their acute levels of risk for involvement in gun violence, 10 but no empirical research exists on how service providers vary their approaches to individual participants according to their perceived risk level, perhaps because risk is dynamic and difficult to capture in singular metrics. 12 It is reasonable to test, therefore, how service dosage may be responsive to individuals’ risk for gun violence. Research in adjacent domains shows dosage response, including interventions aimed at reducing recidivism.13 -15 To our knowledge, only one prior study examines individual program dosage in CVI, finding reduced arrest likelihood only among participants completing all program stages. 5 As the field matures, practitioners and researchers are increasingly asking about “critical dosage”— what type and intensity of programming different participants need to reduce violence involvement. Such an understanding would help calibrate CVI responses as well to better understand programmatic impact.
This paper takes a step toward addressing these measurement challenges by analyzing detailed service data among a collaborative of CVI organizations in Chicago, Illinois. Using records of over 4000 participants and 200 000 service interactions from July 2017 to March 2023, we examine patterns in participant characteristics, risk factors, and service delivery. We combine social network analysis to estimate violence risk, qualitative coding to categorize service types, and latent profile analysis to identify distinct participant profiles. Our objective is to examine the types of participants served by CVI programs as well as patterns of program provision and dosage, that is, how service type, intensity, and duration vary across participants and risk levels. This research employs a community-engaged approach, developed and refined through ongoing partnership, ensuring methods align with both social science rigor and community partners' lived experiences.16,17
Methods
Setting and Context
CVI-SO in Chicago grew rapidly after a coordinated effort to expand organizational capacity in the wake of a substantial increase in gun violence in 2016. By March of 2023, CVI-SO organizations had some coverage in 59 out of 77 Chicago community areas, dominated by three primary strategies: READI Chicago, Chicago CRED, and Communities Partnering 4 Peace (CP4P; Figure 1). READI Chicago and Chicago CRED operate structured, phased programming with clear benchmarks and designated services to track progress. Evaluations of both have reported significant reductions in participants’ likelihood of arrest for violent crimes relative to comparisons.5,9 The program models facilitate research design for individual-level impact evaluations, as programming is regimented and participant progress is clearly tracked.
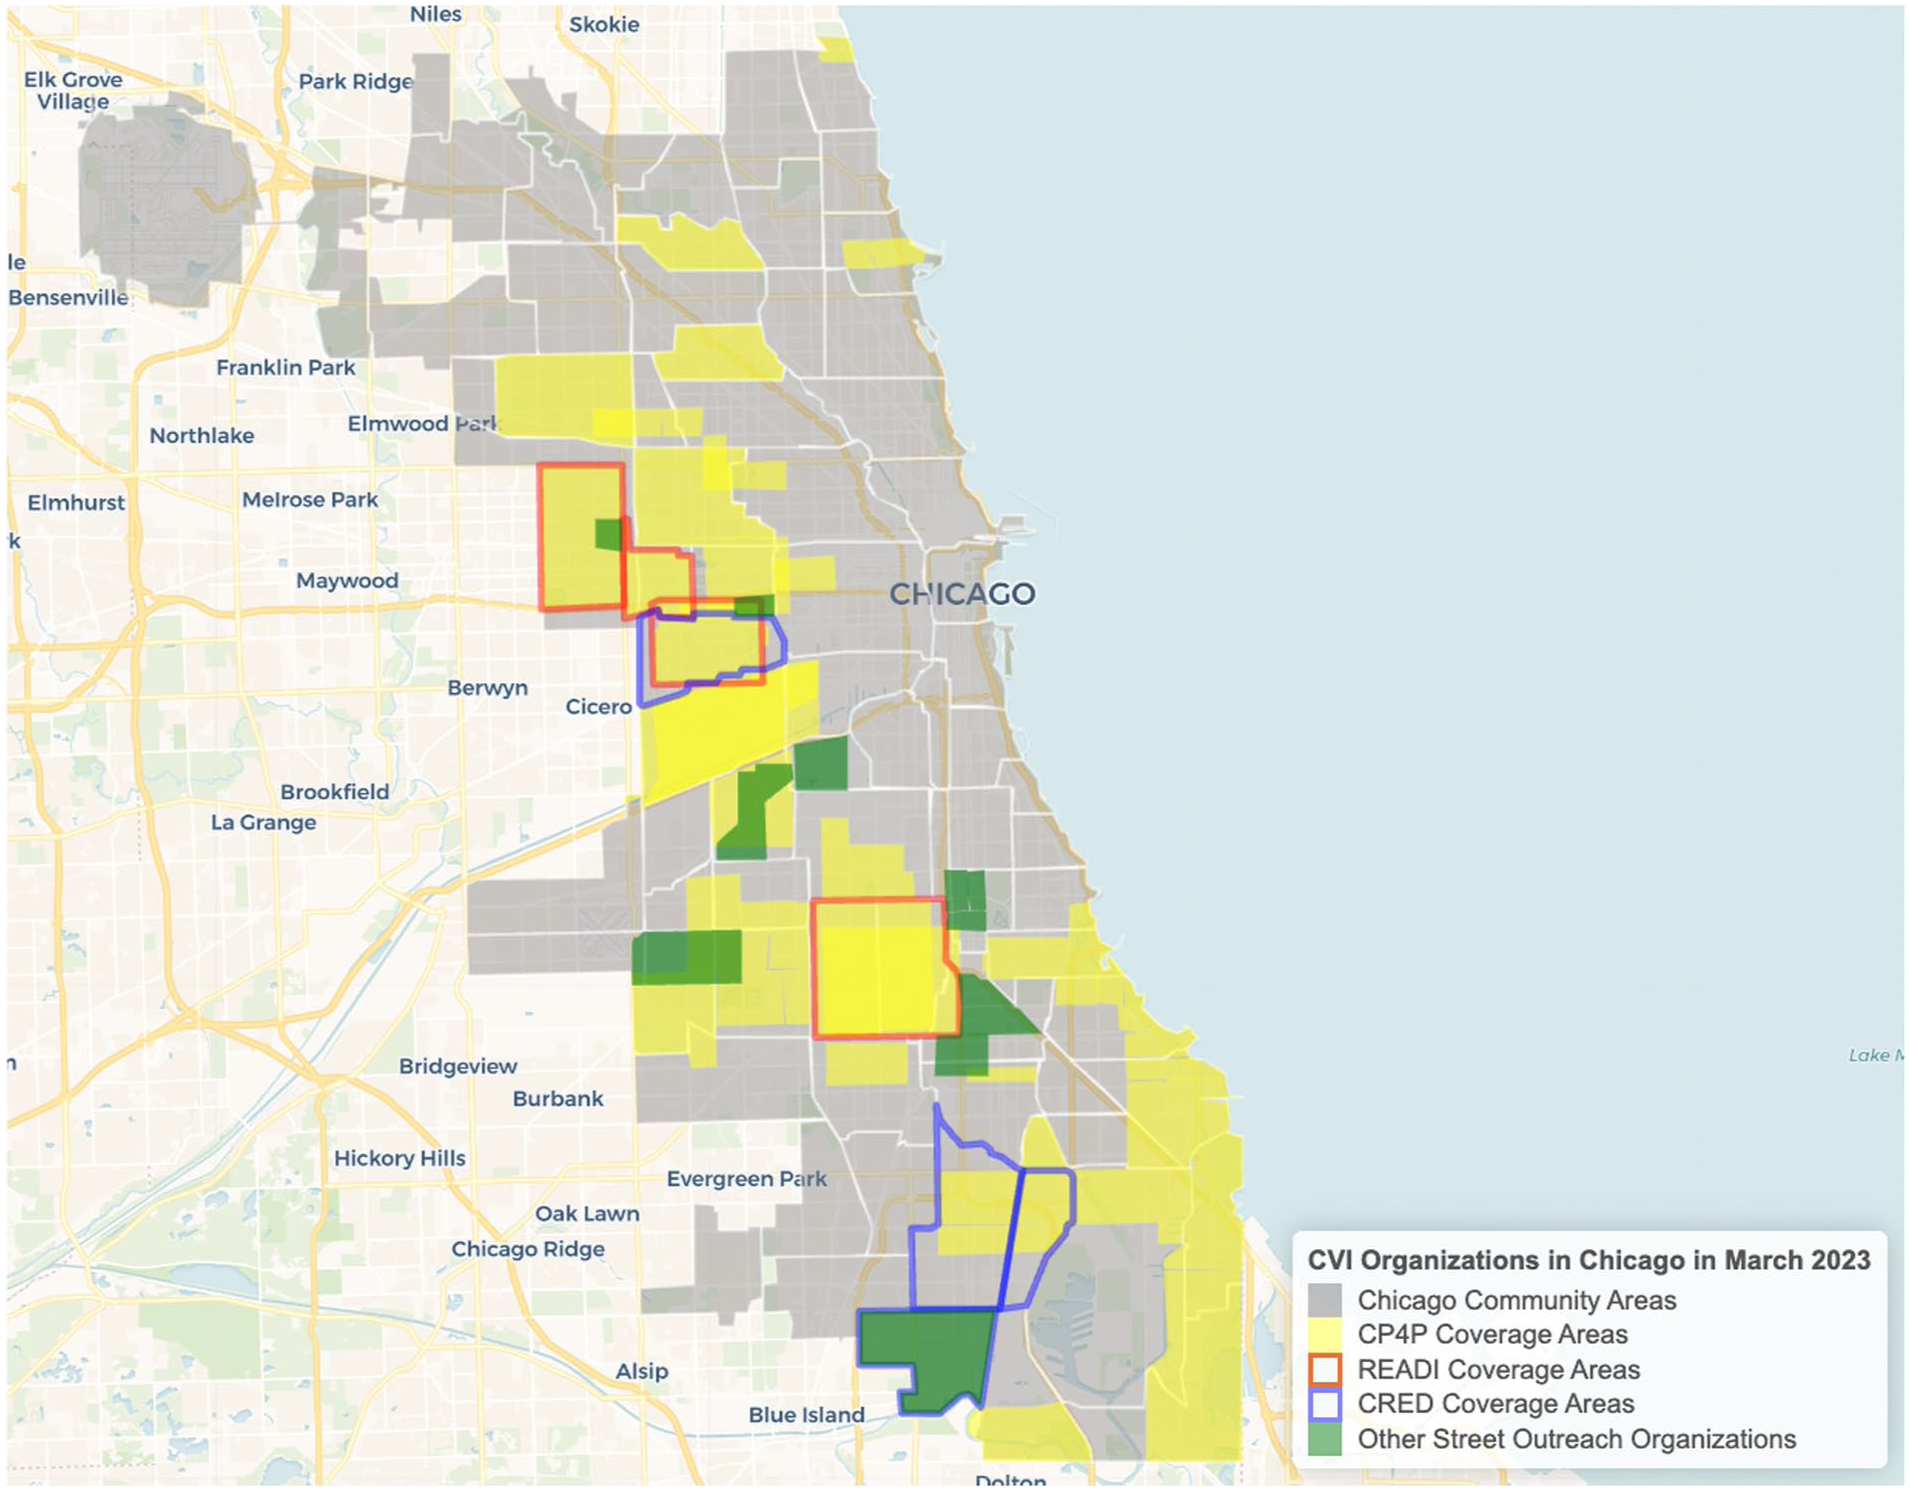
Map of CVI organizations in Chicago in 2023. CVI organizations had coverage in 59 out of Chicago’s 77 community areas by 2023. CP4P coverage areas are highlighted in yellow, with additional CVI strategies’ coverage areas outlined in red, blue, and green.
In contrast, CP4P, the focus of this study, is a CVI collaborative comprised of several different organizations that came together after the 2016 spike in gun violence to coordinate their activities towards a common goal: reducing gun violence among individuals who are most likely to be involved in neighborhood disputes and group conflicts. 18 CP4P’s efforts include mediating street group conflicts, “canvassing” neighborhood streets to build relationships and recruit participants, and supporting victims and their loved ones through the immediate aftermath of shootings. Organizations provide participants with direct services such as legal advocacy, employment support, educational opportunities, and trauma-informed behavioral health counseling. The collaborative expanded from eight organizations in 2017 to 15 organizations in 28 different neighborhoods by 2023. By January of 2023, CP4P had 246 CVI staff employed throughout Chicago.
While the multi-site and multi-organizational nature of CP4P presents challenges for evaluating the impact of services on participants, it offers a unique starting point to better understand the variation in the dosage and types of services participants receive in a more traditional, less structured, CVI-SO program. Participants receive different types of services (from employment and education to recreational activities and mental health support), through a variety of methods (in person, in groups, over the phone, through social media or text messages), for an individualized amount of time (from one contact with an organization through sustained contact over several years). Because the types, amounts, and methods of service delivery vary across organizations and individuals, CP4P participants are difficult to classify for the purposes of individual-level impact evaluation.
Data Matching and Cleaning
Data included 4296 unique participants from ten CP4P organizations who were actively serving participants from July 2017 through March 2023. Because CP4P does not use a centralized data management system for their organizations, our team provided extensive outreach and technical assistance with each organization over the 5 years of the evaluation to improve data completeness and consistency. This was especially important for new or smaller organizations with a less robust data infrastructure. Further, many organizations were hesitant to collect, let alone share, street outreach programmatic data, given capacity constraints and lack of trust due to historical misuse of data against Black and Brown communities. Our team worked to co-create a process by which organizations would retain control of their own data, while safely allowing the collection of individual information.
A quarterly process of data matching—which involves merging separate datasets that lack a common unique identifier by finding patterns among names, birth dates, and other demographic variables—connected participants’ programming data to administrative records provided by the Chicago Police Department (CPD). Records included arrests and shooting victimizations going back to 1999 and were anonymized during matching. Around 55% of participants were matched to records, indicating that just over half were either arrested or victimized in a shooting prior to beginning programming. The successful matching rate varied by organization, with rates as low as 15% up to 77%. Because the matching process relies on government names to match participants to administrative records, the low matching rate is, in part, an artifact of CVI organizations’ ability to safely capture government names, instead favoring street names or nicknames.
After the data matching process, we harmonized demographic variables and combined observations across organizations, resulting in datasets that uniquely identified participants, their demographic data, the services they received, and other programming characteristics. An estimated 2% of all participants were identified in more than one organization, in which case we used their first date of contact with the first organization as their start date and included all contacts with all organizations in which they were enrolled. Other data cleaning steps included removing individuals who only had victim services contacts with no street outreach services and separating out multiple services delivered within one participant contact (see below).
Estimating Baseline Gun Violence Risk
CVI-SOs focus on a subset of a neighborhood’s population—those at highest risk of involvement in gun violence—and rely on their local knowledge to identify and engage potential participants.11,12 CVI organizations rarely employ formal risk assessment tools, instead relying on outreach workers' deep understanding of local dynamics and relationships. Risk, however, is not uniformly distributed among outreach participants. Outreach workers must assess varying risk levels to adjust their responses and service provision. For example, in some instances, outreach workers must respond immediately to a recent shooting to stymie retaliation while in others they work to mediate disputes before they lead to violence.
To quantify variation in participant risk in a way that aligns with outreach practices, we drew on established network science approaches to gun violence. Research shows that individuals within close network proximity to recent gunshot victims face elevated risk of victimization themselves as violence often cascades through social networks.19 -21 Using this insight, we constructed a “high-risk network” by identifying all individuals within two co-arrest or victimization ties (ie, individuals who have been arrested with or in association with the victimization) of recent shooting victims in each community, effectively mapping the population most relevant for outreach services. For this analysis, CP4P participants within high-risk networks before enrolling in programming were considered at elevated baseline risk and more likely to be on the CVI organization’s radar. While this approach cannot capture all dimensions of risk that outreach workers must consider, it provides a measurable indicator of risk variation that reflects the networked nature of gun violence and aligns with the population outreach workers engage.12,22
Defining Service Categories
After each contact with a program participant, street outreach workers and case managers recorded the primary focus of the interaction (eg, mentoring, legal services, job training, etc.) and its method of delivery (eg, in-person, email, phone, virtual, group activity). Documentation protocols differed across organizations, ranging from structured checkboxes and drop-down menus to free-form text descriptions, resulting in variation in interpretability and challenges for systematic analysis. This variation, combined with non-standardized service definitions across organizations, required developing consistent categorization schemes across all ten organizations.
We applied a mixed method approach to determine the common service categories provided across and within organizations. Beginning with an inductive qualitative coding process, we used character string pattern recognition to group 190 000 entries for services provided to street outreach participants into common categories, resulting in 13 categories that grouped together in the data after dropping contacts recorded as “unsuccessful.” Next, 3 coders considered the entries that did not fit cleanly into the identified categories, independently categorizing the entries before conferring to compare and resolve differences. The coders elevated the unresolved entries to the authors, who made final category designations based on consultation with CP4P implementers and knowledge of the programs’ operations. Ultimately, all entries were categorized under 1 of 13 unique contact categories: mentoring, case management, employment, community events, legal, family, education, mental/behavioral/physical health, crisis/conflict resolution, housing, immediate needs, transportation, and unclear. When multiple service categories were included in the same interaction with a participant, the interaction was recorded as one overall contact with one count for each category of service provided.
Next, we examined the category sizes and calculated correlations to assess the prevalence and utility of each variable for our analyses and further focus on only the most common services received across all participants. Given their low prevenance, the transportation, housing, and immediate needs service categories were aggregated into a new “material needs” category. We then calculated the Spearman's rank correlation coefficient for all pairwise combinations of service category variables to determine which variables were significantly correlated and thus could be removed, or potentially modified for, our analyses. 23 Running the pairwise correlations showed only a few high correlations, such as between mental/physical health and crisis/conflict resolution service counts as well as between employment and education service counts. However, each of these variables were deemed too important and kept for our analyses. Descriptions and examples for each final category are provided in the Supplemental Materials in Table S1, and a matrix of correlation values is provided in Figure S1. These final 10 service categories include case management, community events, crisis/conflict resolution, education, employment, family, legal, mental/physical health, material needs, and mentoring.
Calculating Adjusted Tenure
Participants are often hard to reach by traditional systems and will occasionally drop out of contact with organizations, resulting in inconsistent and non-linear engagement with providers. To calculate participant tenure, we subtracted the date of the first recorded contact from the date of the most recently recorded contact. However, many participants had infrequent contacts with service organizations over long periods of time, which biased the total tenure. To calculate the amount of time that participants were actively in contact with partner organizations and receiving services (referred to as “adjusted tenure”), we considered a gap in services as 30 days or more in between recorded contacts (informed by CP4P staff) and subtracted out the total number of gap days from the participant’s overall tenure. For example, if a participant was in contact with a service organization for 200 days, but had 3 gaps of 31, 40, and 50 days in between contacts, that participant’s adjusted tenure would be 79 days.
Latent Profile Analysis
We apply latent profile analysis (LPA) to identify groups of individuals based on similarities in the counts of services they received to gain a more systematic understanding of how CVI services vary among participants. LPA is a “person-centric” clustering approach within mixture modeling and tests whether an observed population can be decomposed into a “mixture” of unobserved but latent sub-populations using continuous data.23 -27 LPA operates within a maximum-likelihood framework that relies on an expectation maximization algorithm to estimate the class probabilities to which individuals are assigned, allowing researchers to examine the classes for their qualitative differences.27,28 LPA may rely on fit indices, such as the Akaike information criterion (AIC) or Bayesian information criterion (BIC), or likelihood tests to determine the most appropriate number of classes to use.23,26 BIC is a particularly popular index for determining model fit as it imposes a higher penalty for more model parameters (ie, penalizes complex models and favors more parsimonious models) and thus avoids overfitting better than AIC. 23
Count data, while continuous in nature, may require special care when used in an LPA. One of the issues that arises with count data is that there can be an abundance of zeros, and it can be unclear whether these zeros are “structural”—meaning they come from a process that would only produce zeros—or “random”— meaning they come from a statistical, often Poisson, process.29 -31 Regardless of their origin, variables with too many zeros are considered “overdispersed” as their variances are greater than their means, making them poor candidates for Poisson modeling. Figure 2 shows that not every CP4P organization offers every service within our categorizations, implying that a data harmonization process across organizations will inherently introduce zero values for some participants (ie, participants will have zero counts that are “structural”). These structural zeros will be difficult to separate from a latent population of CP4P participants that may simply receive fewer services for any number of reasons, despite the services being available by providers (ie, participants may have zero counts at “random”). Because of these important theoretical considerations, we specifically fit our data to a zero-inflated Poisson model, which is a mixture model well-suited for overdispersed count data with structural and random zeros.

Percent of CP4P participants receiving each type pf service by organization. Organizations varied in the amounts and types of services they offer to their participants, resulting in a zero-inflated dataset.
Statements
All data collection was approved under Institutional Review Board STU00221314 (14 November 2018). This paper follows the guidelines outlined in the STROBE checklist of items for cross-sectional studies. 32
Results
Single-Day Participants
In total, 631 participants were in contact with providers for only a single day. About a third of these participants identified as female, 90% identified as Black, and most contacts happened in person, discussing mentoring and employment (see Supplemental Materials for more details on demographics and service profiles for single-day participants). How single-day participants fit into the profile of a “typical” outreach participant is unclear and, while they are present in every organization, they represent a relatively small proportion of participants. Single-day participants may represent an important dimension of outreach work, such as canvassing, participation at community events, or other trust-building or information-gathering interactions with outreach staff. Single-day participants may also represent outreach staff determining participant “seriousness” or “readiness.” Because our data do not allow for further investigation of these individuals, our analyses include only participants that have at least 2 days of tenure.
CP4P Participant Demographics and Services Profile
During the study period, CP4P served 3665 unique participants with at least 2 days of contact. In total, 59.8% identified as Black or African American men, 12.9% as Black or African American women, and 17.5% identified as Hispanic or Latino men. Outreach staff provided 174,478 unique contacts with an average of 2 types of services provided per contact to participants (eg, employment and education services provided in one interaction), delivering 335,858 services. Organizations provided 68,547 in-person contacts with participants, 66,484 remote contacts, and 20,800 group-based contacts. Of note, these data include 2020 and 2021, during which some organizations switched to remote contacts due to the COVID-19 pandemic – remote contacts have decreased since the height of the pandemic. Mentoring was the most common type of service provided, with 3304 of 3665 participants receiving at least one mentoring contact. Organizations varied in the number of services they provided their participants, ranging from 1232 total contacts (about 11.5 per participant) up to 43,801 (about 111 per participant). Employment and case management were the second and third most common (Figure 3). This distribution underscores that CVI work is much more than “violence interruption” and conflict mediation, representing a broader approach to providing services to individuals with the aims of improving public safety. More information on the types of services provided by each organization can be found in the Supplemental Materials (Table S2). There was substantial variation in the completeness of service data, with organizations having as low as no “unclear” entries to having as many as 92% of their entries left blank or unclear. Ensuring data completeness in the CVI-SO context is an area of future research.

Number of CP4P participants receiving at least one contact for each service category (n = 3665). Nearly all CP4P participants received at least one mentoring contact, followed by employment and case management.
Figure 4 displays the per-participant distribution of services received in all 10 categories, with white diamonds representing the mean number of contacts each participant received of each service and black lines representing the median and quartile ranges. On average, CP4P participants received 48 mentoring, 12 employment, 8 case management, and 4 education services during their tenure. Participants were on street outreach caseloads for an average of 240 days (adjusted tenure; min = 2, max = 2047).
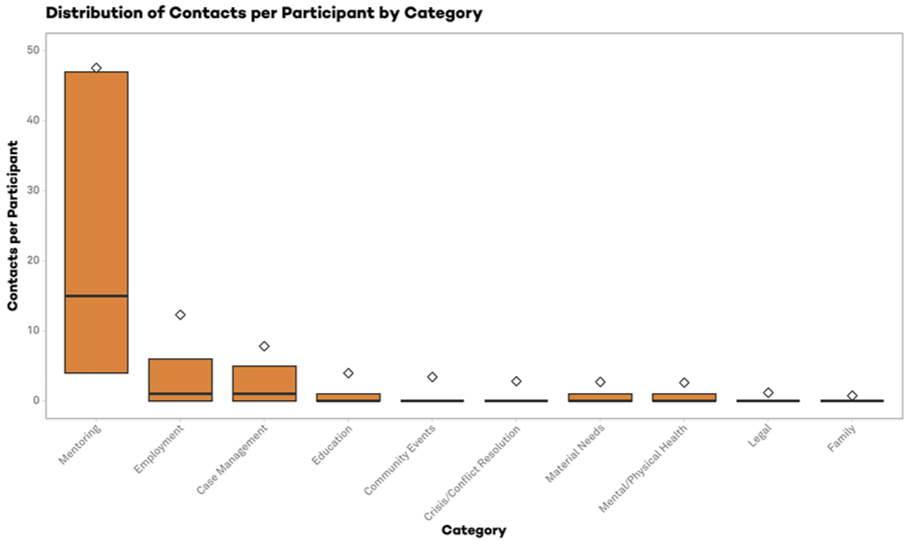
Distribution of contact counts per CP4P participant. White diamonds represent the mean number of contacts per participant in each category, Black lines represent median and quartiles. On average, participants receive 47.8 mentoring contacts (median = 15) and 12.3 employment (median = 1). All other contact categories have medians of 0.
Demographics and Services Profile for Participants with Arrest History (Matched Participants)
In total, 55% (N = 2018) of participants were matched to administrative records (henceforth referred to as “matched participants”). The remaining 1647 individuals (ie, “unmatched”) either did not have an arrest history at the time of analysis or had incomplete information on which to match to administrative records. Unmatched participants were about 21% female and 73% Black, received mentoring as the primary form of service, and had an average adjusted tenure of 182 days (Supplemental Figures S6-S8). Because CP4P did not provide ages or years of birth for their participants, we do not have age estimations on this matched subset. For the subsample of matched participants, 62.5% identified as Black or African American men, 10.6% Black or African American women, and 19.1% as Hispanic or Latino men. Participants were just under 30 years old and averaged 10.9 arrests, including 0.67 arrests for violent crimes at the time of services with CP4P. At a pre-enrollment victimization rate of 1728 shootings per 100 000 residents, CP4P participants’ risk of victimization was 11 times greater than citywide rates in 2016 (157 shootings per 100,000 individuals), with participants averaging 0.23 gunshot victimizations before starting services. On average, participants had about 5.1 years between their most recent arrest and first contact with CP4P. Over 67% of total service contacts during the study period were received by matched participants.
Like the all-participant sample, mentoring was the most common type of service for matched participants, with 1828 of 2018 total participants receiving at least one mentoring contact (Figure 5). Second-most common was employment followed by case management. Matched participants averaged more contacts over a longer period relative to the larger participant sample, with 58 contacts (median 27) over approximately 288 days.

Number of matched participants receiving at least one contact in each category (n = 2018). Participants that were matched to CPD administrative records largely received mentoring-, employment, and case management-focused services from CP4P providers. These participants had 117,547 total contacts with service providers (67.37% of all contacts), receiving 219,232 services.
Approximately 22% (N = 442) of matched participants were located within the citywide high-risk network before the year they first received services. Participants in the high-risk network averaged even more contacts with service providers than their non-high risk matched peers, receiving 135 contacts (median 56) each over 375 days (Figure 6) as compared to 101 contacts (median 38) over 263 days. Though participants in the high-risk network before enrolling in services represent only 12% of all participants, they received 19% of all contacts made by organizations during the study period. High-risk network participants are, on average, about 6 years younger than the larger sample of matched participants. These participants also have more pre-enrollment arrests (mean 13.3) (Figure 7). High-risk network participants receive their first contact with service providers within about 19 months of an arrest, which is considerably sooner than other matched participants (about 5 years). High-risk network participants also enroll with service providers within 6 months of a victimization, on average, compared to about 18 months for the other matched participants.
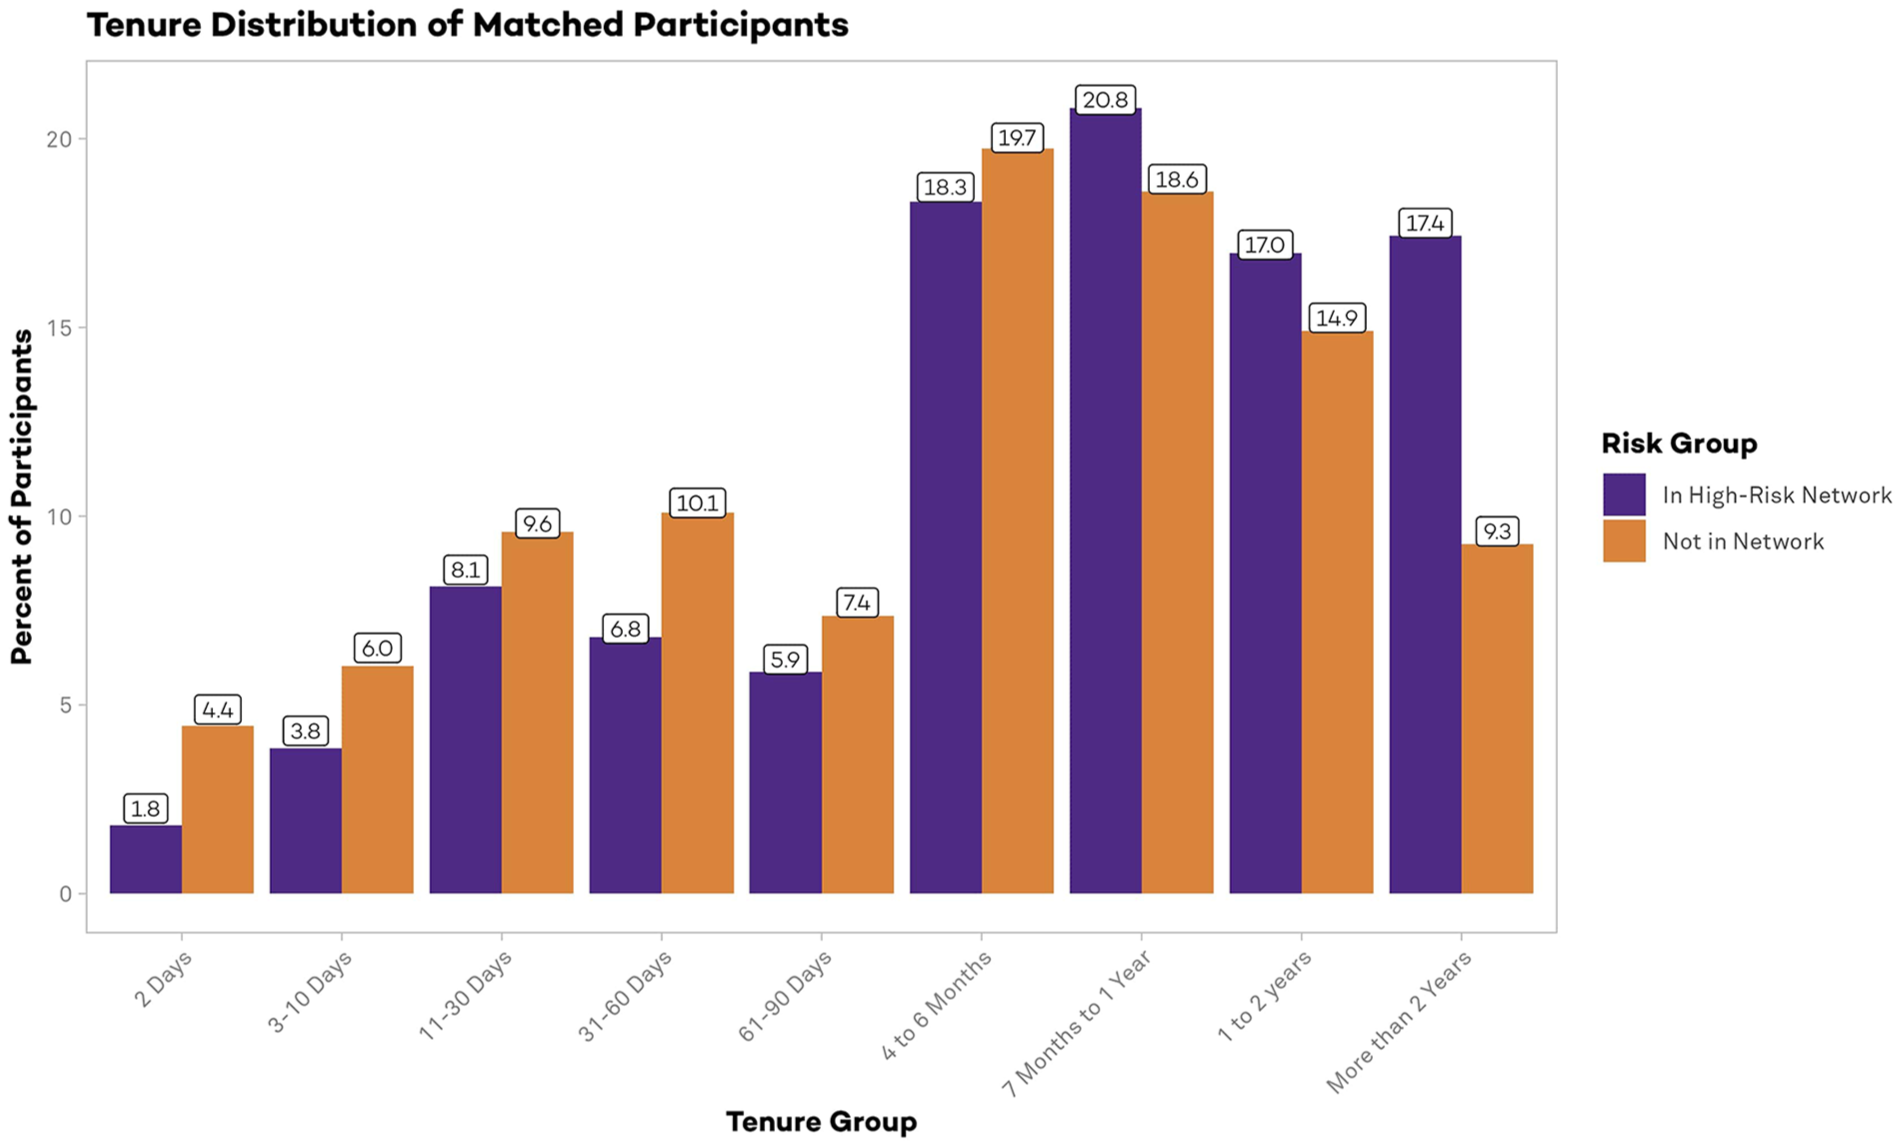
Tenure distribution of matched participants by presence in the high-risk network. Participants in the city-wide high-risk network (n = 442) were in contact with CP4P service providers for an average of 375 days. Matched participants not in the high-risk network (n = 1386) had an average tenure of 263 days.
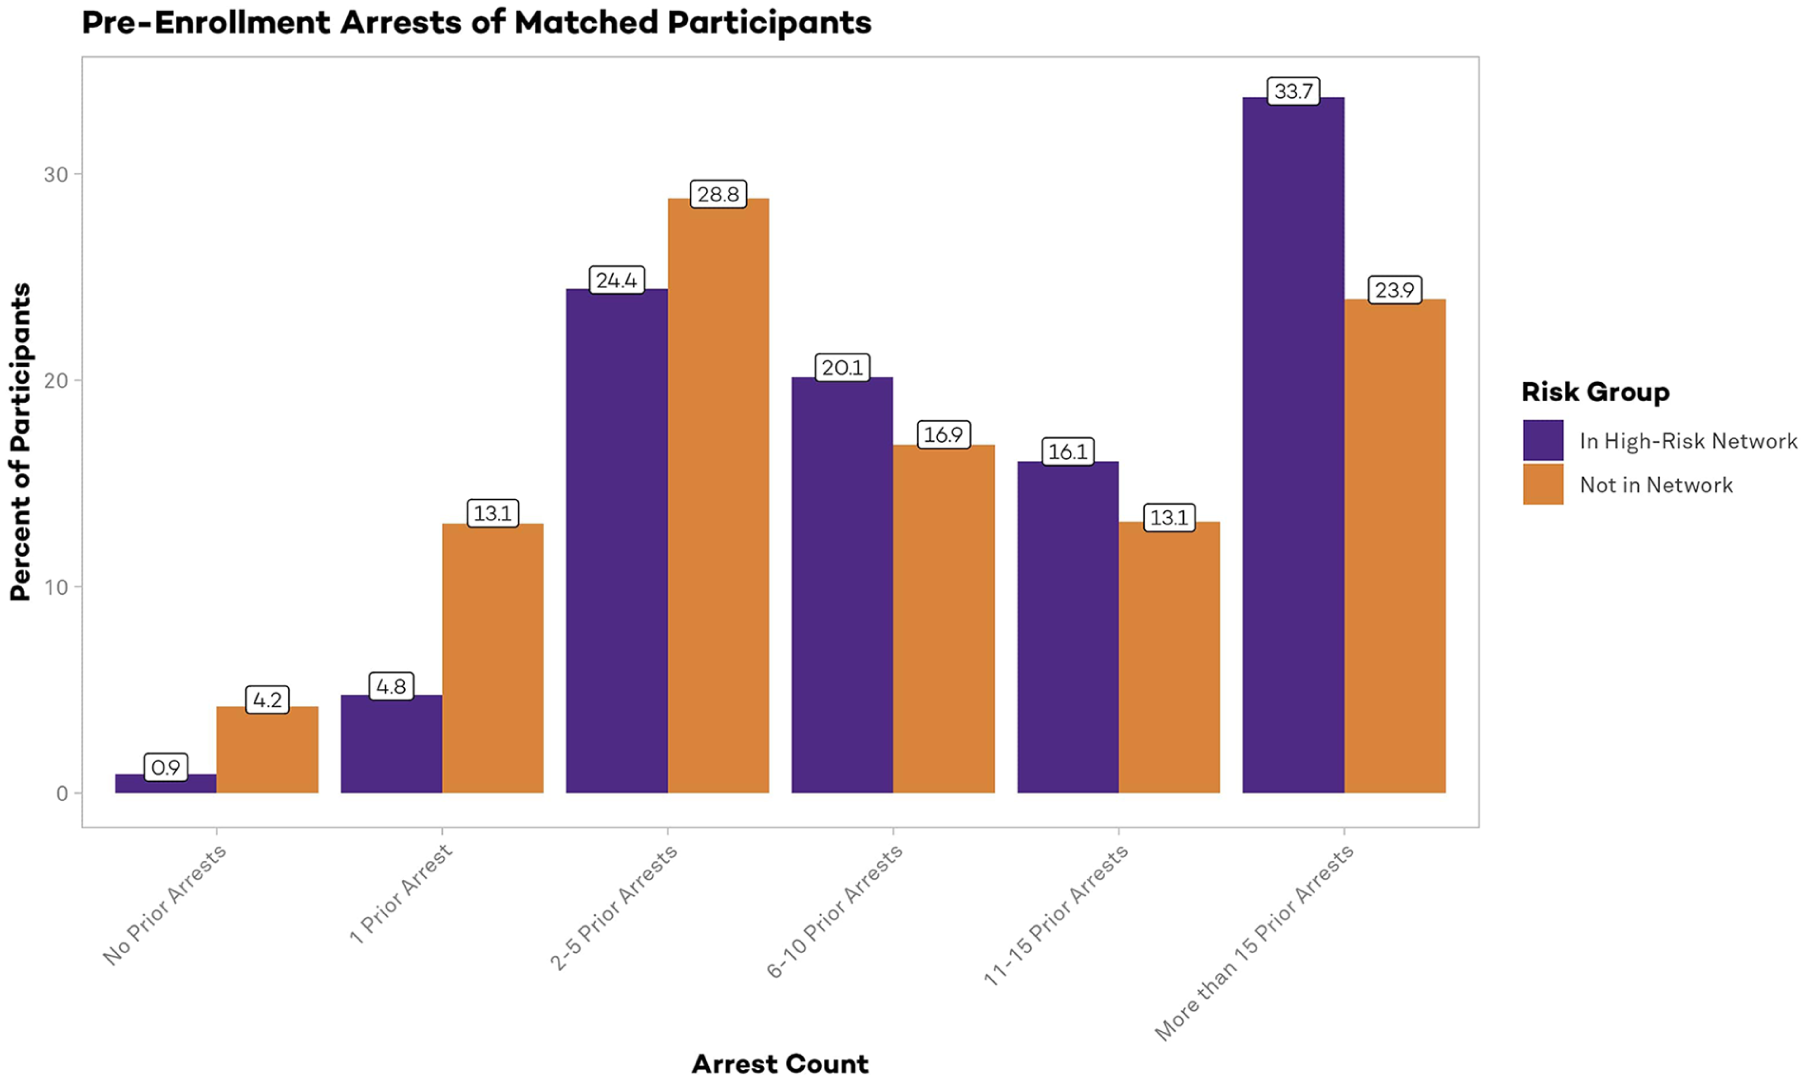
Pre-enrollment arrest count distribution of matched participants by presence in the high-risk network. Participants in the city-wide high-risk network (n = 442) averaged 13.3 arrests before enrolling in programming with CP4P. Matched participants not in the high-risk network (n = 1386) had an average of 10.3 arrests before first contact with providers.
Latent Profile Analysis
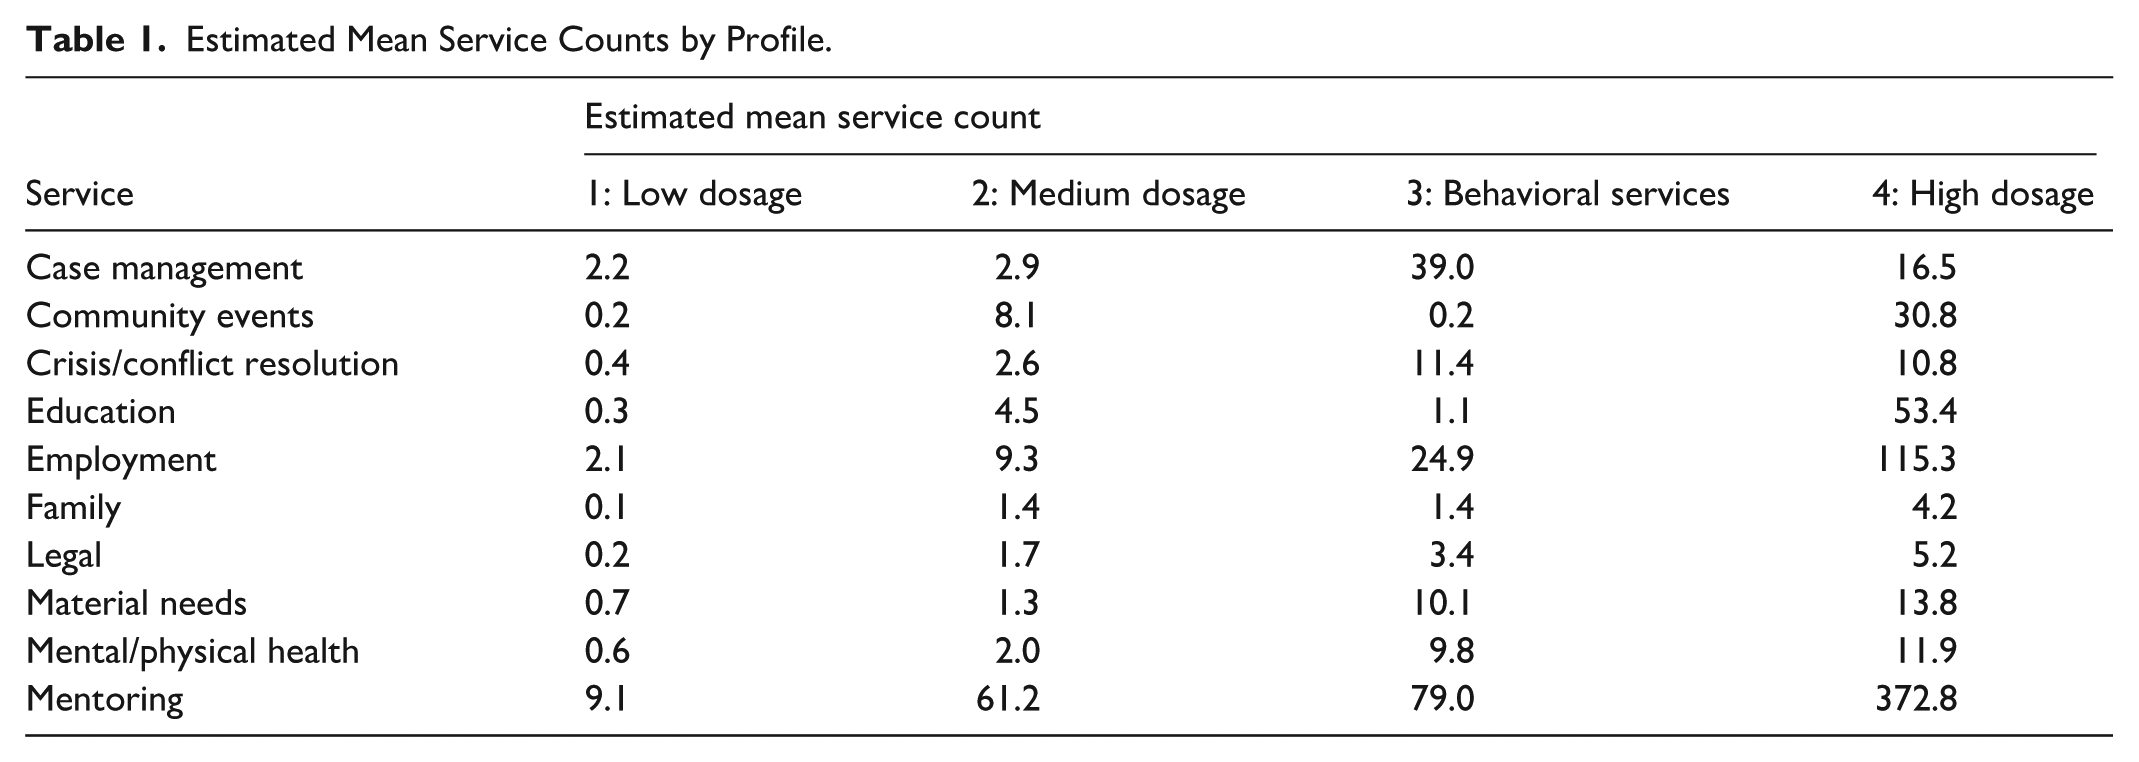
After iterating through different class sizes and comparing fit indices, a four-profile model created the most appropriate and interpretable profiles of the CP4P participants (Figure 8). As seen in the elbow plot of BIC values, there was a large improvement between the 3- and 4-profile models, but only marginal improvement with a 5-profile model and no convergence past 6 profiles (Supplemental Figure S9; see Supplemental Table S3 for fit indices). Individuals in Profile 1 (n = 2233) represent more than half of CP4P participants and generally have a low dosage of services and tenure of less than two months. The Low Dosage class is also proportionally the most female (19%) and has the fewest number of individuals who were in the high-risk network before starting services (10.4%). Representing the smallest group, individuals in Profile 4 (n = 186) had the longest tenures and overall highest number of contacts with providers at a median of 551 contacts over more than 2.5 years. The most common services they received include mentoring, employment, education, and community events, and we refer to this profile as the “High Dosage” profile. The High Dosage profile also is proportionately more Latino, less female, and contains more individuals in the high-risk network before enrollment (22% of this group) relative to the other 3 classes. The overall distribution of services of individuals in Profile 2 (n = 774) closely follows the distribution of services of the High Dosage group, as they were similarly more likely to receive the most common services of mentoring, employment, community events and education (respectfully). Thus, we refer to this group as the “Medium Dosage” profile. Finally, representing a distinct profile by their level of dosage in case management, crisis/conflict resolution, material needs, and mental/physical health services, participants in Profile 3 (n = 472) make up the “Behavioral Services” class. A summary of the mean estimated counts per profile is given in Table 1, a summary of other group attributes is given in Table 2, demographic and services details are provided in Supplemental Figures S10 to S11, and a breakdown of how organizations cluster into each profile is provided in Supplemental Table S4.

Estimated mean service counts by latent profile. Given the high number of mentoring contacts for each profile, we removed the mentoring means from the plot to reduce the height of the y-axis and allow for better visualization of profile differences. All estimated service means are located in Table 1.
Estimated Mean Service Counts by Profile.
Participant Characteristics by Latent Profile.

Discussion
This study’s analysis of 3665 CVI-SO participants provides a comprehensive examination of how CVI-SO services are delivered on the ground. Results show that CVI-SOs provide an array of services to a population of varying levels of risk and needs. Organizations adjust service delivery based on risk levels, as high-risk participants receive more frequent contacts over longer periods compared to other participants. High-risk participants enter services at younger ages and receive nearly 20% of all service contacts despite representing only 12% of participants. Latent profile analysis bolstered these findings, identifying 4 distinct participant profiles—Low Dosage, Medium Dosage, Behavioral Services, and High Dosage—each receiving different combinations and intensities of services. The 186 participants in the High Dosage profile class also had the highest proportion of members of the high-risk network and the Low Dosage profile class (well over half of total participants) had the lowest proportion. This variation in service delivery suggests that organizations are appropriately calibrating their response to participant needs, with frontline staff making sophisticated assessments of participant risk and readiness, strategically varying both the type and intensity of services—from crisis intervention to employment support—to match changing circumstances. 12
The practice of mentoring underscores the dynamic nature of service provision as well as the difficulty in measuring it. Received by over 90% of participants, mentoring is a highly interpersonal dimension of violence prevention and emphasizes how relationship-building serves as the primary mechanism for inspiring behavioral change.11,33 -35 Outreach workers report that mentoring “helps (participants) see positively” and “get out of their norms” so they can become ready for change. This mentoring approach is particularly crucial for participants who may be reluctant or ambivalent about changing risky behaviors. Yet, mentoring itself, let alone its impact on outcomes of interest, can be elusive to measure.
Limitations
Several limitations should be considered when interpreting these findings. First, while our data represents the most complete individual-level CVI-SO services dataset available, approximately 20% of services were coded as “unclear” due to inconsistent or incomplete documentation. This population itself might reflect an important part of CVI work; but we cannot make that assessment with current data. Missing information likely skews our understanding of service patterns and may disproportionately affect certain types of interactions, particularly informal contacts that build trust and relationships.
Second, documentation of outreach work faces challenges that affect both service delivery and evaluation. Managing caseloads of 15 to 20 participants and lacking provider-patient confidentiality protections, street outreach workers must carefully balance evaluation needs against potential risks to their credibility and effectiveness. Outreach instructors acknowledge this tension, simultaneously emphasizing that “if you don’t document it, it didn’t happen” while warning to “be careful how to log it because they can subpoena things for court.” These tensions lead to strategic decisions about documentation, such as not recording full government names in non-protected data systems, that likely result in undercounting of services, particularly the informal interactions crucial for building trust and preventing violence.
Third, our ability to assess participant risk was limited to those with an adult arrest history in Chicago (55% of participants), potentially missing other forms of violence exposure or risk factors. The social network approach to measuring risk, while powerful, captures only one dimension of vulnerability to violence and may not fully reflect the nuanced risk assessments made by street outreach workers.
Fourth, the observational nature of this study limits causal inference about the relationship between service patterns and outcomes. While we observe patterns of risk levels and service intensity that might help inform future research, we cannot determine whether these patterns reflect optimal service delivery or are driven by other factors such as participant availability or program capacity. However, the sorts of variation-capturing metrics we advance here could be added to quasi-experimental methods to explore the possibility of a causal relationship.
Finally, our analysis covers only one coalition of CVI-SO programs in Chicago. While CP4P represents a diverse set of organizations, findings may not generalize to other cities or program models. Local context, including patterns of violence, community resources, and program implementation, likely influence both service delivery and participant engagement.
Future Directions
The variation in service delivery documented in this study, combined with the complex risk factors of participants, necessitates a fundamental shift in how we understand CVI and its impact. Our findings suggest that quantitative research hoping to capture the dynamic and multi-layered nature of on-the-ground CVI work will need to develop metrics that can capture varying levels of risk, participation, and tenure, in addition to the different services, interventions, and treatments that participants receive. Research frameworks should examine individual-level behavioral changes and mindset transformation, alongside economic outcomes related to employment and legitimate income, neighborhood-level conditions, and violence dynamics. It must also consider participants' development of pro-social connections and community engagement, as well as their patterns of program engagement and service utilization. Crucially, these metrics should be risk-adjusted to account for participants’ baseline exposure to violence, recognizing that maintaining non-involvement in violence among highest-risk participants may represent program success. Future work is needed to understand how risk varies dynamically before, during, and after contact with CVI programming, and how to properly model those dynamics for evaluating program outcomes.
Findings from this study point to several critical areas for future research. First, we need a better understanding of how participant “readiness” for programming influences service delivery and outcomes. Second, investigation of potential dosage effects—how different intensities of services affect outcomes for different risk profiles—could help optimize resource allocation and facilitate subsequent understanding of CVI programming. Finally, we need more sophisticated methods for measuring and evaluating the impact of relationship-building and informal interactions that form the foundation of outreach work.
Conclusion
Our findings advance research by documenting, for the first time in an empirical study, how CVI programs operate as complex, dynamic interventions, aligning quantitative metrics with the on-the-ground nature of CVI work. 10 Our analysis reveals that dosage in CVI is a fluid combination of service types and intensities that outreach workers nimbly adjust based on participant risk and needs. This adaptive approach to service delivery represents a fundamental feature of CVI work that has gone unmeasured in previous evaluations due to challenges with documenting the breadth and depth of services provided to participants at varying levels of gun violence risk in street outreach interventions. Future evaluations must develop sophisticated measurement approaches that can account for variation in both risk and service delivery.
Supplemental Material
sj-docx-2-inq-10.1177_00469580251360634 – Supplemental material for Characterizing Violence Intervention Street Outreach Participants and Service Dosage: Implications for Measurement and Evaluation
Supplemental material, sj-docx-2-inq-10.1177_00469580251360634 for Characterizing Violence Intervention Street Outreach Participants and Service Dosage: Implications for Measurement and Evaluation by Marisa C. Ross, Susan Burtner and Andrew V. Papachristos in INQUIRY: The Journal of Health Care Organization, Provision, and Financing
Supplemental Material
sj-pdf-1-inq-10.1177_00469580251360634 – Supplemental material for Characterizing Violence Intervention Street Outreach Participants and Service Dosage: Implications for Measurement and Evaluation
Supplemental material, sj-pdf-1-inq-10.1177_00469580251360634 for Characterizing Violence Intervention Street Outreach Participants and Service Dosage: Implications for Measurement and Evaluation by Marisa C. Ross, Susan Burtner and Andrew V. Papachristos in INQUIRY: The Journal of Health Care Organization, Provision, and Financing
Footnotes
Acknowledgements
The authors would like to acknowledge leaders at Metropolitan Family Services, Metropolitan Peace Initiatives and Communities Partnering 4 Peace for their partnership on this work, as well as the CVI participants and outreach staff who trusted us with their stories and data. We would also like to acknowledge the work of Erin M. Ochoa and Camille Liotine for the qualitative coding process development. This paper is currently hosted online as part of Northwestern University’s Institute for Policy Research working paper series ![]()
Ethical Considerations
All study activities were approved under Northwestern University IRB STU00221314 - "Evaluating Street Outreach Programs to Reduce Violence in Chicago." (14 November 2018)
Consent to Participate
All data were collected through either CVI organizations or the Chicago Police Department. Programmatic data from CVI organizations was collected from service providers, not individual participants; therefore, consent to participate was waived. CPD records are public, and therefore consent to participate was not required.
Author Contributions
Marisa Ross and Susan Burtner contributed equally to the design and analysis included in this manuscript. Marisa Ross supervised the project and led manuscript preparation, with Susan Burtner leading the preparation of statistical results. Andrew V. Papachristos provided critical guidance and revisions and secured the funding and partnerships for this work.
Funding
The author(s) disclosed receipt of the following financial support for the research, authorship, and/or publication of this article: This research and evaluation were made possible with the support from the Joyce Foundation, Pritzker Pucker Family Foundation, and the Partnership for Safe and Peaceful Communities.
Declaration of Conflicting Interests
The author(s) declared no potential conflicts of interest with respect to the research, authorship, and/or publication of this article.
Data Availability Statement
Programmatic data used in this study are associated with vulnerable individuals under a strict data sharing agreement. As such, data from this study cannot be made available. Dummy data and code can be made available upon request.
Supplemental Material
Supplemental material for this article is available online.
References
Supplementary Material
Please find the following supplemental material available below.
For Open Access articles published under a Creative Commons License, all supplemental material carries the same license as the article it is associated with.
For non-Open Access articles published, all supplemental material carries a non-exclusive license, and permission requests for re-use of supplemental material or any part of supplemental material shall be sent directly to the copyright owner as specified in the copyright notice associated with the article.