
Abstract
Kenya is experiencing a significant increase in the prevalence of non-communicable diseases (NCDs) such as cardiovascular diseases, hypertension, Type 2 diabetes, and certain cancers (bowel, lung, prostate, and uterine). This case is not unique to Kenya but is common in many Low and Middle-Income Countries (LMICs) in Africa. Many NCDs, are linked to diets high in added sugars, sodium, saturated fat, and low in fiber. There is a notable lack of information regarding the demographic differences among supermarket customers and their purchasing habits of healthy versus unhealthy foods in some parts of Africa. This gap in knowledge hinders the ability to connect grocery purchase patterns to NCDs, including obesity. Supermarkets in LMICs offer valuable demographic insights through grocery data. This research utilizes NOVA classification tool, data mining and unsupervised machine learning techniques to analyze grocery purchase patterns in 10 supermarkets across 5 counties in Kenya between 2022 and 2023. The apriori algorithm was used to create association rules and an analysis was done on the association rules to find out the relationship between demography (location, gender, and age) with purchase patterns. Individual data was collected along with transaction data, since the supermarkets logged transactions done by loyalty card customers. The main aim is to provide guidance to policymakers in public health. We collected 3 934 122 unique transactions and each transaction was associated with a customer who was identified with a unique customer ID. Findings from this research demonstrate that 53% of food purchases from these transactions were mainly industrially processed food items and males above the age of 50 years were the main consumers of these food items. The findings lead to the conclusion that this purchase trend has a chance of rising NCDs in older people. Therefore we recommend that policymakers adopt our recommendations to safeguard public health.
Keywords
● Low- and middle-income countries (LMICs) in Africa are experiencing increasing cases of non-communicable diseases (NCDs) such as diabetes, cardiovascular conditions, and certain cancers.
● NCDs are linked to overweight and obesity associated with high intake of added sugars, sodium, saturated fats, and low fiber.
● Grocery transaction data can provide insights into consumer demographics and health trends.
● This study utilized supermarket grocery data to analyze customer purchase patterns using NOVA food classification and unsupervised machine learning.
● Results revealed that 53% of food purchases were industrially processed foods with men over 50 as the main consumers.
● These food purchase trends may increase NCD risks in older adults.
● The results indicate that policymakers need to take action to promote healthier food consumption.
● The study was limited to shoppers in a tier 2 supermarket drawn from 5 counties out of the 47 counties in Kenya, therefore the data might not represent other regions in Kenya. It did not consider alternative traditional food purchasing outlets such as kiosks, open-air markets, and street vendors.
Introduction
Non-communicable diseases (NCDs) which include nutrition related non-communicable diseases (NR-NCDs) account for 74% of deaths globally. Of these deaths, 77% are in low-and-middle income countries. 1 Nearly all NCDs, can be linked with consumption of diets high in added sugars, sodium, saturated fat, and low in fiber.2-4 These associations have been observed on both an individual and population level. The evidence of the global nutrition transition toward this diet pattern often referred to as the Western Diet has shown population level effects on NCDs prevalence and mortality.5,6 East Africa has not been immune to the effects of global nutrition transition. In both urban and rural regions, overweight and obesity prevalence has increased dramatically along with the increases in NCDs. Overall in 2022, overweight (Body Mass Index(BMI) between 25.0 and 29.9) and obesity (BMI greater than or equal to 30.0) prevalence of age 20 to 49 in Kenya was 19% among men and 45% among women while diabetes prevalence of age 20 to 49 in Kenya was 1% among men and 1% among women 7 ; these numbers have undoubtedly increased since then.
To investigate the increasing over-reliance on industrially processed products, the NOVA food classification system 8 has been prominently used to provide guidance and information on processed foods. NOVA has been applied worldwide in scientific literature. It has been used in Brazil, Canada, Chile, Mexico, Norway, Sweden, Spain, UK, and USA to assess the association, determinants and impact of consumption of ultra-processed products.9-21 Little is known about studies in Africa that have utilized the use of NOVA food classification.
Little information is known about demographic differences in supermarket purchasing habits of healthy and unhealthy foods in Africa. Available studies mostly refer to demographic differences in food consumption habits in Canada, Hungary, Lebanon, Norway, and USA have shown that men consume more unhealthy foods (carbonated beverages, fast foods) while women consume more healthy foods (fruits, vegetables).22-26
Use of innovative ways with big data is on the rise due to advances in software development, storage capacity, and computational power which have made it possible to analyze large datasets. 27 One such industry that utilizes big data is the retail industry, specifically supermarkets. Supermarkets on a daily basis collect sales data at the store level and grocery data at the household level through loyalty cards. Grocery data can provide an accurate measure of household or individual level dietary-related behaviors in a real-life setting. 28 Despite the rapid growth of supermarkets in LMIC’s termed “supermarket revolution,” 29 the full potential of grocery data has been underutilized.
With most households in large towns in LMIC’s relying heavily on supermarkets for their food variety due to lower prices, there has been a rapid change of diets toward more energy-dense foods and beverages that tend to be rich in unhealthy types of fat, refined starches, caloric sweeteners, and salt. 30 These diet changes contribute to surging rates of obesity, which are risk factors for NR-NCDs. 6
Insights From Related Work
Toiba et al 31 investigated the relationship between the increased use of modern food retail outlets in Indonesia and the emergence of unhealthy dietary patterns. They found it quite interesting that modern retail food was expensive and not very healthy. Specifically, a one-percentage-point increase in the share of food expenditures at supermarkets was associated with a 0.15% to 0.17%-point decrease in the household’s share of food expenditures on healthy food. This shows that individuals would buy expensive, unhealthy foods at the expense of relatively low-cost healthy food, what an irony. Notably, they found that food consumed away from home tends to be less healthy. This study in Indonesia also provided demographic insights relevant to the context of Kenya. Factors such as the location and age of consumers can influence where they purchase their food items and at what cost.
De Roos et al 32 conducted an investigation to quantitatively analyze expenditure on all fresh foods, fruits and vegetables, and fish in Scotland, since fresh foods are perceived to contribute more to health than processed foods. They used ANOVA to test for differences in demographic characteristics and food purchases across urban-rural classifications. They found that rural households bought more in kilogram terms of fresh foods and fruits and vegetables than urban households. This study was interesting to this particular study since we also wanted to find out the purchase patterns of people in rural counties in Kenya and compare with other countries.
Odunitan-Wayas et al 33 conducted a study as part of the larger STOP Obesity in the People of South Africa. They found out that high-income shoppers purchased more fruits and vegetables, while low- and middle-income shoppers spent more on snacks, sugar-sweetened beverages, grains, and potatoes. They also found that high Socio-Economic Area (SEA) shoppers (with monthly income ≈US$857) purchased more fruits and vegetables, while low (monthly income ≈US$114) and middle-SEA shoppers (monthly income ≈US$373) spent more on snacks, sugar-sweetened beverages (SSB), grains, and potatoes. Another unfortunate situation was that fresh fruits and vegetables in high SEA supermarkets were of better quality compared to those in middle- and low-SEA supermarkets. Since this study was conducted in Africa, we also wanted to explore how it compares to Kenya. Specifically, we aimed to investigate what perceived high-income shoppers, identified based on location and age, tend to purchase in Kenya.
Another study was conducted by Koroknay et al 23 in Hungary. The survey was conducted among university students to evaluate gender differences in consumption habits and spending behavior regarding various food groups. The study highlighted that consumption of less healthy food was more prevalent among young men, greatly contributing to obesity. They also discovered that unhealthy eating patterns established in young adulthood persist and contribute to the development of NCDs. Some key insights were that women consumed more coffee, dairy products, vegetables, and fruits compared to men. Men consumed more trendy and less healthy products like snacks, sweets, fast food, and energy drinks. This study was particularly interesting because purchasing patterns related to gender were observed in Hungary. These findings provided valuable insights that guided us in conducting this experiment in Kenya using the available data.
An interesting study was conducted by Moodley et al. 34 Data was collected using a digital camera and GPS navigation system to record the location of sugar-sweetened beverage (SSB) advertisements and food vendors in Soweto, South Africa. The research highlights that the high sugar intake from SSBs significantly exceeds the World Health Organization’s daily sugar intake recommendations and contributes to obesity. The study also suggests that the strategic placement of SSB advertisements in schoolyards or close to schools targets children and promotes unhealthy dietary practices. The findings have significant implications for policies that regulate SSB advertising, particularly around schools, to prevent childhood obesity and promote healthier dietary habits. This study led to the development of a new policy in South Africa, and it was intriguing to consider how our study might similarly influence the creation of a policy promoting healthy food purchases in Kenyan supermarkets.
Machado et al 35 conducted research in Brazil involving a survey on a probabilistic sample of 55 970 Brazilian households between 2008 and 2009. The results of the study suggested that the convenience and lower prices of ultra-processed foods at supermarkets contributed to their higher consumption, which is linked to poorer dietary quality and higher incidences of NCDs. The results also showed that a 1% increase in the number of food items purchased resulted in a 1.83% increase in calorie acquisition from ultra-processed foods. Another notable finding was that supermarkets in Brazil accounted for a higher percentage of calories from ultra-processed foods and beverages (25% higher) than other food stores, driven by lower prices and convenience. The authors suggested that public policies should address the role of supermarkets in terms of the consumption of ultra-processed foods through pricing and convenience mechanisms to promote healthier diets and reduce NCDs. This study similar to Moodley et al 34 showed how supermarkets might be the major driving force of purchasing of unhealthy foods, we used this case study to find out if it is the same case in Kenya. We classified the food items purchased in the 3 million transactions as a means to find out the percentage of ultra-processed food items in Kenyan supermarkets.
Debela et al 36 investigated the relationship between supermarket purchases and child nutrition by analyzing data from households in 3 towns in Kenya, with varying access to supermarkets. The results showed that households with supermarket purchases had significantly higher food variety and dietary diversity scores. These households were more likely to consume nutrient-rich foods such as meat, fish, eggs, and fruits. This study was important as it provided insights into what supermarkets offer to the Kenyan population that other food stores do not. Understanding the Kenyan supermarket landscape significantly enriched the scope of our study.
Rischke et al, 37 like Debela et al, 36 investigated the relationship between supermarket purchases and child nutrition by analyzing data from 453 households in 3 small towns in Central Province, Kenya. The analysis focused on the effect of supermarket purchases on food expenditure shares, calorie shares, and overall calorie availability per adult equivalent per day. The study showed that supermarket purchases increased the consumption of processed and highly processed foods at the expense of unprocessed foods. Similar to findings in Brazil, households that purchased food from supermarkets had higher overall calorie availability per adult equivalent per day. This increase in calorie consumption was driven by lower prices per calorie for foods purchased from supermarkets, particularly processed foods.
Table 1 summarizes the relevant related work explored in this study. Investigations from published work in different countries show that there is a limited amount of research using quantitative data or supermarket transactional data and NOVA classification. Related work did not focus extensively on actual transactional data, especially those conducted in Kenya, to capture the minute details of how populations in their samples made purchases and how these were linked to their demographics and subsequent health effects. This study aims to examine individuals’ grocery purchasing patterns, their demographics, and the combined effects of these factors on NCDs and other health-related issues.
Summary of Related Work.

Aim
The main aim of this study is to examine the food purchasing patterns of supermarket shoppers and identify associations with demographics in Kenya. Understanding this connection will help the general public and policymakers implement demographic-driven measures to reduce the rate of increase of NCDs to manageable levels. Since published work2-4 has shown a strong connection between purchased food items and NCDs, the objective of this work is to reveal hidden and currently unknown insights from Kenya’s purchasing behavioral patterns in their demographic differences and how these can be related to the prevalence of NCDs. The rest of the manuscript is organized as follows: Materials and Methods, Results, Discussion, and Conclusion.
Materials and Methods
The study is a cross-sectional exploratory study with a phased approach employing quantitative secondary data collection from electronic transactional records of supermarkets (departmentalized self-service stores offering wide range of goods from groceries to household goods, electrical appliances to furniture, toys to clothing, stationery to cosmetics all under 1 roof) in 5 counties namely (Nakuru, Kajiado, Nairobi, Kirinyaga, and Machakos) in Kenya.
The county profiles are as follows:
(i) Nakuru is county number 32 out of the 47 Kenyan counties. With an estimated population of over 2.2 million it is the third most populous county after Nairobi and Kiambu. 72% of the population is less than 30 years of age. The population of the county is 52% rural and 48% urban and comprises all major tribes of Kenya. The county is strategically located at the nerve center of the entire nation and opens Kenya to East and Central Africa. Nakuru is an agriculturally-rich county with various tourist attractions such as craters, lakes and national parks and other beneficial economic activities such as production of geothermal energy. The main economic activity in Nakuru County is food and cash crop farming as 70% of the land is arable and highly productive. The main crops produced in the county include: maize, beans, Irish potato, wheat, fruits, vegetables, and flowers. Nakuru County is also endowed with a high capacity for livestock and dairy production.
(ii) Kajiado County is adjacent to Nairobi County and to its south, borders the Tanzanian regions of Arusha and Kilimanjaro. It is county number 34 out of the 47 Kenyan counties and has an estimated total population of over 1.2 million with 59% living in rural areas. The county has several towns that serve as a residential area for many people from different parts of the country who work in the urban centers, especially Nairobi City. Rural-urban migration has contributed to the rise in multiethnic representation in the major urban centers, with the Maasai being the dominant tribe in the rural areas. Kajiado County is mainly water-stressed with a poverty rate of around 60%. Economic growth and development depend on the main strengths of agriculture, horticulture (tomato, cabbage, kales, and banana), food crop farming (maize, sorghum millet, beans, cowpeas, greengrams, sweet potatoes, cassava, irish potatoes), livestock production (cattle, sheep, goats, and they are kept for milk, meat, offal, raw fats, fresh hides and skins.
(iii) Nairobi County serves as the capital city of Kenya. It is county number 47 out of the 47 Kenyan counties. With an estimated population of over 4.5 million, it is the most populous. Nairobi County which is an established hub for business, manufacturing industries, transport, shopping malls, tourism, and culture. As a cosmopolitan urban African city, it hosts all the 42 diverse tribes of Kenya, and a large immigrant population from other countries in the world. More than 90% of Nairobi residents work within the Nairobi metropolitan area, in the formal and informal sectors. 10% of Nairobi population is located in the high-income upmarket suburbs, 30% in lower-middle and upper-middle-income settlement areas whereas 60% of low and lower-income settlements are located mainly in high-density slum areas.
(iv) Kirinyaga County is located south of Mt. Kenya and is county number 20 out of the 47 Kenyan counties. With an estimated total population of over 0.7 million, 78% live in rural areas. The Kikuyu (largest ethnic group in Kenya) are the dominant tribe in the county. The poverty rate for Kirinyaga is 20%. Agriculture is the main economic activity. The county is best known for rice production from the Mwea irrigation scheme, coffee, and tea. Due to the scarcity of land and high population, most agriculture is done on a small scale. The county also boasts of dairy production and agricultural exports such as horticultural crops (maize, beans, tomatoes, French beans) and macadamia. Kirinyaga County is endowed with a forest cover of around 23% and 6 rivers and is inhabited by a variety of wildlife including elephants, buffaloes, monkeys, bushbucks, and colorful birds while the lower parts of the forest zone provide grazing land for livestock.
(v) Machakos County borders Nairobi to the west, Kajiado to the south west, and Kirinyaga to the north west. It is county number 16 out of the 47 Kenyan counties and has an estimated population of 1.5 million. The Kamba (fifth largest ethnic group in Kenya) are the dominant tribe in the county. Around 30% of the population living in the urban areas are middle-income and mostly work in Nairobi’s city due to the close proximity. The county has a monetary poverty rate of 23.1% and a multidimensional poverty rate of 39.4%. After the manufacturing sector (cement factories, steel mills, export processing zone companies), agriculture is the second most important sector. Over 70% of the County population live in rural areas and derive their principal livelihoods, directly or indirectly from agriculture. Subsistence agriculture is mostly practiced with maize and drought-resistant crops such as sorghum and millet being grown due to the area’s semi-arid state. Machakos County is faced with an accelerating crisis of drought, heat stress, diminishing water resources and increased temperatures leading to food shortage, increased food prices, and scarcity of water.
The electronic records contain transactional data from January 2022 to December 2023. These counties were purposely sampled since grocery data was received from supermarket branches located in those counties. These counties are represented by different ethnic and cultural differences in the populations.
The study population includes records of individuals who have made purchases in a tier 2 supermarket with 10 branches spread across 5 Kenyan counties. Currently in Kenya, there are over 20 supermarket chains with over 300 stores where food (dry groceries and fresh produce) represents around 60% of total sales. They are classified in terms of their market share, number of stores, and amount of space occupied as first-tier, second-tier, and third-tier. The first tier comprises International and hybrid (International and local) owned supermarket chains that are the clear market leaders with over 25 stores located in major towns and strategic shopping malls, the second comprises mostly local owned large supermarket chains with between 5 and 25 stores and third comprises of independent and mini supermarket chains with between 1 and 4 stores.
Ethical approval was granted by Amref Ethics and Review Committee (ESRC) (approval no. AMREF-ESRC P1526/2023) on November 15, 2023.
The reporting of this study conforms to STROBE-nutreporting guidelines. 38
Description of Data
Main Data Values.
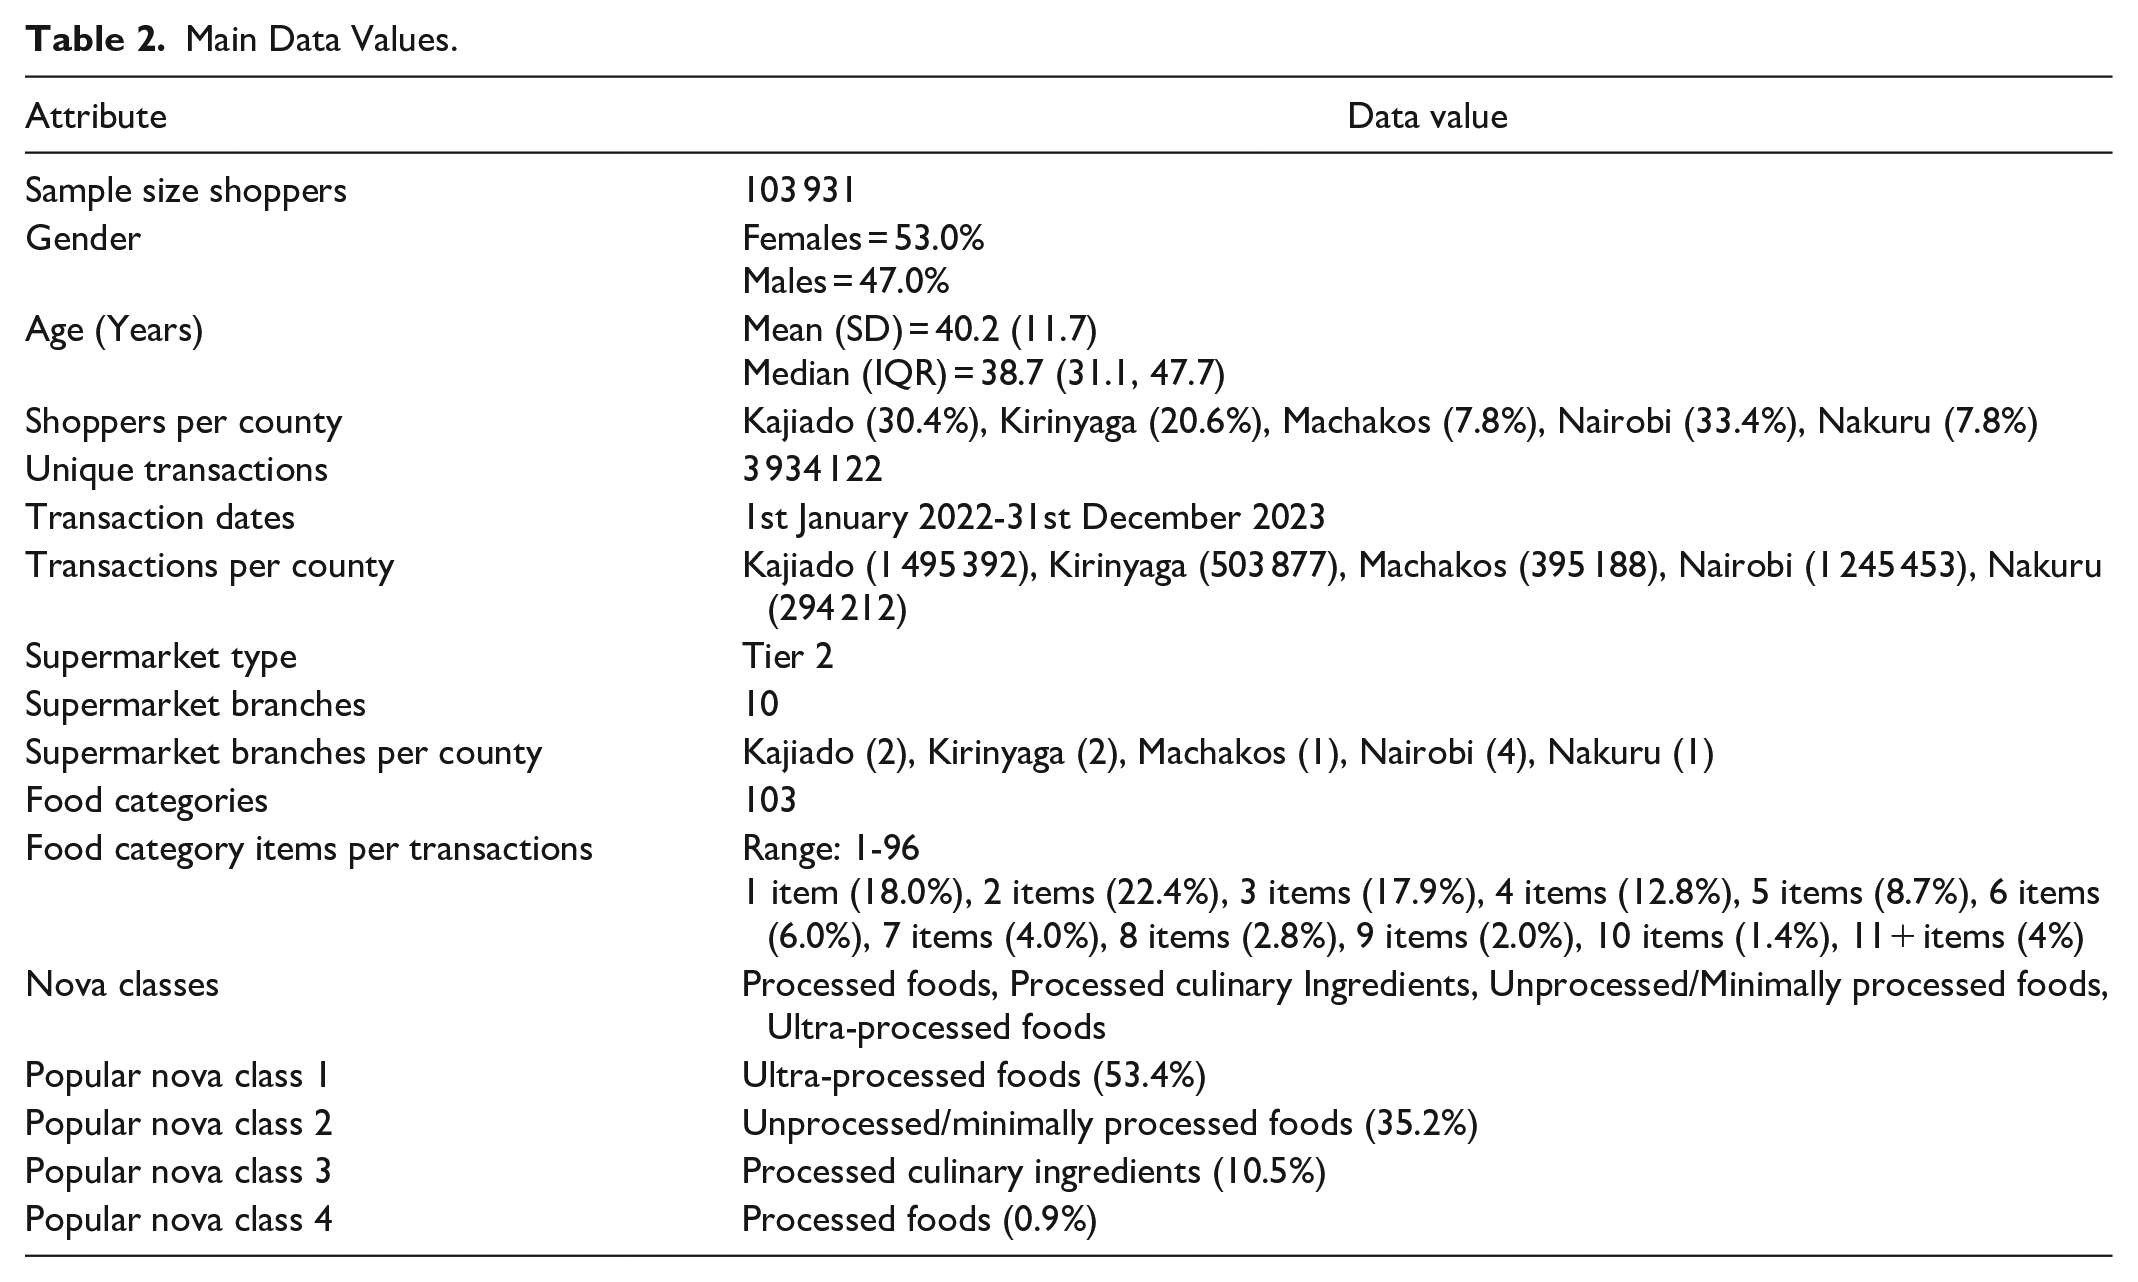
NOVA food classification is a system developed by researchers at the University of Sao Paulo, Brazil39,40 and categorizes all foods into 4 groups according to the nature, extent, and purposes of the industrial processes they undergo.
Process Workflow
Table 2 was created from descriptive statistics in the form of frequency, percentage, sum, mean, and standard deviation to examine demographic characteristics of the customers and food classification. The extracted grocery data in the form of csv files was saved into a local database using PostgreSQL version 15.2 41 and imported into R version 4.3.3 42 for cleaning and analysis as highlighted in Figure 1. The data had 47 748 603 transactional records. Since the data came from 10 supermarket branches in the 5 counties, the data was augmented to have a holistic view of the transactions. The alignment included transactions and demographics alignment. Some data preprocessing techniques were applied (which include: parsing, re-formatting, dealing with missing values etc) to check for data consistency and quality assurance checks, filtering non-food items and non-loyalty shoppers. The final dataset for analysis had 15 210 101 transactional records.

Process workflow.
After the data preprocessing step, the data was restructured to fit both the alignment and to prepare it for some basic data analysis which will give us some more insights in the transactions. The basic analytics included a chi-square test and Fisher’s exact test (when more than 20% of cells have expected frequencies <5) where appropriate to analyze the differences in NOVA food classification groups with gender, age, location, and socio-demographic analysis. Statistical significance was considered at P-value < .05. The reason for this analysis was to have a detailed understanding of the social and demographic structure of the customers, as well as to understand the relationship between these 2 with the transactions before association rule mining. Association rule mining was implemented using the apriori algorithm to understand items which were bought together frequently and with which demographic groups. After that, a linkage was built between the association rules and the NOVA classification, the main reason for that was to understand the frequent transaction patterns and the nature of the food items in those frequent transactions. Finally, visualization was implemented to generate the graphic view of results and their implications. The graphical representations create a holistic understanding of everything to the audience, especially the policy makers.
Results
Initially, the results reveal insights into how different demographic groups behave in terms of their purchasing habits. This is followed by an exploration of the variations in purchase patterns across different demographic groups concerning the NOVA classification of food items. Additionally, the results identify the main food items prevalent in the frequently purchased NOVA categories for each demographic group. By linking these purchasing patterns to demographic data, the study aims to identify potential non-communicable diseases (NCDs) that may disproportionately affect certain demographic groups.
Purchase Patterns by Demographics
Shoppers aged 26 to 35, 36 to 49, 50, and above were proportionally more in Nakuru, Nairobi, and Machakos counties respectively. Figure 2 shows that there were proportionally more female shoppers than males across age groups of 18 to 25 and 36 to 49 years whereas there were proportionally more male shoppers than females in the age group of 50 and above years.

Age-gender trend of shoppers across the study period.
Table 3 summarizes the proportion of different food category purchases and the association with gender, age, and location. Over three-fifths (60.87%) of the food purchases are accounted for by 12 out of 103 unique food categories, that is, breads (13.58%); whole milk (12.25%); sugar (5.95%); maize/corn flour (4.82%); flavored/fruit yogurt (4.65%); wheat flour (3.94%); sweet and savory snacks (3.52%); cookies, biscuits, and wafers (2.82%); sodas and carbonated drinks (2.67%); tea (2.33%); fruit drinks/sweetened juice and bottled teas (2.19%); pastries (2.16%).
Food Category Purchases Stratified by Gender, Age and Location.

Note. * = column percentages; P-value = chi-square test/fisher’s exact test significance level; Bold P-values indicate significance at 0.05 level; Others (Processed foods) = Canned Vegetables/Canned Fruits/Canned Spices; Others (Processed Culinary Ingredients) = Maple Syrup/Sugar-Molasses; Others (Unprocessed/Minimally processed foods) = Gram Flour/Carrot Flour; Each superscript letter (a,b,c,d,e) compares the proportion of food categories between groups with more than two categories and denotes a subset of age and location categories whose column proportions do not differ significantly from each other at the 0.05 level.
Gender and age
Figure 3 shows that males in the age group between 26 and 35 were frequently purchasing bread more than females. However, more males in the age groups of 36 to 49 and above 50 added sugar and whole milk to their purchases. We can also observe a slight difference in the purchasing patterns of males and females from Figure 3. Males in the age groups of 36 to 49 and above 50 were also frequently purchasing flavored yogurts, pastries, carbonated drinks, and candies as shown by higher values of support (support for an association rule flavored yogurt ⇒ pastries is the percentage of transactions in the database that contain flavored yogurt ∪ pastries). Additionally, more males above 50 were frequently purchasing sweetened juices and bottled teas. On the other hand, females, especially those in the age groups of 36 to 49 and above 50, were frequently purchasing whole milk, salt, whole flour, and maize flour.

Purchase patterns associated with age and gender; support ≥0.02.
Age and location
Figure 4 shows that people in the age group of 18 to 25, especially those in Machakos, were frequently purchasing bread and whole milk more than in any other counties. People in Kajiado, Nairobi, and Machakos in the age groups of 26 to 35, 36 to 49, and above 50 were frequently purchasing bread, whole milk, and sugar. We can also observe a trend of purchasing flavored yogurts, sweet and savory snacks in Kajiado by the age group of 26 to 35. Those in the ages of 36 to 49 and above 50 added corn flour to their purchases in the same county. Similarly, those in Machakos aged 36 to 49 and above 50 were buying flavored yogurts, sweet and savory snacks. Nairobi comes in third place in this trend.

Purchase patterns associated with age and location; support ≥0.025.
Gender and location
Figure 5 shows that both males and females in Kajiado, Machakos, and slightly Nairobi were very interested in bread and whole milk. In Machakos and Kirinyaga, they also added maize or corn flour. We can also observe that both males and females in Kajiado were much more interested in purchasing flavored yogurt, candies, sweet and savory snacks, sodas and carbonated drinks, pastries, cupcakes, and many more items compared to any other county.
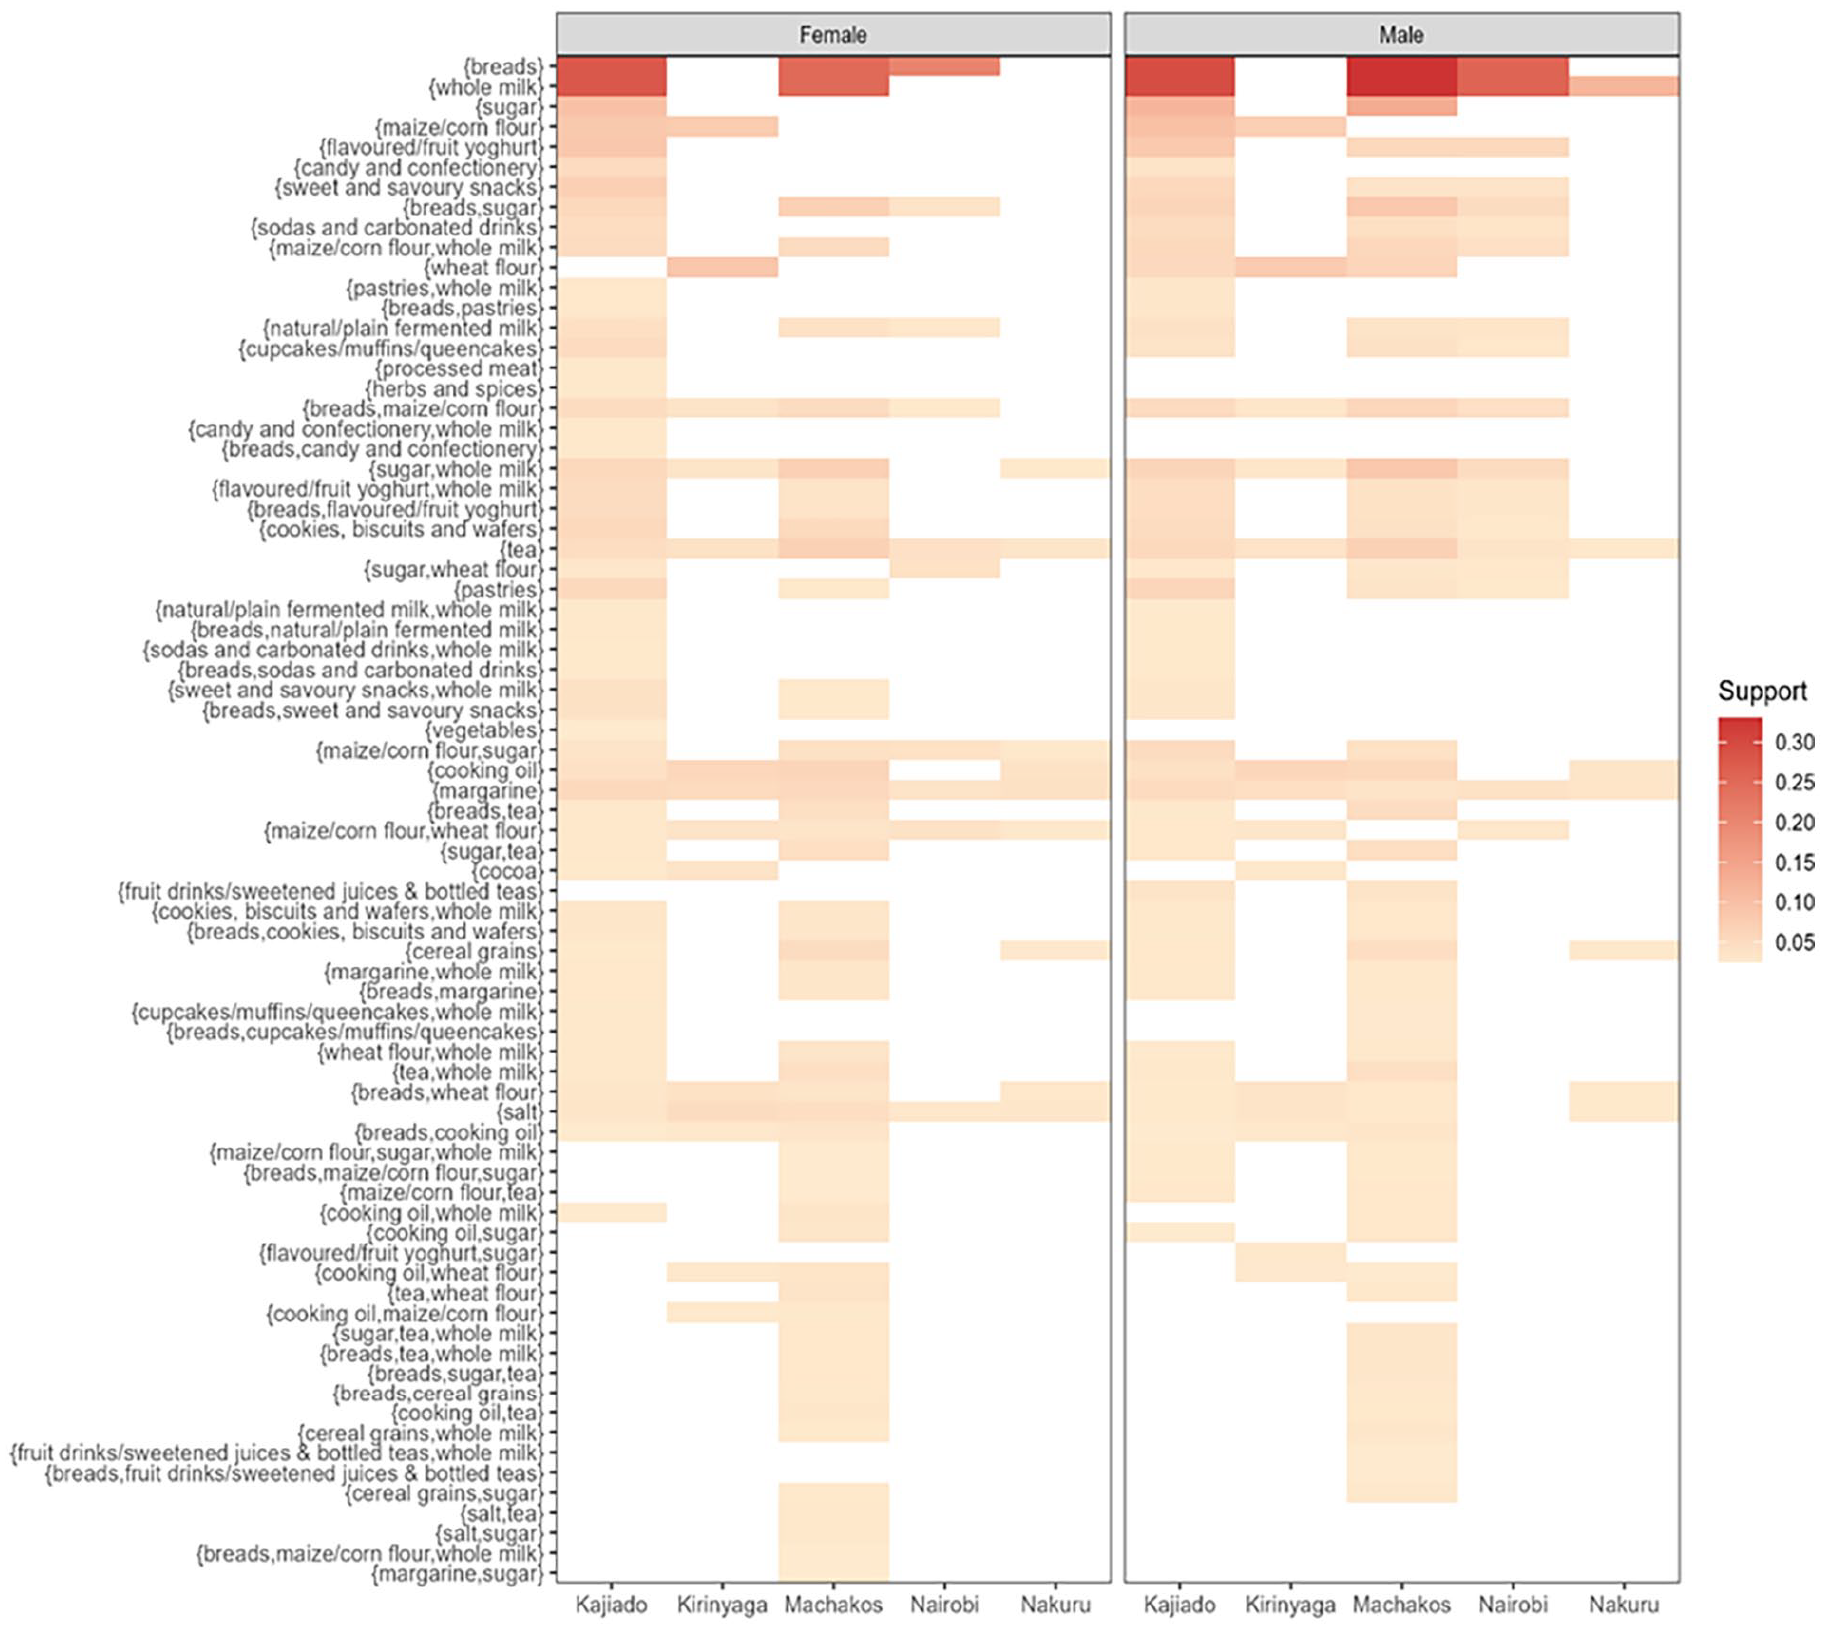
Purchase patterns associated with location and gender; support ≥0.025.
Frequent Purchase Patterns and NOVA Classes
Table 3 summarizes the proportion of food purchases found in this study according to NOVA classification and the association with gender, age, and location. Ultra-processed foods accounted for the highest purchases (53.440%), closely followed by unprocessed/minimally processed foods (35.228%) and processed culinary ingredients (10.468%) while processed foods accounted for the least purchases (0.864%).
Processed foods
Males in the age groups of 36 to 49 and above 50, especially those located in Kirinyaga, purchased a higher proportion of salted/sugared nuts and malt drinks compared to females. Meanwhile, females purchased a higher proportion of tomato paste, bacon/ham, and cheese compared to males. There was no significant gender difference in the purchases of canned pulses (dry peas, lentils, beans), processed fish, and canned corn kernels.
Processed culinary ingredients
Females in the age groups of 18 to 25 and above 50, mainly in Kirinyaga and Kajiado, purchased a higher proportion of salt and butter compared to males. Males in the age groups of 18 to 25 and above 50, mainly in Kirinyaga, purchased a higher proportion of sugar, cooking oil, cooking fat, and honey than females. There was no significant gender difference in the purchases of powdered sugar and ghee.
Unprocessed/minimally processed foods
Females above 50 years old, mainly in Nakuru, purchased a higher proportion of wheat flour, herbs and spices, fruits, pasta, fresh/fruit juices with no added sugar, vegetables, red millet flour, red meat, eggs, pulses (dry peas, lentils, beans), poultry, natural/plain yogurt, root vegetables, dried fruits, fish, and organ meat compared to males. Males in the age groups of 18 to 25 and above 50, mainly in Nairobi and Machakos, purchased a significantly higher proportion of whole milk, tea, and coffee compared to females. There was no significant gender difference in the purchases of porridge flour, milk powder, and raw nuts.
Ultra-processed foods
Males in the age groups of 26 to 35 and above 50, mainly in Nairobi and Kajiado, purchased a higher proportion of bread, sodas, fruit drinks/sweetened juice, pastries, and energy drinks compared to females. Females in the age groups of 26 to 35 and 36 to 49, mainly in Kirinyaga, purchased a higher proportion of flavored/fruit yogurt, sweet and savory snacks, cookies, biscuits and wafers, pre-prepared food, margarine, processed meat, marble cakes, cakes, chocolate, diluting juice, noodles, table sauces, ice cream, breakfast cereals, jam, sweet rolls/buns, peanut butter, cooking sauces, processed poultry, soya chunks/mince, and chocolate spreads compared to males. There was no significant gender difference in the purchases of cocoa and malt drinks, milk drinks, flavored fermented milk, soya drinks, and dessert sauces.
Discussion
To the best of our knowledge, this is the first study in Kenya to use grocery data to examine supermarket purchasing patterns at individual level in Kenya. This is also the first study in Kenya that utilizes the NOVA food classification to examine individual food purchasing patterns.
Our results show that, generally, females bought more healthy food items (unprocessed according to NOVA classification) than males, especially females above 50 years of age. This was a trend among elderly women in Nakuru. These findings concur with those of, 23 who also found that females in Hungary tend to prefer healthy and less processed foods than males. This might be because Nakuru County is well known for farming, according to the Nakuru County Government (2021). Males who had a trend of purchasing slightly healthier foods or relatively unprocessed food items were in the age groups of 18 to 25 and above 50, mainly in Nairobi and Nakuru. The reason for this trend might be that males between 18 and 25 are not yet in the working class, and those above 50 are out of the working class; therefore, they will be at home to eat farm produce, especially those who live in Nakuru, which is a farming community. This trend concurs with the findings of, 32 who found that people in the rural or peri-urban areas of Scotland tend to buy healthy foods.
In terms of industrially processed foods, males in the age groups of 26 to 35 and above 50, mainly in Nairobi and Kajiado, purchased a higher proportion of unhealthy, highly processed foods compared to females. These results concur with the findings of, 23 where they also found that males in Hungary were the main consumers of unhealthy foods. This might be because Nairobi and some parts of Kajiado, like Ngong, are urban and known for tourism. 31 found that food consumed away from home tends to be less healthy, and 32 found that households in urban settings tend to buy less healthy foods. In another investigation in South Africa, 33 found that middle-SEA shoppers in urban settings spent more on unhealthy foods. On the same note, females who were more interested in unhealthy foods were in the age groups of 26 to 35 and 36 to 49, mainly in Kirinyaga. This age group is mainly in the working class and tends to purchase food away from home, which, according to, 31 is often less healthy.
Overall, we found that consumers were purchasing more ultra-processed foods, as 53% of the food transactions were ultra-processed foods. This might be due to the fact that foods in supermarkets are, to a large extent, unhealthy. This was also found in Indonesia in an investigation conducted by. 31 Another research conducted by 35 in Brazil found that lower prices of ultra-processed foods in supermarkets contributed to their higher consumption. Research conducted in Kenya by 37 showed that supermarket purchases increased the consumption of highly processed foods at the expense of unprocessed foods.
From the results of this study, we observed that consumers in these 5 counties are generally purchasing ultra-processed foods. These foods are unhealthy, and the trend of purchasing them was especially observed among males above 50 years of age across all counties. There might be a need to investigate why these males had these purchase trends. Research conducted by 6 showed that these foods contribute to surging rates of obesity, which are risk factors for NCDs. With this understanding we recommend that policymakers can create policies that: (1) discourage consumers from buying unhealthy foods by using technology to raise awareness about unhealthy foods; (2) encourage consumers to purchase healthy foods by reducing taxes on farm produce and all materials needed for fresh agricultural produce; (3) create affordable medical insurance for older people who are mainly affected by NCDs; and (4) promote the consumption of healthy foods in the fast food and tourism industries.
Our study had some limitations. First, the study focused on shoppers in a tier 2 supermarket with 10 branches and did not consider alternative traditional food purchasing outlets such as kiosks, open-air markets, and street vendors. Second, the grocery data was drawn from 5 counties out of the 47 counties in Kenya; therefore, the data might not be representative of other regions in Kenya.
Conclusion
This study focused on gaining valuable, hidden and previously unknown insights from transactional records of 10 supermarkets in 5 counties in Kenya. The main aim was to determine the relationship between demographic differences in supermarket purchasing patterns in LMICs like Kenya and the rise of NCDs. While there have been some studies across the world looking into similar topics, to our knowledge, this is the first study in Kenya to examine real supermarket transactions using individual purchase records.
General results showed that males aged above 50 in all counties were purchasing unhealthy foods more than females of the same age, which might lead to a higher prevalence of NCDs among this demographic. Additionally, the results indicated that 53% of the food purchase transactions were for ultra-processed (industrially processed) foods, which other research has linked to NCDs.
In light of these findings, we recommend that policymakers implement measures to: (1) discourage consumers from buying unhealthy foods by raising taxes on these items in urban areas or by using technology to raise awareness about unhealthy foods; (2) encourage consumers to purchase healthy foods by reducing taxes on farm produce and materials needed for agricultural production; (3) create affordable medical insurance for older people who are primarily affected by NCDs; and (4) promote the consumption of healthy foods in the fast food and tourism industries. Lastly, there is a need for targeted policies such as sugar-sweetened beverage taxation to curb consumption of unhealthy processed foods.
Footnotes
Acknowledgements
The authors would like to thank the African Population and Health Research Center for financial support and the supermarkets for providing the data.
Authors’ contributions
RM - Data management, data analysis, and drafting of the paper; SC - conceptualization and oversight of the study; AK - conceptualization and oversight of the study; HOO - Literature review; MN - ethical issues and critique of the manuscript; GA - critique of the manuscript; TDK - drafting of the paper.
Availability of data and material
The datasets generated during and/or analyzed during the current study are available from the corresponding author on reasonable request. Source code available from github.
Declaration of Conflicting Interests
The author(s) declared no potential conflicts of interest with respect to the research, authorship, and/or publication of this article.
Funding
The author(s) received no financial support for the research, authorship, and/or publication of this article.
Ethical considerations
This study was approved by the Amref Ethics and Review Committee (ESRC; approval no. AMREF-ESRC P1526/2023) on November 15, 2023.
Consent to participate
Not applicable
Consent for publication
Not applicable