
Abstract
We examined the association among basal metabolic rate (BMR) as well as dietary intakes of vitamin D (Vit D) and calcium on body composition and bone mineral density (BMD) after spinal cord injury (SCI). Cross-sectional design. Veterans Affairs Medical Center, Richmond, VA. About 33 individuals with chronic SCI who recorded their food consumption 3 days per week for 2 weeks. BMR was measured after 10 to 12 h of overnight fast. Average daily vit D and calcium intakes, and total caloric intake were recorded and analyzed using the Nutrition Data System for Research (NDSR) software. Fasting blood analysis for 25-hydroxyvitamin D (25[OH]D) status and Triiodothyronine (T3) status was performed (n = 10). Total and regional BMD, % fat mass (FM), and % lean mass (LM) were measured by dual X-ray absorptiometry scans. Participants consumed less than the Institute of Medicine (IOM) recommended daily allowances (RDA) for vit D (600-800 IU) and calcium (1000-1200 mg) for adults. BMR was positively related to total-lean mass (r = .62, P = .0001; n = 32) and leg-lean mass (r = .51, P = .003; n = 32). Adjusted BMR was negatively related to BMD of the left (r = −.38, P = .047; n = 28) and the right (r = −.41, P = .032; n = 28) proximal tibia. Vit D intake was negatively related to percentage total-FM (r = −.33, P = .07; n = 29) and legs-%FM (r = −.37, P = .047; n = 29). Multivariate regression models indicated that adjusted BMR explained the variance in leg fat mass (34%; P = .002) and percentage fat mass (44%; P < .0001). Persons with SCI are likely to consume less than the RDAs for vit D and calcium. BMR may explain the changes in body composition and bone metabolism. Dietary vit D should be considered as a prophylactic intervention in maintenance of bone health after SCI.
Keywords
Persons with spinal cord injury (SCI) suffer from detrimental changes in basal metabolic rate (BMR), body composition and loss in bone mass that led to neurogenic osteoporosis and possibly costly fractures and poor quality of life.
The associations between dietary intakes of vit D and calcium on body composition and bone health were determined. It is also unclear whether BMR may help to explain the changes in body composition and bone metabolism after SCI.
BMR is an important determinant of changes in body composition and bone mineral density. Persons with SCI should undergo routine nutritional consultation with a specialized dietitian to ensure that they receive the appropriate dietary intakes of Vit D and calcium.
Introduction
Neurogenic osteoporosis and altered body composition compartments are unfortunate consequences of spinal cord injury (SCI).1 -8 Bone loss progressively occurs due to mechanical unloading and lack of weight bearing which may result in sublesional skeletal fractures after SCI.4 -8 Furthermore, changes in body composition may include detrimental loss in skeletal muscle mass, increase ectopic adiposity and fat mass. 9 The loss in lean mass is likely to be accompanied by decrease in basal metabolic rate (BMR).10,11 BMR is defined as the minimum energy required to maintain whole body homeostasis and function of different systems during rest or at basal conditions. Persons with SCI are characterized by 30% to 40% lower BMR compared to healthy able-bodied controls with a range from 1200 to 1500 kcal/day.2,10,11 A basic physiological assumption is that decreases in BMR may result in a disruption in energy balance and further predisposes to increase adiposity after SCI.10,11 Considering the significance of BMR, several prediction equations have been developed and validated in persons with chronic SCI to accurately estimate BMR. 11 In aging population, reduction in BMR has been considered as a predisposing causality factor to the development of osteoporosis; however, this has yet to be established after SCI. 12
Furthermore, a high prevalence of vitamin D (Vit D) deficiency has been demonstrated in persons with SCI with a propensity for secondary health outcomes.13 -17 Up to 93% of those with SCI have inadequate vit D compared to about 40% in the general population.13,14 Vit D influences skeletal and extra-skeletal activities, such as bone metabolism, endocrine, cardiovascular, neurological, immunological, infectious disorders, and cancers.14 -17 Vit D is primarily synthesized in the skin through exposure to sunlight, a diet rich in vitamin D may adequately serve the SCI persons with limited sunlight exposure if consumed in appropriate proportions. Dietary sources of vit D include fortified dairy products, fruit juices, cereals, and natural foods such as egg yolks, and fatty fish (mackerel, salmon). The recommended daily intake of Vit D for persons in the general population is 600 IU (15 mcg/day) for adults up to age 70 and 800 IU (20 mcg/day), after age 70. 18 However, dietary vit D intake recommendations are inconclusive for persons with SCI. Furthermore, previous work noted reasonable association with dietary vit D intake and metabolic profile after SCI. 19 There is still a lack of evidence on whether vit D or calcium rich diets may influence the association of BMR on parameters of body composition or bone health after SCI. The rationale was based on the fact that long-term efficacy of bone health-related medications has yet to be determined and most individuals with SCI are prone to medication-related complications.20 -22 Therefore, non-pharmacologic therapy, such as a Vit D-rich diet may serve as an alternative approach for bone preservation after SCI.
The current cross-sectional study aimed to examine whether BMR versus dietary intakes of vit D and calcium may play a role in altered body composition and BMD in persons with SCI. We examined calcium intake because it is crucial for bone health. 20 Vit D plays a significant role in calcium absorption, and calcium is a primary component of bones and subsequently maintains bone health. Because of a potential interaction between vit D and triiodothyronine (T3) in bone metabolism and maintenance of bone health, 23 we also determined the association between the serum levels of T3 and vitamin D (25-hyroxyvitamin D) with BMR and dietary vit D intake. The associations between dietary intakes of vit D and calcium with different health-related variables, primarily bone mineral density (BMD) and total and regional body composition parameters (lean mass and fat mass) were examined. Finally, we determined dietary adequacies versus inadequacies based on the recommended daily allowances (RDA).
Materials and Methods
Design and Setting
The study was conducted at the Richmond VA Medical Center (VAMC). The VA Institutional Review Board (IRB) reviewed and approved the study prior to enrollment. Participants were enrolled as a part of a clinical exercise trial, and measurements were cross-sectionally collected prior to the beginning of the trial. 24 Participants underwent basal metabolic rate (BMR), body composition and dietary intake assessments. Each participant had an opportunity to read and sign a consent form to indicate their understanding and voluntary participation. Each participant underwent a complete physical examination by a qualified physiatrist and was only enrolled if they met the inclusion criteria.
Participants
Thirty-three (33) individuals with chronic SCI participated in the current study (n = 27 male: n = 6 female). Participants were recruited as a part of randomized clinical trial that was conducted to examine the effects of two different paradigms of electrical stimulation exercise on cardio-metabolic risk factors after SCI.24,25 The initial findings of the trial were recently published. 25 All participants were at least 1-year post injury and had a neurological level of injury (NLI) of C5-L1 with an American Spinal Injury Association (ASIA) impairment scale classification of A, B, or C. Participants included in the study were between the ages of 18 and 65 years. Placing the maximum age at 65 avoided any potential confounding effects of nutritional deficiencies associated with aging.24,25 Participants were excluded if they had pre-existing conditions associated with vitamin D deficiency, metabolic diseases, or uncontrolled type II diabetes. They were also excluded if they were treated with insulin, had uncontrolled hypertension, cardiovascular disease, a stage 3 pressure ulcer or greater, or the diagnosis of osteoporosis. All participants underwent a physical examination and dual X-ray absorptiometry (DXA) screening. Each participant received dietary logs to record their food and drink intake for 2 weeks.
Data Collection and Procedures
Anthropometrics
Participants’ height and weight were obtained at enrollment using a PW-630U weighing scale. They were weighed in light clothing without shoes while in their wheelchairs before transferring to an adjustable mat to have their empty wheelchairs weighed. The difference between the two measurements represented the participant’s weight in kilograms (kg). The participants were placed supine on a flat mat, with the trunk aligned with the head, legs, and knees fully extended to obtain their heights. The length between two smooth boards placed at the head and heels while the participant was lying supine represented the participant’s height in centimeters (cm). Each participant’s body mass index (BMI) was calculated by dividing the body weight in kg by the square of the height in meters (m), after converting the height from cm to m.19,24 -26
Basal Metabolic Rate (BMR)
Participants were instructed to refrain from exercise, caffeine, nicotine, and alcohol at least 12 h prior to the testing period in accordance with minimal criteria for best practice BMR guidelines.10,11 Participants were escorted to either a clinical research center or local hotel to spend the night before measuring BMR in the hotel room prior to getting out of bed. Following a 12-h overnight fast, participants were woken up gently at ~6:30 AM to undergo a BMR assessment. All measurements were completed in a dark quiet thermoneutral environment (temperature between 20°C and 25°C). BMR was measured using a portable metabolic system (COSMED K4b2 Rome, Italy), and the unit was calibrated according to manufacturer guidelines.
Following calibration, a canopy was placed over the participant’s head, while they were in a supine position. Oxygen consumption was measured with continuous breath-by-breath measurements for over a 20-min period. Participants were monitored to ensure they did not fall asleep during data collection and no interruptions occurred. Data was discarded for the initial 5-min period and BMR (kcal/day) was averaged over the remaining 15 min. Energy expenditure was determined using the Weir equation. If respiratory exchange ratio (RER; carbon dioxide production/oxygen used) values were <0.70 or >1.00, participants were excluded from analysis, as such values are indicative of an inaccurate gas measurements or protocol violation.27,28
Dual-Energy X-Ray Absorptiometry (DXA)
DXA was used to measure body composition: regional and total lean mass26,29,30 Total body and regional DXA scans were performed using iLunar DXA (Lunar Inc., Madison, WI) bone densitometer at the Richmond, VA Medical Center (VAMC). After a 20-min rest on a padded table, scans were performed and analyzed by a trained, certified DXA operator using the iLunar system. Total and regional lean masses were determined using total and regional DXA software. In addition, a GE Lunar iDXA system (GE Healthcare Lunar, platform WI) scan was used to capture bone mineral density (BMD) data for the total body, distal femur, and proximal tibia. 26 A trained examiner colored out the existing hardware, if any, so it would not confound the values of BMD in the region of interest.
Calibration was performed using a phantom calibration box, simulating human tissues, to certify scan reliability and precision. All metals were removed from all participants before placing them supine on the scanning table. Arms were internally rotated with the palms facing medially. During the knee scans, a trapezoidal foot positioner was used to hold the feet in place. The trapezoidal foot positioner kept the legs rotated internally to ensure minimal overlap between the tibia and fibula. A foam block was placed underneath each knee joint to provide stability during scanning. The scan starting point was identified by placing the DXA laser pointer four-finger breadth (10 cm) from the distal border of the patella. Bone mineral content and BMD values were computed for regional hips and knee areas using the manufacturer’s software Lunar EnCore version 16 (GE Healthcare, Madison, WI). 26 The calculations of BMD were performed on the distal femur metaphysis, distal femur epiphysis, proximal tibia metaphysis, and proximal tibia epiphysis. For the proximal tibia metaphysis, a rectangular region of interest was drawn with its height set at 7% of femur length, width set to include only tibial bone (excluding fibula), and its proximal edge positioned at the uppermost point of contact between the fibular head and the tibia. A rectangular region of interest was drawn for proximal tibia epiphysis, with its height set at 10% of tibial length and width to include bone at the tibial and fibular heads with its lateral edge at the tibial plateau. Manual correction, using a brushing tool within the software, was used to assign bone pixels not automatically detected by the software. 26
Blood Analysis
Blood samples were obtained by venipuncture after an 8 to 10-h overnight fast to analyze the status of 25-hydroxyvitamin D [25(OH)D] and total T3. The blood samples were then labeled with assigned identification numbers and sent to the VA clinical laboratory for analysis using standard assays; 25(OH)D was performed using a volume of 1 ml serum by chemiluminescence. 25(OH)D test is the most accepted test for determining vit D status (sufficient vs deficient).31,32 T3 is a bioactive thyroid hormone, and it plays a crucial role in bone metabolism affecting bone turnover, and ultimately influencing bone density. 33 Therefore, serum T3 level was determined for 10 participants using 1 ml of serum collected in serum separator tube and measured by immunoassay. The cumulative volume of blood drawn from each participant did not exceed 4 ml (3 ml for 25(OH)D, 1 ml for T3), and no more than three venipunctures in any single attempt.
Dietary Intake
Participants provided dietary logs for a total of 3 days within 2 weeks to assess vit D, calcium, and caloric intakes (two weekdays and one weekend day; Supplemental Figure 1). The 3 days were based on participant’s discretion to pick two non-consecutive weekdays and a weekend day to capture any changes in dietary pattern. Before starting their dietary logs, participants received training from the team dietitian on how to log daily intakes of foods, snacks, and drinks. 27 Participants received instructions to record foods, snacks, beverages, and other drinks, consumed 3 days a week (including one weekend day) for 2 weeks. Participants met once with the dietitian at the time of admission to conduct their measurements. The first 2 weeks were chosen because, anecdotally, participants were less likely to change their dietary habits within the first 2 weeks of the study. A registered dietitian then analyzed the participants’ dietary logs for vit D, calcium, and caloric intakes using the Nutritional software (Nutritional Data System for Research (NDSR)), version 2018. Dietary vit D adequacies were determined against the daily allowances of 600 IU (15 mcg) recommended by the Institute of Medicine (IOM). 35 Similarly, calcium intake adequacy was also determined against the 1000 mg recommended daily allowance. 35 Participants completed self-reported dietary logs for the 2 weeks of the study.
Statistical Analysis
All statistical analyses were performed using the IBM Statistical Package for the social sciences (SPSS) version 27.0 (Armonk, NY: IBM Corp.). Statistical analysis included descriptive statistics (mean ± SD) for all the study variables. All variables were checked for normality using Shapiro-Wilk tests. If Shapiro-Wilk tests were significant, the study variable was checked for outliers and then the entire analysis was rerun after removal of the outliers. If there were no outliers, the Q-Q plots and the histograms were visually inspected to ensure normal distribution. The independent variables were BMR, dietary vit D and calcium intakes. Total and regional BMD as well as body composition parameters [total or regional lean mass or fat mass] were considered as the primary dependent variables as well as serum 25-hydroxyvitamin D and T3 as the secondary dependent variables. An independent t-test determined the differences in micronutrient (vit D and calcium) intakes based on participants’ NLI, injury completeness, and BMI. BMR was also adjusted to body weight to control for different body size (Adj BMR). Additionally, vit D (adj Vit D) and calcium (adj calcium) intakes were adjusted to total caloric intake to account for the size of caloric consumption among participants with SCI.
Pearson correlation coefficients determined the relationships between the micronutrients and participants’ weight, BMI, BMD, and time since injury (TSI). The regional fat mass and lean mass were adjusted to the whole-body mass. We chose the fat mass to lean mass ratio to examine the relationships between body compositions and dietary nutrients, based on recent findings that suggest an interplay between fat mass/fat-free mass ratio better explains inflammatory and metabolic profiles in persons with SCI. 22 Finally, multivariate regression analyses models were used to examine the variance in total and regional body composition and BMD after using the independent variables (BMR, vit D and calcium intakes) as predictors or adj BMR, adj vit D, and adj calcium intakes.
Results
Twenty-one (21) persons with paraplegia and 12 persons with tetraplegia participated in the study. Demographic characteristics of the participants are presented in Table 1. Distribution of the participants according to the primary independent variables are presented in Figure 1. Ten participants were on supplements during the trial (Table 2). Mean and SD for BMR, vit D and calcium intakes as well as total and regional BMD are presented in Tables 2 and 3, respectively.
Participant Characteristics, Mean (SD), and Percentages (n = 33).

SD = Standard deviation; BMI = Body mass index; % = percentages; cm = centimeter; kg = kilogram.

Distribution of the participants (n = 33) based on the primary independent variables of the study. (a) Refers to BMR (kcal/day); (b)total caloric intake (kcal/day); (c) vit D intake (mcg); and (d) calcium intake (mg).
Summary of BMR, Caloric Intake, Vitamin D, Calcium Intakes (n = 33) and Serum 25(OH)D and T3 Levels by Sex (n = 10).
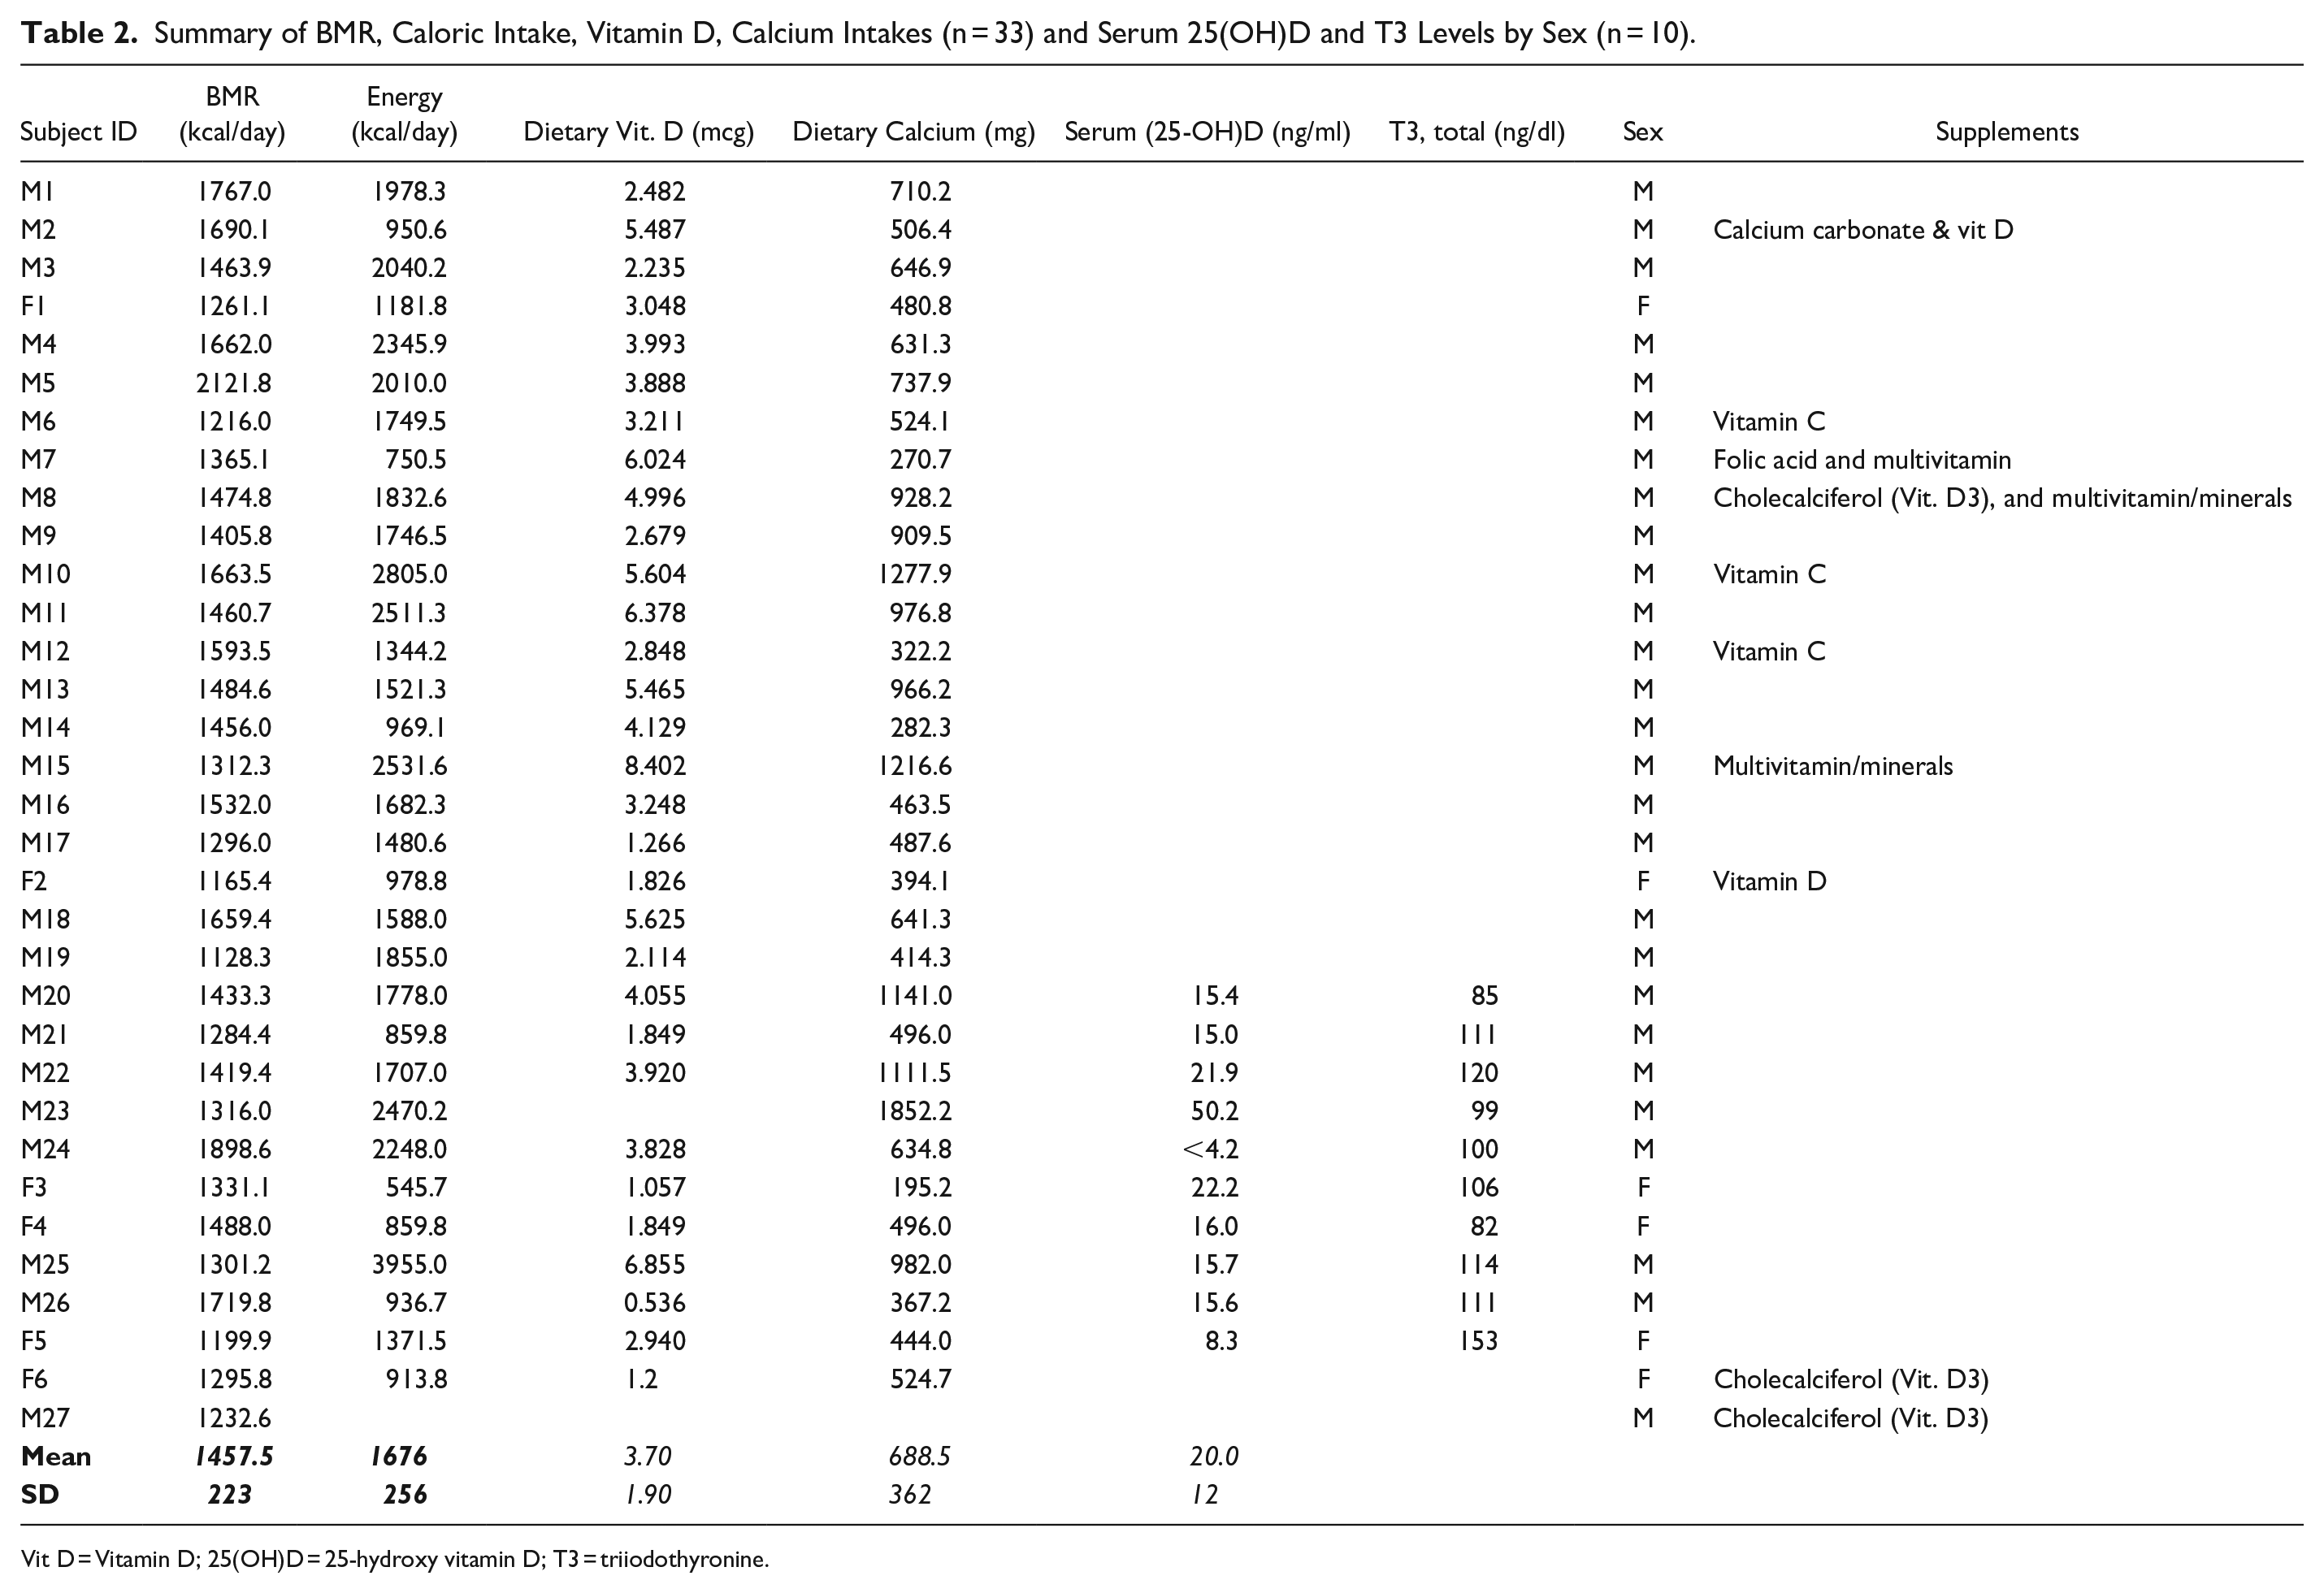
Vit D = Vitamin D; 25(OH)D = 25-hydroxy vitamin D; T3 = triiodothyronine.
Total and regional BMD as measured by DXA in persons with SCI.

BMR and Total Caloric Intake (Kcal/Day)
BMR was adjusted to body weight (adj BMR) because as anticipated body weight was related to BMR (r = .50, P = .003; n = 33). Adj BMR was 21.5 ± 4.0 kcal/kg/day. Age was negatively related to adj BMR (r = −.55, P = .001; n = 33).
BMR was positively related to total-lean mass (r = .62, P = .0001; n = 33) and leg-lean mass (r = .51, P = .003; n = 33). Adj BMR was negatively related to total-%FM (r = −.66, P = .0001; n = 33), total-FM (r = −.73, P = .0001; n = 33), legs-%FM (r = −.47, P = .006; n = 33) and legs-FM (r = −.61, P = .0001; n = 33). Furthermore, adj BMR was negatively related to the BMD of left (r = −.38, P = .047; n = 28) and right (r = −.41, P = .032; n = 28) knee proximal tibia. This relationship disappears after potentially controlling for BMI [left proximal tibia: P = .5 and right proximal tibia: P = .7]. Persons with BMI > 22 kg/m2 had approximately 23% greater proximal tibia BMD than persons with BMI < 22 kg/m2 (P = .15-.03).
An estimated 73.3% of the participants’ caloric intake was less than the USDA recommended daily requirement for adults. 24 The caloric intake of the participants was also less than daily recommendations for adults with sedentary lifestyle, regardless of race/ethnicity or gender (Table 2). The distribution of daily caloric intake is presented in Figure 1b. Caloric intake was not different by race. (Caucasian: 1578 ± 653 kcal vs African American: 1763 ± 797 kcal), or by injury classification (paraplegia: 1583.0 ± 748 vs tetraplegia: 1875 ± 653) or BMI status (≥22 kg/m2; P = .12). There was no difference (P = .18) in mean caloric intake with respect to TSI (10 years or less: 1865 ± 857 compared to more than 10 years: 1489 ± 510).
Micronutrients (Vit D and Calcium Intakes)
Thirty-three participants provided self-recorded 3-day dietary logs for 2 weeks per study protocol. About 97% (n = 30) of participants consumed 4.4 ± 4.1 mcg/day (176 ± 164 IU), which is lower than the 600 IU (15 mcg) recommended daily allowance for vit D by the Institute of Medicine (IOM). 35 Similarly, an estimated 84% (n = 26), consumed 693.8 ± 366.9 mg/day of calcium, which was also lower than the 1000 mg recommended daily allowance. 35 All participants consumed less than RDAs for vit D and calcium, as suggested by the dietary analysis. A strong positive relationship was noted between dietary vit D and calcium intakes (r = .60, P < .0001; n = 31). There was an inverse relationship between body weight and dietary vita D intake, although the relationship did not attain significance (r = −.21, P = .26; n = 31). Furthermore, vit D intake was negatively related to percentage total-FM (r = −.33, P = .07; n = 29) and legs-%FM (r = −.37, P = .047; n = 29). Finally, adjusted Vit D to body weight showed a trend of positive relationship with pelvis BMD (r = .37, P = .051; n = 28). Those who consume greater (>3.7) vit D intake had lower legs fat mass [vit D > 3.7 (n = 14): 5.7 ± 2.1 vs <3.7 (n = 15): 7.8 ± 4.0; P = .045].
Micronutrients and Physical Characteristics
The relationship between average dietary calcium intake and BMI showed a trend in the negative direction (r = −.35, n = 32, P = .052). Furthermore, there was a significant inverse relationship between dietary calcium intake and %fat to %lean mass ratio (r = −.36, P = .05; n = 30).
There was no difference in the mean dietary vit D intake by persons with paraplegia compared to those with tetraplegia (3.63 ± 1.84 vs 6.0 ± 6.7 mcg/day; P = .14). Individuals with paraplegia had lower calcium intake compared to those with tetraplegia (582.6 ± 248.6 vs 927.3 ± 471.2 mg/day; P < .05). In both groups, the average daily intake for vit D and calcium were below the RDAs described previously. There were no differences in mean vit D intake by males compared to females (4.8 ± 4.4 vs 2.14 ± 0.84 mcg/day; P = .19). Similarly, there was no difference in mean vit D intake for Caucasians compared to African Americans (5.1 ± 5.4 vs 3.60 ± 2.0 mcg/day; P = 0 0.31. However, male participants had greater calcium intake than female participants (750 ± 373 vs 402 ± 122 mg/day; P = .001).
Multivariate Regression Model Analyses for Independent Variables and Body Composition
Table 4 presents the multivariate model regression analyses for independent variables against both fat mass and lean mass. In both models, adjusted BMR explained the variance in leg fat mass (34%; P = .002), percentage leg fat mass (27%; P = .007), total fat mass (51%; P < .0001) and percentage fat mass (44%; P < .0001). On the other hand, BMR explained the variance in leg lean mass (28%; P = .014) and total lean mass (36%; P < .001). Figure 2a highlights the linear relationships between BMR and total lean mass and leg lean mass. The linear regression between adjusted BMR and %fat mass is highlighted in Figure 2b. Both vit D and calcium intakes did not explain any of the variance in body composition parameters or BMD.
Multivariate Regression Model for Independent Variables and Body Composition.

**, Predictor is statistically significant in the multivariate regression model (P<.05).

Linear regression analyses: (a) BMR versus total body lean mass (r2 = .66; P < .05; solid line) and leg lean mass (r2 = .46; P < .05; dashed line) and (b) adjusted BMR versus percentage total body fat (r2 = .22; P < .05; solid line) mass and leg fat mas (r2 = .43; P < .05; dashed line).
Serum 25-Hydroxyvitamin D-25(OH)D) Status and BMD
Of the 33 participants, serum 25(OH)D was available for only 10 of the participants. Serum 25(OH)D was 14.92 ± 5.73 ng/ml. There was no relationship between serum 25(OH)D and BMD at the distal femur or proximal tibia (Table 5). We analyzed diets in the 9 subjects for whom we had serum 25(OH)D levels and compared them with the diets of the other participants. (n = 9) [Vit D intake: 3.0 ± 2.0 mcg/day and calcium intake: 652 ± 343 mg/day] and without (n = 22) [Vit D intake: 4.0 ± 2.0 ± mcg/day and calcium intake: 659 ± 286 mg/day]. There was no interaction between the serum 25(OH)D and dietary intake (Vit D: P = .18 and calcium intake: P = .95).
Correlation Matrix for Variables of Interest Between 25(OH)D or T3 and Both Total and Regional BMD in Persons With SCI.
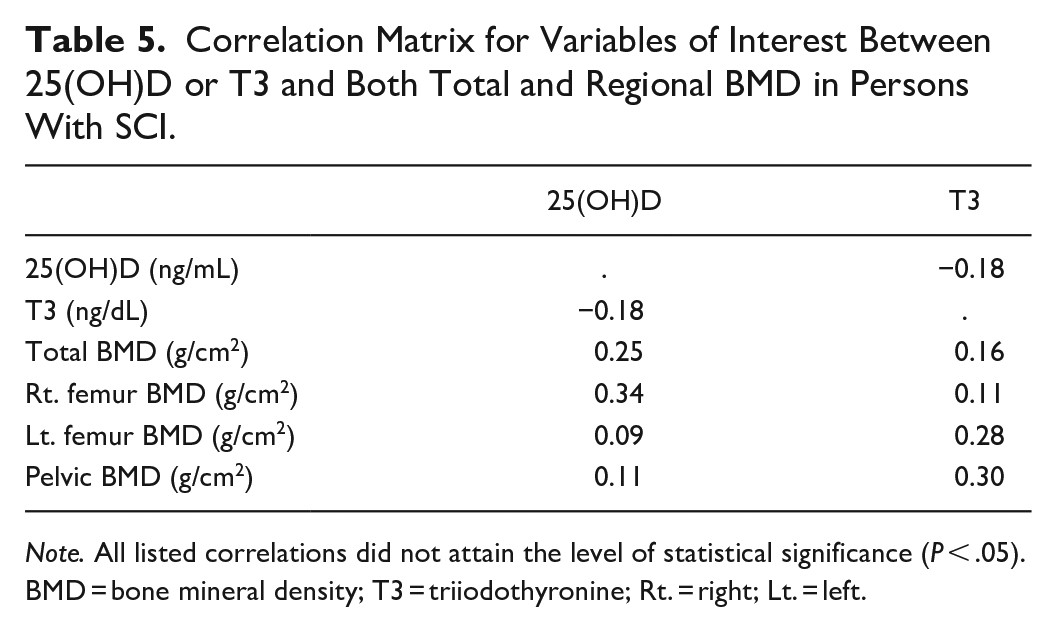
Note. All listed correlations did not attain the level of statistical significance (P < .05).
BMD = bone mineral density; T3 = triiodothyronine; Rt. = right; Lt. = left.
Micronutrients and Serum 25-Hydroxyvitamin D and T3
The mean serum level of 25(OH)D was 14.9 ± 5.7 ng/ml (n = 9). Interestingly, there was no meaningful relationship between serum vit D status and average dietary vit D intake, probably because of the small sample size (n = 9). However, among those with serum 25(OH)D (n = 9), about 78% (n = 7) were either vit D deficient or insufficient (25(OH)D < 20 ng/ml). Only an estimated 22% (n = 2) were vit D sufficient (25(OH)D) 20 to 29 ng/ml). Serum T3 (n = 10) was 108.1 ± 19.9 ng/dl and differed by gender. There were no significant relationships found between serum 25(OH)D or T3 and other BMD variables (Table 5).
Discussion
The current study examined the associations among BMR, micronutrients of dietary vit D and calcium intakes and body composition parameters and BMD in individuals with chronic SCI. The primary aim was to examine the average daily intake of vit D and calcium after SCI relative to RDAs to support bone health. The secondary aim was to determine whether BMR or micronutrients may explain changes in body composition and BMD after SCI. Persons with SCI suffer from diminished BMR and may be either malnourished or overweight contributing to the pandemic of obesity after SCI.10,11,27 BMR is necessary to maintain energy homeostasis as well as support bone formation and renewal.10,34 In the current study, decreased BMR per body weight (adj BMR) resulted in increased in percentage and total body fat mass and leg fat mass.
Major and Novel Findings of the Current Trial
The major findings indicated that the average daily intake for vit D was lower than and did not meet the recommended daily dietary allowance of 600 to 800 IU (15-20 mcg/day) for most adults.18,35 Our result was consistent with earlier reports.36,37 Koutrakis et al, 36 observed that the diet of 98% of the participants in a cross-sectional study of 174 individuals with chronic SCI contained less than the IOM recommended daily allowances for vit D. Additionally, BMR was related to parameters of body composition and BMD. It is worth noting that adj BMR was negatively associated with BMD at the proximal tibia. However, the relationship was clearly confounded by BMI. Persons with BMI > 22 kg/m2 had greater BMD in the proximal tibia. This is a highly vulnerable site for low impact bone fractures after SCI.6 -8 Exploring the potential role of diminished BMR and development of osteoporosis has recently been explored in aging populations and other clinical populations. The current study is likely to offer insight on the potential role of BMR in bone health after SCI. 12 Finally, dietary vit D intake is likely to play an influential role on body composition and is negatively associated with fat mass after SCI.
BMR and Caloric Intake
Energy from food provides the necessary calories to fuel muscle contractions and maintain bone health. The USDA recommends daily caloric intake estimates of 2400 kcal/day for adult males with a sedentary lifestyle who are 18 to 60 years old and 2000 kcal/day after age 60. 35 In the current study, the average caloric intake by participants varied widely from a minimum of 545.7 kcal/day to a maximum of 3955 kcal/day. Persons with SCI suffer from diminished BMR as result of loss in lean mass and reduction in the level of physical activity.10,11 Adj BMR may offer insights on the increased percentage total and regional fat mass in persons with SCI. Those with adjusted BMR lower than 21.5 kcal/kg/day had greater percentage total (15%) and percentage leg (10%) fat mass. This may suggest that low BMR is considered a cardio-metabolic risk factor in persons with SCI.
Farkas et al 2 provided SCI-specific factor of 1.15 to provide an estimate of the daily required total energy expenditure based on the measured BMR (daily total energy expenditure = BMR × 1.15). Failure to accurately calculate the daily energy needs would further result in energy imbalance as well as increasing the energy surplus that is likely to increase body fatness. 10 Body fatness has been negatively linked to further decrease in BMR after SCI. 27 Additionally, individuals with SCI tend to adopt sedentary lifestyles due to mobility limitations.
Considering the prevalence of osteoporosis and other comorbidities, we explored the possibility that BMR may contribute to the variance in body composition and bone health parameters in this population. Previously BMR genes were considered an instrumental variable in the process of developing osteoporosis. 12 However, the exact mechanism has yet to be deciphered. The current study offers new insights that indicates that a low BMI is a risk factor for osteoporosis. 38 Low BMI may be associated with either reduction in BMR or malnutrition after SCI.10,27 Conversely, increased caloric intake leads to unnecessary energy surplus which is often associated with multiple comorbidities, such as osteoporosis, obesity, vit D deficiency, type II diabetes mellitus, and cardiometabolic diseases.1,6,9,39 Therefore, the findings highlight the need to accurately measure BMR to support skeletal and extra-skeletal health after SCI. 11
Dietary Vit D Intake After SCI
The rationale of the study relies on the fact that most therapeutic exercise and pharmacological interventions have variable responses in persons with SCI. 11 Consequently, the efficacy and sustainability of bisphosphonates are not well established for persons with SCI at risk for fracture. For example, in a double-blinded randomized control trial in an acute SCI state, Zoledronic acid decreased bone loss at the hips but not at the knees, which are the most vulnerable sites for rapid bone loss and fractures after SCI.12,13 Therefore, searching for a prophylactic source of enhancing vit D metabolism may augment other established interventions, attenuate the increase in fat mass and prevent bone loss after SCI.
Dairy products can serve as viable sources of vit D and calcium for persons with SCI because they are often fortified with vit D.40 -44 However, individuals with SCI are ill-advised to restrict or avoid dairy products to decrease their risk of developing kidney stones. 42 This observation highlights the need for proper dietary education for persons with SCI and their caregivers. In a continuing survey of food intakes by individuals (CSFII) and the third national and nutrition examination survey (NHANES) conducted in the US from 1988 to 1994 (NHANES) and 1994 to 1996, 1998 (CSFII), and in recent studies, there was no difference in dietary vitamin D intake relative to gender.43 -45 However, in one study in the United Arab Emirates, 70% of female students surveyed did not consume vit D-rich foods. 46 Similarly, a Canadian study reported low dietary vit D intake by individuals with chronic SCI. 37 Another US team reported insufficient calcium and dairy product intake by community-dwelling individuals with paraplegia. 41 More studies are needed to elucidate dietary vit D consumption based on gender, race/ethnicity, AIS impairment scale, and BMI status among persons with SCI.
Vit D intak edeficiency among the participants of the current is study also differed by TSI. Individuals with 1 to 10 years of TSI consumed a mean of 4.8 ± 5.0 mcg/day of vit D in their diet compared to a mean of 3.3 ± 1.3 by those whose TSI was greater than 10 years, suggesting a conscious effort to follow a healthy diet at the initial phase of injury and slacking off at later years. Interestingly, in the sample studied, after 30 years of TSI, the mean dietary intake of vit D mirrored those in the 1 to 10 TSI category, but the sample size was very small (n = 2). Therefore, it is necessary to conduct further studies with a larger sample size to determine the influence of TSI on dietary intake of vit D. T3 is a thyroid hormone that plays a vital role in bone resorption and osteoblast activities.52,53 Depressed thyroid status is likely to prolong the bone remodeling cycle. Conversely, hyperactive thyroid conditions are likely to shorten the bone remodeling phase leading to high bone turnover. 53 For participants in the current study, T3 was analyzed by chemiluminescence assay and reported as total T3 in ng/dl. None of the participants in this study had abnormal thyroid function as reflected by the serum T3 values (Table 2).
The generally recognized biomarker for vit D status is the serum 25(OH)D concentration.47 -49 Serum 25(OH)D is the primary circulating form of vit D. However, there is no consensus on defining the cutoff level of serum 25(OH)D as vit D deficiency after SCI. Based on the current guidelines, vit D deficiency is defined as serum 25(OH)D level < 12 ng/ml, and 12 to 20 ng/ml is considered insufficient, while a level > 20 ng/ml is sufficient.40,49 Of the 9 participants, only 2 had sufficient vit D (25(OH)D, 21.9-22.2 ng/ml). The other 7 participants were either vit D deficient or insufficient (serum 25(OH)D between 4.2 and 16 ng/ml). Despite a small sample size (n = 9), the findings were consistent with earlier findings.13,48,50 Similarly, Flueck and Perret noted a range of 32% to 93% of persons with chronic SCI having vit D insufficiency or deficiency in an analysis of 16 published studies. Javidan et al reported a prevalence of 53.1% among Iranians with SCI, while Wang et al found a 52.5% prevalence of vit D deficiency in studies of persons with SCI.48,50 The male participants in the current study had lower serum 25(OH)D mean than the female participants (14.63 ± 5.73 ng/ml for males vs 15.50 ± 6.96 ng/ml for females; P > .05). In a UK study, a higher prevalence of vit D deficiency was reported among male participants at the time of hospital admission compared to female participants (28% in males vs 11.8% in females). 51
Dietary Calcium Intake and SCI
Calcium intake was lower than the 1000 to 1200 mg/day recommended by IOM for adults. 18 This finding supports earlier reports in the literature.13,36,54 The average daily calcium intake was higher among those with tetraplegia compared to those with paraplegia. In the study of Iranians with SCI, the calcium intake was roughly the same between tetraplegics and paraplegics. 48 The disparity in dietary consumption by those with paraplegia in the current study and the Iranian study could reflect the differences in the sample size (21 paraplegics in the current study vs 65 in the Iranian study), location, and differences in local food choices. 48
The current study also demonstrated a difference in calcium intake for males compared to females. An estimated 94% of male participants consumed 750 mg/day, similar to what observed by Tomey et al 41 who reported that males with SCI consumed a mean daily dietary calcium of 755 mg/day. Furthermore, the observed significant inverse relationship between dietary calcium intake and %fat to %lean mass ratio may suggest the potential role of this ratio as a prognostic factor of cardio-metabolic dysfunction and bone health after SCI. 30
Limitations
The primary limitation is the small number of participants. Due to the complexities associated with SCI, we were unable to recruit the anticpated sample size. The original intention was to recruit 48 participants; however, the trial was prematurely ended because of the COVID-19 pandemic as well as funding constraints. The findings offer new insights into the potential role of BMR and dietary micronutrients on body composition and bone health for SCI population. Secondly, this cross-sectional observational study analyzed dietary data at a single point in time and is unlikely to assume causality. Therefore, it is crucial to do a longitudinal study to provide dietitian with the opportunity to train and coach persons with SCI on the utility of vit D and calcium-rich diets. In the current study, we collected blood samples on 10 participants because of budgetary constraints. However, Koutrakis et al 36 examined 174 community-based participants and noted that level and completeness of SCI, TSI, mobility, percentage total body fat, and other comorbid diseases were not associated with plasma 25(OH)D.
The fact that participants in the present study failed to achieve the RDA for vit D offers potentially new information to propel the need to make dietary coaching by a registered dietitian the standard of care, not only during acute rehabilitation but throughout the life span of the person with SCI. A consistent diet would offer stable maintenance of vit D status as opposed to fluctuations due to seasonal weather variations (winter vs summer) or geographical latitudes.
Ten participants were on different forms of vitamins and supplements, and this may confound the results of the trial. Finally, reliance on self-reported dietary logs has been called into question due to established inaccuracies with such reporting. 55 Chen et al has previously called into question whether vit D intake is accurately presented at the levels of described food labels. Studies which examined vit D content of milk found much lower levels than labeled in the products, potentially due to laxity by regulations on fortification and standards. 56 However, the strength of self-reported dietary logs relies on the fact that they could be easily administered in home settings especially for clinical populations with SCI. 27
Conclusion
As highlighted in this study, persons with SCI consumed fewer micronutrients than the general population. An estimated 98% of the participants consumed less than the IOM RDAs for vit D. Furthermore, BMR may likely explain the changes in body composition parameters and bone BMD compared to vit D or calcium intakes. Adjusted BMR may serve as a potential predictor of cardiometabolic risk factors in persons with SCI. Likewise, the calcium and caloric contents in the diet reported by most participants were below the RDAs. We hope that the findings will highlight the significance of measuring BMR and awareness of nutrient deficiencies in persons with SCI. Clinicians may need to address dietary requirements during the acute phase of injury and throughout the lifespan of a person with SCI. They should consider dietary vit D as a primary prophylactic standard of care for all individuals with SCI, especially those with severe mobility limitations and have limited access to sunlight exposure or vit D supplementation.
Supplemental Material
sj-docx-1-inq-10.1177_00469580241278018 – Supplemental material for Basal Metabolic Rate Versus Dietary Vitamin D and Calcium Intakes and the Association With Body Composition and Bone Health After Chronic Spinal Cord Injury
Supplemental material, sj-docx-1-inq-10.1177_00469580241278018 for Basal Metabolic Rate Versus Dietary Vitamin D and Calcium Intakes and the Association With Body Composition and Bone Health After Chronic Spinal Cord Injury by Ifon E. Dora, Refka E. Khalil, Robert A. Adler and Ashraf S. Gorgey in INQUIRY: The Journal of Health Care Organization, Provision, and Financing
Footnotes
Acknowledgements
The research team would like to thank all the participants who took part in the current trial.
Data Availability Statement
Data will be available upon written request to the corresponding author and data will be released after obtaining the appropriate approval from our regulatory research office.
Declaration of Conflicting Interests
The author(s) declared no potential conflicts of interest with respect to the research, authorship, and/or publication of this article.
Funding
The author(s) received no financial support for the research, authorship, and/or publication of this article.
Informed Consent/Patient Consent
The study was approved by RIVR IRB, and all participants provided and signed written consent form that was approved by local ethical committee prior enrollment in the trial.
Trial Registration Number/Date
NCT02660073/ 11-12-2015
Grant Number
Not applicable.
Ethical Statement
All participants were provided and signed written consent form that was approved by local ethical committee.
Supplemental Material
Supplemental material for this article is available online.
References
Supplementary Material
Please find the following supplemental material available below.
For Open Access articles published under a Creative Commons License, all supplemental material carries the same license as the article it is associated with.
For non-Open Access articles published, all supplemental material carries a non-exclusive license, and permission requests for re-use of supplemental material or any part of supplemental material shall be sent directly to the copyright owner as specified in the copyright notice associated with the article.