
Abstract
Null hypothesis significance testing (NHST) in medical research is increasingly being supplemented by estimation statistics, focusing on effect sizes (ESs) and confidence intervals (CIs). This study evaluates the expression of ESs and CIs for binary outcomes. A utilitarian framework is proposed, emphasizing the number of beneficiaries and the impact level. To evaluate clinical significance, minimal clinically important risk difference (MCIRD) is proposed based on event magnitude (EM). Within this framework, risk difference (RD) is introduced as the primary measure. To assess the performance of RD, we compared its statistical power against other measures (risk ratio, RR; odds ratio, OR; Cohen’s h) in individual study scenarios, and visual information conveyance in meta-analysis scenarios. RDs maintain statistical power in comparison to other measures in individual studies. They provide clarity on the true impact of clinical interventions without compromising statistical integrity. Meta-analytic results indicate that using RDs directly enhances transparency, uncovers heterogeneity, and addresses misaligned assumptions. This approach, by quantifying clinical effectiveness under a utilitarian perspective, facilitates the applicability of research to patient care and encourages shared decision-making. The study advocates for reporting baseline risks (BRs) with RDs and recommends a standardized presentation of these statistics. In a utilitarian perspective, adopting RD as the preferred ES can foster a transparent, patient-focused research ethos. This aids in accurately presenting the magnitude and variability of treatment effects, offering a new direction in methodology.
The reliance on P-values below .05 in NHST, which prioritizes statistical over clinical significance, has limitations, prompting the proposal of ESs and CIs as alternatives; however, for binary variables, despite guidelines recommending the use of relative measures (RR, OR) as primary ESs conditioned on concurrently reporting BR and RD, this practice is often conventionally overlooked.
Our research contributes to the field by presenting a utilitarian framework emphasizing beneficiaries and impact level, introducing novel concepts like EM and MCIRD for assessing clinical significance, demonstrating the statistical power and visual clarity of RDs, and advocating for their standardized reporting alongside BRs to improve transparency and applicability in patient care.
Our research shifts the focus from statistical to clinical significance by integrating a utilitarian perspective, advocates for prioritizing RDs over relative measures for enhanced interpretation and application of clinical data, and highlights the benefits of a utilitarian approach in medical research reporting standards to support better decision-making and patient care.
Introduction
Background on NHST and Estimation Statistics
The debate on NHST has persisted,1-15 with significant scrutiny arising from the American Statistical Association’s statement 11 on the limitations and misuse of P-values. The statement highlights how P-values do not determine the probability that a studied hypothesis is true, nor the probability that observed data were produced by random chance alone. They caution against basing scientific conclusions or decisions solely on whether a P-value crosses a specific threshold (such as P < .05), advocating for a more nuanced approach that considers the full context of the study and other evidence.
In response to the limitations of P-values, emerging alternatives such as estimation statistics 5 are gaining traction. This approach, often referred to as new statistics, focuses on estimating ESs and CIs, and is considered new in comparison to traditional methods such as NHST. Here, ES is defined as a quantitative measure that describes the magnitude of difference between 2 groups, emphasizing the practical significance of treatment effects within a statistical model. The most fundamental ES measure, difference in means, is exemplified later in this section. NHST has been criticized for its binary approach, which merely confirms or rejects the presence of an effect. This new approach has emerged as a viable alternative to NHST in medical research. Most medical journals now require the reporting of ESs and their 95% CIs along with P-values when presenting results, and some even prohibit the reporting of P-values.
As an example of the successful application of estimation statistics, we present a medical decision-making case that encompasses both the concepts of statistical significance and clinical significance. Consider a physician treating a patient with hypertension who relies on coffee to remain productive at work. For simplicity, we shall focus exclusively on systolic blood pressure, acknowledging the existence of a medical condition called diastolic hypertension, which is beyond the scope of this discussion. In addition, while this scenario considers caffeine intake as an exemplary intervention, the scope of the intervention can go far beyond that and may include any pharmaceutical treatment or other medical intervention.
Recent research indicates that short-term caffeine intake increases systolic blood pressure by an average of 3.04 mmHg (95% CI, 2.11-3.96). 16 This finding, which exemplifies the principle of estimation statistics, does not report P-values. However, considering an educational facet for readers, we retrospectively computed the P-value and evaluated its statistical significance. 17 Although the computed P-value from this ES is highly significant (P = 1.18 × 10⁻¹⁰), such a mean increase in blood pressure may not always have clinical implications. In most scenarios, a mean increase of 3 mmHg in blood pressure does not lead to severe medical concerns.
The need to distinguish between clinical significance and statistical significance has been identified.18-20 As noted in such studies, clinical significance extends beyond dichotomous statistical significance, necessitating an evaluation based on quantified practical value, often referred to as clinical effectiveness. 21 This introduces the concept of the minimal clinically important difference (MCID), which denotes the smallest size of change considered clinically significant.20,22,23 Various methods, including anchor-based, distribution-based, opinion-based approaches, and literature reviews have been proposed to define MCID. Given the absence of a universal standard for MCID, opinions may vary, depending on the context. For example, if a statistically significant 3 mmHg increase in blood pressure is considered important (MCID ≥ 3 mmHg), the effect of caffeine would be classified as clinically significant. Conversely, should a 10 mmHg increase be the threshold (MCID ≥ 10 mmHg), caffeine restrictions may not be deemed necessary. Overall, it is crucial to recognize that while statistical significance is necessary, it alone is not sufficient for determining clinical significance. This example highlights the need for discernment between clinical and statistical significance and the advantage of estimation statistics over NHST in medical decision-making.
Challenges in Expressing ESs in Binary Outcomes
Despite the requirements for reporting ESs and CIs in the medical literature, issues persist, particularly regarding binary outcomes. Medical studies often report only relative measures, such as RR or OR, which alone are insufficient for medical decision-making. This inadequacy is illustrated in a previous study, 24 which shows different RDs for identical RRs. The study has shown an RR of 1.67 arising from risks of 0.05 in the treatment group and 0.03 in the control group in 1 case (RD = 0.02), and 0.66 in the treatment group and 0.40 in the control group in another case (RD = 0.26). Thus, if only the RR is reported, regardless of the presentation of P-values, the RD cannot be considered and clinicians cannot determine the clinical significance of the results. Consequently, clinicians may make decisions based on whether the P-value is less than the significance level, or if no P-value is given, whether the CI exceeds a certain threshold (ie, 1 for RR and OR).
Established guidelines have long recognized this issue. For instance, the latest guidance section of the Cochrane Handbook (Section 10.4.3) advocates the use of RRs, but emphasizes the concurrent reporting of BR, also referred to as assumed control risk or comparator risk. 25 This BR aided in the reconstruction of the RD from the RR. Such a reconstruction of RD is clearly observed in the Summary of Findings Table of the Grading of Recommendations Assessment, Development, and Evaluation (GRADE) system, 26 emphasizing that the simultaneous consideration of an RD and RR is not a choice but a necessity. Similarly, the Consolidated Standards of Reporting Trials (CONSORT) checklist recommends presenting the RD and RR.27,28
However, a gap exists between these guidelines and actual practice. Many meta-analyses predominantly report relative measures without BRs and do not report concurrent absolute measures. This omission aligns with the issues raised in 2 previous studies.24,29 The uncertainty in BR affects RD estimation, 29 and in the worst-case scenario, where BR is not provided, reporting only RR may not be useful. 24 These issues, coupled with the divergence between guidelines and practice, call for a re-evaluation of current reporting practices in medical statistics.
Objectives of This Study
The primary objective of this study was to establish a conceptual framework for clinical significance in binary outcomes from a utilitarian perspective. By depicting 2 RCT scenarios, we demonstrate how the new concept of MCIRD is defined based on another novel concept, event magnitude (EM). Also, we aimed to compare the statistical power of RD and other popular measures of ES. Finally, by conducting meta-analyses with simulated data, we compared information conveyance on clinical effectiveness between RD and RR. This study did not cover the following topics. While the concept of the number needed to treat (NNT) is an important derivative of RD, discussions on NNT were set aside to focus primarily on RD itself. Moreover, considerations related to observational studies were not addressed, with the focus being limited to RCTs and their meta-analyses.
Methods
The nature of this study is a theoretical exploration proposing novel concepts of MCIRD and EM from a utilitarian perspective. For clarity, we briefly summarize the most commonly used ES measures, expressed in terms of the risk of the treatment and control groups denoted as RT and RC, respectively.


Here, RD quantifies the difference between treatment and control groups, reflecting the net change in risk associated with the treatment. For example, with 1000 individuals receiving treatment instead of control, an RD of −0.01 implies an average benefit for 10 additional individuals, while an RD of −0.25 signifies an average increase of 250 beneficiaries. RR measures the relative risk of the treatment group compared to the control group. OR assesses the ratio of event odds (instead of risks) between the groups. Lastly, Cohen’s h is introduced as another crucial ES measure where established benchmarks—0.2 for small, 0.5 for medium, and 0.8 for large differences—aid in interpreting ESs in the absence of specific standards. 30
Defining Clinical Effectiveness in Binary Outcomes
Quantifying clinical effectiveness for binary outcomes presents unique challenges due to the dichotomous nature of these variables. Applying a utilitarian perspective, which emphasizes the greatest good for the greatest number, allows for the quantification as the product of 2 factors:
Number of Beneficiaries: Clinical effectiveness escalates as more people benefit. Hence, within this context, ES is best represented by RD, which reflects the number of individuals benefiting from the treatment, as elaborated above. Employing other measures, including Cohen’s h, results in different numbers of beneficiaries, depending on various BR values.24,30
Value of the Benefit: Clinical effectiveness also requires distinguishing between different magnitudes of benefits. In this regard, we introduce the novel concept of EM, which quantifies the actual impact of events as defined by risk in binary outcomes. For example, the value of avoiding death differs significantly from that of avoiding a self-limiting disease, so the EM of death is much larger than the EM of a cold. By applying EM, clinical effectiveness can reflect the different nature of events the binary outcome covers.
To summarize, clinical effectiveness in binary outcomes can be expressed as follows:

Equation (1) establishes a solid framework for assessing clinical effectiveness of a medical intervention by accounting for both the number of beneficiaries and the magnitude of the benefit. If either ES or EM is zero, the clinical effectiveness of the treatment is zero. This approach facilitates nuanced comparisons between events that are less frequent and yet grave, and those that are more common but trivial. If the ES obtained from the data is statistically significant and the clinical effectiveness in equation (1) exceeds the MCID criteria, then the outcome is clinically significant. This leads to the novel concept of MCIRD, as detailed in the following subsection.
Evaluating Clinical Significance: Practical Examples
Unlike ES, which can be obtained directly from data, EM quantification is challenging. Thus, this study did not define specific values for disease-related EMs. Rather, the purpose of this study is to show that clinical significance can be properly judged only using RD values because EM values are intuitively interpreted by clinicians.
In certain medical scenarios, the EM value may be so large that even a single additional occurrence is considered intolerable. Examples include death, life-threatening conditions (such as cancer or its recurrence), severe medical events, and serious complications or sequelae, such as blindness or a vegetative state. In these instances, an extremely high EM implies that even minimal ES would result in significant clinical implications. That is, the EM in equation (1) was considered potentially infinite, aligning statistical significance with clinical significance. This concept aligns well with traditional NHST methods that rely on P-values. An appropriate example for such a scenario is the analysis of all-cause mortality. 31 Even if the ES is minimal, any treatment that demonstrates statistical significance in reducing mortality rates—also identifiable through the use of other measures that do not directly assess the number of beneficiaries—would be deemed valuable, given its potential to save even a single additional life. Note that there is an inverse relationship between EM and the MCIRD. Specifically, for events of infinitely large magnitude, such as death, the MCIRD approaches an infinitesimally small value.
Although equating an EM with infinity is relevant in certain cases, this concept may not extend universally. If efforts to quantify and compare risk are abandoned in favor of a binary approach that seeks only to reduce it, benign conditions with a small potential for malignancy, such as uterine fibroids and melanocytic nevi might be treated in the same manner as death, leading to a regression to the binary method. Relying on the NHST method, that is, considering EM as infinite, can hinder sound medical decision-making, particularly with minor outcomes such as a sore throat. 32 In such scenarios, ensuring that a significant portion (ie, the MCIRD) of individuals actually benefits from the treatment is crucial. If only a minority experiences meaningful improvement from a medication, despite its statistical significance, the clinical effectiveness of the treatment may be questioned. In short, for events of minor magnitude, such as self-limiting diseases, the MCIRD tends to be large.
This presents unique challenges for binary outcomes as opposed to continuous variables: beyond the dichotomous distinction between 0 and 1, an additional dimension—the EM—exists. To assess clinical significance in the absence of specific criteria, the benchmark values of Cohen’s h can be considered. For example, conditions with trivial EMs such as sore throats, at least medium ES (eg, |h| ≥ 0.5) might be deemed necessary for a treatment to be clinically significant. Assuming BR = 0.50, the MCIRD for h = −0.5 (
Statistical Analysis
All statistical computations were executed using R statistical software (version 4.3.2, 2023, R Foundation for Statistical Computing). The “pwr” package 33 was used for power calculations when applying Cohen’s h. The weighted least squares method was used when performing the regression analysis. For the meta-analysis, the DerSimonian-Laird random effects model was employed, utilizing the “metafor” package in R. A P-value of <.05 was considered statistically significant.
Patient and Public Involvement
Patients and the public were not (or will not) be involved.
Results
Design and Analysis for Binary Outcome RCTs: Theoretical Power Calculations
Designing a clinical trial involves multiple considerations, including statistical considerations, such as controlling type I error rate and calculating an adequate sample size. For controlling type I error rate, the probability of incorrectly rejecting a true null hypothesis (ie, approving an ineffective treatment) is critical, especially from a regulatory perspective. Regulatory agencies must ensure that ineffective treatments are not approved, making the control of the type I error rate a crucial safeguard for public health. 34
An adequate sample size is vital for clinical trials. The relationship between the sample size and statistical power is crucial. With the increasing sample size, statistical power, which is the probability of detecting a real effect, also increases. That is, the most fundamental factor affecting the ultimate goal of “clinical trial success” is the appropriate sample size. An underpowered trial may fail to demonstrate a true treatment effect, whereas an overly large sample may raise ethical issues by including unnecessary participants. Moreover, an unnecessarily large sample size can inflate statistical power, leading to the detection of trivial differences as statistically significant, similar to the caffeine example introduced in Subsection 1.1. Thus, thoroughly controlling the type I error rate and calculating the proper sample size are key elements in clinical trials, with the latter being critical to their success.
When the risk sizes of both groups are small, a small RD can lead to a relatively large estimate of relative measures. This could potentially lead to misinterpretation, in that using these relative measures in statistical testing instead of RD confers a power advantage. However, our theoretical power calculations in Table 1 show that the power differences are negligible, regardless of the measure used. For example, in a case where RT = 0.10 and RC = 0.05, a numerically large RR of 2, compared to a small RD of 0.05, does not necessarily lead to increased statistical power.
Comparison of Theoretical Powers (%) Across Various Risk Ranges and Sample Sizes in a 2-Sided Test With a Significance Level of 0.05.
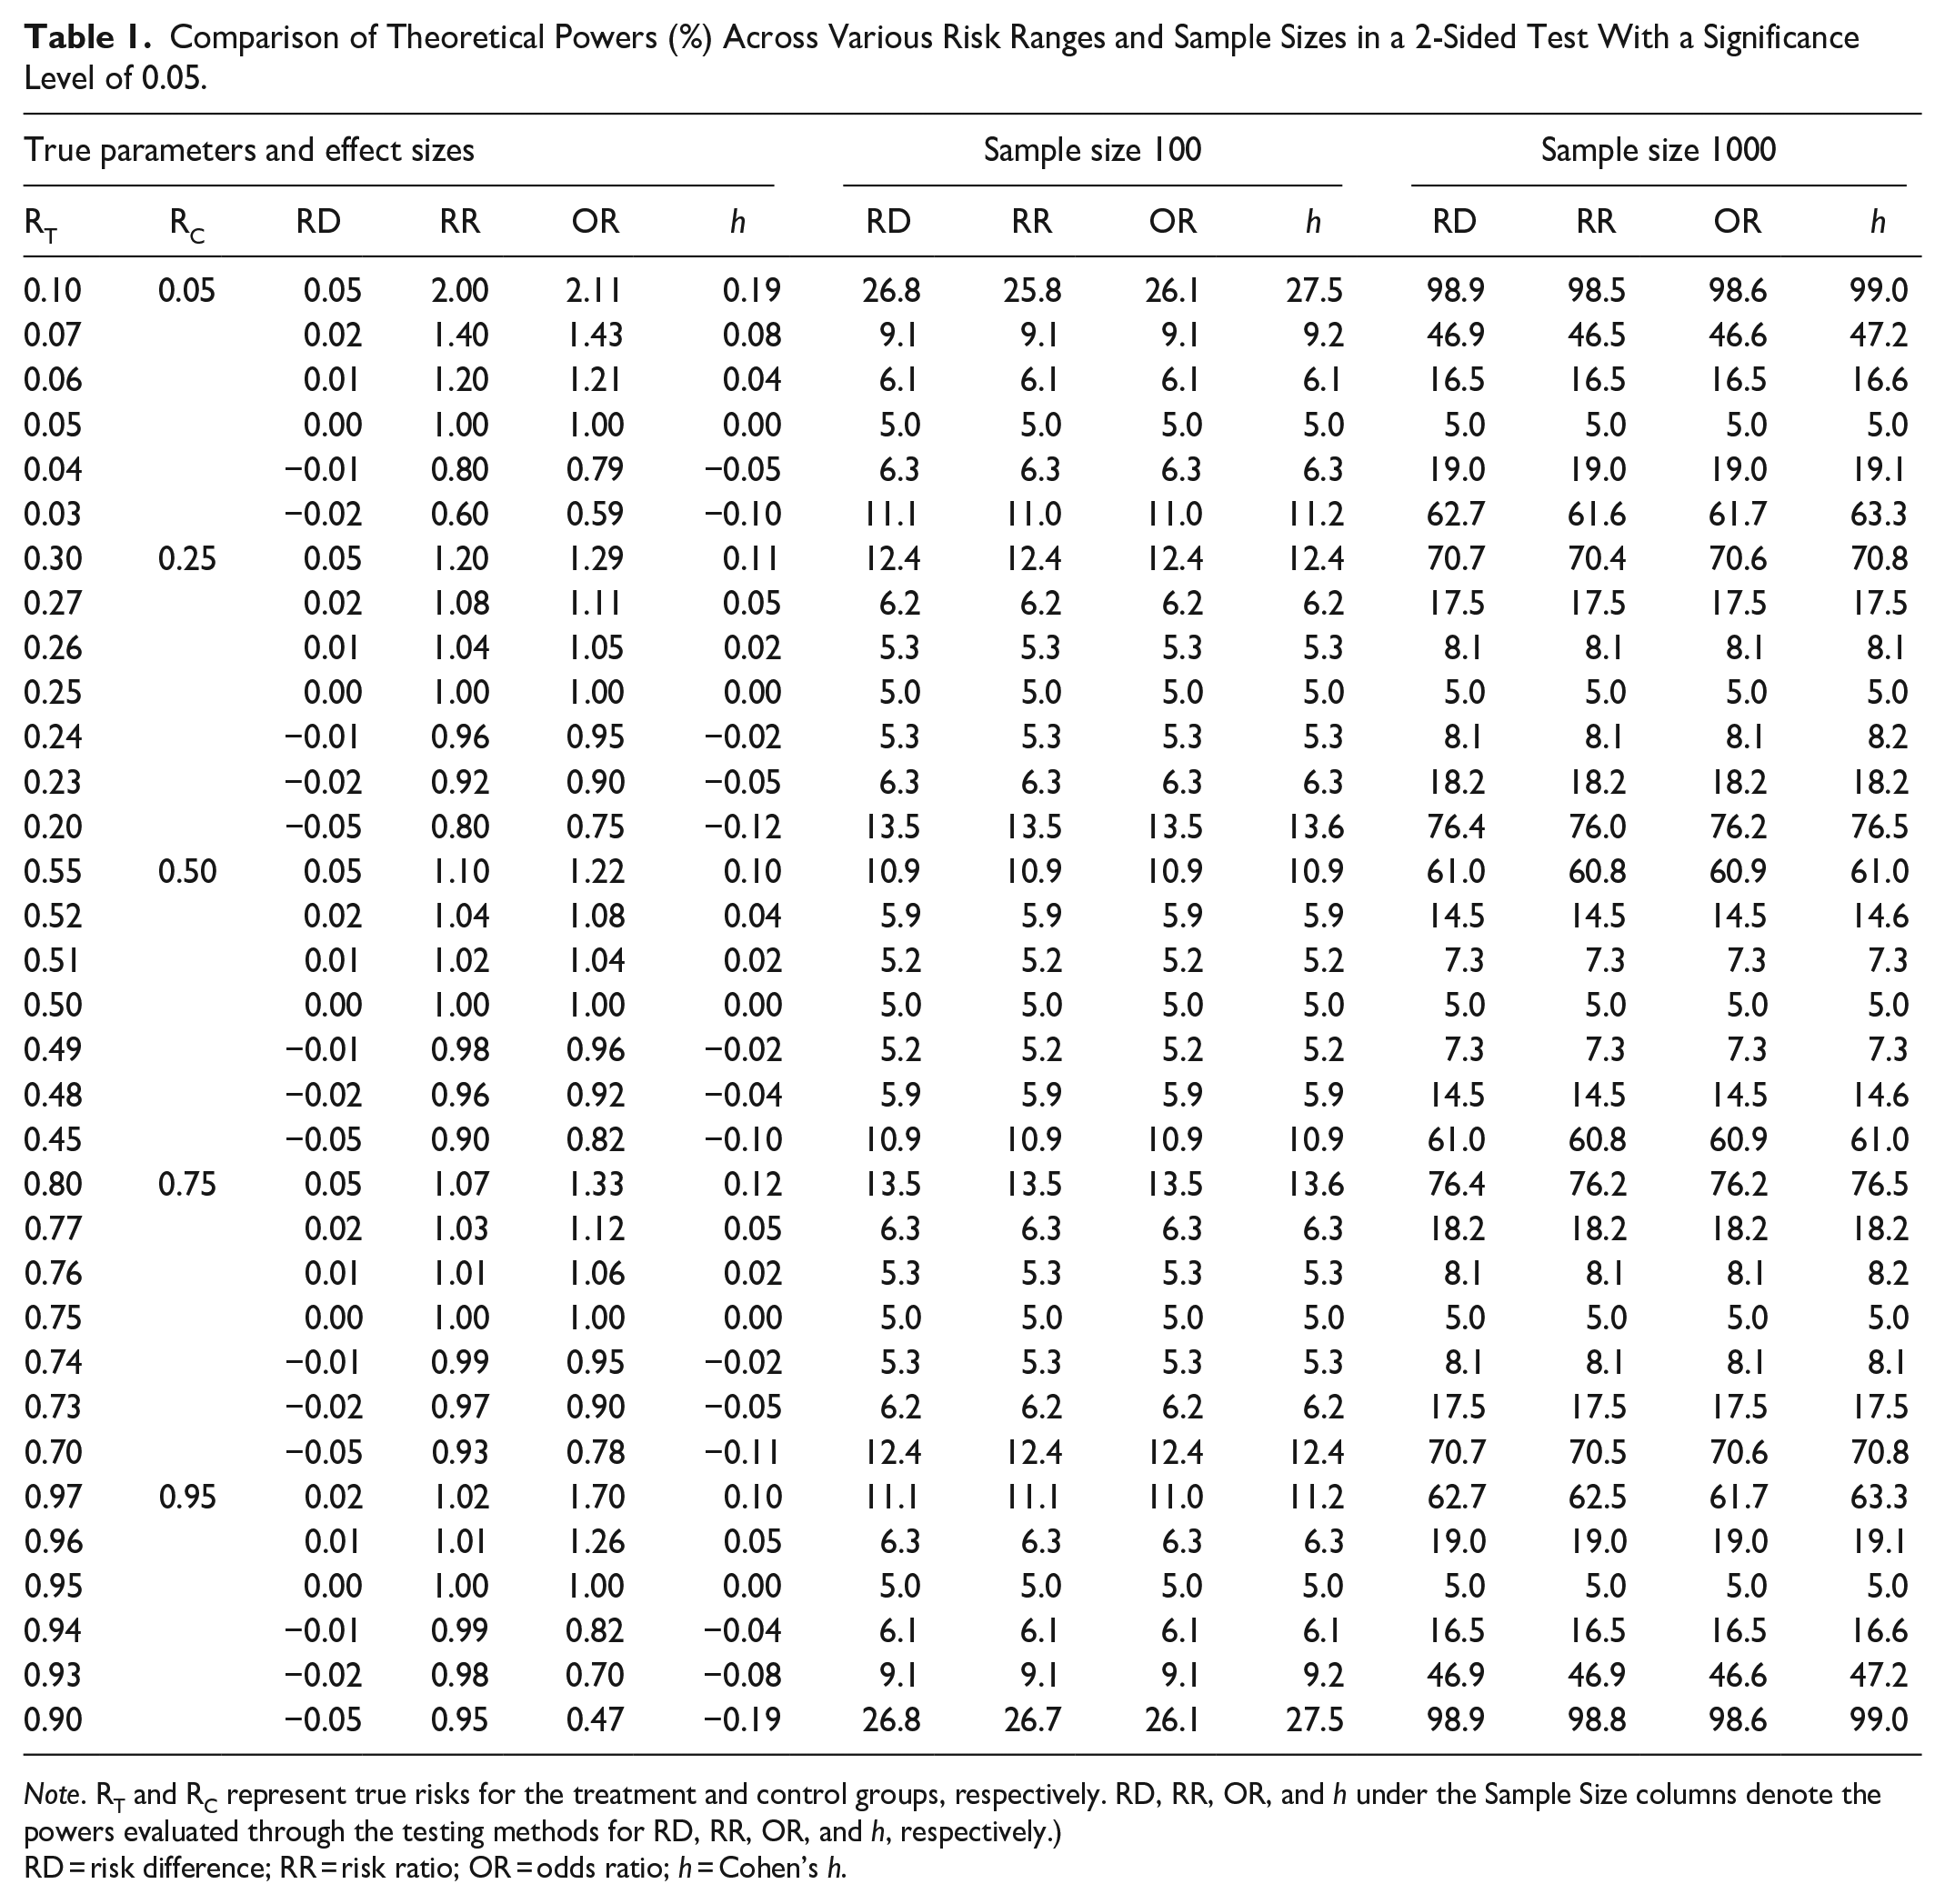
Note. RT and RC represent true risks for the treatment and control groups, respectively. RD, RR, OR, and h under the Sample Size columns denote the powers evaluated through the testing methods for RD, RR, OR, and h, respectively.)
RD = risk difference; RR = risk ratio; OR = odds ratio; h = Cohen’s h.
In Table 1, the “True Parameters and Effect Sizes” column represents the actual RT and RC values utilized in power calculations, along with the derived ESs. Here, power is defined as the probability that a clinical trial will reject the null hypothesis. Note that power calculations require the assumption of unknown true parameter values. Also, note that when parameter values are assumed under the null hypothesis (ie, RT = RC), the resulting power is referred to as the type I error rate. The columns “Sample Size 100” and “Sample Size 1000” indicate total sample sizes of 200 and 2000, with each group consisting of 100 and 1000 individuals, respectively. The ESs (RD, RR, OR, h) listed below these columns represent the powers evaluated through the testing methods for each ES measure. In all 4 methods, the type I error rate aligned with the pre-specified significance level (ie, 0.05), indicating strict control in this regard. One may observe that in the first row of the table, where the RD is 0.05 with a BR of 0.05, the probability of rejection varies considerably with sample size. Despite the same ES, with a sample size of 100, the test leads to rejection approximately once in every 4 trials, while with 1000 samples, it almost always leads to rejection. This clearly shows that P-values tend to decrease as sample size increases, even for the same ES. For more detailed information on the power calculation methods for each ES, refer to the Supplementary Material Section.
We have addressed the NHST rather than the ES in this subsection because Phase 3 clinical trials for new drugs still rely on the NHST for marketing approval, owing to the need for predefined criteria, thus mitigating potential disputes among stakeholders. The Statistical Analysis Plan predefines crucial aspects such as sample size. To some extent, this aligns with the thought behind estimation statistics. A constrained sample size ensures congruence between statistical and clinical significance as follows: First, an effective treatment will have a 95% CI for ES distant from the null value (eg, 0 for RD). Next, the increased sample size boosts statistical power (ie, shortens the CI), making it more likely that the CI will not overlap with the null value. Therefore, maintaining a moderate sample size ensures that the CI is sufficiently wide for both statistical and clinical significance to align. The desire for clinically meaningful results, as well as ethical concerns, justify the limitations of the sample size.
In summary, while the NHST is still used in some scenarios, such as Phase 3 trials, the importance of assessing ES, especially RD, remains high. RD offers slightly better statistical power and provides a more direct measure of patient impact, making it a preferred choice.
Analyzing Binary Outcome Meta-Analyses
Current guidelines generally favor the use of relative measures over RD in meta-analyses. 25 However, this preference requires further investigation.
The preference for RD among clinicians is well-grounded,35,36 particularly in view of complications that arise when relative measures and BR are used to reconstruct RD. Ignoring the uncertainty of BR when estimating RD raises concerns. 29 In meta-analyses, there is no unified method for estimating the BR. In addition to single-group meta-analyses, examples of implementing BR include using a median control group risk across studies, 26 using a pooled estimation of the entire control group data, 37 and adopting data from elsewhere. 38 In addition, using BR values from extensive observational studies is often advocated for perceived precision; however, this should be performed with caution. The narrow CI in such a study suggests a precise estimation of the mean BR of the population; however, this does not necessarily translate to a uniform BR across all individuals within that population. The risks among study participants could differ significantly. To summarize, various methods used to obtain the BR, coupled with its high individual variability, challenge the reliability of RD derived from RR and BR.
Moreover, attempts to justify the method (ie, reconstructing RD from RR and BR) by assuming the portability of relative measures, as posited in 1 study, 39 pose an additional problem: the method carries an underlying assumption that as BR increases, RD also increases (ie, petitio principii). Portability refers to the ability of a measure, such as the RR or OR, to provide consistent results across varying BRs. As shown by a previous study, 39 neither the relative measures of RR nor OR are universally portable. By visualizing the data from Figure 4 in a recent study 40 in terms of BR and RD, we can clearly verify from Figure 1 that counterexamples exist.
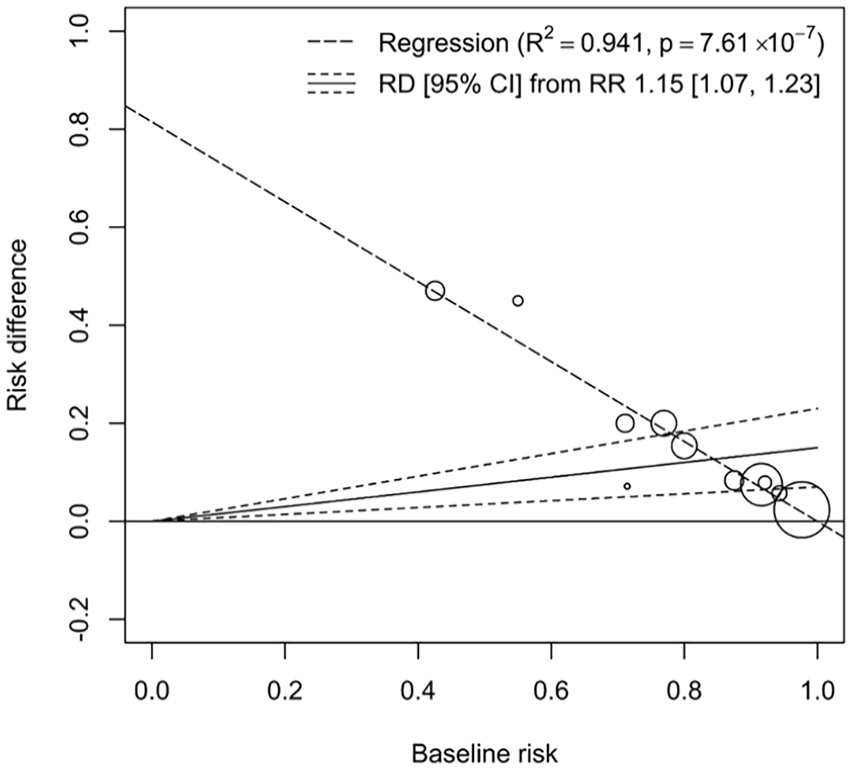
An illustration from meta-analysis data 40 using weighted least square regression shows a decline in RD as BR increases. The high coefficient of determination (R2 = 0.941) supports the linear relationship within the data, and the significant p-value of the slope coefficient (P = 7.61 × 10⁻⁷) indicates a negative slope. This finding contradicts the underlying assumption when reconstructing RD from RR and BR, that RD increases with BR.
In our analysis, we employed a weighted least square regression to examine the relationship between RD and BR using meta-analysis data. 40 The results presented in Figure 1 illustrates a notable trend: as BR increases, RD correspondingly declines. This relationship is quantitatively supported by a high coefficient of determination (R2 = 0.941), implying a strong linear relationship within the dataset, with the slope coefficient’s highly significant P-value (P = 7.61 × 10⁻⁷) further suggesting a robust negative slope. This statistical significance is critical, as it directly challenges the underlying assumption that RD should increase with BR. Also, it is counterintuitive, as noted in the findings of paper, 41 that the width of the CI for the RD would vary proportionally with the size of the BR. Given the challenges posed by the universality of portability in recent scholarly works, conceiving the idea of deriving RR consistently and applying it to diverse BRs to calculate the appropriate RD can be seen as overreaching. When data are limited, the knowledge that we can glean is also limited. Using unreasonable assumptions to reveal insights that are irrelevant may lead to biased or uncertain findings. Estimating RD directly from the data does not require this assumption, thus enhancing the transparency of the findings.
Relative measures are favored because of their generalized consistency.35,42 However, relying solely on heterogeneity tests for model selection can be misleading, as noted previously. 35 From a statistical perspective, it is important to distinguish between parameters of interest and nuisance parameters. Although heterogeneity is crucial, it serves as a nuisance parameter rather than a parameter of interest. RD performs comparably well in statistical inference. 42
In addition, the increased heterogeneity of RD can be viewed as beneficial for enhancing transparency and sensitivity. For example, Figure 2 shows meta-analyses of 2 hypothetical datasets using RR, revealing similar overall ESs for both A and B. The meta-analyses discussed in Figures 2 to 4 all used the DerSimonian–Laird random effects model. In Figure 2, both A and B are strikingly similar, not only in the forest plots but also in the overall ESs and their corresponding CIs. Without a detailed examination of the data, one might mistakenly infer that A and B represent similar treatment effects.

Forest plots of meta-analysis results for 2 hypothetical datasets, A and B, using the RR with the DerSimonian–Laird random effects model. Both A and B show similar overall ESs and CIs.
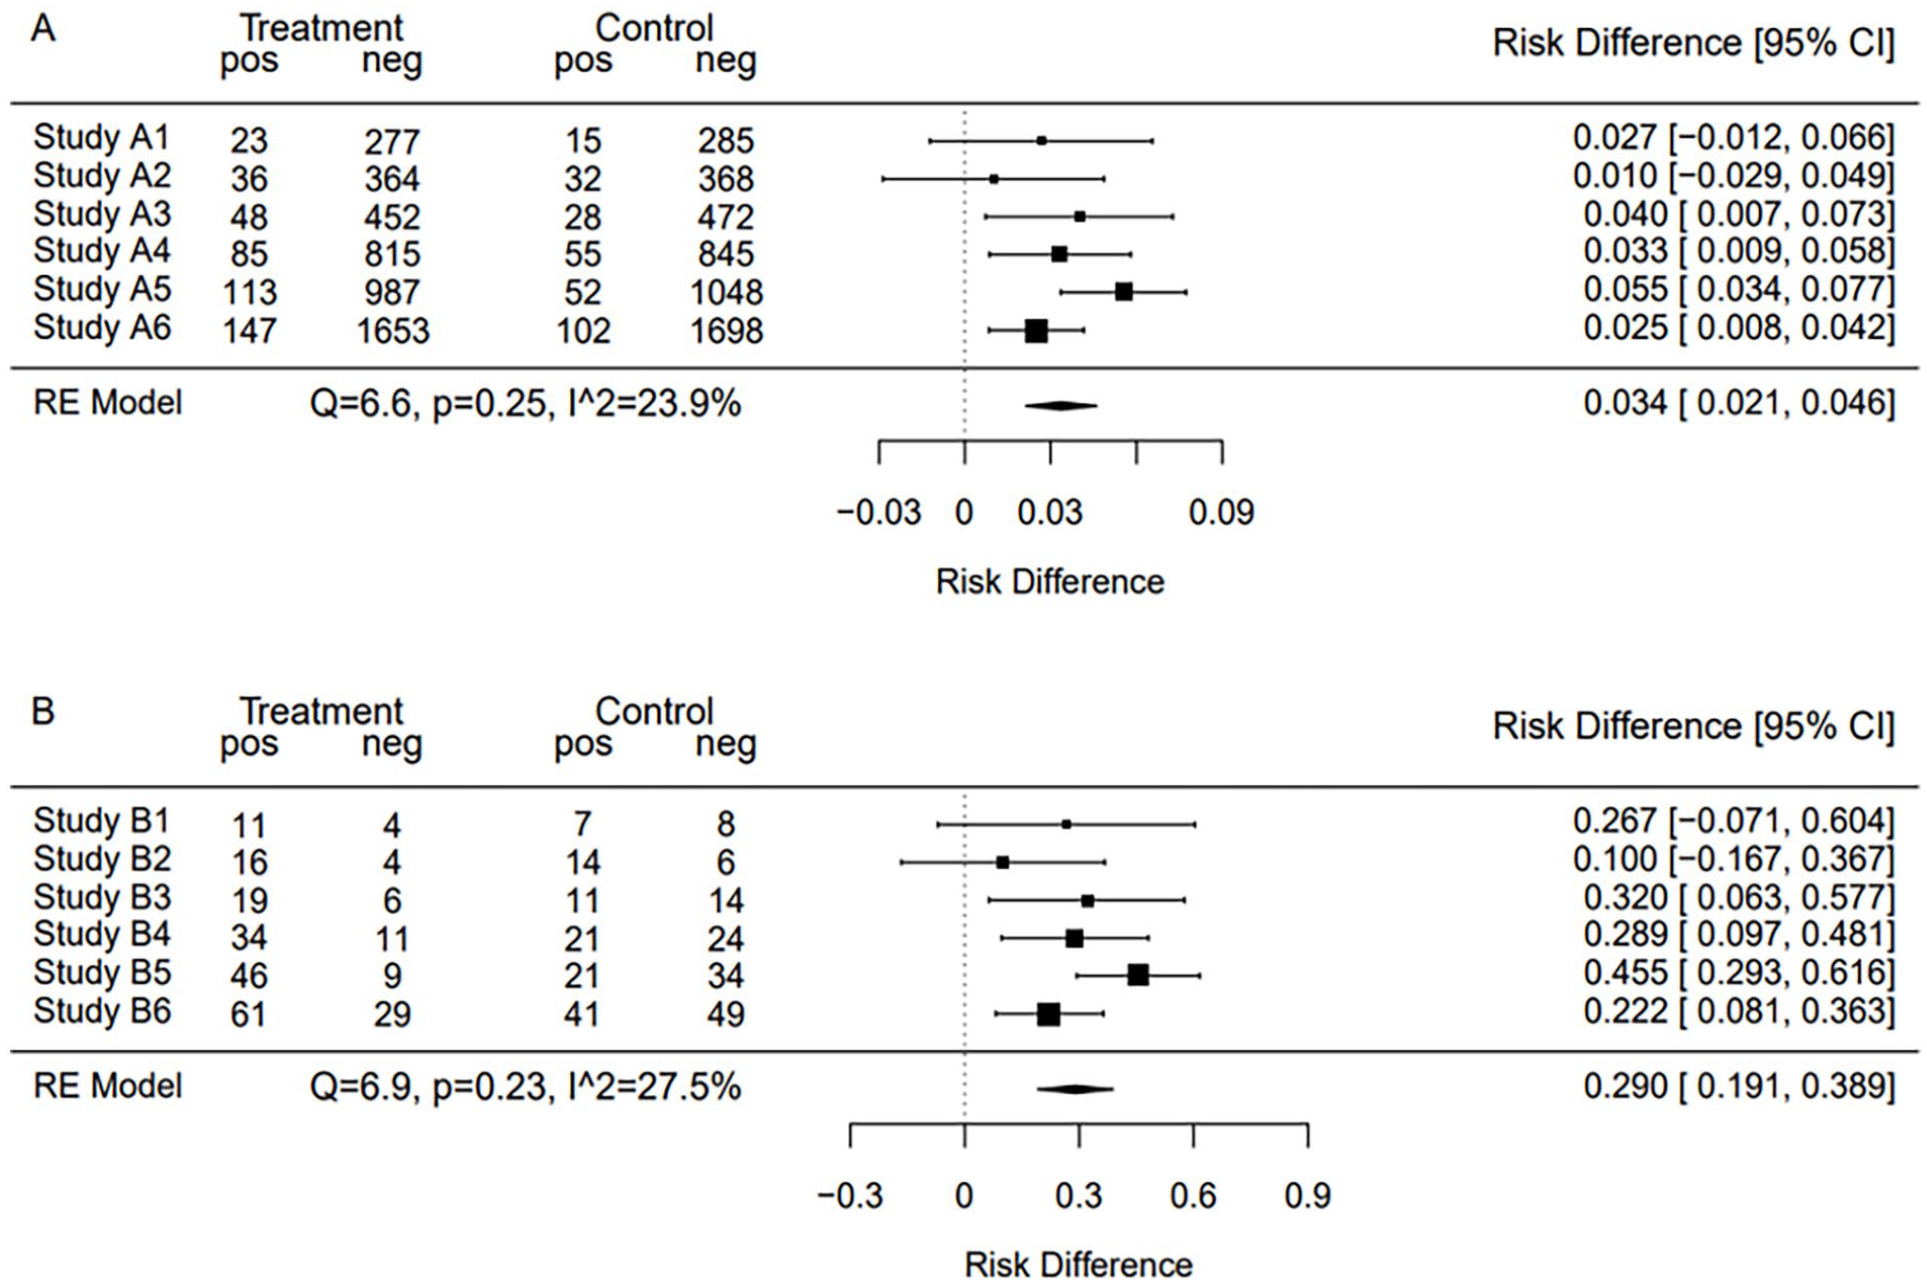
Forest plots of the same datasets as in Figure 2, but meta-analyzed using RD. The overall ES estimate for B is clearly larger, showing the difference in RD between A and B.

Combined meta-analysis of datasets A and B using RD. This figure highlights the heterogeneity between the datasets and questions the validity of aggregating such data, particularly when analyzed using the RR.
As shown in Figure 3, upon analysis via RD, dataset B showed a substantially higher RD than for dataset A. This distinction is further highlighted in Figure 4, which merges the results of A and B. Notably, the significant heterogeneity (Q = 52.6, P = .00, I2 = 79.1%) suggests the need for conducting subgroup analyses for deeper insights. The pronounced differences displayed in Figure 4 emphasize the capability of RD to reveal appropriate ESs and unmask latent heterogeneity.
While conventional practice may not explicitly endorse the merging of heterogeneous datasets such as A and B, it often leads to such aggregation by encouraging the use of relative measures that tend to be consistent. To summarize each study’s clinical effectiveness from the utilitarian perspective, RD should be used rather than relative measures. If reconstructing RD with overall RR and BR was intended to evaluate the clinical effectiveness from this particular viewpoint, it is worth noting that directly estimating RD offers a clearer method that does not rely on the misaligned assumption. Also, it is crucial to understand how the clinical effectiveness vary among patients and studies. If the clinical effectiveness of a treatment is heterogeneous between studies in a meta-analysis; patients should be informed that the treatment effect may vary depending on the context of the studies. These studies may represent variations in patient demographics, treatment protocols, or other factors.
In summary, this subsection emphasizes the usefulness of RD in meta-analyses from a utilitarian viewpoint. Using RD offers transparent results, reveals heterogeneity, circumvents the fallacious assumption that BR and RD are directly proportional, aligns with clinical requirements, and facilitates subgroup analyses. By recommending the use of RD alongside BR, even if BR is conventionally omitted, situations in which clinical significance assessment becomes difficult can be avoided, thereby bridging the gap between statistical analysis and patient-centered care.
Discussion
In this section, we explore the caveats and barriers to the use of RD. By addressing these issues, we foster a deeper understanding of RD and pave the way for broader applications in scientific research and medical decision-making.
Parallel Reporting of BRs
The use of RDs should not exclude the parallel presentation of BRs, as both contribute to a sound clinical interpretation. Even within the context of identical clinical effectiveness, characterized by equivalent numbers of beneficiaries (ES, ie, RD) and equal magnitudes of benefit (EM), the interpretive nuance can vary depending on BR. Consider, for example, a result with a statistically significant RD of −0.09 (95% CI, −0.11 to −0.07). An RD of −0.09 could indicate varying degrees of nuance depending on the situation. If the risk of the control group is 0.12 and that of the treatment group is 0.03, an RD of −0.09 would lead to high treatment satisfaction, as most patients in the treatment group are essentially risk-free. Conversely, if the risk of the control group is 0.97 and that of the treatment group is 0.88, the same RD of −0.09 would call for a more cautious approach in explaining or presenting the effect of the treatment to patients. This consideration of individual satisfaction levels reflects a nuanced difference in the perceived benefits, even with identical RD and EM values.
Precision in Reporting RD: A Call for Standardization
In the context of a meta-analysis using RD, attention to the presentation of significant figures is critical. A common pitfall, as observed in some cases (eg, RD = −0.000; 95% CI, −0.001 to 0.000), is the arbitrary truncation of values to a predetermined number of decimal places. This practice can lead to misleading perceptions of imprecision in RD as compared to others, particularly when significant figures appear beyond arbitrarily selected decimal places. To maintain scientific integrity and accurately represent the precision of the findings, it is essential to adopt a consistent approach by reporting at least 2 significant figures beyond the first non-zero digit to the right of the decimal. Failure to adhere to these guidelines may contribute to an erroneous understanding of RD, potentially diminishing its perceived value and precision in scientific discourse. Such a methodological oversight warrants careful consideration and correction in future studies.
Strengths and Limitations of This Study
— Innovative Clinical Significance Assessment Framework: Introduces a utilitarian perspective for defining clinical effectiveness, emphasizing both the number of beneficiaries and the impact on them.
— Proposes Novel Concepts: Presents EM and MCIRD as inversely related, which facilitates the risk-benefit assessment among various events.
— Statistical Power Maintenance: Shows that using RDs in individual studies does not compromise statistical power, which is critical for the validity of study outcomes.
— Enhanced Transparency in Meta-Analyses: Demonstrates that RDs can help uncover underlying heterogeneity in meta-analyses, contributing to more nuanced and informative syntheses of research.
— Direct Application to Patient Care: Argues for the direct applicability of RDs to individual patient care, which could improve the quality of treatment decisions.
— Standardized Presentation Method: Calls for a standardized method for presenting RDs with precision, which could lead to more uniformity in research reporting and interpretation.
— Limitations of Utilitarianism: Despite identical beneficiary numbers and benefit levels, patient satisfaction can vary, as evidenced by comparing 2 scenarios with a significant RD of −0.09 but differing control and treatment group risks (0.12 and 0.03 vs 0.97 and 0.88), where expressing these as RRs yields 0.25 and 0.91, respectively, indicating that RR may more accurately capture patient satisfaction in this regard.
— Criteria Absence: Lacks criteria for determining the EM, leading to varied interpretations among stakeholders and highlighting the need for future research in establishing consensus in the field.
Contributions of This Study
—Introduction of a Utilitarian Framework for Clinical Significance: Our study is distinct in proposing a utilitarian perspective that prioritizes the impact of medical interventions on patient welfare, considering both the number of beneficiaries and the level of impact. This approach ensures a more comprehensive understanding of the practical implications of study findings on patient care.
—Development and Implementation of MCIRD: We introduce the MCIRD, a novel measure developed from the EM concept, to evaluate clinical effectiveness in binary outcomes. This provides clearer guidance on clinical significance, aiding clinicians and patients in medical decision-making.
—Comparative Analysis with Existing Measures: Unlike previous studies that may focus solely on traditional ESs such as RR and OR, our paper provides a comprehensive comparison of these measures against the RD within our utilitarian framework. We demonstrate through theoretical power calculations and meta-analysis scenarios that RD offers clarity and transparency in conveying the true impact of clinical interventions.
Conclusions
This study highlighted the importance of estimation statistics in medical studies with binary outcomes. The practices established in the current guidelines, particularly those related to the expression of ESs and CIs for binary outcomes, have been critically assessed. This study proposed a framework for a tailored assessment of clinical significance with the novel concepts of EM and MCIRD under a utilitarian perspective. By arguing for the usefulness of RD over relative measures such as RR or OR, this study sheds light on the obscurities and inconsistencies that have long been a challenge in medical decision-making.
Through theoretical power calculations in the design and analysis of binary-outcome RCTs, this study emphasizes the importance of adequate sample size determination and the comparable utility of RD with respect to statistical power. Furthermore, by critically evaluating binary outcome meta-analyses, this study identified the key concerns associated with the use of relative measures under the utilitarian perspective. The methodological advantages of RD have been discussed, advocating its utility in reflecting appropriate ESs, uncovering hidden heterogeneity, and enhancing the transparency and interpretability of meta-analysis outcomes. Finally, the importance of parallel reporting of BRs and the call for standardization in presenting the precision of RD emphasize the aim of refining both subtlety and accuracy in medical statistics.
Supplemental Material
sj-pdf-1-inq-10.1177_00469580241248134 – Supplemental material for A Utilitarian Perspective on Risk Quantification for Clinical Significance in Binary Outcomes
Supplemental material, sj-pdf-1-inq-10.1177_00469580241248134 for A Utilitarian Perspective on Risk Quantification for Clinical Significance in Binary Outcomes by Junhui Park in INQUIRY: The Journal of Health Care Organization, Provision, and Financing
Footnotes
Acknowledgements
The author(s) extend their gratitude to the reviewers whose constructive feedback significantly enhanced the manuscript’s quality.
Author Contributions
Junhui Park conducted conceptualization, analysis, funding acquisition, investigation, methodology, project administration, resources, software, supervision, validation, visualization, and writing.
Data Availability Statement
All extracted and simulated data are available in the paper and supplementary materials. Further details such as the simulation process are available from the corresponding author upon reasonable request.
Declaration of Conflicting Interests
The author(s) declared no potential conflicts of interest with respect to the research, authorship, and/or publication of this article.
Funding
The author(s) disclosed receipt of the following financial support for the research, authorship, and/or publication of this article: This work was supported by a Research Grant from Pukyong National University (2022) [Grant number: 202213100001].
Ethical Statement
The author(s) affirm that ethical approval was not necessary for this study as it did not involve human participants or personal data. In line with these criteria, the study was granted an IRB waiver by the Institutional Review Board of Pukyong National University, with the waiver number being 1041386-202403-HR-39-02.
Consent Statement
The author(s) confirm that consent was not required for this study as it did not involve human participants or personal data.
Supplemental Material
Supplemental material for this article is available online.
References
Supplementary Material
Please find the following supplemental material available below.
For Open Access articles published under a Creative Commons License, all supplemental material carries the same license as the article it is associated with.
For non-Open Access articles published, all supplemental material carries a non-exclusive license, and permission requests for re-use of supplemental material or any part of supplemental material shall be sent directly to the copyright owner as specified in the copyright notice associated with the article.