
Abstract
Health Literacy (HL) emerges as a critical tool in addressing the escalating burden of noncommunicable diseases (NCDs) and their associated costs. Particularly in Bangladesh, where the inadequacy of HL presents multifaceted challenges, there is an urgent need to address this issue. This study aimed to translate and evaluate the Bengali versions of the European Health Literacy Questionnaire with 16 items (HLS-EU Q16) and its shorter 6-item version (HLS-EU Q6), as there is currently no validated Bengali tool for assessing HL. This article used a subset of data from a Bangladeshi national survey of Primary Healthcare (PHC) facilities. The study included adults seeking Non-Communicable Disease (NCD) services at PHCs. Validity and reliability testing succeeded in a detailed back-to-back translation. The statistics covered were descriptive, Cronbach’s internal consistency, confirmatory factor analysis, and the chi-square test. Following the translation and preliminary testing, minor rephrasing and the insertion of Item-Relevant Stimulus Material were performed to ensure cultural equivalency. The Confirmatory Factor Analysis produced a 3-factor structure for the HLS-EU-Q16 that included a second-order general component, confirming the viability of using an HL total score. A 3-factor model based on a priori was determined to be suitable for the factor structure of the HLS-EU-Q6. The model fit indices (Chi-square/df, TLI, AGFI, CFI, GFI, SRMR, RMSEA, and PCLOSE) supported CFA models of both scales. The internal consistency of the translated and adapted instruments was α = .934 and .857, respectively. This study showed that the Bengali version of the HLS-EU-Q16 and HLS-EU-Q6 are psychometrically sound, have clear factor structures, and are equivalent to the original models. However, the HLS-EU_Q16 is recommended over the shorter version considering its better psychometric properties.
Introduction
Health literacy (HL) acts as an important health determinant, a public health commodity, and an achievement of health promotion initiatives such as health education. 1 Having HL requires contextualizing one’s own health, as well as the health of one’s own family and community, identifying what variables influence it, and knowing how to address most of them. Individuals with limited HL competencies have been shown to make less healthy decisions, engage in riskier behavior, and have poor health outcomes such as frequent outpatient visits and hospitalization, more hospital stays, and less self-management, ranging from medication errors to difficulty in managing chronic diseases, and even ignoring preventive services such as immunization programs. 2 They greatly exhaust the healthcare system’s manpower and financial resources. People with better HL abilities, on the other hand, are more likely to make conscious healthy decisions, increasing their chances of being healthy with longer life expectancy and contributing significantly to the country and society. 3 Thus, HL becomes an important marker of measuring an individual’s health behavior.
HL has been illustrated to be a critical aid at a time when noncommunicable diseases (NCDs) and their associated costs are increasing at an alarming rate in terms of managing disease burdens.4 -6 This underscores the need for individuals to take on new roles in collecting and analyzing information, understanding rights and responsibilities, and making health decisions for themselves and those around them. Yet, only a few instruments for evaluating HL have been developed to date by health professionals in collaboration with literacy specialists. These resources have solely concentrated on the essentials of basic health literacy: listening, reading, writing, and numeracy. The “Rapid Estimate of Adult Literacy in Medicine (REALM),” which assesses a person’s competence to properly verbalize common medical words as well as lay terms, 7 and the “Test of Functional HL in Adults (TOFHL A),” which tests reading fluency on documents extrapolated from hospital materials, as well as numeracy proficiency, 8 are two most frequently utilized HL tools. In terms of health information processing, these tools cover a limited range of data, specifically whether patients can access, understand, comprehend, and use health information in life. To address these kinds of potential problems, another theoretically well-accepted HL questionnaire was introduced by the European Commission. The European Health Literacy Survey Questionnaire (HLS-EU) comprises 4 dimensions referring to health information processing combined with the 3 levels of health domains, yielding a matrix with multidimensional health literacy. 6
A compelling representation of the importance and lack thereof health literacy condition in Bangladesh could be painted by numbers. Since about 22 million people of the population live below the official poverty line, many still have difficulties getting access to quality medical care in this country. 9 In addition, while gradually increasing, literacy rates still stand at around 75%, with significant differences between urban and rural communities. 10 Due to infrastructural limitations, access to healthcare data and resources has often been constrained in rural regions, where most of the population resides. According to UNICEF, 68.3 million people in Bangladesh lack access to clean drinking water, and 103 million do not have basic sanitation facilities, 11 of which can be improved by raising health literacy.
Research tools created for one country must undergo a thorough and systematic cross-cultural adaption procedure to be used in another country. 12 Considering these issues, it seems practical to gather data on health literacy in Bangladesh using a customized data collection instrument designed for its people to improve its healthcare system.
Objectives
HL is currently being addressed more than ever before in Bangladesh. Still, a well-validated tool to measure HL is scarce in Bengali. Therefore, the primary purpose of this study was to evaluate the psychometric properties of the shorter versions of the HLS-EU-Q16/Q6 among adults after translating and adapting them cross-culturally.
Materials and Methods
Study Design and Setting
A national survey was conducted to evaluate the health literacy among the adult population who sought NCD-related services from the outpatient department of primary healthcare centers (PHC) in Bangladesh from April to December 2019. Both urban and rural PHCs participated in the study. Upazila (sub-district) health complexes represented rural PHC, while urban PHCs were embodied by urban primary healthcare centers in city corporation areas.
Participant Recruitment and Data Collection
In the main study, 8 rural PHCs were selected from 8 administrative divisions and 3 urban PHCs were selected from 12 city corporation areas through a multi-stage cluster sampling. Detailed methodology is published elsewhere. 13 A total of 2793 respondents aged 18 years and above who visited outpatients of PHCs with complaints of NCDs were interviewed in the national survey using Computer Assisted Personal Interviewing (CAPI) through REDcap data collection software. Among them, a subset of data of 563 individuals attending an urban and a rural PHC was randomly selected to analyze the psychometric properties of the HL questionnaire.
Compared to other demographic groups seeking physical health services and the general population, psychiatric diagnoses were consistently associated with lower HL scores, as evidenced by multiple studies.14,15 So, the study did not include people with cognitive impairment, serious psychiatric disorders, mobility limitations, end-stage diseases, or acute situations to ensure a generalizable conclusion and minimize bias.
Over the years, various recommendations have been suggested regarding the number of participants needed for quantitative instrument validation studies, such as 10 participants per question, 16 a minimum of 100 participants, 17 or a range from 50 to over 1000 participants. According to White, 18 a provisional recommendation for an appropriate sample size range would need to be based on the characteristics of the individuals included in the research. Research including patients would align with the results of this study with a sample size of about 250 to 350. 18 Thus, our sample was deemed sufficient to run a psychometric analysis.
Translation
According to the steps described in the current recommendations on transcultural adaptation of questionnaires, HLS_EU_16 questionnaire was translated into Bengali. 19 Items of HLS_EU_6 were included in HLS_EU_16, so no additional translation attempts were attempted for those items.
Forward translation: The English version of the questionnaire was sent to 2 Bengali-speaking translators. One of them, a medical translation specialist (with extensive expertise translating health education-related resources for this specific demographic), was made aware of the study’s purpose, while the other was not. During this stage, 2 Bengali versions of the questionnaire were obtained.
Translation synthesis: Sequential discussion among the translators resulted in an agreement, producing the initial edition of the questionnaire in Bengali.
Back translation: Two bilingual translators, whose mother tongue was Bengali and who had not previously participated in the phases, worked independently, without viewing the original form of the questionnaire and were ignorant of the study’s aims. There were no significant semantic or conceptual changes because of the back-translation.
Consolidation by a committee of experts: A consensus was achieved among the previous phases’ participants, who were all specialists from several fields (epidemiology, biostatistics, psychometrics, public health, and psychiatry), and a final document containing the target language translation was obtained, forming the final version.
Pre-Test: In a pilot study, the questionnaire form was evaluated for readability among 20 persons who met the sample requirements. The topic of this study was explained to the participants. Under supervision, the questionnaire forms were filled out using the self-report technique. For each one, the process took around 15 to 20 min. Finally, a focus group discussion with 5 rural women was conducted to ensure the linguistic and cultural relevance.
The psychometric characteristics of the Bengali version of the HLS-EU-Q16 were then examined in a subset of the population, and some minor changes to the translated HLS-EU-Q16 version were required following this pre-testing which are further discussed in the discussion section of this paper.
Questionnaires and measurements
Between 2009 and 2012, the HLS-EU was developed under the European Health Literacy Project. It comprises 4 versions: HLS-EU-Q86, HLS-EU-Q47, HLS-EU-Q16, and HLS-EU-Q6. 20 The HLS-EU-Q16 form was constructed using 16 questions from the HL S-EU-Q47 (This scale includes 47 questions). 20 These 16 questions cover self-reported challenges in accessing, understanding, appraising, and applying knowledge to actions related to making healthcare decisions, disease prevention, and health promotion. Each item was graded on a 4-point Likert scale (very difficult, difficult, easy, and very easy) as well as a “don’t know/no answer.” The categories “very difficult” and “difficult” are given a score of 0, while “easy” and “very easy” are given a score of 1. Only those who answered at least 14 questions had their scale values calculated as simple summed scores. The scale runs from 0 to 16, with 3 HL levels: insufficient (0-8), problematic (9-12), and sufficient (13-16). The questionnaire’s 16 items correspond to 11 of the 12 cells in the HL—EU matrix20,21 and are further divided into 3 domains: Health Care (HC), Disease Prevention (DP), and Health Promotion (HP).
Analyses
The psychometric elements of the HLS-EU-Q16 were examined in accordance with the COSMIN checklist. 22 First, we assessed the data quality, internal consistency and correlations between items and domains. Second, we explored the 3-domain structure using the confirmatory factor analysis (CFA). Data quality was assessed by mean, median, percentage of missing data and extent of ceiling and floor effects.
Cronbach’s alpha and average inter-item correlation were used to determine internal consistency. It is determined that an alpha score of .70 was the minimum acceptable number. 23 When analyzing internal consistency, the average inter-item correlation is independent of the number of items and sample size. We considered a moderate inter-item correlation of at least .30 to be satisfactory. A high inter-item correlation (>.80) indicates redundancy and is hence undesirable. 16 If all correlations are close to 0, there is no meaningful construct.
The face validity, content validity and cross-cultural validity of the Bengali translation were considered by the expert team and patient interviewees. All inputs received were considered by the investigators and applied/integrated as applicable.
As there was strong evidence of the factor structure of this questionnaire in other languages, EFA was skipped. The factorial structure was evaluated by the CFA, where items were analyzed as categorical measures. The objective of the CFA was to explore the extent to which the correlations between the variables could be explained by the 3 domains. At first, Factorability was tested by the Kaiser–Meyer–Olkin (KMO) index and Bartlett’s test of sphericity. According to Tabachnick and Fidell, 24 the Bartlett’s test of sphericity should be significant (P < .05) for the factor analysis to be considered appropriate while the KMO index ranges from 0 to 1, with 0.6 recommended as the minimum value for a good factor analysis.
We defined a basic model where an item was linked to its own domain with unspecified correlation between domains. Three models were built based on the theoretical underlying structures for health literacy to indicate the best fit for the overall data. Model 1 was a one-factor model that served as a baseline for comparison with the other models. Model 2 was a second-order 3-factor model with latent factors HC, DP, and HP. Model 3 addressed all 3 latent factors in the same way as Model 2 did, with the exception that Item −1 and −2 share correlated errors.
A number of indices are available to assess the fit of a model based on categorical data. We present the 6 indices that have proved useful in evaluating model fit. The chi-squared goodness-of-fit statistic assesses the discrepancy between the sample and fitted covariance matrix (the null hypothesis is that the model fits the data. A non-significant test indicates a good fit (P-value above .1).
The chi-squared statistic is extremely sensitive to sample size (about 200 cases) and in large samples, it tends to result in a rejection of the model. For this reason, less sensitive additional fit indices are recommended (using the non-centrality parameter and taking into account sample size and degrees of freedom). Comparative fit index (CFI) assesses fit relative to a null model and ranges from 0 to 1 with values of 0.90 to 0.95, indicating acceptable and over 0.95 good fit. 25 Tucker Lewis index (TLI) adjusts for the number of model parameters and is interpreted as CFI. Root mean square error of approximation (RMSEA) expresses the lack of fit per degree of freedom of the model. Values are interpreted as follows: ≤0.05 indicates very good, >0.05 to 0.08 good and ≥0.10 poor fit. Standardized root mean square residual (SRMR) is the average of the differences between the observed and predicted correlations and ranges from 0 to 1. Values of <0.08 indicate good fit. 17
In order to verify the validity of the hypotheses underlying the construct, a chi-square analysis was carried out. Each antecedent and consequent were compared to the score on both HL scales.
Relationships between HL scores (HLS-EU-Q16, HLS-EU-Q6), predictors, and outcomes were examined using the chi-square or Fisher’s exact test.
All statistical analyses were conducted using SPSS version 25 (IBM Corporation, Chicago, IL, USA) and AMOS version 23. A P-value of <.05 was considered significant.
Results
Participants
The study yielded 563 observations, with 33.7% male and 66.3% female participants, equally distributed in urban and rural areas. The age was normally distributed, with the 40 to 49-year-old group having the greatest percentage (26.8%) and the 18 to 29-year-old group having the lowest (13%). The mean age was 44.56 years (SD 13.4). Most respondents (92.9%) belonged to nuclear families. About 44% of respondents said they had no formal education at the time the data was collected (Table 1).
Sociodemographic Data of Study Respondents (n = 563).

Data quality
Items 4, 8, and 13 were slightly skewed to the left, while the rest were slightly skewed to the right (Table 2). The item response rate was high, with no missing responses. The floor effect was 3.37% to 23.27%, and it was greater than 15% for only 3 items (4, 8, 13). The ceiling effect was 25.75% to 43.87%, which was greater than 15% for all items.
The HLS-EU-Q16’s Items (Descriptive Statistics).

C1—HC – C16—HP refer to questions as written in full in Annex 1.
Items included in the HLS-EU-Q6. HC: Health Care; DP: Disease Prevention; HP: Health Promotion.
M = Mean; bSD = Standard Deviation; cSk = Skewness; dKu = Kurtosis; eFloor Effect = Lowest score “1 very difficult” (%); fCeiling Effect = Highest score “4 very easy” (%)]
The KMO score was 0.953, indicating that the sample size was adequate for the analysis. 24 Bartlett’s sphericity test (χ2 = 4839.273, df = 120, P < .001) revealed that correlations between items did not happen by chance and therefore were adequate for the analysis.
Reliability
Cronbach’s alpha values varied from .808 to .871 for the subscales, while the 16-item scale had a value of .934, indicating excellent internal consistency reliability. For the HLS-EU-Q6 scale, it was 0.857.
The correlation between HLS-EU-Q16 and HLS-EU-Q6 was strong (Spearman rho: .796; P < .05). The average inter-item correlation for the 16-item scale was .473, and it was .494, .498, and .561 for the 3 sub-scales HC, DP, and HP, respectively (Supplemental Table A). Item-total correlation (internal item convergence; range .572-.708) was less than .60 for all items on the scale addressing “Health care” (items 1-7) and “Disease prevention” (items 8-12). Only items 13 and 15 from the “Health promotion” sub-scale scored higher than the recommended 0.60.
Construct Validity
Model 2 for HLS-EU-Q16 demonstrated a considerable improvement over Model 1 in terms of fit indices (Table 3). When compared to Model 1, Model 2 exhibited a higher CFI (0.918), TLI (0.902), GFI (0.892), and AGFI (0.854) value, but a substantial increase in chi-square made it a harder model to choose. In terms of each index and change in chi-square given the degrees of freedom values, Model 3 was statistically better than Model 2 (χ2/df = 2.436). The Goodness-of-fit indices (CFI = 0.934; TLI = 0.921; GFI = 0.926; AGFI = 0.900; SRMR = 0.03; RMSEA = 0.059; PCLOSE = 0.051) of the model 3 was found out to be the best fit. As a result, model 3 was chosen as the best match for the data based on these findings (Figure 2), with Model 2 being considered as an acceptable alternative representation in this sample. The model fit indices (Table 3) reveal that the data fit well for 6 indices (Chi-square/df, TLI, AGFI, SRMR, RMSEA, and PCLOSE) and fit moderately for 2 (CFI and GFI).
Model Fit Indices.

CFI = comparative fit index; TLI = Tucker-Lewis Index; GFI=Goodness of fit index; AGFI=Adjusted goodness of fit index; SRMR = Standardized Root Mean Square Residual; RMSEA = root mean squared error of approximation]
Hu and Bentler 26 .
Figures 1 and 2 show the standardized factor loadings for all models. For the finalized model, the CFA revealed factor loadings for all items ranging from 0.54 to 0.76. The correlation between latent factors HC, DP, HP and HL were .83, 1.00, and .97, respectively.

Unidimensional model for HLS-EU-Q16.
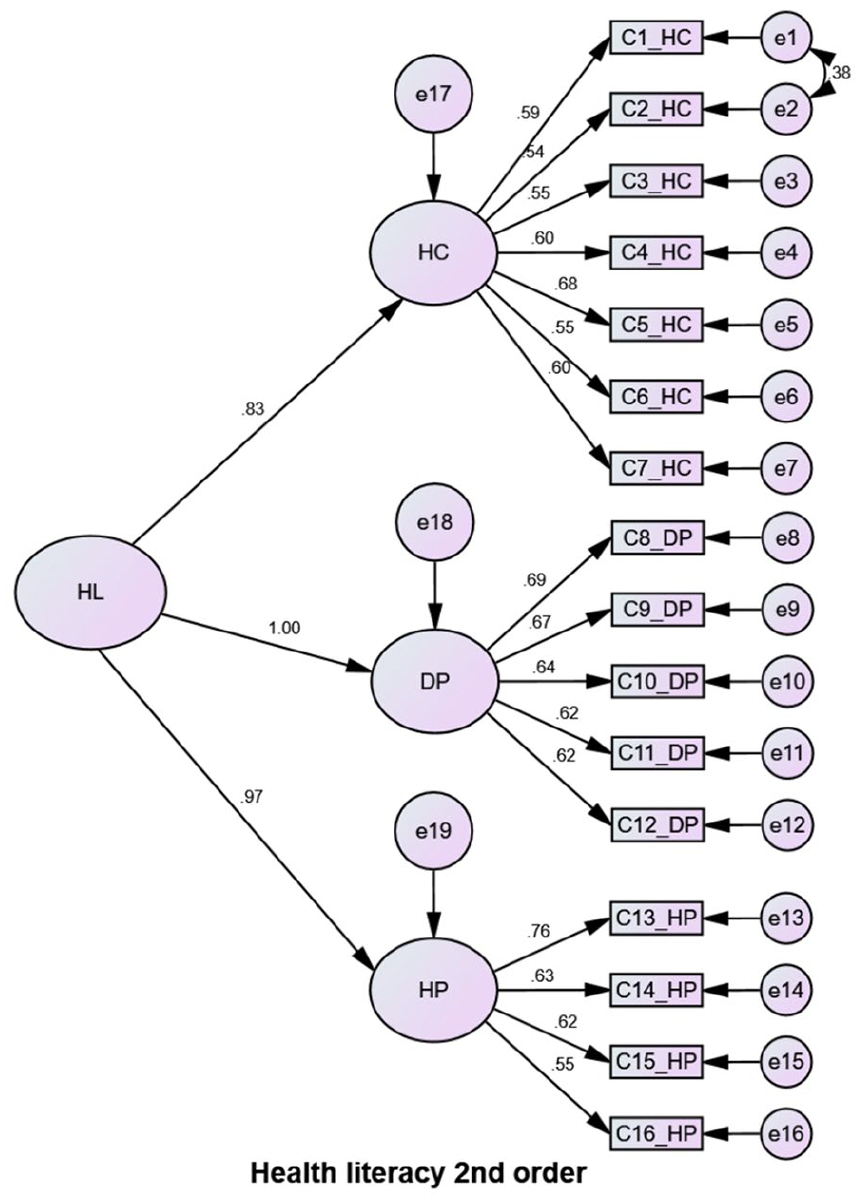
Second-order 3-factor model for HLS-EU-Q16.
In the case of models for HLS-EU-Q6, 3 models were tested, namely unidimensional, 3-factor model and second order 3-factor model, but none showed any significant improvements in model fit indices (Table 3). So, the 3-factor model was adopted as the final model (Figure 3) due to its similarity with the priori models.
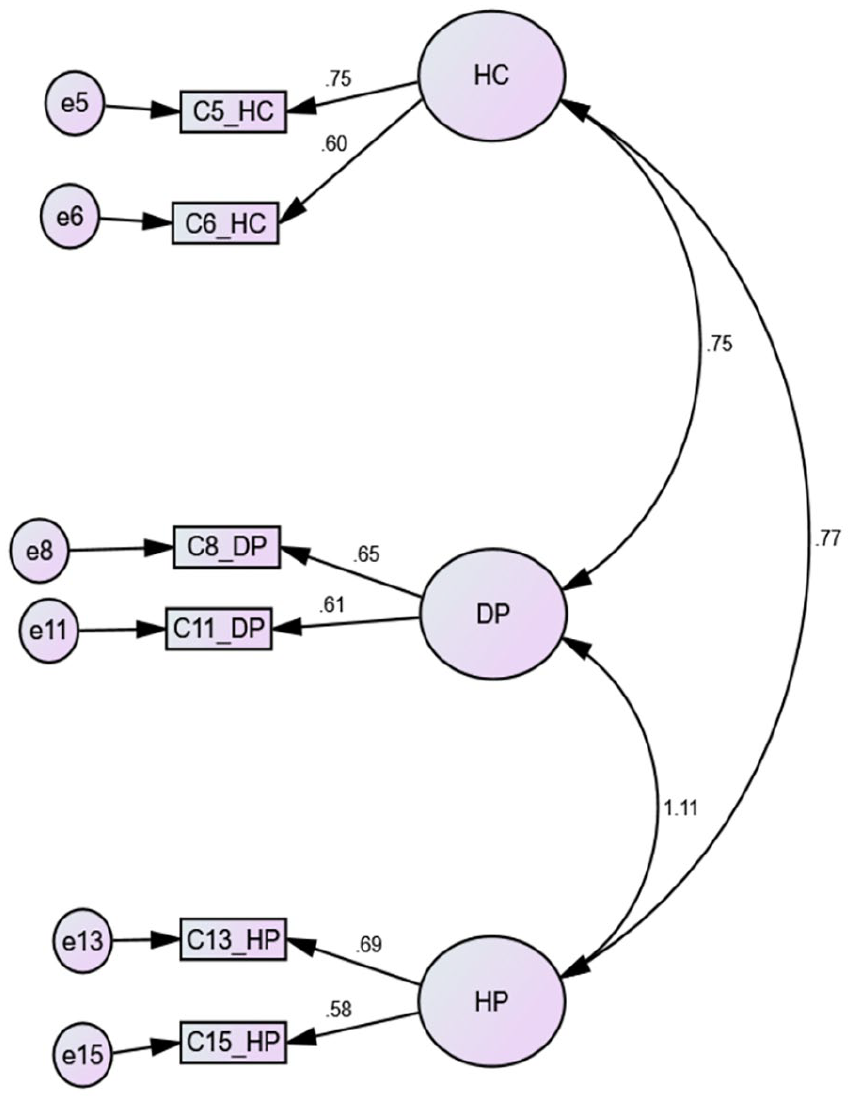
Three factor model for HLS-EU-Q16.
Comparison of Antecedents and Consequences
In terms of predictors, there were several disparities amongst the scores (see Supplemental Table B). Significant differences emerged between the full-scale HLS-EU-Q16 and the shorter version HLS-EU-Q6. Gender was not linked to any of the scores, however, age, education levels, and chronic conditions were. Family income and socioeconomic position were solely linked to HLS-EU-Q6 scores. In terms of HL outcomes, physical activity was linked to both scores; however, fruit and vegetable consumption and medical visits for any diseases were not. Only the HLS-EU-Q6 score was associated with smoking.
Discussion
Sufficient HL is a critical issue in terms of successful utilization of health services, making decisions that promote the health of both the person and the community, and transitioning to healthy lifestyle practices. 6 In this study, we found that the HLS-EU-Q16 is a legitimate instrument that can be used in Bangladeshi adult patients after being translated and adapted to Bengali, allowing researchers to investigate HL in Bangladesh and compare results globally. This is the first time, to our knowledge, that this instrument has been verified using a population-based sample of Bangladeshis.
Most items of the scale were agreed upon by the 2 forward translations to Bengali from English. Different Bengali terms were used on occasion, although they were conceptually comparable. There were a few thematic differences; for example, the term “noncommunicable” was used before “diseases/illnesses” because the target demographic was NCD patients. The inclusion of this term does not imply that people with high HL understand the issues better in the context of communicable or noncommunicable diseases. Instead, it is assumed that people with NCD or chronic illnesses seek disease-related information more frequently due to the extended duration of their illnesses. 27 Including the term was an attempt to lead the discussion in the right direction by providing them with a contextual backdrop.
“Your doctor or pharmacist” was another concept with a different interpretation in Item 7. The term “pharmacist” was dropped since patients in the Bangladeshi healthcare system can only receive valid disease-related advice from certified doctors, and the mere mention of the pharmacist might confuse participants.
In the instance of item number 10, we received a lot of questions from participants concerning the word “health screening” during the pilot study. As a result of the pilot testing, we changed the item to include the following statement: “(Health screening means measuring blood pressure, measuring blood sugar or glucose, getting tested for cervical cancer, breast examination, etc.)” as an Item-Relevant Stimulus Material.
During expert panel discussions, the 2 translated versions were mixed and matched into a single translation related to Bengali concepts. The expert group addressed all the items that raised concerns and sought the literature for information on the conceptual underpinnings.6,20 The whole translation process emphasized the readability and comprehensibility of the translated text over the linguistic resemblance. The aim, as described by Wild et al. and Matsumoto et al., was the conceptual and cultural equivalence of the items.12,28
Our findings indicated that the Bengali version of the HL S-EUQ16 is valid and reliable, with high levels of internal consistency, good reliability even at the subscale level, and important signs of established group validity found in the samples.
All the items in this study had Skewness and Kurtosis values that were within the permissible limits of ±2. According to Tabachnick and Fidell 24 for Factor Analysis (FA), there is no normality requirement as this is not an assumption like a t-test. Instead, floor and ceiling effects were used to measure instrument sensitivity or variability.
In the validation process, we found issues with the floor and ceiling effects of the scale. HLS-EU-Q16 has a high floor but a particularly high ceiling effect, which may alter the questionnaire’s responsiveness 25 and necessitates a more thorough examination of how these questions align with the current potential for HL surveys within the Bangladeshi healthcare system. Similar issues were found in a recent validation study of the French HLS-EU-Q16 in the general population, 29 but not in a cross-country validation study encompassing Indonesia, Kazakhstan, Malaysia, Myanmar, Taiwan, and Vietnam, where the general population was sampled. 30 In the instance of the French study, the issue became apparent only after the responses were dichotomized. Our patient group might be the cause of this phenomenon, as both the cross-country and French samples were all general population. If such is the case, this scale is poorly sensitive for measuring HL in a diseased population.
Confirmatory factor analysis (CFA) was used to determine whether the underlying dimensions of the translated questionnaire matched those of the original. Our findings support the adoption of the 3-factor model for HLS-EU-Q16 scoring. The HLS-EU-Q16 3-factor model (HC, DP, and HP) was established in several earlier research using both exploratory and confirmatory factor analysis and reproduced here.31,32 In communities where differentiation between healthcare information and health promotion is neither appropriate nor possible, the unidimensional structure proposed by Pelikan et al. 20 can still be used. However, when more information is required or differentiation among different aspects of literacy is required, the 3-factor approach is more feasible and justifiable.
CFA indices across the 3 domains were similar to those reported in earlier performed research.30 -33 All the fit indices we found for our samples are satisfactory. Because of the significant correlations (0.83, 1.00, and 0.97), these latent variables can be utilized to assess a second-order general component, and the HL total score can be employed.
There was no substantial difference in HL scores between males and females in our samples. Other research has come to similar conclusions, 29 even though many more population studies show significant differences in HL scores by gender.31,32
Adults who were engaged in graduate studies or had finished a graduate degree at the time of data collection exhibited a statistically significant correlation with those who had less than that education level (measured in both scales).
Internal consistency coefficients for the HLS-EU-Q16 in Spain, India, France, Israel, Turkey, Italy, and Iceland all scored over 0.799,31 -34 and our score was 0.934, satisfactorily higher than those studies. However, some authors suggest a high alpha value (>.9) may indicate redundancy in items, implying that they are assessing the same question in multiple ways. 35 The alpha value of .857 in the HLS-EU-Q6 scale indicates that the condensed version does not include these duplicate items. Item-total correlation coefficients were investigated in the study as one of the reliability analyses and as an indicator of item discrimination. For discriminating between the person who knows and the person who does not know, 36 it is preferable that this coefficient be 0.30. The discriminating coefficients of all items were found to be adequate for HLS-EU-Q16. In the Turkey Healthy Literacy Scale Study, similar results were observed for the HLS-EU-Q47. 37
Strengths and Limitations
The data included in this study was derived from a comprehensive data-gathering method, which included a multi-stage random sampling technique. The sample was representative of all 8 administrative divisions of Bangladesh. Still, several limitations persist in this study. Firstly, the absence of an additional questionnaire to assess health literacy concurrently with HLS-EU-Q16 hinders the evaluation of concurrent validity. Secondly, the inability to cross-validate responses due to sole reliance on respondent data poses a limitation. Lastly, the study’s focus exclusively on adults seeking NCD services at PHCs excludes patients from tertiary hospitals, other institutions, and diverse patient groups, potentially limiting the generalizability of findings.
Conclusion
The findings of this study offer primary support for the factorial validity, reliability, and construct validity of the Bengali version of HLS-EU-Q16 as well as HLS-EU-Q6. The purpose of this tool is to address the dimensionality of HL as well as its practical application. A holistic understanding of HL is useful for public health research, policy, and practice, that is, for healthcare, disease prevention, and health promotion, and a measurement instrument that appropriately reflects this is crucial. This study showed that the Bengali version of the HLS-EU-Q16 and HLS-EU-Q6 are psychometrically sound, have clear factor structures, and are equivalent to the original models. However, the HLS-EU_Q16 is recommended over the shorter version, considering its better psychometric properties.
Recommendations
The validity of the Bengali version of the HLS-EU should be compared to other HL measures in future research conducted across a varied Bengali-speaking population in Bangladesh and beyond. To define thresholds and grasp the real-world effect of HL, further research on varied populations is needed. Additionally, doing supplementary confirmatory factor analyses in multiple sample groups could help support the relevancy of the model. To guarantee the validity and reliability of questionnaires, researchers should create validation strategies before starting to work on any studies. This will let policymakers and implementers evaluate the questionnaires' usefulness in real-world situations.
Supplemental Material
sj-doc-2-inq-10.1177_00469580241248132 – Supplemental material for Psychometric Validation of the Translated and Adapted Bengali Version of the HLS-EU-Q16/Q6 for Adults
Supplemental material, sj-doc-2-inq-10.1177_00469580241248132 for Psychometric Validation of the Translated and Adapted Bengali Version of the HLS-EU-Q16/Q6 for Adults by Sabrina Mousum, Marium Salwa, Khandakar Fatema and Md Atiqul Haque in INQUIRY: The Journal of Health Care Organization, Provision, and Financing
Supplemental Material
sj-doc-3-inq-10.1177_00469580241248132 – Supplemental material for Psychometric Validation of the Translated and Adapted Bengali Version of the HLS-EU-Q16/Q6 for Adults
Supplemental material, sj-doc-3-inq-10.1177_00469580241248132 for Psychometric Validation of the Translated and Adapted Bengali Version of the HLS-EU-Q16/Q6 for Adults by Sabrina Mousum, Marium Salwa, Khandakar Fatema and Md Atiqul Haque in INQUIRY: The Journal of Health Care Organization, Provision, and Financing
Supplemental Material
sj-docx-1-inq-10.1177_00469580241248132 – Supplemental material for Psychometric Validation of the Translated and Adapted Bengali Version of the HLS-EU-Q16/Q6 for Adults
Supplemental material, sj-docx-1-inq-10.1177_00469580241248132 for Psychometric Validation of the Translated and Adapted Bengali Version of the HLS-EU-Q16/Q6 for Adults by Sabrina Mousum, Marium Salwa, Khandakar Fatema and Md Atiqul Haque in INQUIRY: The Journal of Health Care Organization, Provision, and Financing
Supplemental Material
sj-docx-4-inq-10.1177_00469580241248132 – Supplemental material for Psychometric Validation of the Translated and Adapted Bengali Version of the HLS-EU-Q16/Q6 for Adults
Supplemental material, sj-docx-4-inq-10.1177_00469580241248132 for Psychometric Validation of the Translated and Adapted Bengali Version of the HLS-EU-Q16/Q6 for Adults by Sabrina Mousum, Marium Salwa, Khandakar Fatema and Md Atiqul Haque in INQUIRY: The Journal of Health Care Organization, Provision, and Financing
Footnotes
Acknowledgements
Authors acknowledge Professor Dr. Kamal Uddin, Chairman, Department of Psychology, University of Dhaka, for the tremendous support in every step of the study and all the participants who voluntarily participate in the study.
Author’s Contribution
The authors confirm their contribution to the paper as follows:
Study conception and design: Marium Salwa, M. Atiqul Haque; Data collection: Marium Salwa, M. Atiqul Haque; Analysis and interpretation of results: Sabrina Mousum, Marium Salwa; Draft manuscript preparation: Sabrina Mousum, Marium Salwa, Khandakar Fatema. All authors reviewed the results and approved the final version of the manuscript.
Declaration of Conflicting Interests
The author(s) declared no potential conflicts of interest with respect to the research, authorship, and/or publication of this article.
Funding
The author(s) received no financial support for the research, authorship, and/or publication of this article.
Ethical Approval
The study protocol was approved by the Institutional Review Board of Bangabandhu Sheikh Mujib Medical University (memo no: BSMMU/2019/6026). Informed written consent was obtained from every participant before starting interviews.
Data Availability
Supplemental Material
Supplemental material for this article is available online.
References
Supplementary Material
Please find the following supplemental material available below.
For Open Access articles published under a Creative Commons License, all supplemental material carries the same license as the article it is associated with.
For non-Open Access articles published, all supplemental material carries a non-exclusive license, and permission requests for re-use of supplemental material or any part of supplemental material shall be sent directly to the copyright owner as specified in the copyright notice associated with the article.