
Abstract
Although prior research has linked dental conditions and opioid prescribing in the U.S., it is not yet known whether the receipt of opioid prescriptions prior to seeking emergency care for dental conditions differs in geographical areas that are underserved by health care professionals (Dental Professional Shortage Areas, DPSAs) compared to other areas. Using Indiana’s state-wide electronic health records from January 1, 2016 to October 31, 2020, we examine if patients from DPSAs presenting at the emergency department (ED) for dental conditions are more likely to have received opioid prescriptions in the 30 days prior to their visit, compared to patients from other areas. A higher rate of opioid receipt among DPSA individuals may indicate an association between lower availability of dental professionals and the use of opioids as a coping strategy. We note that our study design has several limitations (such as a lack of data on prescription use after the ED visit) and does not prove causation. We find that individuals experiencing dental condition ED visits in DPSAs are 16% more likely (than those in non-DPSAs) to have filled an opioid prescription in the 30 days prior to the ED visit, after controlling for age, gender, and race/ethnicity. This result is statistically significant at the 1% level. The baseline rate of opioid filling in the 30 days prior to the ED visit is 12% in DPSAs. These correlational results suggest that unmet dental needs might be substantially connected to opioid prescriptions, although further research is needed to establish whether this relationship is causal.
Existing research shows that dental conditions and opioid prescribing are linked; however, it is not known whether opioid prescriptions are higher among individuals presenting with dental conditions to emergency departments (EDs) in dental professional shortage areas (DPSAs) than in non DPSAs.
This research uses rich electronic health records from Indiana and finds that individuals presenting to the ED for dental conditions are 16% more likely to have received an opioid in the past 30 days, compared to similar individuals in non-DPSAs.
These results imply that ease of access to dental care may be linked to the need for alternative forms of management of dental conditions and associated pain, although more research is needed to establish causality.
Introduction
Most U.S. drug overdose deaths in recent years were caused by fentanyl and other illicit drugs, 1 with over 70 000 deaths linked to fentanyl compared to about 14 000 deaths related to prescription opioids in 2021 alone. 2 However, the root causes of the US opioid crisis heavily implicate the over prescription of pain medications. Pain medications have often been prescribed in connection with unaddressed dental pain, and research suggests that as much as half of all opioids prescribed for dental pain between 2011 and 2015 were over prescriptions. 3 Access to oral health care is a concern for millions of Americans, especially those in designated Dental Professional Shortage Areas (DPSAs), which may lead to higher rates of dental pain due to unaddressed dental concerns. 4 In this paper, we use data from Indiana spanning 2016 to 2020 to examine whether DPSAs record higher rates of prescription opioid consumption among patients with Emergency Department (ED) visits for dental conditions compared to non DPSAs, as these questions are thus far unanswered in the literature, despite recent sharp increases in ED visits for dental conditions. 5
A Dental Health Professional Shortage Area (HPSA or DPSA) is an area with a population-to-provider ratio of at least 5000 to 1 (4000 to 1 if there are unusually high needs in the community). DPSAs are designated by the Health Resources and Service Administration (HRSA), which also declares healthcare workforce shortage areas for primary and mental health care. Indiana has 103 DPSAs as of 2021, covering a population of approximately 1 287 312 people who are considered in high need of dental care. 6
Lacking a “dental home” may lead preventable dental issues to worsen, causing patients to seek ED treatment for toothaches and other acute presenting dental symptoms. 7 In 2016 alone, there were 2.2 million ED visits nationally for dental pain, amounting to 2% of all annual ED visits and costing nearly $2.4 billion.8,9 Patients treated for non-traumatic dental conditions (NTDCs) such as toothaches and abscesses during ED visits typically receive prescriptions for opioids and antibiotics.10,11 Our data unfortunately cover prescription fills prior to the ED visit, not after the ED visit. However, primary care providers in local areas may also prescribe similar medications for patients with NTDCs without access to dental providers, motivating our research question examining opioid fill rates prior to ED visits. 12
Although there is an extensive list of opioids used in clinical care, the most commonly prescribed opioid medications for dental pain management include oxycodone (ie, Percocet, oxycontin), hydrocodone (ie, Vicodin, Norco), morphine, codeine, fentanyl, tramadol, propoxyphene, and pentazocine.13,14 This treatment regimen is largely palliative in nature and occurs in settings that lack dental specialists and the infrastructure needed to provide definitive care (ie, extractions, root canal treatment, pulp therapy, abscess drainage, sedation).15,16 As a result, opioid prescription utility and concurrent drug dependence may have affected individuals seeking pain relief for dental conditions. Prior research concluded that the prescribing of opioids for NTDC patients during 2007 to 2010 increased significantly over time and was higher than opioid prescribing among non-NTDC visits, based on the National Hospital Ambulatory Medical Care Survey.10,17 Moreover, dental visits had a 3.5 times higher likelihood of receiving opioid prescriptions compared to other types of visits combined.17,18
Research on opioid dependence and mortality have shown differential harms by patient demographics (age, gender, race/ethnicity, socioeconomic status), geographic location, and provider distribution. 19 During the COVID-19 pandemic, the opioid crisis was exacerbated, with significant tolls especially on vulnerable populations, including low-income, minoritized populations in rural areas.8,20,21 A factor potentially contributing to these widening disparities is the uneven geographic distribution of dental providers and lack of dental care facilities, especially in DPSAs. 22 Thus, addressing long-standing structural barriers among populations who are disproportionately burdened by dental disease may provide further insight into mitigating poor oral health outcomes related to opioid dependence.
The increasing dependence on opioid analgesics for pain management is a prominent public health issue in the U.S. and the subject of many legal attempts at solutions. Multiple disciplines have contributed research to understanding the causes and consequences of opioid dependence and opioid-related mortality, and there have been many interventions through policy and practice to alleviate the opioid epidemic. 23 At a national level, the Centers for Disease Control and Prevention (CDC) implemented a comprehensive list of recommendations such as patient assessments, non-opioid treatment options, drug reporting and monitoring tests that may be adapted by states. 24 Thus, examining patterns of potentially avoidable opioid prescriptions in patients visiting the emergency room for dental conditions is crucial for informing legislators and clinicians. However, there has been a lack of data that connects medication profiles of patients and their subsequent ED use, outside of specialized populations such as those on Medicare. The availability of rich data in Indiana’s statewide electronic health records helps address this gap in the literature.
Indiana is a state that has been heavily affected during the ongoing U.S. opioid crisis. Indiana’s opioid-related mortality rates have risen rapidly, quadrupling from 2000 to 2014. 25 In response to the experience of the first decade, the state legislature implemented opioid prescribing regulations in 2013 (Title 844 IAC Article 5, Rule 6) requiring physicians to screen patients receiving opioid prescriptions for psychiatric conditions, review patients’ drug prescription history in Indiana’s drug monitoring database (INSPECT), perform regular drug tests, and require patients on prescription opioids to sign a controlled substance agreement.26 -28 These state regulations have been reinforced by professional organizations, such as the American Dental Association (ADA)’s 2018 policy that supports statutory limits on opioid prescriptions to 7 days for acute pain treatment, mandatory continuing education courses in prescribing opioids and other controlled substances for dental professionals, as well as utilizing prescription drug monitoring portals to promote the appropriate use of opioids in clinical settings. 29
The goal of this study is to determine whether patients residing in DPSAs in Indiana who accessed the ED for dental conditions experienced a higher rate of opioid prescription in the past 30 days, compared to those residing in non-DPSAs. Such evidence might indicate that dental pain management is a challenge in DPSAs if lack of access to oral health services is connected to higher rates of opioids’ prescription for pain management. Although our data are from one state, this research fills a need as there is a dearth of research on ED dental condition patients using prescription drug histories.
According to the 2012 National Survey on Drug Use and Health, prior to the start of our study period, Indiana ranked third nationally for non-medical prescription opioid use (NMPOU) and ninth among US states for opioid prescribing, with a rate of 109.1 per 100 000 residents. A comprehensive study of opioids prescribed in the U.S. found that the main prescribers were primary care physicians, followed by internists, and dental practitioners. 30 Furthermore, a key site for acute pain management is the ED, serving as a point of reference for examining prescription patterns, non-medical uses of medications, and heterogeneity of opioid dependence in clinical care.10,31 Given that dental pain is the most common presenting symptom of a dental condition, examining the past patterns of opioid prescriptions among patients with nontraumatic dental conditions (NTDCs) presenting in EDs can provide insight into factors enabling the concomitant increase in opioid dependence and potential misuse.
Data
We extracted and analyzed electronic health records from the Indiana Network for Patient Care (INPC) for this study. INPC started in the 1970s and is considered the “largest inter-organizational clinical data repository in the nation,” 32 as a state-wide health information exchange that receives data on all healthcare encounters from participating organizations, including medication prescription fills from pharmacies. As documented by the Regenstrief Institute, the honest data broker for the INPC, 33 prescription data are available only before November 2020 and only cover the period prior to a hospitalization. Thus, our study window ends on October 31, 2020, to ensure a time period of full histories of prescription fills. Prescription information is mandatorily available in the INPC database for patients who experience an inpatient or ED encounter, because the rules that govern the merging of data on medications occurs only once an individual experiences a hospital encounter. For such individuals, the prior 13 months of prescriptions are added to the database by a national prescription information provider. Prescription information is also available through other data sources occasionally, 34 but those sources may not be available for the entire study period. Thus, we focus our study on patients who experience an ED visit, as the INPC contains all prescriptions fills for them during the prior 13 months during our study period. 28 However, we are unable to identify the provider or even the type of provider of these prescriptions.
The INPC contains a total of 6 306 972 unique individuals receiving care between 2015 and 2021. The population of Indiana was 6.8 million in 2021. It should be kept in mind that electronic health records arrive only from participating providers, thus an individual may have some but not all their healthcare records included in our sample. A small fraction of individuals move from one state to another in a given year, thus some of the individuals with records in the INPC during 2015-2021 may not reside in the state in 2021. Nationally, the fraction that move state to state during a year is about 1.5% to 2%, thus representing up to 10% of the 5-year sample at maximum. 35 Nevertheless, we consider the INPC fairly comprehensive in covering a large majority of Indiana residents during our study period.
Due to missing data on ED encounters in 2015, we restricted our sample to those with encounters between January 1, 2016, and October 31, 2020, and among those, we dropped individuals with missing demographic data. There are 4700 unique individuals that are listed as “unknown” gender, 78 with missing birthdays, and 378 159 with missing or invalid zip codes that are excluded from the sample. Removing missing data as well as all data from periods in 2015 and in the last 2 months of 2020, we arrive at 5 345 942 unique patients.
The encounter data also links to diagnostic data, which we use to identify dental conditions. The encounter data includes admission and discharge dates, location, provider, and encounter type. We filtered the data to those with visit types either “ER” or “E” to retrieve only emergency visits. We calculated the age at the time of the encounter using the birthdate and admission date and limited the sample to those at least 12 years old at the time of ER admission. We further identify ER encounters for dental care by using dental diagnostic codes, which included diagnosis text and codes. We identify dental conditions using dental codes for non-traumatic dental conditions (NTDC) and traumatic dental conditions (TDC) represented as International Classification of Diseases, Ninth Revision, Clinical Modification (ICD-9-CM) codes 520 to 529.930 and International Classification of Diseases, Tenth Revision, Clinical Modification (ICD-10-CM) codes 36 K00-K12.10,37,38 We identify 376 849 unique individuals who have an ER encounter for a dental condition during the study period, and thus constitute the sample for our main regression analysis.
Prescriptions data for the study cohort includes prescription fills (NDC codes, fill dates) from the last 13 months prior to the ED visit for each patient, because of the way that medications data is pulled into the patient record at the time of the ED visit. In these data, we identify opioid NDC codes from the CDC’s “Selected Opioid Analgesics and Linked Oral Morphine Milligram Equivalent Conversion Factors, 2020 Version.” 39 As prescription fills are not linked to a specific encounter, we used the length of time between the fill date and the ED admission date for the dental condition to identify which patients had filled opioid prescriptions in the period 30 days (as well as 60, and 90 days) prior to their ED visit. 40
To segment the study dataset based on location, we used the 2021 Dental Health Professional Shortage Areas (DPSA) zip codes, 4 grouping the dental patients into those residing in DPSA versus those in non-DPSA areas. 4
Methods
Statistical Analyses
In order to examine the opioid prescription patterns in the period before the ED visit, between DPSA and non-DPSA residents, we conducted a logistic regression analysis using information on individuals who experienced an ED visit for a dental condition during our study period. We examined periods of 30, 60, and 90 days prior to the focal ED admission to consider somewhat longer and shorter time windows. We focus on the 30, 60, and 90 days prior because we are confident that we have all prescriptions for our study sample, whereas we cannot guarantee full prescription data for the period after the focal ED visit, a fruitful area for future research.
We also conducted a second logistic regression with controls for age, race, and gender, as demographic factors may independently impact the propensity to receive opioid prescriptions, and these impacts may differ in underserved areas. We separately report univariate differences in opioid prescribing by these demographic categories in order to place our results in context. In the analyses incorporating demographic information, ethnic/racial categories are defined as white only, Black only, Hispanic, and other race. Ages are grouped into bins of younger than 18 years, 18 to 34, 35 to 54, 55 to 64, and 65 years and older. In the logistic regression specification, the reference group for race is “other" and the reference group for age is “Younger than 18.” The results are converted into odds ratios (OR) for presentations in tables. Our overarching research question, for which we examine DPSA versus non-DPSA differences in opioid prescription factors in connection ED dental condition visits, is driven by concern that any potential discrepancies in access to dental professionals may be causing variations in opioid prescribing practices between DPSA and non-DPSA locations. Our results are meant only as indicating correlations, as our study design does not allow us to examine opioid prescribing as a result of experimentally changing only DPSA status; it is likely that DPSA locations may also differ in other ways (such as a lack of other medical professionals) that may impact opioid prescribing rates. Furthermore, selective residential locations and sorting might indicate that those who reside in DPSA areas differ in other individual traits, including health conditions, that may lead to differences in pain medication prescriptions.
Throughout our statistical analysis, we used an alpha level of .05 to indicate statistical significance of the observed correlations. We performed descriptive statistical analyses to examine how emergency care for dental conditions differs in provider shortage regions by comparing the proportion of ED visits that are for dental conditions in the DPSA and non-DPSA regions. We expect that non-DPSAs, with access to better dental healthcare, may result in fewer patients presenting to EDs for dental conditions.
Results
Although prior research has linked dental conditions and opioid prescribing in the U.S., it is not yet known whether the receipt of opioid prescriptions prior to seeking emergency care for dental conditions differs in geographical areas that are underserved by health care professionals (Dental Professional Shortage Areas, DPSAs) compared to other areas. Using Indiana’s state-wide electronic health records from January 1, 2016 to October 31, 2020, we examine if patients from DPSAs presenting at the emergency department (ED) for dental conditions are more likely to have received opioid prescriptions in the 30 days prior to their visit, compared to patients from other areas. A higher rate of opioid receipt among DPSA individuals may indicate an association between lower availability of dental professionals and the use of opioids as a coping strategy. We note that our study design has several limitations (such as a lack of data on prescription use after the ED visit) and does not prove causation. We find that individuals experiencing dental condition ED visits in DPSAs are 16% more likely (than those in non-DPSAs) to have filled an opioid prescription in the 30 days prior to the ED visit, after controlling for age, gender, and race/ethnicity. This result is statistically significant at the 1% level. The baseline rate of opioid filling in the 30 days prior to the ED visit is 12% in DPSAs. These correlational results suggest that unmet dental needs might be connected to opioid prescriptions, although further research is needed to establish whether this relationship is causal.
During the time between January 1, 2016, and October 31, 2020, there were 65 893 229 encounters in the INPC with complete data for our study, for care received by 5 345 942 unique individuals. Among these individuals, 47.7% (N = 2 549 085) lived in DPSA areas. Table 1 shows the count of unique individuals with any healthcare encounter each year. For 2020, the encounters are only counted through October 31 due to data availability. The average number of encounters for each individual in each year is generally between 4 and 6 visits. However, there is heterogeneity, with some individuals having hundreds of visits and others having few. In a given year, there are approximately 2.5 million unique individuals with healthcare encounters in our INPC sample. By way of comparison, Indiana’s total population in 2019 was 6 731 010, and in any year, approximately 86% of the US population incurs any formal health care.41,42 By extrapolation, each year, the INPC contains at least some encounter data for approximately 43% of the state’s population (2.5/(6.7 × 0.86)).
Number of Individuals With Encounters and Average Number of Encounters.

Note. Data consists of electronic health records from the Indiana Network for Patient Care (INPC), January 1, 2016, to October 31, 2020.
For the overall INPC sample, Table 2 shows descriptive statistics of the individuals in the DPSA and non-DPSA regions. Overall, 54% (N = 1 378 597) of the individuals are female in DPSA regions; this is 53% (N = 1 487 153) in non-DPSA regions. The racial composition in the DPSA and non-DPSA regions differed substantially, as 75% (N = 2 097 797) of patients in non-DPSAs were white compared to 69% (N = 1 761 539) in DPSAs. DPSAs have a higher proportion of Black and Hispanic patients, as 16% (N = 406 892) of patients were Black, 7% (N = 179 384) are Hispanic, compared to 8% (N = 223 766) and 4% (N = 111 882) in non-DPSA regions, respectively. Half of the patients with encounters in DPSA regions (N = 1 274 542) had an emergency department encounter during the study period, compared to 42% of those in non-DPSAs (N = 1 174 192). Eight percent (N = 204 599) of individuals in DPSAs had an emergency department encounter for a dental condition compared to 6% (N = 167 823) in non-DPSA regions. These data are consistent with higher ED dental visits in DPSA areas, but these results do not control for demographic factors, which might drive these differences.
Descriptive Statistics for INPC Cohort with Encounters between January 1, 2016, and October 31, 2020 (N and (%) of patients).
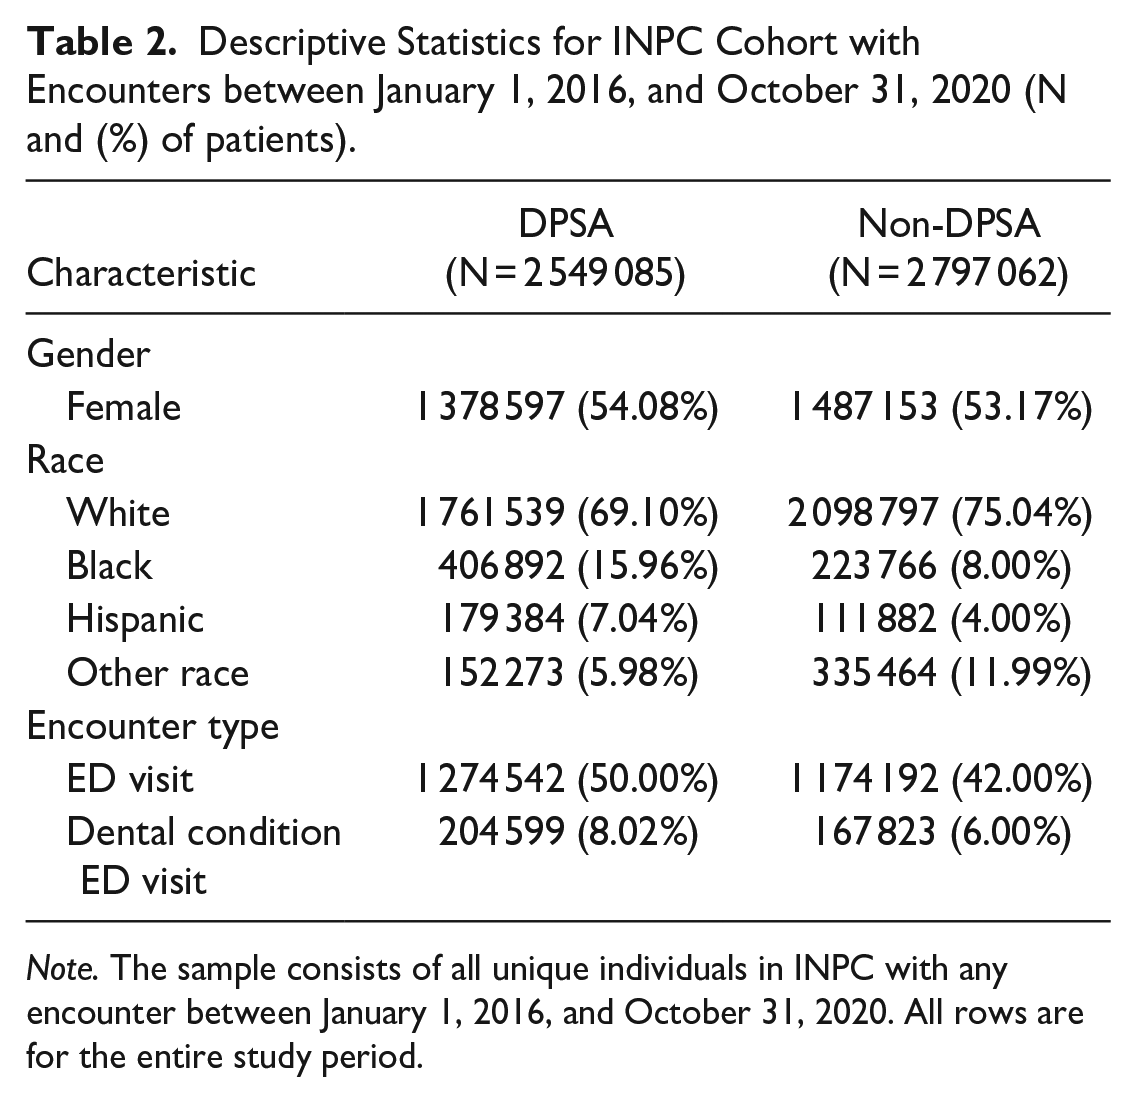
Note. The sample consists of all unique individuals in INPC with any encounter between January 1, 2016, and October 31, 2020. All rows are for the entire study period.
Of the total 65 893 229 healthcare encounters for the 5 345 942 unique patients between January 1, 2016, and October 31, 2020, we extracted data for 376 849 dental patients with ED visits. Table 3 shows the characteristics of the patients in DPSA and non-DPSA regions who have a dental ED visit between January 1, 2016, and October 31, 2020. The gender composition is similar for the individuals with ED visits for a dental condition, as 56% (N = 120 533) in DPSAs and 54% (N = 87 270) in non-DPSAs are females. The racial composition of the patients with ED visits for dental conditions is also similar to the INPC cohort with encounters. The non-DPSA regions have a higher proportion of whites (79%, N = 127 673) than do DPSA regions (68%, N = 146 362). DPSAs have a higher proportion of Black and Hispanic patients with dental conditions ED visits as 21% (N = 45 200) are Black and 7% (N = 15 067) are Hispanic, compared to 6% (N = 17 777) and 4% (N = 6464) respectively in non-DPSA areas. We also considered the overall proportion that had any opioids filled in the 30, 60, and 90 days leading up to the encounter. For the DPSA regions, 15% of patients had filled an opioid in the 90 days before the ED visit for a dental condition (14% in the 60 days prior and 12% in the 30 days prior) compared to 13% of patients in non-DPSAs (12% in the 60 days prior and 10% in the 30 days prior). Thus, there are signs here consistent with higher opioid prescriptions in DPSA areas, which we next explore through regression adjustments with available demographic determinants.
Descriptive Statistics for INPC Cohort with ED Visits for Dental Conditions Between January 1, 2016, and October 31, 2020 (N and (%) of Patients).

Note. Last 3 rows indicate who amongst these individuals is recorded with an opioid fill prior to the focal ED visit.
Figure 1 shows the fraction of individuals with a dental ED visit out of the total number of individuals with any ED visit by each year of our study period. In general, there is a slightly higher proportion in DPSAs than non-DPSAs across all years of the study. For 2020, the plot only includes those with visits through October 31, 2020.

Proportion of ED visits for dental conditions.
Table 4 compares the characteristics of those who fill opioid prescriptions in the 30 days before the focal ED visit for a dental condition in DPSA and non-DPSA locations. We present the results from the t-tests, the confidence interval, and the p-value. Overall, non-DPSAs and DPSAs differ statistically significantly in terms of racial composition. Non-DPSAs have a higher proportion of white patients than DSPAs (90% compared to 79%, P-value = .00). Patients in DPSAs that filled prescriptions for opioids in the months prior to their ED visit for a dental encounter were more likely to be Black, with 17% of those in DPSAs compared to 7% in non-DPSAs (P-value = .00). Hispanic and other race proportions are significantly different, though the magnitudes are small (3% Hispanic in DPSA compared to 2% in non-DPSAs, and 1% other race in both DPSA and non-DPSA). The proportions by age are significantly different in DPSAs and non-DPSAs for the 35- to 54-year-old age bin, the 55- to 64-year-old age bin, and the 65 and older age bin.
Characteristics of Individuals Filling an Opioid Prescription in 30 days Prior to Focal ED Visit by DPSA (N and (%) of Patients).

Note. This table reports the fraction of those who filled an opioid prescription in the 30 days prior to the focal ED visit and the results from the t-tests comparing the proportions in DPSA to non-DPSA. 95% confidence intervals included.
The proportion of people ages 65 and older is higher in non-DPSAs, while the proportions for the 35 to 54 and 55 to 64 groups are higher in DPSAs. Tables 5 and 6 show the results from the logistic regression of DPSA on filling an opioid prescription in the 30, 60, or 90 days prior to the focal ED visit for a dental condition. For the three time periods, the univariate regression suggests that individuals in a DPSA region have 1.12 times higher odds (OR = 1.12, P-value = .00) of filling a prescription in the prior 30, 60, and 90 days. After adjusting for covariates like age, gender, and race, the multivariate regression finds an odds ratio of 1.16, suggesting a 16% higher likelihood of filling an opioid prescription in the 30, 60, or 90 days prior to the focal event for those in DPSA areas. Table 6 shows the odds ratios for the other covariates. For example, whites are 5.47 times (OR = 5.47, P-value = .00) more likely than those of other races to fill an opioid prescription, compared to 4.17 times (OR = 4.17, P-value = .00) for Blacks and 2.80 times (OR = 2.80, P-value = .00) for Hispanic. Older individuals are also more likely to be present in our sample, with those in the age groups of 55-64 (OR = 11.51, P-value = .00) and those 65 years and older (OR = 10.25, P-value = .00) having higher likelihoods than the other age groups. The results from both the multivariate and univariate logistic regressions suggest that those in DPSA areas who seek care in an ED for a dental condition are more likely to have filled an opioid in the 30, 60, and 90 days prior to their focal visit than those in non-DPSAs locations.
Logistic Regression Results of DPSA on Opioid Prescription Filled in 30, 60, 90 Days Prior to the Focal ED Visit for Dental Condition.

Note. Logistic regression of DPSA on opioid prescription in the 30, 60, and 90 days prior to the focal ED visit for a dental condition. The odds ratio of 1.12 suggests that those in DPSAs are 1.12 times more likely to have filled an opioid prescription prior to the ED visit. 95% confidence intervals included.
Logistic Regression Results of DPSA and Covariates on Filling an Opioid Prescription in 30, 60 and 90 Days Prior to the Focal ED Visit.

Note. As noted, the logistic regression includes controls for age bins, gender, and race. The reference group for the age bin is 0-18; we include indicators for 18-34, 35-54, 55-64, 65+. We include race controls of white only, Black only, Hispanic, and the reference group is “other race.” The reference group for gender is male. 95% confidence intervals included.
Discussion and Conclusion
Discussion
Our study aimed to identify the rates of opioid prescriptions in the 30 days (and up to 90 days) prior to an emergency department visit for a dental condition in Indiana, and to compare the areas with a shortage of dental providers with those without a shortage of dental providers. Before proceeding to examine prescriptions data, we first considered whether residents of DPSA regions were more or less likely to be experiencing ED dental condition visits than in non-DPSA areas. A lack of dental providers in DPSAs may influence whether patients present at the ED for dental conditions rather than receive care in a dentist office. We found that between 2016 and 2020, the DPSA regions displayed slightly higher rates of ED visits for dental conditions than non-DPSA areas, consistent with our expectations. We then examined the experience connected to prior opioid prescriptions, conditional on an ED visit for a dental reason. If our data were not limited to medications prior to ED visits, our analysis would also have considered opioid prescriptions after the dental condition ED visit. Prior research revealed that among all dental visits, 20.8% were given a prescription for a non-opioid analgesic and 36.6% were prescribed an opioid analgesic, reporting a higher rate of opioids prescriptions in dental emergency visits between 2000 and 2017.17,18 However, EDs have reported a reduction in opioid prescriptions in recent years, consistent with our study results. 43
Our results show a higher likelihood that patients presenting at the ED with a dental condition in DPSAs have filled an opioid prescription in the recent past than in non-DPSAs, although we caution that there may be other factors that differ between DPSA and non-DPSA areas than the availability of dentists alone.44,45 Previous literature reported that about 14.5% of the U.S population live in a dental professional shortage area where only 40.5% of the dental needs have been satisfied; the study demonstrated an association between health professional shortage area (HPSA) with poor health, lower educational attainment, and lower income levels, which act as financial and education obstacles in acquiring dental care. 46 An additional obstacle to care unavailable in our database is insurance status. Prior literature shows that dental practitioners in rural areas receive 56% of their revenue from Medicare and Medicaid-covered individuals. 47 In addition, factors such as a lack of dentists, impoverishment, and isolation lead to increased oral health disparities in these locations. 47 The prior literature suggests that Medicaid is an important source of insurance coverage for those in rural and dentist shortage areas. Most individuals presenting to EDs for dental complaints are uninsured or receive Medicaid benefits. 48 A study confirmed low rates of patient insurance in provider shortage areas: the proportion of people living in a health provider shortage area who were insured was slightly lower compared to non-HPSA (82% vs 85.6%). 46 Therefore, further research is needed on the extent to which higher Medicaid reimbursement for dental care may reduce the prevalence of DPSAs.
We identified that the shortage of dental providers is associated with a higher proportion of patients presenting in the ED for a dental condition (8% compared to 6%) and within the DPSA regions, there is a higher proportion of patients presenting to the ED for dental conditions who had filled an opioid prescription in the prior 30, 60, and 90 days. We note that these results may indicate higher reliance on opioid prescriptions for addressing dental pain. Future research, outside of the scope of our current study due to data limitations, should examine opioid prescriptions following ED visits, as patients may also be prescribed opioids in the ED or after the visit since the necessary equipment for dental procedures is not available in emergency departments. 49 Our study reported increased ED visits for dental conditions in DPSA but did not evaluate the education and income status of the individuals as done in at least one prior study. 46 A previous study demonstrated similar findings as our study that patients’ emergency room visits are less common in regions with a larger number of dental practitioners, and individuals in DPSAs are more likely to visit emergency rooms for NTDC. 50 Individuals with NTDC who lack access to a regular dentist may seek the ED for pain management, but physicians in that setting often lack professional dental knowledge, and therefore, opioids are prescribed for pain treatment of oral issues. 51
In terms of demographic factors, our findings displayed that 62% of individuals filling an opioid prescription in the 30 days before the focal ED visit in DPSAs are females and 61% of those in non-DPSAs are females. Our results do not suggest a large difference between DPSA and non-DPSA in this regard, but this observation aligns with previous studies that find females were more likely than males to obtain an opioid prescription. 49 Literature also suggests females maybe more likely to become reliant on prescription pain medicines due to biological differences. 49
The results on racial demographics demonstrate that white populations in both the DPSA and non-DPSA areas were prescribed more opioids, followed by Black populations. Our data revealed that the non-Hispanic population, which include Black, white, and other race, in both DPSA and non-DPSA areas received the majority of opioid medications. In the DPSAs, the proportion of Black individuals filling an opioid prescription in the past 30 days was 17% compared to just 7% in non-DPSAs. Non-DPSA regions had a higher proportion of white patients filling prescriptions at 90% compared to 79% in DPSAs.
Our descriptive results of the INPC cohort and the patients presenting to the ED for a dental condition show that the racial demographics differ in DPSAs and non-DPSAs. We find a higher proportion of white patients in non-DPSAs compared to DPSAs, as well as higher proportions of Black and Hispanic in DPSAs compared to non-DPSAs. This is unsurprising because Blacks are less likely to live in non-DPSAs compared to DPSAs; according to the literature, racial and ethnic minorities reside primarily in areas with a shortage of health professionals. 50 Our findings that whites populations are more likely to experience opioid prescriptions are supported by literature that suggests that even with comparable degrees of pain, Black populations are less likely than white populations to receive opioids in the ED for toothaches. 51 This also implies that racial biases may be at play that lead to more restricted access to opioid medications for dental pain among Black populations. 52 Previous research reported comparable findings of higher opioid prescriptions among non-Hispanic whites (47%). 17
Our findings revealed that older age groups were more likely to have filled an opioid prescription in the prior months, with a higher proportion of prescriptions being received by individuals aged 35 and older in DPSA and non-DPSA areas. These results are consistent with a study who reported that visits among adults aged 45 or older were 25% more likely to result in an opioid prescription compared to visits among adults aged 18 to 44. 18 The high prevalence of pain among older patients may explain the significance of age in prior opioid prescription. 53
Overall, our study’s results related to demographic differences in opioid prescriptions for dental care in DPSAs compared to non-DPSAs can help inform targeted interventions to address barriers and reduce disparities. It is essential to comprehend the needs of dental patients and provide resources that will reduce the opioid prescription rate and non-traumatic dental condition visits to emergency departments.
Limitations
Despite our ability to provide the first estimates in the literature on the differences between dental workforce shortage areas and other areas in the use of opioid prescriptions prior to ED presentation for dental conditions, there are several limitations to our study. This is a descriptive study of voluntarily contributed electronic health records from healthcare systems in one state, and thus the results cannot be generalized nationally. Our study focuses on prescriptions filled before (rather than after) the focal ED visit because of data limitations, preventing us to examine whether there are also differences in opioid prescriptions after a dental condition ED visit. We examine simply if opioids were prescribed, rather than the amount or duration of opioids being prescribed to a patient. We also do not observe the identity of the provider of prescriptions (thus are unable to infer specialty) nor the specific reason medications are prescribed. For these and other reasons, our study design does not allow the inferring of causal relationships between DPSA status and opioid prescribing for dental pain management; our study’s strong evidence of disparities in opioid prescriptions associated with DPSA status should open the door to further research with data that overcomes the limitations we faced.
Practical Implications
This study aimed to assess differential rates of opioid prescription in DPSA versus non-DPSA areas. In the absence of regular dental care access, people living in these underserved locations may resort to visiting EDs for their dental concerns. Approximately 60% of total rural locations are designated as dental shortage areas, which increases the salience of our research. The evidence presented in this paper is suggestive (but does not confirm) that DPSA patients may have been more likely to be prescribed opioids to address dental pain prior to the ED visit. Our study occurs in the context of documented evidence of unnecessary opioid prescriptions for non-traumatic dental conditions. Evidence of higher reliance on opioids for dental condition management in DPSAs suggests a policy focus on regulations of opioid prescriptions and on resources to raise the healthcare workforce availability of dental professionals, especially in DPSAs with high rates of opioid prescribing.
Conclusion
Using EHR data from Indiana, we find that individuals experiencing an ED visit for a dental condition in a DPSA are 16% more likely than those in non-DPSAs to have experienced an opioid prescription in the month prior to their focal ED visit, after controlling for other covariates. Our correlational results provide suggestive evidence that unmet dental needs may be connected to opioid prescriptions. Further research is needed to establish causality and to rule out other reasons for the observed difference in opioid prescribing between the DPSA and non-DPSA areas. Policy guidance will also improve through studies that consider whether recent opioid prescribing regulations have impacted measures of NTDC visits to the ED in DPSAs as well as the rates of opioid prescribing surrounding dental conditions.
Footnotes
Acknowledgements
We are grateful to Faye Smith and Anna Roberts of The Regenstrief Institute for assistance in understanding the INPC data, and to Madelyn Mustaine for editorial assistance.
Correction (2024):
There are minor updates in the affiliations of the authors since its publication.
Declaration of Conflicting Interests
The author(s) declared no potential conflicts of interest with respect to the research, authorship, and/or publication of this article.
Funding
The author(s) disclosed receipt of the following financial support for the research, authorship, and/or publication of this article: We acknowledge partial funding from the Indiana University Addictions Grand Challenge.
Ethics and Informed Consent Statement
Indiana University’s Institutional Review Board deemed the study exempt from review. There are no Informed Consent concerns for the research as it uses secondary data without direct identifiers.
Funding
The author(s) received no financial support for the research, authorship, and/or publication of this article.