
Abstract
India has been implementing one of the biggest Early Infant Diagnosis (EID) of HIV intervention globally. The turn-around-time (TAT) for EID test is one of the major factors for success of the program. This study was to assess the turnaround time and its determinants. It is a mixed methods study with quantitative analysis of retrospective data (2013-2016) collected from all the 7 Early Infant Diagnosis testing laboratories (called as regional reference laboratories or RRLs) in India and qualitative component that can help explain the determinants of turn-around-time. The retrospective national level data available from the RRLs was analyzed to measure the turn-around-time from the receipt of samples to the dispatch of results and to understand the determinants for the same. The 3 components transport time, testing time, and dispatch time were also calculated. Transport time was analyzed state-wise and the testing time RRL wise to understand disparities, if any. Qualitative interviews with the RRL officials were conducted to understand the underlying determinants of TAT. The Median turn-around-time ranged between 29 and 53 days over the 4 years. Transport time was significantly higher for states without RRL (42 days) than those with RRL (27 days). Testing time varied from RRL to RRL and was associated with incomplete forms, inadequate samples, kits logistics, staff turnover, staff training, and instrument related issues. The TAT is high and can be potentially reduced with interventions, such as decentralization of RRLs; courier systems for sample transport; and ensuring adequate resources at the RRL level.
Keywords
The turn-around-time (TAT) for Early Infant diagnosis (EID) of HIV infection is one of the major factors for success of the program. Evidence have highlighted that even with good enrollment of infants in the program, long TAT result in non-completion of the EID testing cascades for nearly half the infants.
Retrospective data available from the national reference laboratories was analyzed to measure the turn-around-time across the states. In-depth interviews with RRL officials were conducted to understand the challenges for delay in EID testing and communication of test result to ICTC centers and eventually to the caregivers.
TAT is high for EID testing in India and varied across states with RRL and without RRL. Higher TAT can be potentially reduced with interventions, such as decentralization of RRLs; courier systems for sample transport; and ensuring adequate resources at the RRL level.
Background
Access to diagnosis and treatment for HIV has improved globally over the past couple of decades. Early diagnosis of HIV is critical for improved survival and better quality of life and it is a matter of rights.1,2 Early diagnosis among HIV exposed infants is challenging as the commonly used serological tests fail to differentiate between HIV infection and passive immunity received from mother. Detection of virus is the key which warrants a sophisticated laboratory set-up. India rolled out Early Infant Diagnosis (EID) intervention under the National AIDS Control Programme (NACP) in 2010 under which PCR testing facility were made available for HIV exposed infants at 7 regional reference laboratories (RRL). 3
Although, the prevalence of HIV in India is low, the absolute number of HIV exposed infants is estimated to be about 22 000 due to large population base.4,5 These HIV exposed infants are spread over the vast geography of India. Their dried blood samples (DBS) are being collected at integrated counseling and testing centers (ICTC) and transported to the 7 RRLs. Detection of HIV-1 in 2 separate samples forms the basis of diagnosis under 18 months of age. The EID service consists of the complex algorithm of collection of DBS samples at scheduled periods of 6 weeks, 6, and 12 months for detecting virus, transportation of DBS samples to RRL, communication of test results to ICTC and then to the caregiver, collection of the second DBS sample for conformation of diagnosis (for cases with virus detection in the first sample) and subsequent follow-up for further testing till 18 months of age. The turn-around-time (TAT) for testing these DBS sample is therefore critical from the point of view of early diagnosis. TAT must be very short in order to ensure early diagnosis so as to commence early initiation of Anti retroviral treatment among HIV diagnosed infants which will further prevent morbidities and mortalities among them. Global literature highlights that even with good enrollment of infants in the program, long Turn-around-time (TAT) result in non-completion of the EID testing cascades for nearly half the infants. 6
There have been studies in India that have attempted to study the challenges associated with of Early Infant Diagnosis (EID) of HIV. However, these studies have been limited to a few centers6,7 or a state,8,9 or a review based upon such studies. 10 Although, these studies have documented that some children failed to complete the diagnostic cascade, these do not provide information on TAT. TAT includes time to transport the samples from the peripheral facility (ICTC) to the RRLs, time taken to test the samples at the RRLs and time taken to send results back. This study was therefore undertaken to measure the total TAT, time for each of these 3 components of TAT and the underlying barriers for timely testing of the samples and communication of test results to the peripheral centers.
Methods
The study design is mixed methods with both quantitative and qualitative components. HIV-1 PCR Test Requisition cum Results Form (TRRF) is the primary document that records particulars of a HIV exposed infant, sample collection, transport, and testing details. TRRF is filled at ICTC where Dried Blood Spot (DBS) sample is collected and TRRF is sent to the RRL along with the sample. In 2013 till August 2015, the EID testing was being done using the AMPLICOR HIV-1 DNA Test, version 1.5 by Roche where the reagents for DNA extraction, PCR amplification, and detection were provided in the kit. All the RRLs were having similar testing as it was provided by NACP. However, in September 2015 all RRLs were shifted to US FDA approved m2000 RealTime system by Abbott using the Abbott RealTime HIV-1 Qualitative kit. After testing, data from TRRF is digitized and maintained by the respective RRL in database designed by NACO. This database was used for analysis of the data. For the purpose of measuring the TAT, “date of sample collection,” “date of receipt of sample at RRL,” “date of testing,” and “date of dispatch of results” were utilized. Quantitative component included retrospective analysis of this database for a total period of 4 years (2013-2016). The sample was holistic and included the analysis of all samples tested at all the laboratories during the period. Out of the 7, 1 each was in the north (R-NR) and the east regions (R-ER), 2 in West (R-WR1 and R-WR2), and 3 in the South (R-SR1, R-SR2, R-SR3).
The selection of laboratories to be visited for qualitative data collection was done after preliminary analysis of the secondary data and with geographic representation. Two laboratories with consistent lower median times (R-NR, R-WR1) and 2 laboratories with wide variation in the testing times (R-SR1, R-ER) were visited in order to capture the facilitators and barriers to the process. At these 4 RRLs, in-depth-interviews (IDI) were conducted with the officials in-charge of the RRLs, laboratory technician and laboratory supervisors involved in EID testing to assess challenges with conducting PCR test under EID. Two to three IDIs were conducted at each RRL and data saturation was achieved. Interviews took approximately 30 min. Additional quantitative data was also collected during the RRL visits and included observation and review of records such as quality control documentation, documentation related to sample quality, and rejected samples.
At the 4 RRLs visited, the quality control documentation included review of records. These includes Standard Operating Procedures, quality control records and reports (for 4 randomly selected months), testing logs for 10 cases, proficiency testing records, 4 documents regarding receipt and processing of the samples, 4 documents regarding logistics such as kit instructions, instrument calibration, stock, parallel tests, and 4 training related documents. Records of all the samples rejected from April 2015 to March 2017 was examined and the reasons for rejections were noted. Out of these, the cases where a fresh sample was received was also counted and the time duration between the rejected sample and the receipt of the fresh sample was also noted.
Ethics Approval and Consent to Participate
The study was approved by the Institutional Ethics Committee of ICMR-National AIDS Research Institute, Pune (Ref no. NARI/EC/15-16/145) and Institutional Review Board of Tata Institute of Social Sciences, Mumbai (Ref no. TISS/IRB/19Dec2014), and National AIDS Control Organisation (NACO) ethics committee (Ref no. 02/14/TRG). All research study methods were carried out in accordance with relevant guidelines and regulations. Written informed consent was recorded from all the participants at RRLs.
Data Analysis
Transport time, time for testing, and dispatch time were calculated using the available dates (date of sample collection, date of receipt of sample, date of testing, and date of dispatch of results). The TAT was calculated as time difference between the date of collection of sample and date of dispatch of results and was calculated year-wise. Testing time was analyzed RRL-wise. Kruskal-Wallis test was used for comparison of median times year-wise and RRL-wise. Transport time was analyzed state-wise to understand the disparities. Mann-Whitney U test was used to check whether mean transport time varied for states with RRL than those without RRL. For the documentation with respect to quality control; SOPs, quality control records and quality control reports for 4 months were assigned 3 points each (9 documents, 3 points each, therefore total 27 points) and rest of the documents (23 points) were assigned one point each. A total score of 50 was thus arrived upon. Data on rejection of samples was tabulated, proportion of rejected samples where a fresh sample had been received was noted and the median time for receipt of next sample was calculated. Data was analyzed using Microsoft excel.
The in-depth interviews were audio recorded, transcribed, and translated. The transcripts were read and re-read by the study team that is, research interns, research officers, and the investigators. Data was coded using thematic codes based on study objective and existing literature. Coded data was re-read and interpreted on thematic lines. Atlas-ti v6 was used for qualitative analysis.
Results
The overall median turn-around-time (TAT) was 53 days in 2013. This declined to 29 days in 2014, again rose to 49 days in 2015 and falling again in 2016 to 29 days (Figure 1). Figure 1 also shows that the largest variation was for median testing time which varied from 6 to 21 days. Median transport time varied between 11 and 14 days and median dispatch time remained within 2 to 3 days over the 4 years. Table 1 provides the inter-quartile ranges in addition to the median time. The year-to-year variation was statistically significant at P < .01 (Kruskal-Wallis test).

Trend of median turn-around-time (TAT) for PCR test of HIV exposed Infants, India (2013-2016).
Turn-Around-Time (TAT) for PCR Test of HIV Exposed Infants, India (2013-2016).
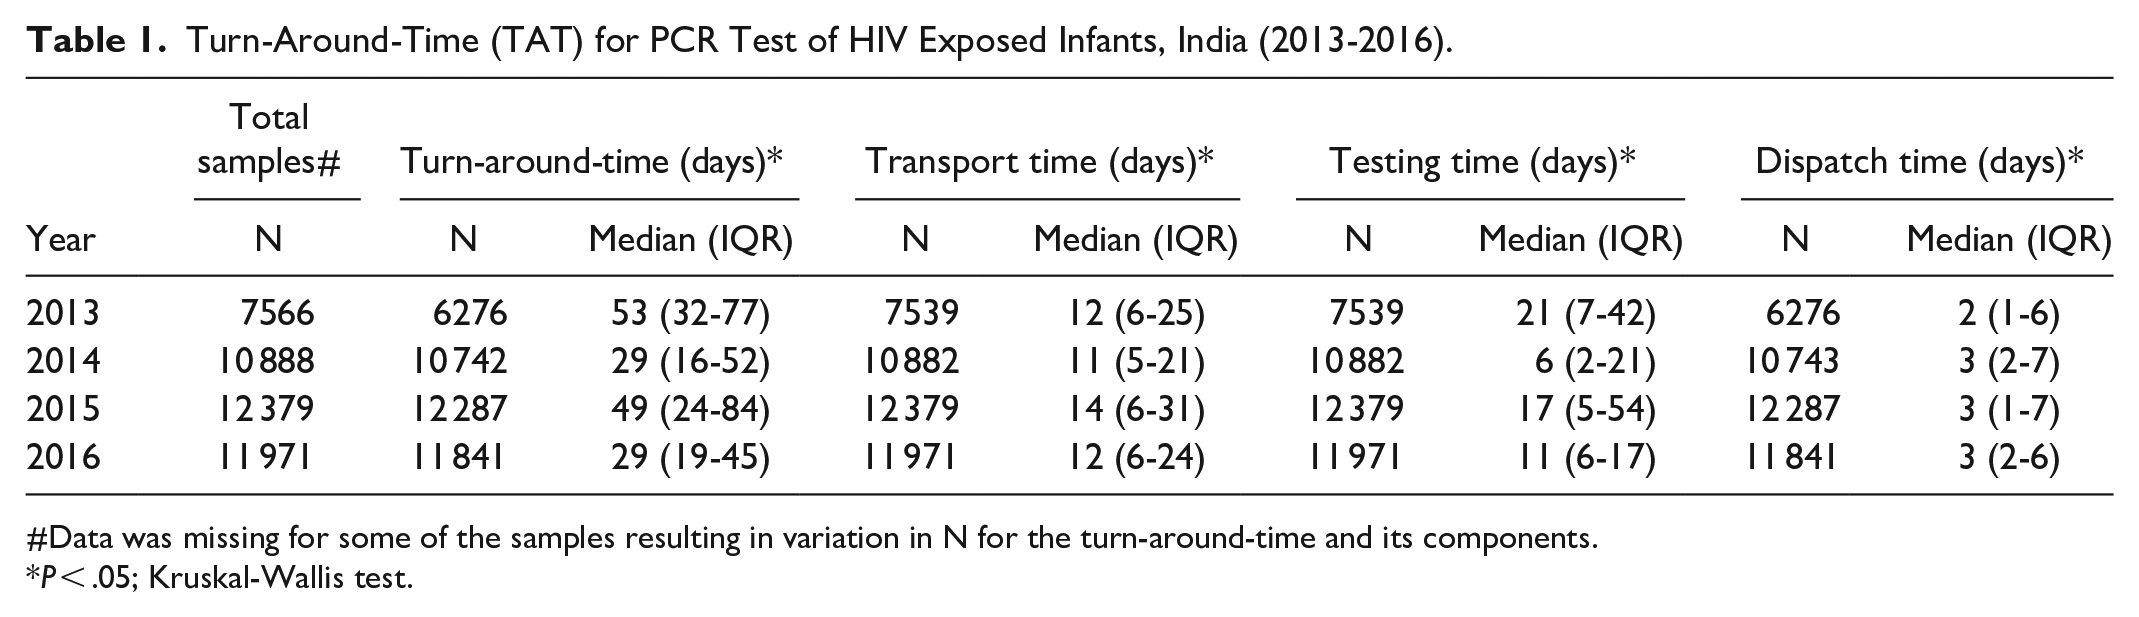
#Data was missing for some of the samples resulting in variation in N for the turn-around-time and its components.
P < .05; Kruskal-Wallis test.
Transport Time
Time taken to transport samples from the point of collection to the testing laboratories varied geographically (Figure 2). The 7 testing laboratories were located in 5 states with Maharashtra and Tamil Nadu having 2 each and Karnataka, West Bengal, and Delhi having 1 each. The figure shows that the transport time was low for these 5 states co-located with RRLs (except West Bengal). Eastern and north-eastern states had higher transport time. Median transport time in the 5 states with RRL (Median 9 days; IQR 4-17 days) was significantly smaller (Mann-Whitney U test, P < .01) than in the remaining states (Median 16 days; IQR 8-33 days). This also contributed to significantly smaller TAT for these 5 states (Median 27 days; IQR 15-55 days) compared to that in the rest of the states (Median TAT 42 days; IQR 26-71 days).
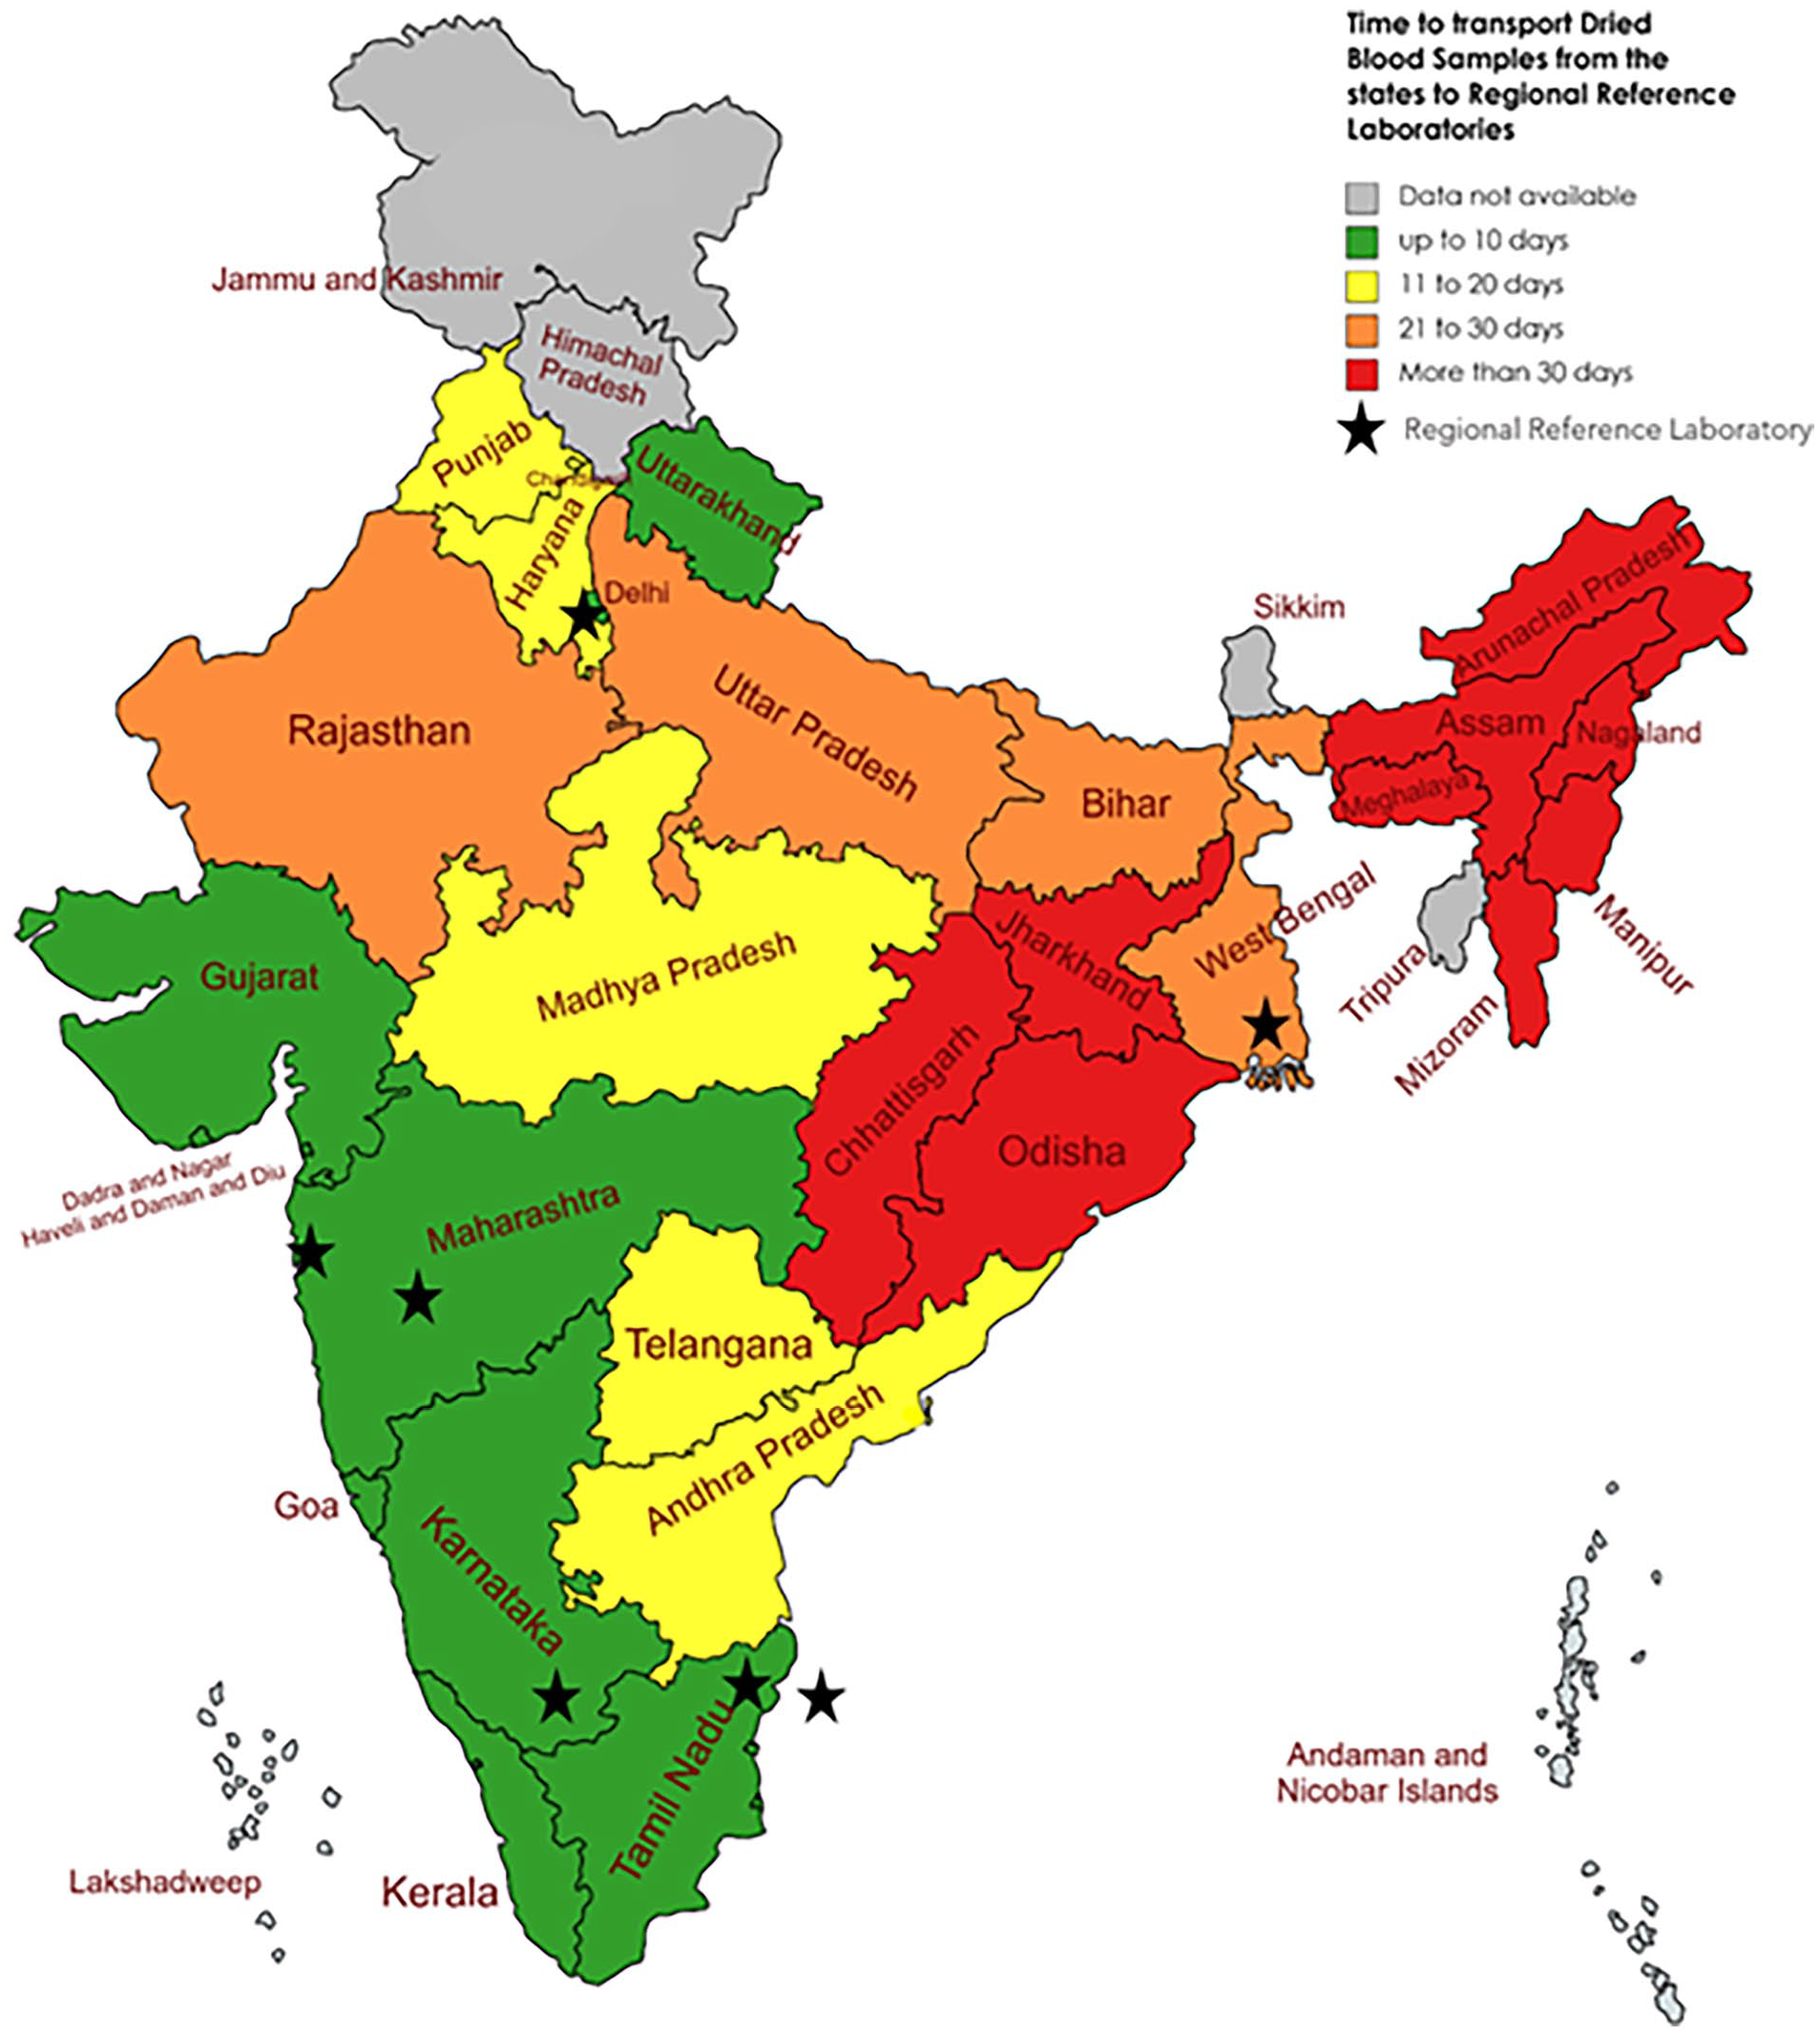
State-wise transport time for dried blood spot samples and location of the regional reference laboratories, India (2013-2016).
The qualitative interviews revealed the underlying reasons. The samples were collected at multiple integrated counseling and testing centers (ICTCs) that were spread across the length and breadth of the country. Sample courier systems had not been operationalized for most geographies. In certain cases, the samples were first sent to a hub (district or regional town) and then transported from the town to the laboratory. There were also cases where the laboratory technicians traveled long distances in trains and personally carried their samples and that of neighboring ICTCs to RRL. Usually, the number of samples collected per month at any given ICTC was a single digit number. There was a tendency to wait till the next sample/s was collected at ICTC and then the samples were transported together; this happened more often around the holidays.
Testing Time
RRL personnel reported various issues related to sample labeling such as, no unique identification Digit (UID) written on DBS card or TRRFs, new UID numbers given to repeat samples of a child, improper address, TRRFs filled in local languages, samples sent without TRRFs, and incompletely filled or poorly photocopied TRRFs making it difficult to read and record. This occurred typically with turnover of staff at ICTCs or newer ICTCs starting EID services. These issues were resolved by communication with the ICTC laboratory technicians. In case of late response from the ICTCs, the samples were kept pending, resulting in delayed testing.
Logistical reasons
All RRLs reported interruptions in supply of the testing kits about 2 times in the 4-year period indicating that it was not perennial issue. But when it did occur as in 2015 to 2016, the samples had to be kept waiting till the next batch of testing kits arrived. Upon arrival of the kits, they had to clear all the back-log which was very challenging. At times, converse was true. If they had fewer than 24 samples, they had to wait to get 24 samples at least to run one test batch.
Staff turnover and training
RRL personnel reported that salaries provided for LT (Laboratory Technician) were very low as compared to market rates both in public and private sector. There was also delay in payment of salaries sometimes up to 6 months. The RRL personnel reported high turnover of the staff leading to interruption in the services. Time also had to be earmarked for the training and proficiency testing of the newly recruited laboratory technicians before they could be assigned responsibilities. The training had to be coordinated with the manufacturer of the PCR testing equipment and the availability of the trainer from the manufacturer resulted in time lag at times.
Instrument Issues and Analytical Errors
Instrument issues and analytical errors included low florescence, high cycle number, internal control failure, and calibration errors. For technical errors such as bubbles in the samples, re-running would resolve the issue. But for the calibration and instrument errors, assistance was needed from the manufacturer. The maintenance service was not available at some cities and the maintenance personnel had to travel from Delhi which added to the delay. Later, the service centers also opened in other cities which improved the idle time of the analyzers and resulted in shorter median annual testing times.
Financial issues
RRLs reported that contingency funds were not provided timely and funds provided were insufficient. This had affected testing and reporting of received samples. Contingency funds were used to buy consumables such as 50 ml tubes, Falcon tubes, alcohol etc. Delay in funds led to delay in procurement.
Given the wide variation in year-to-year testing times, further analysis was attempted RRL-wise. Figure 3 shows that 3 laboratories namely R-ER, R-WR1, R-SR2 has shorter and more consistent median testing times (less than 2 weeks).

Median testing time for PCR test on dried blood samples received at the Regional Reference Laboratories, India (2013-2016).
Quality control documentation was very good for 2 RRLs, namely R-NR (total score 50) and R-SR1 (46). The scores were less for R-ER (38) and R-WR1 (22). At both R-ER and R-WR1 the data pertaining to more than 2 years ago could not be retrieved during the field visit and that resulted in lower scores. A total of 16 229 sample were received at the 4 RRLs during the 2-year reference period (April 15-March 17). A total of 412 (2.5%) of the samples were rejected. Table 2 shows that most common reasons were poor sample quality (271) and sample age more than 12 weeks (124). Insufficient quality and packaging error where multiple DBS cards were packed in same cover with potential of contamination were most common types of poor-quality samples. Out of these 412 rejected samples, repeat sample were received in 55 (13.3%) cases with 4 of them being PCR positive. Median time between the first sample and the repeat sample in case of rejection of sample was 124 days (IQR 91-179 days).
Sample Rejections and Reasons at Regional Reference Laboratories, India (April 2015-March 2017).

Dispatch Time
Initially, the reports were to be printed, signed by RRL in-charge and couriered. Incomplete address in the TRRF posed challenge in timely dispatch. The program adopted electronic reporting which ideally should have decreased the time. But, due to incorrect email addresses or errors in codification of the ICTCs, full potential of the electronic reporting was not realized. The RRL used email communication to address the issue of incorrect codification of ICTCs. Two RRL in-charges emphasized the need of the hard copy stating that electronic data transfer would help ICTC know the result but the affected family must get a report in their hands.
Discussion
The study has revealed that the turn-around-time for PCR test was found to be high; ranging from 29 to 53 median days over the 4 years. Many sub-Saharan African nations that implemented the EID intervention also faced high turn-around-times exceeding a month.11-16 The findings from this study highlight specific issues in India which can be addressed by adopting appropriate strategies to reduce the TAT. High TAT will in turn result in delaying HIV diagnosis and further delay in initiation of ART treatment among HIV diagnosed infants. The ultimate aim of EID diagnosis is initiation of Early ART among these children in order to reduce further morbidity and mortality.
Transport time was a key bottleneck and did not improve over the 4 years. Qualitative data revealed that courier systems for transport had not been operationalized resulting in practices such as traveling to RRL with samples or hoarding to samples till sufficient number of samples were collected. It is pertinent that courier systems are used to send the samples as soon as possible. However, it also holds true that the reach of the courier systems may not be good at sub-district level. Uganda used a hub model 17 which if applied in Indian context may help. As each Indian district is supervised by a nodal officer for HIV/AIDS, one of the strategies could be that all samples from the district can be collected at the district level and be sent at least once a week to RRL so that there is no delay, and the process gets monitored as well.
Analysis showed that states with RRLs performed far better with respect to the transport time. North-eastern states had higher transport time mainly because of hilly terrain. It is therefore apt to decentralize the testing to other states. It is estimated that India has about 22 000 HIV positive pregnancies every year.4,5 If India is able to achieve its first target of 95-95-95, then the workload of the existing laboratories will almost double, making it unsustainable. All major states are upgrading their viral load testing facilities in order to cater to the patient and achieve the last 90 of achieving viral suppression. These same laboratories can be used for EID testing as the resources needed are available there. Such decentralization will also help states as administratively it will be easier to coordinate the sample transport within a state than manage inter-state. WHO recommended Point of care (POC) test for HIV exposed infants. There is also ample of evidence18-25 on feasibility and validity of point of care (POC) HIV test for early infant diagnosis. POC tests are easy to use, have rapid turnaround times, and comparable accuracy and precision to reference technologies. POC EID testing can address most of the challenges for EID testing in India pertaining to TAT. At birth POC EID test will have an added advantage of early HIV diagnosis among infants born to mothers with high viral load. POC EID testing at birth need to be piloted in certain select geographies reporting high turn-around-time.
Testing time was related to incomplete TRRFs, logistics of kits and consumables, machines and human resource. The supply of the kits was a topical issue in 2015 to 2016 and not consistently a challenge, and it could not explain wide variation in the testing times of the laboratories at the same time. Staff turnover, time spent in training the new person, instrument related issues explained the variations in testing time. Pay parity, job rotation, and decentralization of services may be possible solutions. Rejection of samples because of insufficient quantity, layered and contaminated samples, and sample age more than 12 weeks also increased the testing time. The qualitative observation findings indicate workflow and SOP issues that are consistently causing the testing delay. Better SOPs and laboratory processes and commitment to faster testing remains the main key for decreased testing time.
There is evidence from several studies that use of technology has helped reduce the turnaround times. 26 In the present study, the courier paper-based transmission of reports had already been replaced by an electronic system before the data collection. However, the mismatch of coding of facilities created some delays and confusions. It is imperative that the coding errors get fixed so that both ICTC and RRL use same codes and that the information flows flawlessly to the ICTCs from RRLs.
Although the sample rejection was uncommon (2.5%), repeat sample was received from very few infants and after a long delay of time. It is important also to note that more than half of the samples rejected at R-SRI laboratory were due to sample age >12 weeks highlighting the delay in sample transportation to RRLs.
The study has a few limitations. Typically turn-around-time (TAT) is measured from the time of drawing of blood to the receipt of results by caregivers. As this analysis was based on RRL level data only, we could not study the ICTC level challenges like sample collection, delay in transportation and communication of test result to the beneficiaries. Being a laboratory system-based analysis, we could not study upon how many babies were initiated ART after confirmation of HIV diagnosis. Though we observed high transportation time in hilly terrain areas of north-east states, we could not study the impact of environmental factors and climate on testing time. The data used in the present analysis is of years 2013 to 2016, there are no major changes in EID program thereafter with respect to the decentralization pertaining to increased network of RRLs and other implementation strategies. Hence, the findings are still relevant for action. Qualitative data has identified reasons for delay in turnaround time and further studies are needed to quantify the impact of each of these factors.
Conclusion
The TAT for HIV testing among new born babies is considerably high and can be potentially reduced with interventions, such as decentralization of RRLs; courier systems for sample transport; and ensuring adequate resources at the RRL level.
Footnotes
Acknowledgements
We thank National AIDS Control Organisation (NACO), all the regional reference laboratories, ICTCs, and staff at the facilities for sharing the data and participating in the study.
Author contributions
NG, SK, and DJ conceptualized the study and developed the study protocol.NG, SK, NoG, SuK, SwK, SG, VV, RS, SN, SR, and CD were involved for study implementation and data collection. NG, SK, NoG, KN, SuK analyzed and interpreted the study data. NG, SK, NoG, DJ, KN, SuK, SwK, SG, VV, SR, CD were involved in manuscript writing. All authors read and approved the final manuscript. NG and SK contributed equally.
Availability of data and materials
The datasets used and/or analyzed during the current study are available from the corresponding author on reasonable request.
Ethics approval and consent to participate
The study was approved by NACO Ethics Committee (Ref no. 02/14/TRG), Institutional Ethics Committee of ICMR National AIDS Research Institute, Pune (Ref no. NARI/EC/15-16/145), Institutional Review Board of Tata Institute of Social Sciences, Mumbai (Ref no. TISS/IRB/19Dec2014). All research study methods were carried out in accordance with relevant guidelines and regulations. Written informed consent was recorded from all the participants at RRLs.
Consent for publication
Informed consent was obtained for conducting In Depth Interview of the study participants.
Registration number in case of clinical trials
NA
STS number in case of student IJMR
NA
Declaration of conflicting interests
The author(s) declared no potential conflicts of interest with respect to the research, authorship, and/or publication of this article.
Funding
The author(s) disclosed receipt of the following financial support for the research, authorship, and/or publication of this article: The study was commissioned by the National AIDS Control Program (T.11020/98/2014-NACO (R&D)) and funded through The Global Fund Against AIDS, TB and Malaria (GFATM) grant.