
Abstract
Hypertension has become a major public health challenge and a crucial area of research due to its high prevalence across the world including the sub-Saharan Africa. No previous study in South Africa has investigated the impact of blood pressure risk factors on different specific conditional quantile functions of systolic and diastolic blood pressure using Bayesian quantile regression. Therefore, this study presents a comparative analysis of the classical and Bayesian inference techniques to quantile regression. Both classical and Bayesian inference techniques were demonstrated on a sample of secondary data obtained from South African National Income Dynamics Study (2017–2018). Age, BMI, gender male, cigarette consumption and exercises presented statistically significant associations with both SBP and DBP across all the upper quantiles
Keywords
Hypertension has become a major public health challenge and a crucial area of research due to its high prevalence across the world including the sub-Saharan Africa.
A comparative analysis of the classical and the Bayesian approaches to quantile regression in order to study the effect of blood pressure risk factors on the upper quantiles of blood pressure`s distribution.
To recommend statistical methods (models) for making reasonably robust and precise inferences about the risk factors of hypertension among South African adults.
Introduction
Worldwide, approximately 17 million deaths a year are caused by cardiovascular diseases. 1 Out of these human losses, high blood pressure accounts for approximately 9.4 million deaths globally every year. 2 A recent study 3 has revealed that there is a high prevalence of hypertension and associated cardiovascular diseases in sub-Saharan Africa. In sub-Saharan Africa, South Africa has the highest prevalence of hypertension (between 42% and 54%) and also the largest number of people whose blood pressure is still not controlled, even whilst being on treatment. 3
Due to the high prevalence of raised blood pressure across the world including the sub-Saharan Africa, it is crucial to research on possible risk factors of hypertension in order to minimise their effect in the lifestyle of individuals. Most studies have performed modelling of hypertension using binary and multiple logistic regression.4-9
Quantile linear regression has emanated as a useful additional technique to either binary logistic regression or classical linear regression. Basically, quantile regression is a natural extension of classical linear regression. Quantile regression models the impact of predictors on different specific quantiles (or percentiles) of the response distribution, and thus provides a more comprehensive picture of the relationship between predictor variables and the response variable.
Binary logistic regression and multiple logistic regression require the dependent variable to be binary and ordinal, respectively, limiting the accuracy of the results as compared to quantile regression which uses continuous dependent variables. 10
Classical linear regression provides a simple way of exploring how the mean of a response variable changes with the effect of predictor variables whilst quantile regression does focus on estimating families of conditional quantile functions. If quantile regression estimates are run simultaneously for
Quantile regression models have become popular because estimates are more robust against outliers in the response measurements than classical regression models. Also, quantile regression makes no distributional assumption about the error term in the model and thus enables it to accommodate non-normal errors which are common in many applications. Another main advantage of quantile regression as compared to ordinary least-squares regression is its ability to model data with heterogeneous conditional distributions such that it is now being applied to model panel data, time series data, conditional extreme value, nonlinear models, binary response models and duration models. 12
However, the Bayesian approach to quantile regression may lead to exact inference in estimating the influence of potential risk factors on the upper quantiles (75% and 95%) of the conditional distribution of hypertension as opposed to the asymptotic inference of the classical or frequentist quantile regression. 13 Furthermore, Bayesian quantile regression does provide estimations and predictions which take into account parameter uncertainty. 14 In Bayesian inference, population parameters are associated with a posterior probability or distribution which quantifies the value of the parameter of interest.
A comparative study between Bayesian and frequentist approaches in the analysis of risk factors for female cardiovascular disease (CVD) patients in Malaysia revealed that the Bayesian approach was a better one due to smaller standard errors obtained from the Bayesian approach than the frequentist approach. 15
Therefore, the aim of this study is to conduct a comparative analysis of the classical and the Bayesian approaches to quantile regression in order to study the effect of blood pressure risk factors on the upper quantiles of blood pressure`s distribution. Thus, systolic blood pressure (SBP) and diastolic blood pressure (DBP).
Materials and Methods
This section gives an account of how the Bayesian approach to quantile regression framework was carried out in order to study the effect of blood pressure risk factors on different quantiles of blood pressure`s distribution. Thus, the data, study variables, theoretical model and data analysis techniques.
Data and Variables
This was a retrospective study performed on a nationally representative sample obtained from the South African National Income Dynamics Study (NIDS) Wave 5 Household survey conducted between 2017 and 2018. NIDS was embarked in order to assess the welfare of South African individuals across the entire country.
The study employed multi-stage sampling to randomly select a sample of 30 110 adults aged 18 years and above. Trained fieldworkers were instructed to collect the data. A total of 21 180 cases were found valid after data cleaning.
The study variables included systolic blood pressure and diastolic blood pressure as the response variables. Predictor variables were age, body mass index (BMI), gender, race, exercises, cigarette consumption, depression and employment status.
The ethics approval to conduct the NIDS study was granted by the University Of Cape Town Faculty Of Commerce Ethics Committee and informed consent was attained from each study participant.
Bayesian Quantile Regression
Quantile regression seeks to estimate models for the conditional quantile functions. 16 Quantile regression is particularly useful in applications where extremes are important, such as blood pressure where upper quantiles (tails) of systolic and diastolic blood pressure levels are critical from a public health perspective.
Bayesian approach to quantile regression is normally carried out by formulating a likelihood function based on the asymmetric Laplace distribution irrespective of the actual distribution of the data. 14 Generally, any prior can be chosen for each of the quantile regression parameters, but it has been shown that the use of improper uniform priors produces a proper joint posterior distribution. 14 Bayesian quantile regression approach produces exact inference and accommodates missing, clustered or censored data. 17
Since the Bayesian framework is formulated on a likelihood function based on the asymmetric Laplace distribution,
14
a random variable


For all other values of
The mean of
And the variance is given by
If the location and scale parameters

Now given the observations,


However, any prior can be used for
Data Analysis
IBM Statistical Package for the Social Sciences (SPSS) version 27 was used to generate descriptive statistics in form of proportions for categorical variables. The quantreg R package 19 was employed to fit the classical quantile regression models.
Bayesian approach to quantile regression was implemented by adopting MCMC algorithms contained in the R package called MCMCpack. 20 Models produced by MCMCpack return coda MCMC objects that can then be summarised by the coda package. The coda package provides functions for summarising and plotting the output from the MCMC simulations, as well as diagnostic tests of convergence. 21 This study considers 2 quantile models at the 75th and 95th percentiles. When modelling hypertension, it makes more sense to model high values of systolic and diastolic blood pressure which corresponds to the upper distribution of either SBP or DBP. 22
MCMC algorithms have emerged as very useful and popular tools for fitting Bayesian statistical models in modern Bayesian computing. According to Sinharay (2003), the key reason why MCMC algorithms have become useful and popular is that the algorithms can fit quite complex models easily as compared to standard techniques such as maximum likelihood estimation (MLE).
Results
Empirical results of this study are presented in this section, in form of tables and figures.
Blood Pressure among South African Adults by Demographic and Life Style Characteristics.

It can be seen from Table 1 that hypertension was more prevalent in men than women for both BP measures. Concerning race, Table 1 illustrates that elevated high blood pressure was most prevalent among coloured participants when looking at both SBP and DBP proportions.
It is evident from Table 1 that the prevalence of hypertension increased with age, with the 50 years and above age group recording the highest proportions for both blood pressure measures. The same trend was observed with BMI, whereby the proportions of raised blood pressure were increasing with the level of BMI. Underweight and healthy respondents had the lowest prevalence whilst the very and morbidly obese had the highest prevalence.
In regard to exercises, it is apparent that the study participants who do not participate in physical activities recorded the highest proportions of high blood pressure. There was not much difference in elevated blood pressure among the 3 levels of depression. It is apparent from Table 1 that participants who do smoke recorded the highest proportions of hypertension for both BP measures.
Mixed results were observed on employment status, unemployed participants recorded a higher proportion of hypertension when looking at SBP whilst employed respondents had a higher prevalence of hypertension when viewing the DBP figures.
Classical and Bayesian Quantile Regression Estimates for SBP’s Risk Factors.

Table 2 presents the upper classical quantile regression coefficients and the related 95% confidence intervals for SBP’s risk factors. Also, Bayesian posterior means and the associated 95% credible intervals in parentheses for each SBP`s risk factor are shown. The 95% credible interval is the range of values in which the researcher is 95% certain that the population mean,
On the Bayesian quantile regression analysis, a sample of 20 000 iterations was drawn from each Markov chain, of which 5000 samples were discarded as burn in. Independent improper uniform priors were assigned for all coefficients estimated and each of the parameters was run using a random walk Metropolis–Hastings algorithm (MH algorithm).
It can be seen from Table 2 that age, BMI, gender and cigarette consumption revealed statistically significant associations with SBP across all the upper quantiles as indicated by both the 95% confidence and 95% credible intervals which do not include 0. Depression did not present significant relations with SBP on both the 75th and 95th quantiles. Finally, exercises presented a significant coefficient with only the 95th quantile of SBP’s distribution.
Classical and Bayesian Quantile Regression Estimates for DBP’s Risk Factors.

Diagnostic Tests of Convergence
Convergence occurs when the generated Markov chain converges in distribution to the posterior distribution of interest. 23 Convergence in Bayesian inference is critical because it deals with the accuracy with which the integrals are computed. 25 Convergence of the MCMC algorithm enables the output of the Bayesian inference or posterior simulation results to be reported accurately.
In this paper, convergence was assessed using the trace plots or time-series plots and the density plots. It is of utmost importance to apply several diagnostic tools for assessing the convergence. 23 The convergence diagnostics are meant to check stationarity of the Markov chain and verify the accuracy of the posterior summary measures. 25
Figure 1 illustrates both the trace and density plots for each predictor variable of SBP obtained after running the MH algorithm for 20 000 iterations discarding 5000 samples as burn in. A trace plot is a time series plot showing the generated values of a parameter for each iteration in a chain.
23
Trace plots are most popular in checking convergence of an MCMC algorithm. If the chain has reached stationarity, the trace plot should appear as a horizontal strip and the individual moves are hardly discernable.
25
This is the foundation of the thick pen test.
26
The thick pen test does check whether the trace plot is covered by a thick pen. The mean and the variance of the trace plot should be relatively constant when stationarity occurs. Also, a trace plot shows the mixing rate of the Markov chain. Trace and density plots for SBP’s risk factors.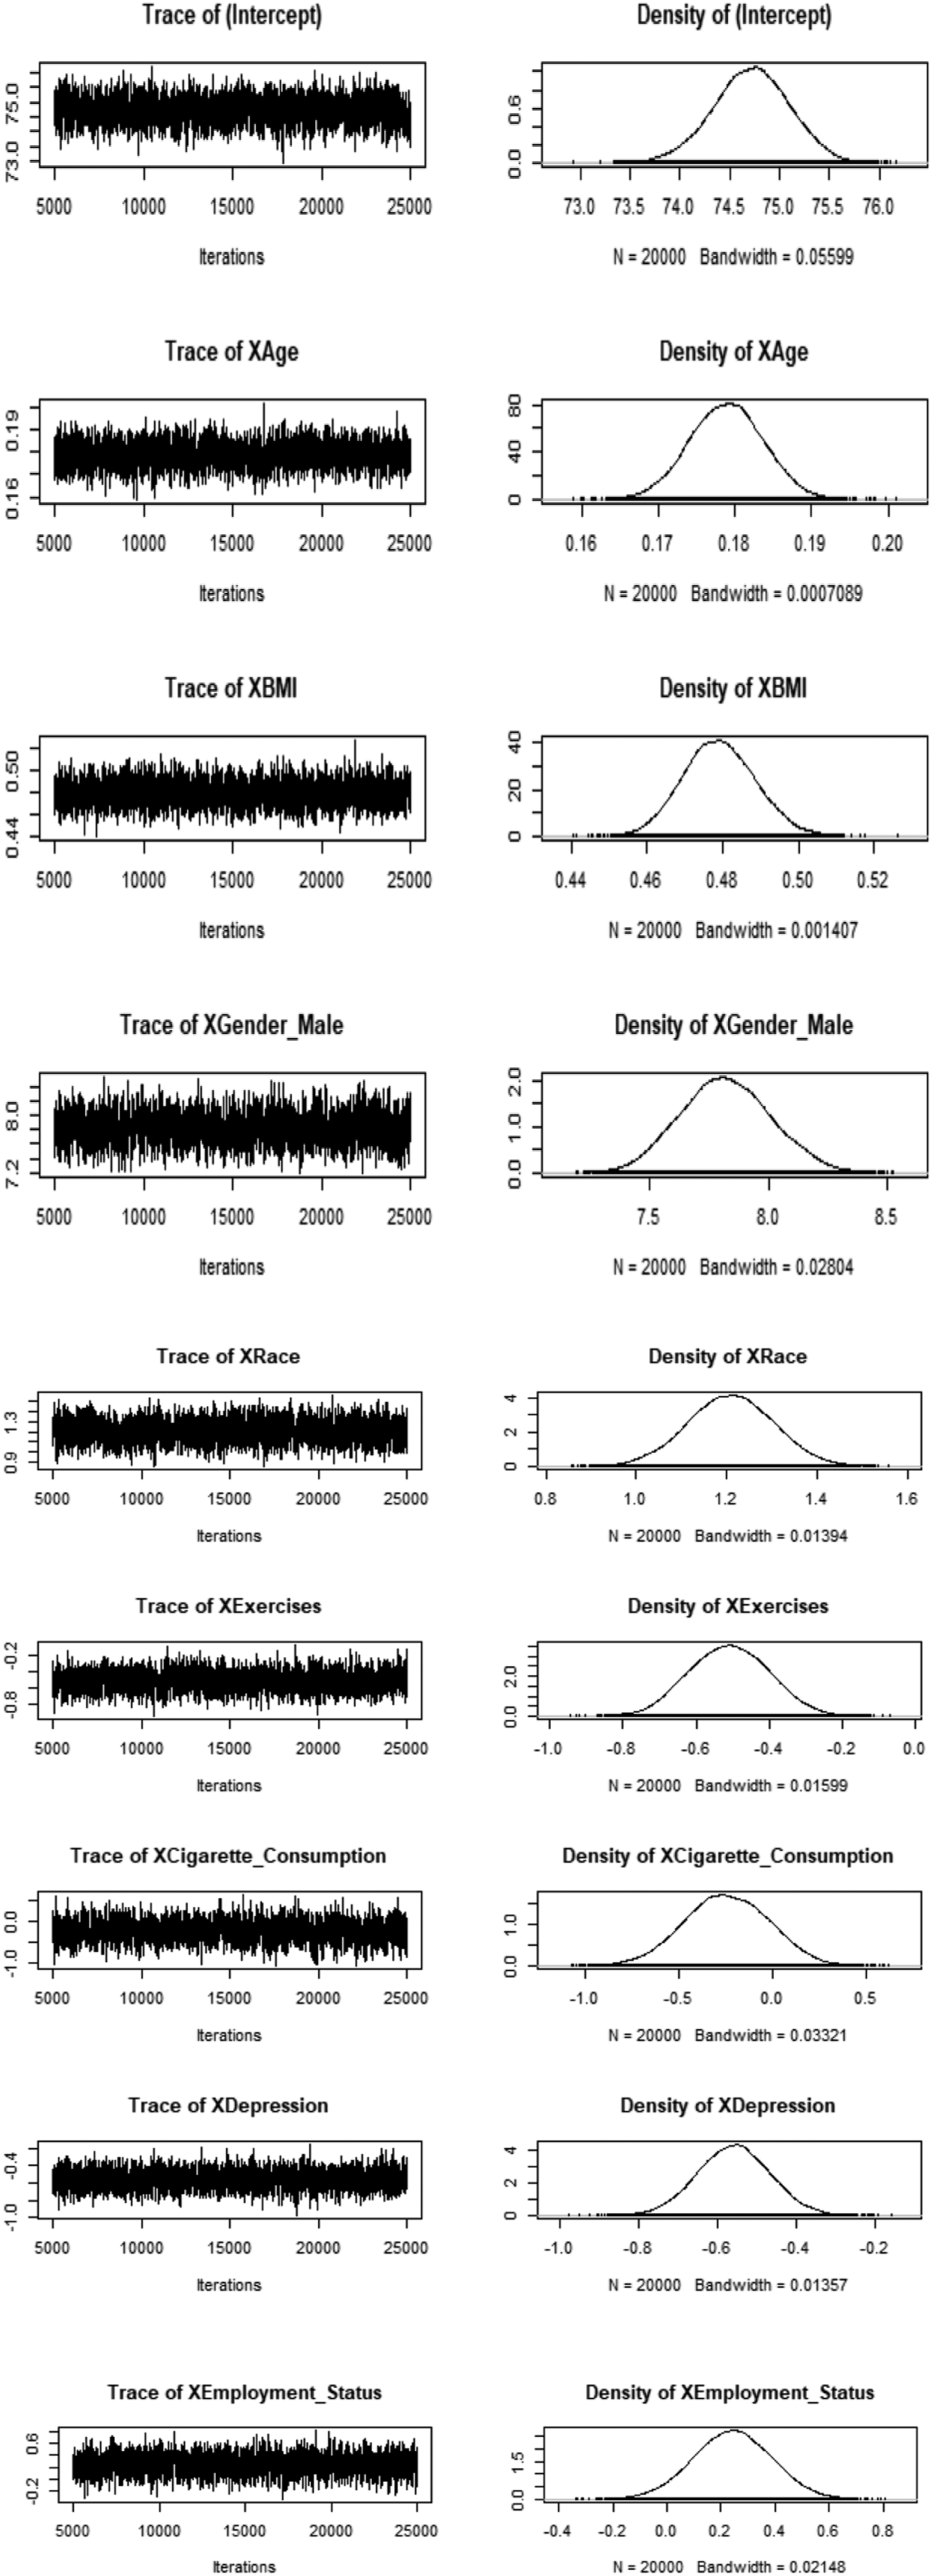
All the trace plots in Figure 1 do pass the thick pen test. No obvious trend is shown on all the time-series plots. The beginning of the runs looks almost similar to the end, implying that the chains mixed well and reached stationarity.
A density plot is a summary of the sampled values that define the stationary distribution of values, which approximates the posterior distribution of interest. 27 The peak of a density plot is known as the maximum a posteriori estimate. Basically, it is the mode of the distribution. Strange and unexpected peaks of a density plot can be a sign of poor convergence.
It is evident from Figure 1 that all the kernel density plots reflect convergence, showing that the Markov chain was able to find a smooth distribution.
The trace plots for DBP’s risk factors illustrated in Figure 2 suggest that the chain is wandering through the same region of the parameter space and has found the stationary distribution. To ensure convergence, a burn-in of 5000 iterations was adopted. All time-series plots were generated through running the MH algorithm for 20 000 samples after the burn-in period. Also shown in Figure 2 are the smooth density plots for all DBP’s risk factors. Trace and density plots for DBP’s risk factors.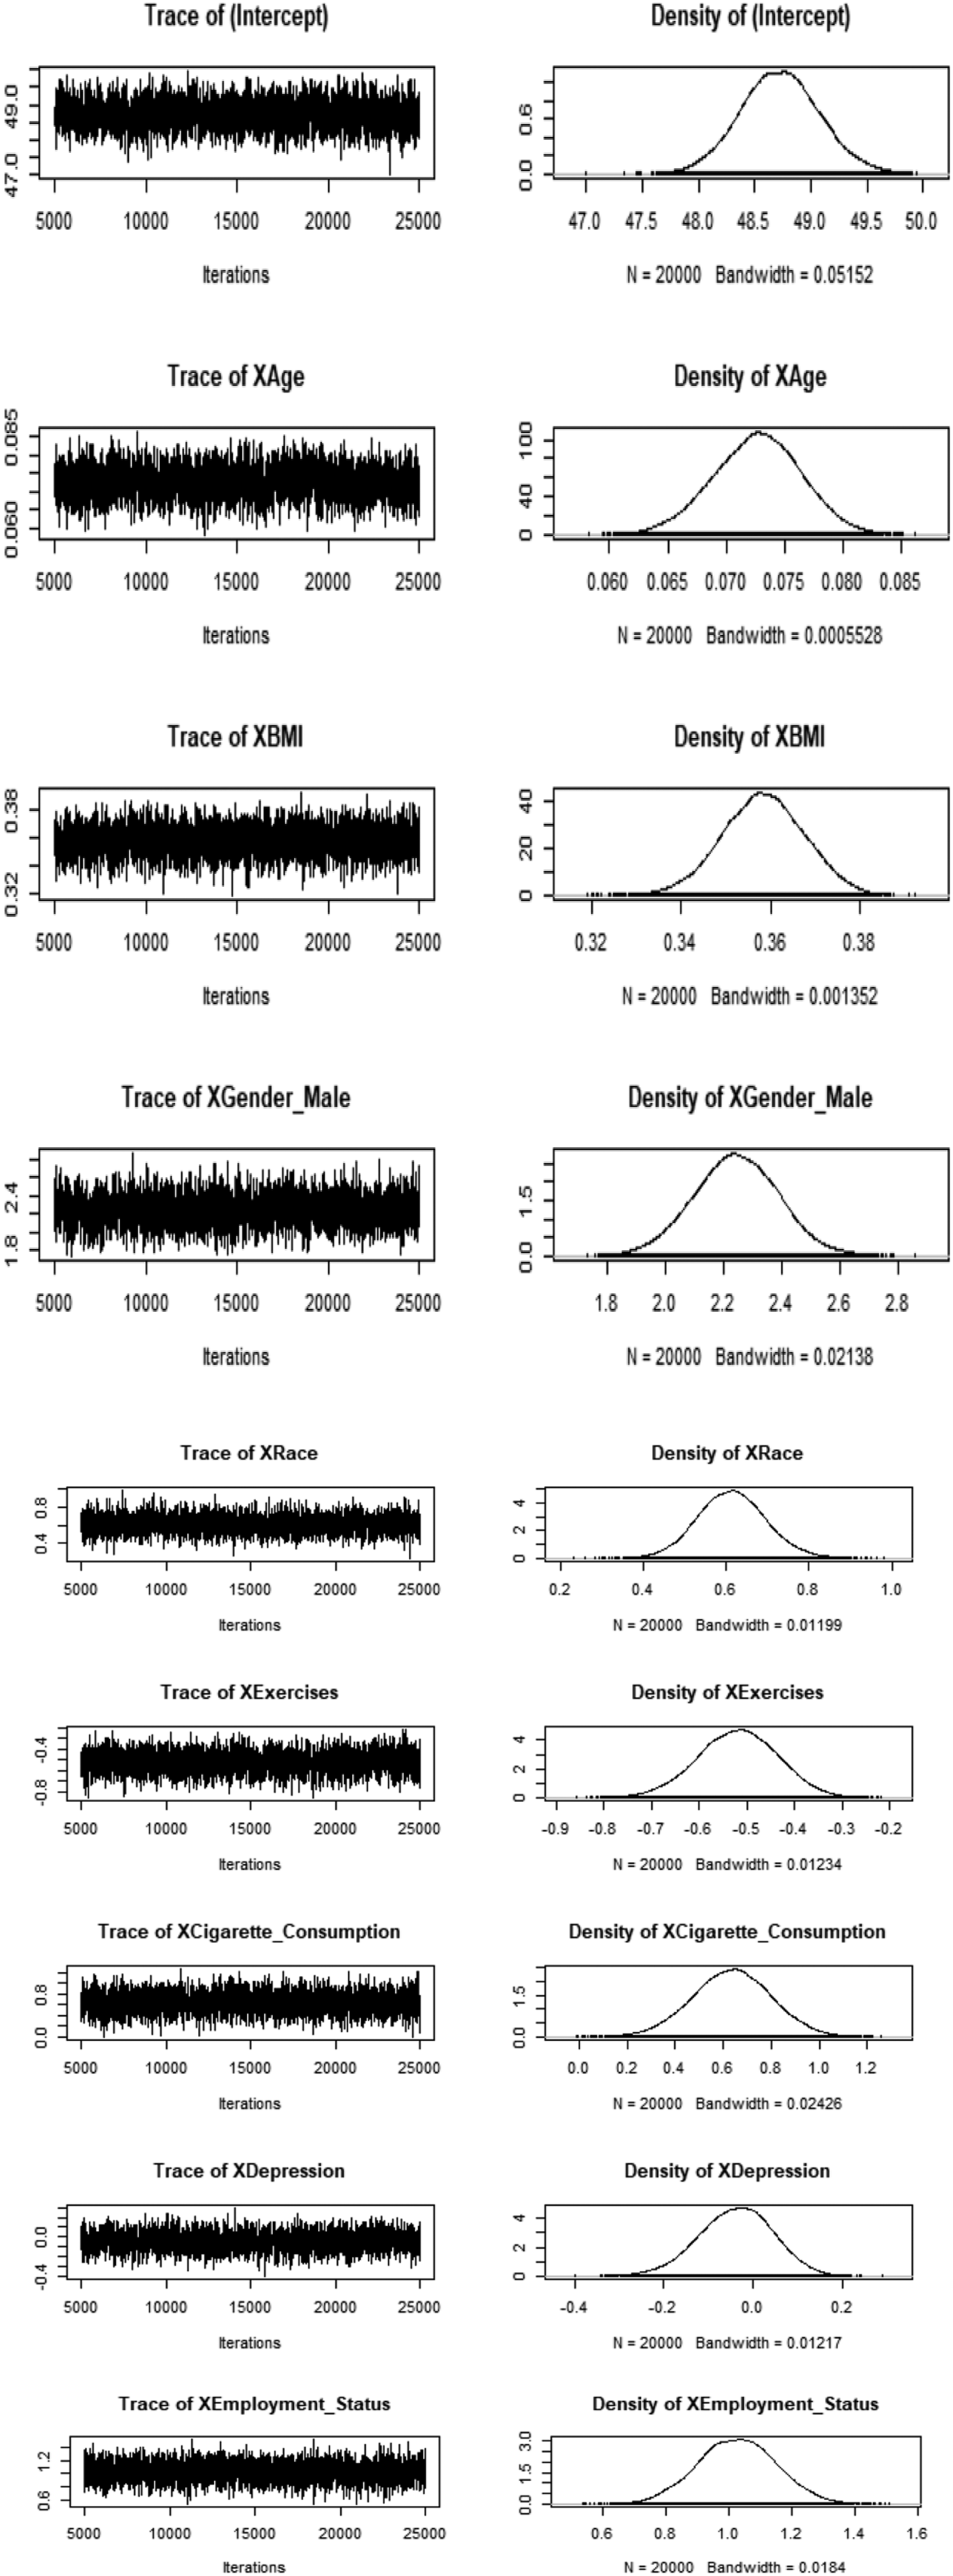
Model Comparisons
Based on the classical quantile regression 95% confidence intervals and Bayesian quantile regression 95% credible intervals presented in Tables 2 and 3, it can be seen that the width of the 95% credible intervals is narrower than the width of the 95% confidence intervals. This finding suggests that the Bayesian approach to quantile regression reveals more precise estimates than the frequentist approach.
Discussion
In this article, Bayesian approach to quantile regression has been implemented by use of MCMC algorithms contained in the R package called MCMCpack. Formal and informal diagnostic tests of convergence have revealed that the Markov chain has reached the stationary distribution. Since good convergence has been achieved, it implies that the calculated posterior summary measures are accurate and reliable. Therefore, the results can be safely used for inference.
Descriptive statistics revealed that hypertension was more prevalent in men than women for both BP measures. Both the Bayesian and classical quantile regression results corroborated these results, when gender was found to be positively significant with both BP measures, suggesting that males are more likely to suffer from hypertension than women. These results are consistent with those of the Tehran Lipid and Glucose Study (TLGS) conducted in Iran. 6
It was established in Table 1 that the prevalence of uncontrolled hypertension increases with age, a finding consistent with quantile regression results. It was found that that age had positive statistically significant coefficients with both SBP and DBP, respectively. The age effect on both SBP and DBP is bigger on the 95th quantile than the 75th quantile, implying that the effect of age on SBP is stronger at the most extreme quantile of both BP measures. These results are in line with past studies that suggest that the prevalence of arterial stiffening and hypertension increases with age,7,9,28,29 even though all these studies have utilised multiple logistic regression models in deriving their findings.
Highest proportions of raised blood pressure were evident in very and morbidly obese participants, an outcome confirmed by the quantile regression results that BMI had significant relations across the upper quantiles for both blood pressure measures. A study conducted among hypertensive patients on treatment in Lupane District, Zimbabwe, supported the current findings of this study. 9,30
Cigarette consumption displayed positive statistically significant associations with both DBP and SBP across the higher quantiles. The highest proportions of elevated blood pressure recorded on respondents who do smoke supported this finding. These results were in agreement with earlier studies, which state that nicotine in cigarette smoke is a big part of the problem because it raises the blood pressure, and heart rate, narrows arteries and hardens their walls. 4
The Bayesian and classical quantile regression results detected that exercises was negatively significant with both BP measures, implying that individuals who do not exercise (reference group) are vulnerable to high blood pressure. This result was corroborated by the high prevalence of high blood pressure among participants who do not engage in physical exercises (Table 1). A study conducted among South African adult residents of Mkhondo municipality showed that non-adherence to physical activity was related with high blood pressure.7,8
Based on the classical quantile regression 95% confidence intervals and Bayesian quantile regression 95% credible intervals presented in Tables 2 and 3, it can be seen that the width of the 95% credible intervals is narrower than the width of the 95% confidence intervals. This finding suggests that the Bayesian approach to quantile regression reveals more precise estimates than the frequentist approach. These findings are consistent with a comparative study on the Bayesian and frequentist methods for prevalence estimation under misclassification which suggested that Bayesian prevalence estimation should be preferred over traditional frequentist methods. 31
Conclusion
This study was aimed at conducting a comparative analysis of the classical and the Bayesian approaches to quantile regression in order to study the effect of blood pressure risk factors on the upper quantiles of blood pressure`s distribution. The study results suggest that the Bayesian approach to quantile regression reveals more precise estimates than the frequentist approach due to narrower width of the 95% credible intervals than the width of the 95% confidence intervals. Age, BMI, gender male, cigarette consumption and exercises presented statistically significant associations with both SBP and DBP across all the upper quantiles
Areas of Further Research
Panel quantile regression (Panel QR) could be another statistical technique which could be useful in the analysis of risk factors in hypertension. Panel QR has the capability to identify heterogeneous covariates effects and describe differences in longitudinal changes at different quantiles of the outcome, and provides more robust estimates when heavy tails and outliers exist. 32
Limitation of the Study
Power calculation was not done for estimation of the sample size because the researchers used secondary data which was then cleaned to yield the study sample size.
Footnotes
Acknowledgements
The authors are quite grateful to the research team of the South African National Income Dynamics Study 2017–2018 (NIDS) for their permission to use their data.
Declaration of Conflicting Interests
The author(s) declared no potential conflicts of interest with respect to the research, authorship, and/or publication of this article.
Funding
The author(s) received no financial support for the research, authorship, and/or publication of this article.
Ethical Consideration
The South African National Income Dynamics Survey was conducted after the University of Cape Town, Faculty of Commerce Ethics Committee, granted ethical approval. Informed consent was obtained from each study participant.
Availability of Data and Materials
The dataset analysed during the current study are available from the corresponding author on reasonable request.