
Abstract
Evidence regarding the effects of environmental factors on COVID-19 transmission is mixed. We aimed to explore the associations of air pollutants and meteorological factors with COVID-19 confirmed cases during the outbreak period throughout China. The number of COVID-19 confirmed cases, air pollutant concentrations, and meteorological factors in China from January 25 to February 29, 2020, (36 days) were extracted from authoritative electronic databases. The associations were estimated for a single-day lag as well as moving averages lag using generalized additive mixed models. Region-specific analyses and meta-analysis were conducted in 5 selected regions from the north to south of China with diverse air pollution levels and weather conditions and sufficient sample size. Nonlinear concentration–response analyses were performed. An increase of each interquartile range in PM2.5, PM10, SO2, NO2, O3, and CO at lag4 corresponded to 1.40 (1.37–1.43), 1.35 (1.32–1.37), 1.01 (1.00–1.02), 1.08 (1.07–1.10), 1.28 (1.27–1.29), and 1.26 (1.24–1.28) ORs of daily new cases, respectively. For 1°C, 1%, and 1 m/s increase in temperature, relative humidity, and wind velocity, the ORs were 0.97 (0.97–0.98), 0.96 (0.96–0.97), and 0.94 (0.92–0.95), respectively. The estimates of PM2.5, PM10, NO2, and all meteorological factors remained significantly after meta-analysis for the five selected regions. The concentration–response relationships showed that higher concentrations of air pollutants and lower meteorological factors were associated with daily new cases increasing. Higher air pollutant concentrations and lower temperature, relative humidity and wind velocity may favor COVID-19 transmission. Controlling ambient air pollution, especially for PM2.5, PM10, NO2, may be an important component of reducing risk of COVID-19 infection. In addition, as winter months are arriving in China, the meteorological factors may play a negative role in prevention. Therefore, it is significant to implement the public health control measures persistently in case another possible pandemic.
Abbreviations: CO, carbon monoxide; IQR, interquartile range; NO2, nitrogen dioxide; O3, ozone; OR, odds ratio; PM, particulate matter; PM10, PM with an aerodynamic diameter <10 μm; PM2.5, PM with an aerodynamic diameter <2.5 μm; SO2, sulfur dioxide.
Three-Question Summary Box
• Evidence regarding the effects of environmental factors on COVID-19 transmission is mixed. • Higher air pollutant concentrations and weather with relative lower temperature, relative humidity, and wind velocity may favor COVID-19 transmission. • Controlling ambient air pollution is an important component of reducing risk of COVID-19 infection, and as winter months are arriving in China, the meteorological factors may play a negative role in prevention, so it is significant to implement the public health control measures persistently in case another possible pandemic.
Introduction
Since December 2019, coronavirus disease (COVID-19) caused by SARS-CoV2 has spread rapidly across the globe.1-3 Although various control policies have been implemented, such as suspension of school and work, vaccination and quarantine,4-6 the global pandemic continues. Therefore, it is critical to identify key modifiable risk factors that affect the transmission of COVID-19.7,8 Environmental factors may influence the trends of infectious disease outbreaks by changing the host susceptibility and the survival time of viruses in vitro. 9
Ambient air pollution exposures have been widely identified to be associated with increasing risk of respiratory diseases, such as asthma, influenza and severe acute respiratory syndrome (SARS).10-12 Emerging evidence shows potential links between air pollution and COVID-19 morbidity and mortality.13-17 Zhang et al. found that air quality index (AQI) was positively correlated with new confirmed cases across 219 Chinese cities, but without the effect of each air pollutant. 15 Zhu et al. reported that the number of COVID-19 confirmed cases from 120 Chinese cities was positively associated with PM2.5, PM10, NO2, and O3, but negatively associated with SO2. 14 However, this study only covered 70% of confirmed cases during the outbreak period in China. A cross-sectional study based on 3076 US counties indicated that long-term exposure to NO2, which largely came from combustion source such as traffic, enhanced susceptibility to severe COVID-19 outcomes, but was independent to PM2.5 and O3. 16 Another study from Bangladesh confirmed that a sudden reduction of air pollution appeared after the implementation of lockdown policy, but random forest model revealed that O3, not PM2.5 or NO2, contributed to the COVID-19 infection rate. 17 More national epidemiological studies are needed to verify the effects of each air pollutant in order to provide targeted control strategies.
Meteorological factors can impact the survival time of pathogens and change the host susceptibility, which further influence the trends of infectious disease outbreaks. 9 Temperature and humidity affect influenza virus transmission and survival.18-20 Lowen et al. proposed that cold temperature and low relative humidity are favorable to the spread of influenza virus. 21 Limited studies have shown that temperature was negatively associated with COVID-19 transmission.22-25 Islam et al. reported that humidity and rainfall, but without temperature, were crucial factors affecting the COVID-19 case. 26 Furthermore, Yao et al. and Luo et al. found that there was no association of COVID-19 transmission with temperature and humidity.27,28 Therefore, the effects of temperature and humidity on this novel pathogen are still mixed. In addition, wind velocity is another key factor affecting the pathogens of respiratory-borne diseases. A study on SARS data has suggested a negative correlation between daily average wind velocity and attack rates. 29 However, evidence regarding the associations of wind velocity with COVID-19 infection remains sparse. Moreover, the associations of meteorological factor combinations on COVID-19 infection, which could capture the susceptible weather characteristics, were also not considered in previous studies.
To address the above study knowledge gaps, we conducted a time series study to verify the associations of ambient air pollutants and meteorological factors with COVID-19 confirmed cases across 31 Chinese provinces during the outbreak period (from January 25 to February 29, 2020) and capture the susceptible weather characteristics by three-dimensional concentration–response relationships.
Methods
Data Collection
Study population data
The study population was the daily confirmed new cases of COVID-19 in 31 Chinese provinces (except for Macao, Hong Kong, and Taiwan due to unavailable data) from January 25 to February 29, 2020. The number of cumulative confirmed cases was collected from reports released on the official websites of the National Health Commission (http://www.nhc.gov.cn/xcs/xxgzbd/gzbd_index.shtml). Daily confirmed new cases were calculated as the difference between the number of cumulative confirmed cases in two adjacent days and was used in the present study.
The confirmed cases were reported from district level, city level, and provincial level health commission to National Health Commission and were implemented quality control level by level strictly. Therefore, we extract data directly without extra quality control measures. In addition, there was no requirement for ethical review because this data was public data and was derived from official websites.
Ambient air pollution data
The concentrations of ambient air pollutants were obtained from the China National Environmental Monitoring Centre (http://www.cnemc.cn/sssj/). Continuous hourly concentrations were gathered from January 25 to February 29, 2020. The daily average concentrations of PM2.5, PM10, SO2, NO2, and CO at each station were used only if >20 of the 24-hourly measurements were available. For O3, at least 6 hourly concentrations of O3 per day were needed to calculate the 8-hour average concentration of O3. The air pollutant concentrations were valid according to the China Ambient Air Quality Standards (GB 3095-2012). Finally, daily pollutant concentrations of the province were averaged from all valid stations within it.
Meteorological data
Daily mean ambient temperature, relative humidity, and wind velocity from January 25 to February 29, 2020 (without missing data) were obtained from the National Meteorological Information Center (http://data.cma.cn/).
Statistical Analysis
We characterized the distributions of all the covariates according to the mean and standard deviation or the median and interquartile range (IQR). The correlations between the concentrations of ambient air pollutants and meteorological factors during the study period were analyzed using Spearman rank correlation coefficients.
Generalized additive models (GAMs) are commonly used in time series studies, which could capture the associations by spline function.14,30,31 Considering the “clustering” of COVID-19 confirmed cases due to the virus transmission characteristics “in day level” and the different population size and density “in province level,” two-level generalized additive mixed models (GAMMs) were used to estimate the associations between air pollutants and daily COVID-19 confirmed new cases, in which days and provinces were treated as the first- and second-level units, respectively. Because the number of confirmed new cases approximately followed a Poisson distribution, a log-link function was used in GAMMs. The following potential confounders were included in the models: daily mean temperature, relative humidity, wind velocity, and categorical variables for day of the week and public holidays. In addition, we included day to control for unobserved factors affecting all provinces in each day such as national lockdown and travel ban. We used three degrees of freedom for the spline function of meteorological factors, which reportedly allowed adequate control for their effects on health outcomes. 32 The partial autocorrection function (PACF) of the residuals was used to determine the number of degrees of freedom for the spline function of time trend. Finally, we selected seven degrees of freedom in the spline function of time for all pollutants. The statistical analyses for the associations of meteorological factors were similar to those for air pollutants. To facilitate comparisons, the associations of air pollutants and meteorological factors with daily confirmed new cases were reported as odds ratios (ORs) with 95% confidence intervals (95% CIs) for an IQR increase in daily average concentrations of air pollutants as well as 1°C, 1%, and 1 m/s increase in daily mean temperature, relative humidity, and wind velocity, respectively.
Considering the heterogeneity of 31 Chinese provinces, we conducted subgroup analyses to explore region-specific associations. From the north to south of China, five regions (i.e., Heilongjiang, Beijing, Hubei, Guangdong, and Hainan) with sufficient sample size of COVID-19 confirmed cases were investigated due to their diversity of air pollution levels and climate conditions. The total effects of air pollutants and meteorological factors in these five regions were then calculated through meta-analysis by fixed models or random effect models.
The nonlinear concentration–response relationships were examined because linearity assumption of air pollutants and meteorological factors with COVID-19 confirmed cases may not hold. Instead of linear parameters, we included a penalized cubic regression spline of air pollutants or meteorological factors with three degrees of freedom into the GAMMs. To determine the susceptible weather characteristics, we further investigated the three-dimensional concentration–response relationships of temperature, relative humidity, and wind velocity by including an interaction term with two of them into the models.
To assess the robustness of the associations of air pollutants and meteorological factors with COVID-19 confirmed cases, we conducted sensitivity analyses (1) excluding the confirmed cases on 13 February due to the outlying peak; (2) using four degrees of freedom in meteorological factors; (3) varying the level of smoothness of the time trend function (with four to eight degrees of freedom); and (4) using conditional Poisson models 33 instead of GAMMs to test the stability of the results since the study period was short in our study.
All of the statistical analyses were performed using the “mgcv” package in R statistical software (version 3.5.3). A P-value <0.05 was considered as statistically significant for a two-tailed test.
Results
Descriptive Statistics
We examined 77,578 COVID-19 confirmed new cases (approximately 2155 cases per day) in 31 Chinese provinces from January 25 to February 29, 2020
Associations of Air Pollutants and Meteorological Factors With COVID-19
The associations of air pollutants and meteorological factors with COVID-19 confirmed new cases using different lag structures are presented in Figure 1. Regarding the shortest case confirmation period of COVID-19 (three days for incubation and one day for laboratory diagnosis and case reporting delay), we focused on the associations at the previous four days lag structure (lag4). The number of COVID-19 confirmed new cases was significant positively associated with all pollutants at lag4, corresponding to 1.40 (1.37–1.43), 1.35 (1.32–1.37), 1.01 (1.00–1.02), 1.08 (1.07–1.10), 1.28 (1.27–1.29) and 1.26 (1.24–1.28) ORs per an IQR increase in the concentrations of PM2.5, PM10, SO2, NO2, O3, and CO, respectively. The estimates per 1°C, 1%, and 1 m/s increase in temperature, relative humidity and wind velocity at lag4 were 0.97 (0.97–0.98), 0.96 (0.96–0.97), and 0.94 (0.92–0.95), respectively. Odds ratios with 95% confidence intervals per an unite increase in the concentrations of air pollutants and meteorological factors using different lag structures for COVID-19 confirmed new cases in 31 Chinese provinces. Note. Orange circles: a single-day lag from the current day up to the previous six days (lag0–lag6). Blue triangles: moving averages of the current and previous days (lag01–lag06).
Region-specific Associations and Meta-analysis
Meta-analysis of the associations between air pollutant concentrations and COVID-19 confirmed new cases at lag4 among the five selected regions are presented in Figure 2. The number of confirmed new cases was significant positively associated with PM2.5, PM10, NO2, O3, and CO in both Heilongjiang and Hubei. Positive significant association of SO2 was only observed for Hubei. However, negative significant associations were observed for SO2 in both Beijing and Hainan as well as O3 in Beijing. The estimates of PM2.5 (1.13, 95% CI: 1.10–1.15), PM10 (1.20, 95% CI: 1.17–1.23) and NO2 (1.12, 95% CI: 1.11–1.13) remained significantly positive after meta-analysis for the five regions. In contrast, the estimates of SO2, O3, and CO lost statistical significance after meta-analysis. Meta-analysis of the associations between air pollutant concentrations and COVID-19 confirmed new cases at the previous four days lag structure (lag4) in the five selected regions.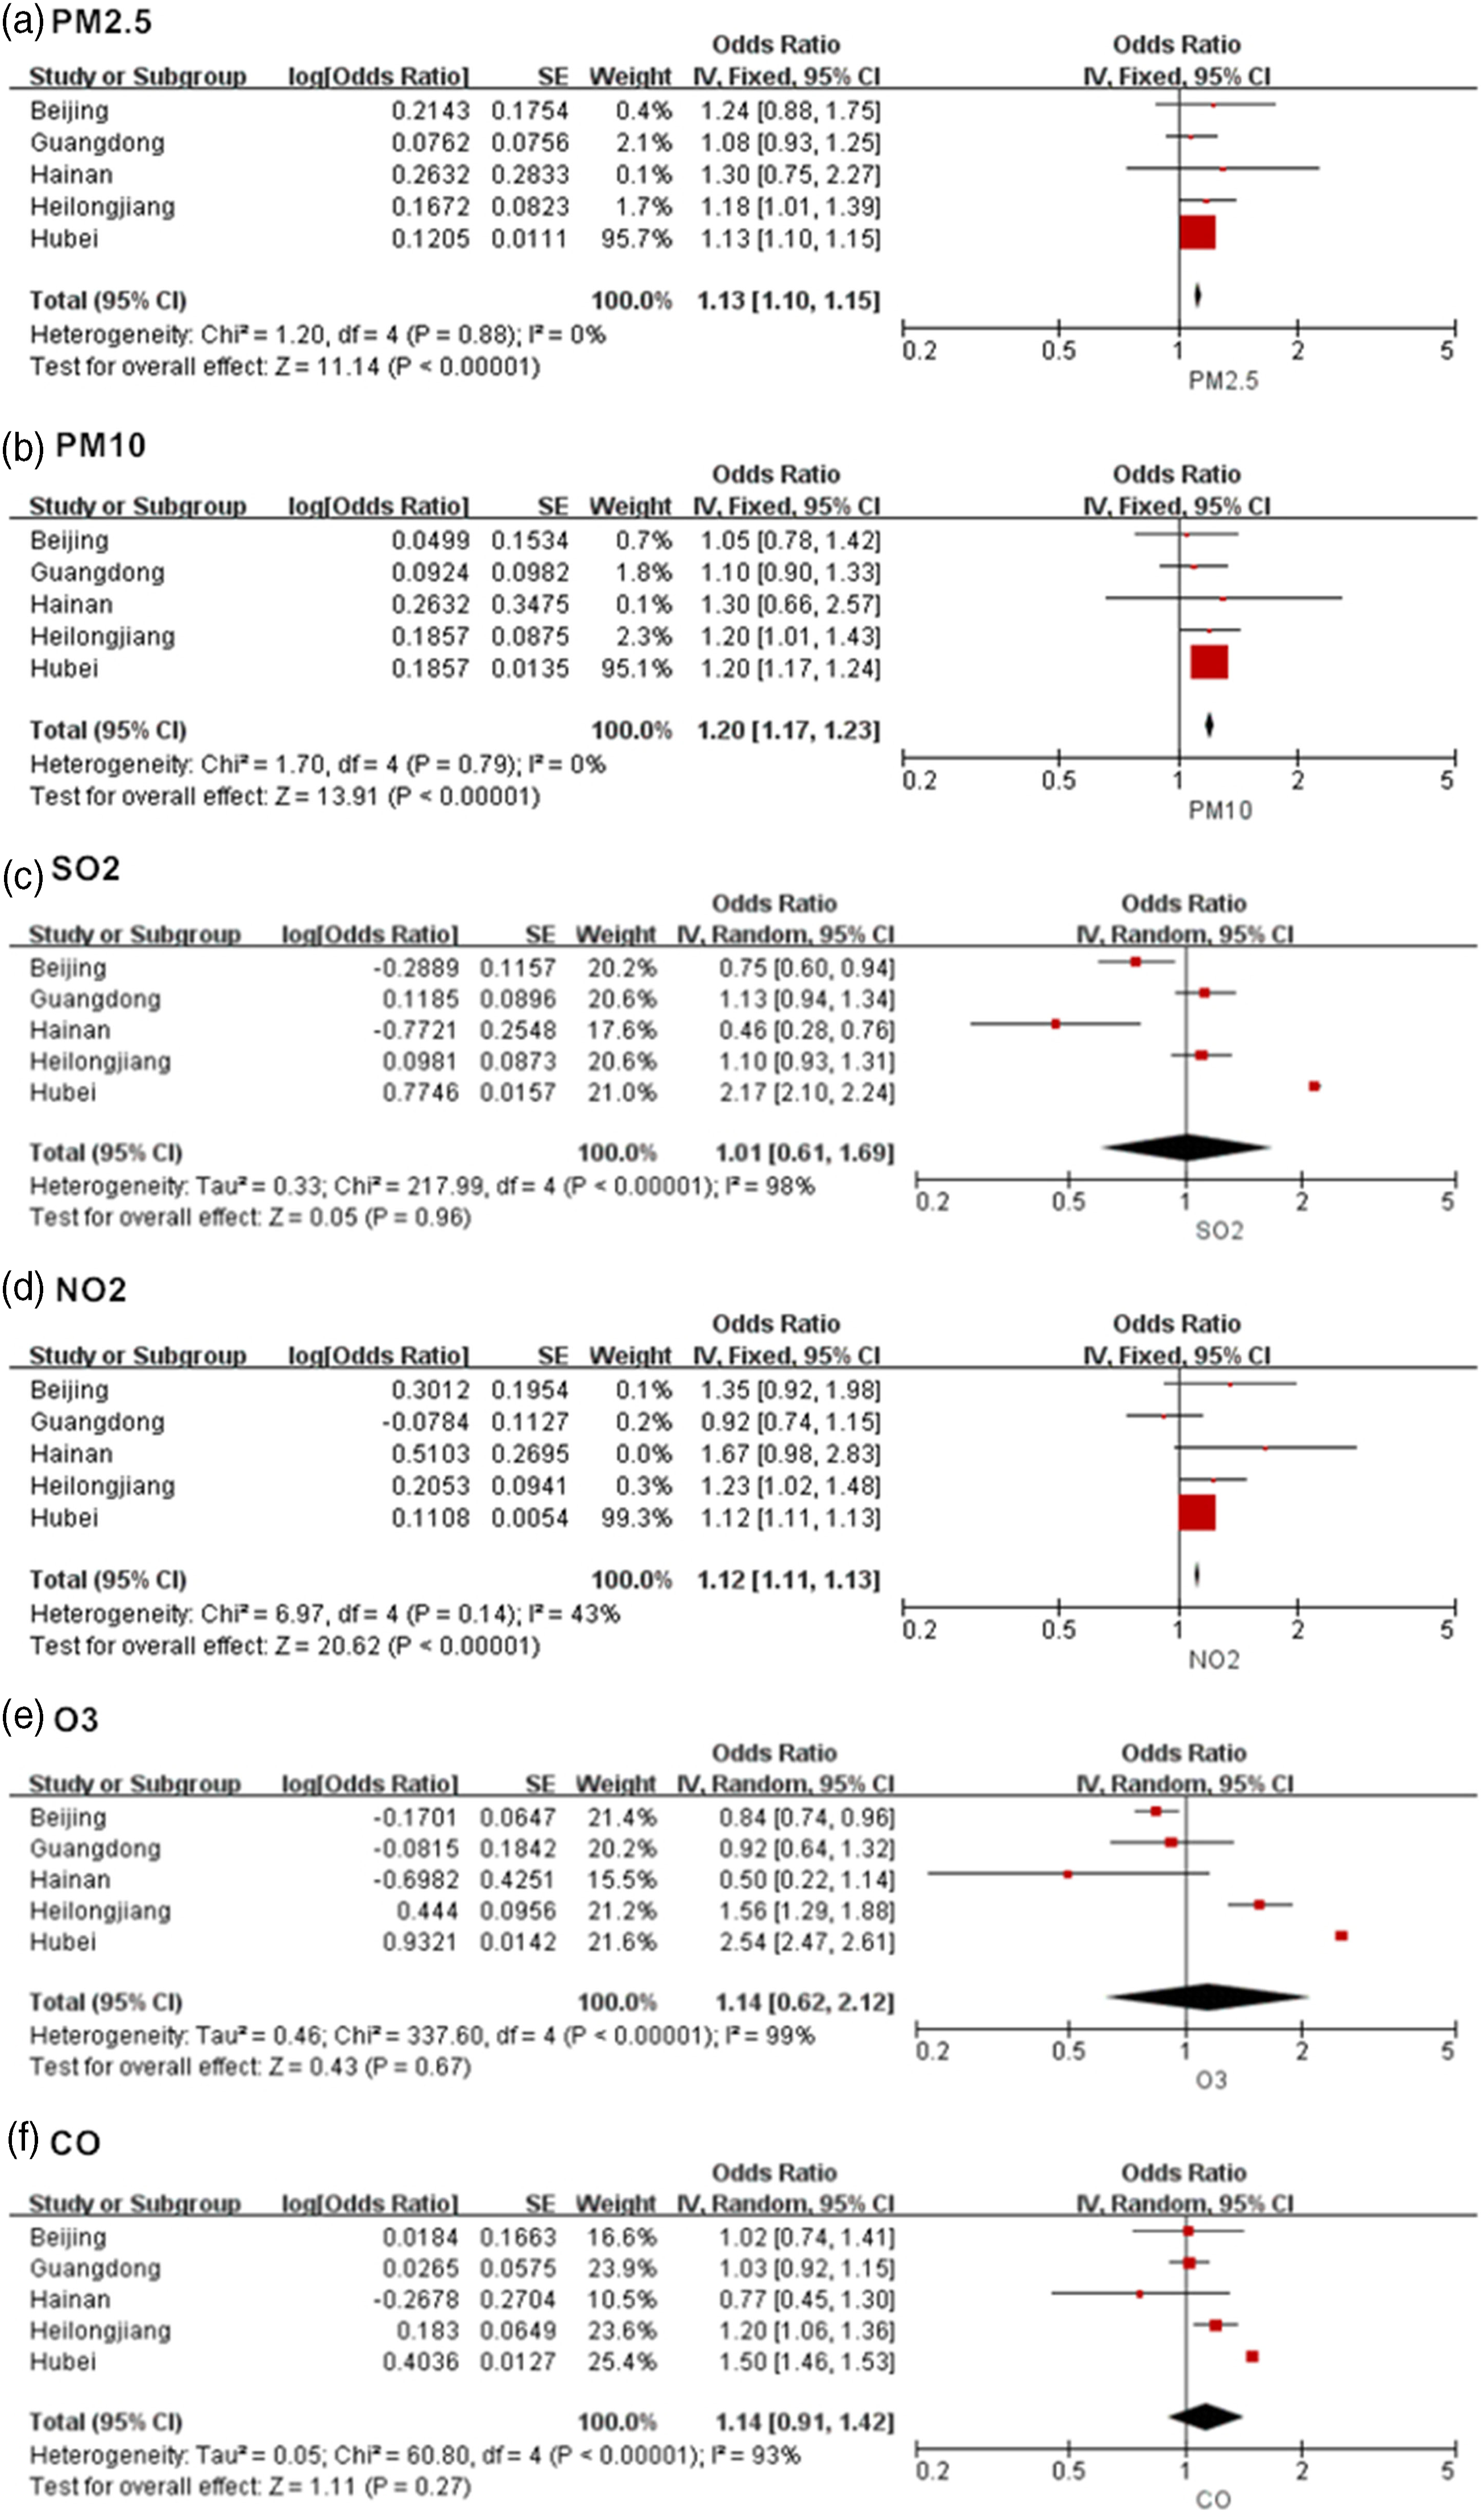
Meta-analysis results of the ORs of COVID-19 confirmed new cases with meteorological factors at lag4 among the five regions are shown in Figure 3. The number of confirmed new cases was significant negatively associated with temperature and relative humidity among Guangdong, Heilongjiang, and Hubei. Negative associations were observed for wind velocity in Beijing, Guangdong, Heilongjiang, and Hubei. However, the estimate of wind velocity with statistical significance was only examined in Hubei. After meta-analysis of the five regions, the estimates of temperature (0.95, 95% CI: 0.90–1.00), relative humidity (0.99, 95% CI: 0.98–1.00), and wind velocity (0.90, 95% CI: 0.82–0.98) remained significantly negative. Meta-analysis of the associations between meteorological factors and COVID-19 confirmed new cases at the previous four days lag structure (lag4) in the five selected regions.
Concentration–Response Analyses
Concentration–response relationships for COVID-19 confirmed new cases associated with the continuous air pollutants (lag4) as spline functions are presented in Figure 4. In general, PM2.5 and PM10 were positively associated with daily confirmed new cases, and the estimates were monotonically increased with increasing concentrations. Positive associations were observed for SO2, NO2, O3, and CO with a certain concentration range, and reached a peak at 35 μg/m3, 30 μg/m3, 100 μg/m3, and 1.5 mg/m3, respectively. In addition, the associations became negative at lower or higher concentrations. Concentration–response relationships for COVID-19 confirmed new cases with the continuous air pollutant concentrations (lag4) as spline functions.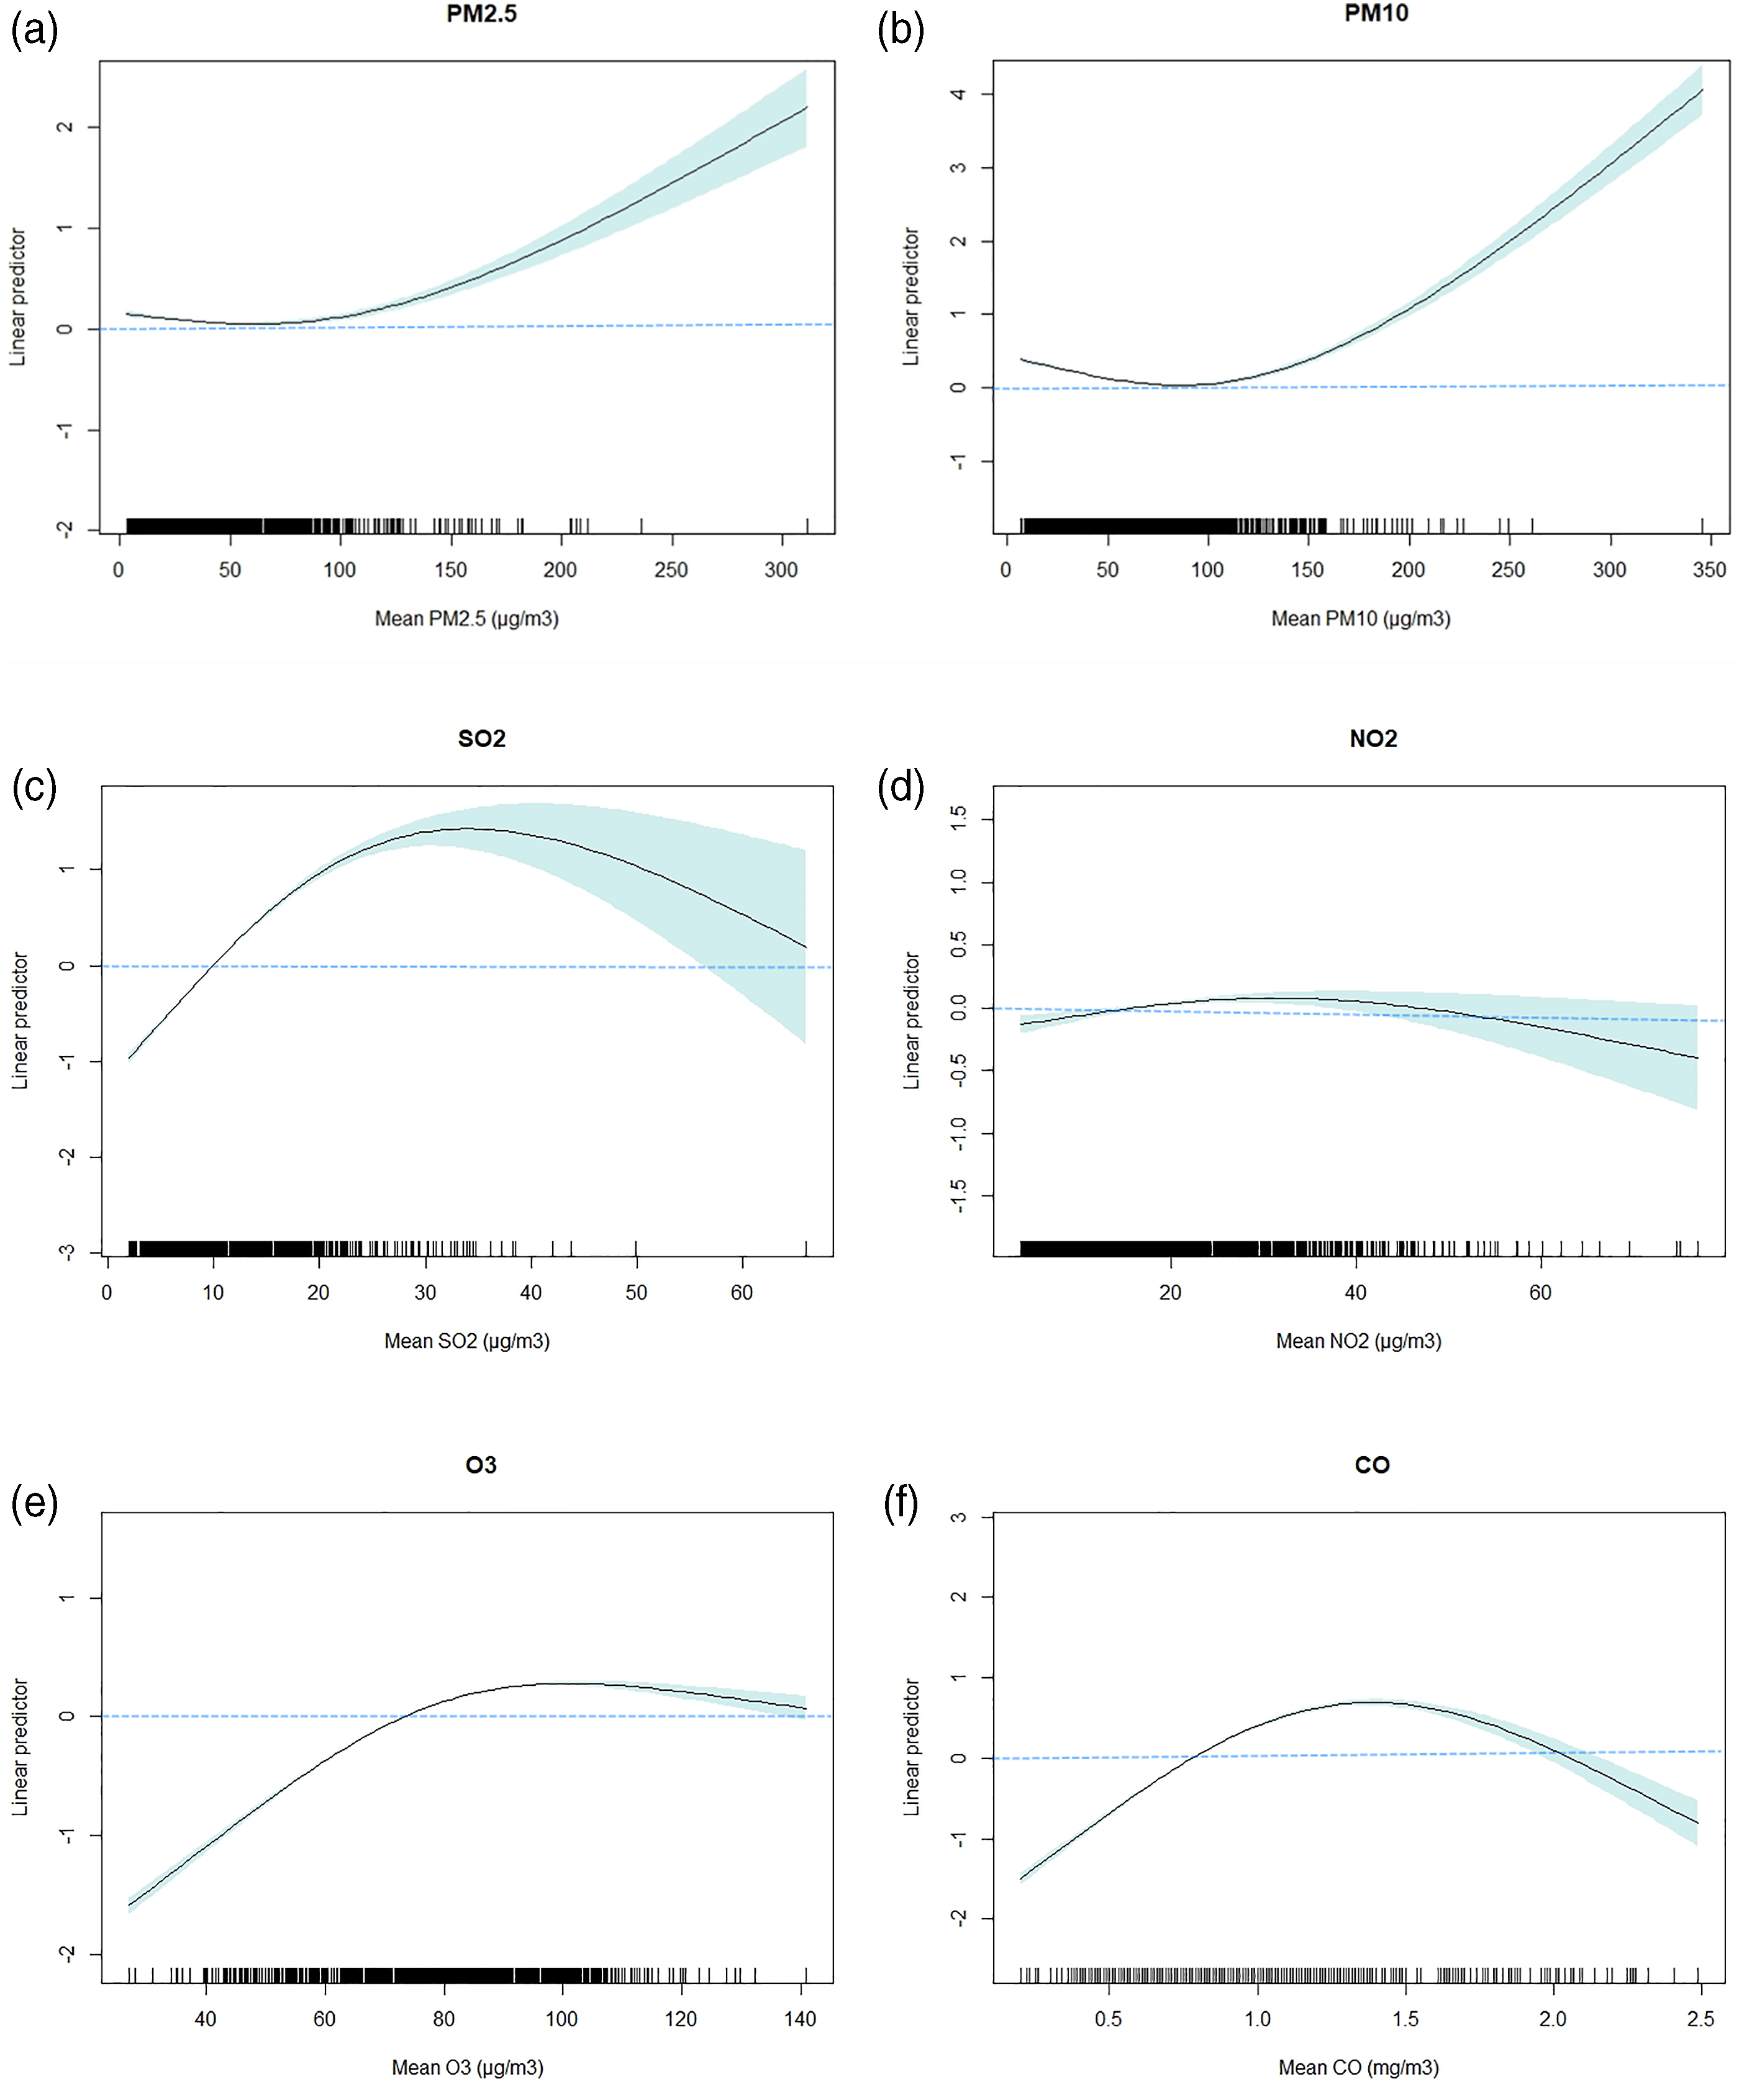
Concentration–response relationships between COVID-19 confirmed new cases and meteorological factors (lag4) are shown in Figure 5. For temperature, the positive associations were observed below −10°C and 5–20°C, whereas the negative associations were examined ranging from −10°C to 5°C and above 20°C. The positive estimates of temperature showed a peak at approximately 10°C. The associations of relative humidity became negative and attenuated above 70%. For wind velocity, negative associations were observed ranging from 2 m/s to 5 m/s, and positive associations were observed at lower or higher speeds. For the interaction terms of meteorological factors, the number of daily COVID-19 confirmed new cases was negatively associated with the following combinations: extreme high temperature and low relative humidity; high temperature and extreme wind velocity; and extreme low relative humidity and low wind velocity. Concentration–response relationships for COVID-19 confirmed new cases with the continuous meteorological factors (lag4) as spline functions. Note. A, B, and C: with the single meteorological factor. D, E, and F: with interaction terms of meteorological factors.
Sensitivity Analyses
The associations of air pollutants and meteorological factors with COVID-19 confirmed new cases were stable after excluding the peak counts on 13 February (Supplementary Figures A1 and A2). Results were generally consistent with the originals after using the four degrees of freedom in meteorological factors, except for the associations of PM2.5 at lag06 (Supplementary Figures A3 and Figure A4). We observed increased or decreased associations of air pollutants and meteorological factors after varying the level of smoothness of the time trend function (with four to eight degrees of freedom). However, the associations still remained statistically significant, except for the associations of SO2 at lag06 (Supplementary Figures A5 and A6). In addition, we used conditional Poisson models instead of GAMMs, and the results were generally stable (Supplementary Figures A7 and A8).
Discussion
There were 77,578 COVID-19 confirmed cases reported in 31 Chinese provinces from January 25 to February 29, 2020. Our results indicated that higher concentrations of air pollutants as well as weather with relative lower temperature, humidity, and wind velocity favored COVID-19 transmission.
Previous studies have found that respiratory infectious diseases are associated with ambient air pollutants.10-12 However, the evidence for ambient air pollution exposure and COVID-19 infection is mixed. Yao et al. reported significant association between NO2 exposure and basic reproduction number (R0) of COVID-19, suggesting that NO2 may contribute to the spread ability of COVID-19. 34 Zhu et al. also observed positive significant associations of PM2.5, PM10, NO2, and O3 with COVID-19 confirmed cases, whereas a negative association was observed for SO2. 14 Li et al. found that COVID-19 incidence was prominently positive correlated with PM2.5 and NO2 in Wuhan and Xiaogan. However, significant associations were not observed for PM10 and CO. 35 Our results indicated that higher concentrations of all air pollutants (i.e., PM2.5, PM10, SO2, NO2, O3, and CO) were positively associated with COVID-19 infection throughout China. Furthermore, positive significant associations of all air pollutants were also observed in Hubei, which was the province with the most serious COVID-19 infection. Regarding regional heterogeneity, the positive significant associations of PM2.5, PM10, and NO2 remained after the meta-analysis for the five selected regions. Experimental evidence has suggested that the increased transmission ability in the presence of air pollutants may not be caused by improvement of epithelial cell susceptibility to infection but may result from effects on host defenses that prevent the spread of virus.36,37 Otherwise, Rahman et al. found that a sudden reduction of PM2.5 and NO2 levels in Dhaka, Bangladesh, triggered by the lockdown policy, which could restrict traffic and crowd movement. 17 Chinese lockdown policy was first implemented in Wuhan, Hubei on 23 January, and our study period (from 25 January to 29 February) was within lockdown range. Therefore, the associations between air pollution and COVID-19 confirmed cases may also be affected by the relationship between lockdown policy and virus transmission since PM2.5, PM10, and NO2 were traffic-related air pollutants. 34 However, this hypothesis could not be verified in our study because of short study period and data deficiency. Furthermore, we conducted concentration–response analyses between air pollutants and COVID-19 infection. The estimates of PM2.5 and PM10 monotonically increased, but the estimates attenuated and became negative in higher concentrations of gaseous pollutants (i.e., SO2, NO2, O3, and CO). These results may be explained by the saturation mechanism that the underlying biochemical and cellular processes become saturated with small doses of a toxic component. 38 The inverse associations observed for air pollutants at lag2 may be attributed to the harvesting at the current lag, that the increases in infection triggered by air pollution at lag0. Additionally, it may be associated with the dynamic characteristics of COVID-19 that the infected cases were in preclinical or incubation period which had not been confirmed and reported. However, the mechanisms still require further investigation.
Meteorological factors can influence human immunity and activity patterns, 39 and they can also affect the transmission and virulence of the virus.9,21 There have been several studies investigating the effects of ambient temperature on the transmission of infectious diseases. For COVID-19, Liu et al. found that each 1°C increase in ambient temperature was related to 0.80 (0.75, 0.85) RR of daily confirmed case counts. 24 Wang et al. and Shi et al. also examined similar associations that low temperature likely favored COVID-19 transmission.22,23 Furthermore, Shi et al. found that the RRs of the daily confirmed case counts increased to a peak at approximately 8–10°C. 23 Consistent with these results, we examined negative associations between temperature and COVID-19 confirmed new cases with a corresponding OR of 0.97 (0.97–0.98). The nonlinear concentration–response relationship indicated that negative associations were observed for temperatures ranging from −10°C to 5°C and above 20°C, whereas positive associations were observed below −10°C and 5–20°C. The positive estimates of temperature reached a peak at approximately 10°C, which agreed with the previous study. However, Yao et al. found that there was no significant association of temperature with COVID-19 transmission. 27 Therefore, more epidemiological and laboratory evidence for the associations of temperature are still needed.
A previous study found that 12% of influenza virus transmission variability and 36% of influenza virus survival variability could be explained by relative humidity. 40 Our study found that the number of COVID-19 confirmed new cases was negatively associated with relative humidity with a corresponding OR of 0.96 (0.96–0.97). Furthermore, the concentration–response relationship indicated that the associations became negative and attenuated above 70%, which was the mainly range of relative humidity during the study period. In line with our results, Liu et al. found that absolute humidity was significantly associated with decreased COVID-19 confirmed case counts. 24 Possible mechanism is that lower humidity in a certain range increases the stability of coronavirus and favors its transmission. 21
High wind velocity facilitates dilution and removal of pathogens, thereby reducing the transmission potential. An ecological study found that higher daily average wind velocity corresponded to a lower secondary attack rate of SARS. 29 Consistent with the previous study, we examined the negative associations between wind velocity and COVID-19 confirmed new cases in Hubei and throughout China. The concentration–response relationship also indicated that higher wind velocity was associated with lower infection case counts when the wind velocity ranged from 2 m/s to 5 m/s. More epidemiological studies and direct laboratory evidence are still needed to verify our results.
In addition, we considered the associations of meteorological factor combinations on COVID-19 infection. The three-dimensional concentration–response relationship indicated that weather with low temperature, low humidity, and low wind velocity may favor its transmission. The survival characteristics of coronavirus support our results. An experimental study on SARS-CoV found that the virus soon lost its activity when the temperature increased to 38°C and the relative humidity reached 95%. 41 Another study on MERS-CoV, a virus also sharing genetic similarities with COVID-19, indicated that it could maintain activity for a long time both as droplets on solid surface and as aerosol in low temperature (20°C) and low humidity (40%) conditions. 42 Our results were also accordance with the weather condition of COVID-19 outbreak in China and countries with similar latitude (e.g., U.S., Italy, Japan, and Korea), which was in winter and early spring with relative low temperature and low humidity. 43 However, COVID-19 is pandemic throughout the world, even in several tropic countries with hot and dry weather conditions (e.g., India, Mexico, and Brazil). As winter months (cold and dry) are arriving in the Northern Hemisphere again, the weather conditions may play a negative role in controlling the COVID-19 infection. Therefore, it is significant to persistently implement the public health control measures such as wearing mask, washing hands, and avoiding going outside. 44
Our study had some limitations. First, we only focused on the associations of air pollutants and meteorological factors with COVID-19 confirmed cases and not the causal effects. Second, the study period was relatively short, which represented the condition during the outbreak period in China. We used different df of time trend (df = 4–8) and two kinds of model (GAMMs and conditional Poisson models) to verify the stability of the results during the short study period. Third, age- and gender-specific associations were not conducted in our study due to a deficiency of detailed information. Fourth, the associations were investigated within China. Therefore, our findings are not globally representative.
Conclusions
Our study indicates that higher air pollutant concentrations and weather with relative lower temperature, relative humidity, and wind velocity may favor COVID-19 transmission. Controlling ambient air pollution, especially for PM2.5, PM10, NO2, may be an important component of reducing risk of COVID-19 infection. In addition, as winter months are arriving in China, the cold and dry weather condition may play a negative role in prevention. However, global studies are warranted to confirm our results since our findings may not be globally representative.
Supplemental Material
sj-pdf-1-inq-10.1177_00469580211060259 – Supplemental Material for Associations of Ambient Air Pollutants and Meteorological Factors With COVID-19 Transmission in 31 Chinese Provinces: A Time Series Study
Supplemental Material, sj-pdf-1-inq-10.1177_00469580211060259 for Associations of Ambient Air Pollutants and Meteorological Factors With COVID-19 Transmission in 31 Chinese Provinces: A Time Series Study by Han Cao, Bingxiao Li, Tianlun Gu, Xiaohui Liu, Kai Meng and Ling Zhang in INQUIRY: The Journal of Health Care Organization, Provision, and Financing
Footnotes
Acknowledgments
We thank the National Health Commission for providing COVID-19 confirmed case data, the China National Environmental Monitoring Centre for providing air pollutant data, and the National Meteorological Information Center for providing meteorological data.
Authors’ Contributions
Han Cao: Methodology, data curation, formal analysis, visualization, writing-original draft.
Bingxiao Li, Tianlun Gu, Xiaohui Liu: Investigation, data curation.
Kai Meng: Validation, writing-reviewing and editing.
Ling Zhang: Conceptualization, investigation, supervision, writing-reviewing and editing.
Declaration of Conflicting Interests
The author(s) declared no potential conflicts of interest with respect to the research, authorship, and/or publication of this article.
Funding
The author(s) disclosed receipt of the following financial support for the research, authorship, and/or publication of this article: This work was supported by The National Key Research and Development Program of China grant number 2016YFC0900600/2016YFC0900603.
Supplementary Data
Supplementary data for this article can be found as an attached file.
References
Supplementary Material
Please find the following supplemental material available below.
For Open Access articles published under a Creative Commons License, all supplemental material carries the same license as the article it is associated with.
For non-Open Access articles published, all supplemental material carries a non-exclusive license, and permission requests for re-use of supplemental material or any part of supplemental material shall be sent directly to the copyright owner as specified in the copyright notice associated with the article.