
Abstract
Keywords
Highlights questions
1. What do we already know about this topic? A.: There is a lot of research on digital dependence, but in
organizational environment is a new and promising field. 2. How does your research contribute to the field? A.: Bringing the perspective to digital collective dependence for the
discussion about impacts on human behaviors 3. What are your research’s implications toward theory, practice, or
policy? A. It can contribute to understanding the impacts on collective
environments of digital use and create improvements for management.
Introduction
Digital dependency is the complete lack of autonomy or independence to perform tasks without using digital devices such as the Internet, cell phones, tablets, social networks, and the like. 1 The lack of these resources, even temporarily, can generate anxiety, fear, and insecurity, preventing the individual from carrying out their activities. 2
Digital dependence occurs when being without a cell phone, offline or away from the computer reaches the point of disrupting daily life, and symptoms of nomophobia appear, such as anxiety, discomfort, and panic, among others. 3
Nomophobia is characterized by feelings of anguish, discomfort, or anxiety caused by the non-availability of any means of virtual communication, including not only the cell phone, but also a personal computer, tablets, among others. 3
In the mid-1990s, a first study on internet addiction in humans emerged. 4 From then on, this topic started to gain prominence and, with the evolution of technologies, new digital resources started to interfere in the daily lives of individuals, transforming human behavior. This transformation includes overuse,5,6 which can cause harmful health effects, requiring care to minimize physical, psychological, and behavioral damage.7,8
In addition to the dependence on the Internet as originally studied, the dependence on social networks and communication applications has also started to be researched, 9 as behavioral and psychological changes are usually related to excessive and uncontrolled use, creating severe impacts on users' lives. 10
The Digital Era has extrapolated individual dependence and is today characterized as a social phenomenon given its collective dimension influencing organizational environments, until then not covered. Overuse, indiscriminate, and for many consecutive hours by employees at work may be impairing individual performance and organizational results. 1
This work aimed to identify the level (None/Light/Moderate/Severe) of digital dependency in the collective environment of organizations and to investigate the association of this type of dependency with demographic characteristics.
Method
Data collection was carried out online from 11.05.19 to 03.05.20, using the validated
EDDE scale (Annex 1)
inserted in the Google Forms application, for access by volunteers. The sample
totaled 307 volunteers, of which 13 were invalidated due to filling error, leaving a
final sample of 294 valid questionnaires. The volunteers were not identified as a
guarantee of anonymity according to the code of ethics in research (Figure 1). Gráfico Screeplot para determinação do número de
fatores.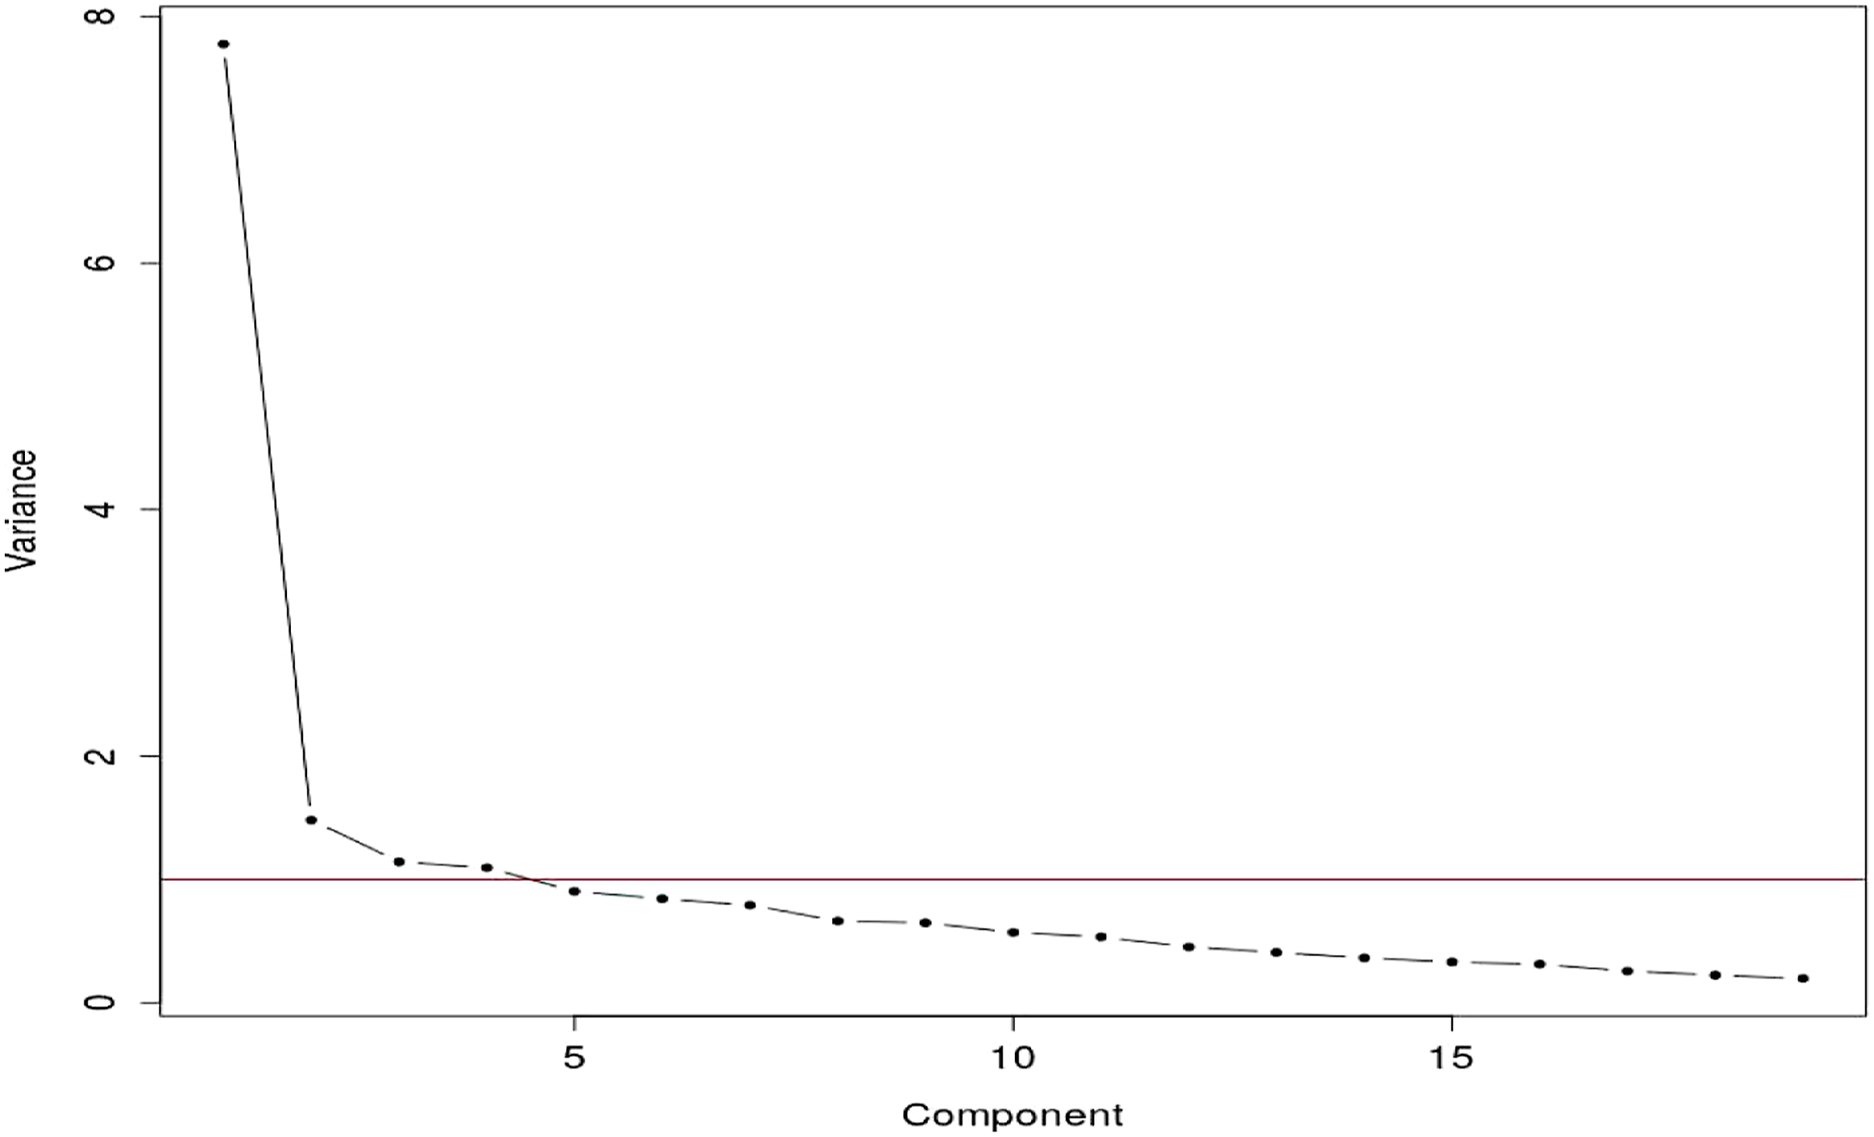
The Digital Dependence Scale for Employees (EDDE), already statistically validated, was used, with 19 questions with answer options: Never/Rarely (0), Frequently (1), and Always (2) to assess the dependence of digital technologies on employees, in an environment organizational.
After collecting the data, a database was created to carry out the statistical analysis, as well as to know the profile of the sample from the demographic data. Despite being a questionnaire already validated and in use, Factor Analysis was performed, composed of descriptive statistics, factor loads, and internal consistency, using the computer program REdaS. 11
Inclusion Criteria
Volunteers of any profession employed in Brazil, regardless of the type of employment, position, function, or geographic location.
Exclusion Criteria
Volunteers who are outside the defined age group and who are not linked to any established organization.
Results
Data
There were errors in filling out the questionnaires by the volunteers in a total of 13, which were removed from the sample to carry out the study, reducing the data set to 294 valid questionnaires, which is consistent with the research objective.
As for each question in a questionnaire it is necessary to obtain 8 valid answers per question, having 19 questions, it would total the minimum need of 8 valid answers x 19 questions, 152 volunteers 12 .
The 294 questionnaires answered (valid) almost exceed this requirement by one hundred percent.
Descriptive Statistics
All descriptive statistics in this section were found using the dplyr statistical software package. 13
For each range the absolute number of elements (n) with their percentage, within their group, are presented.
Age Range by sex.
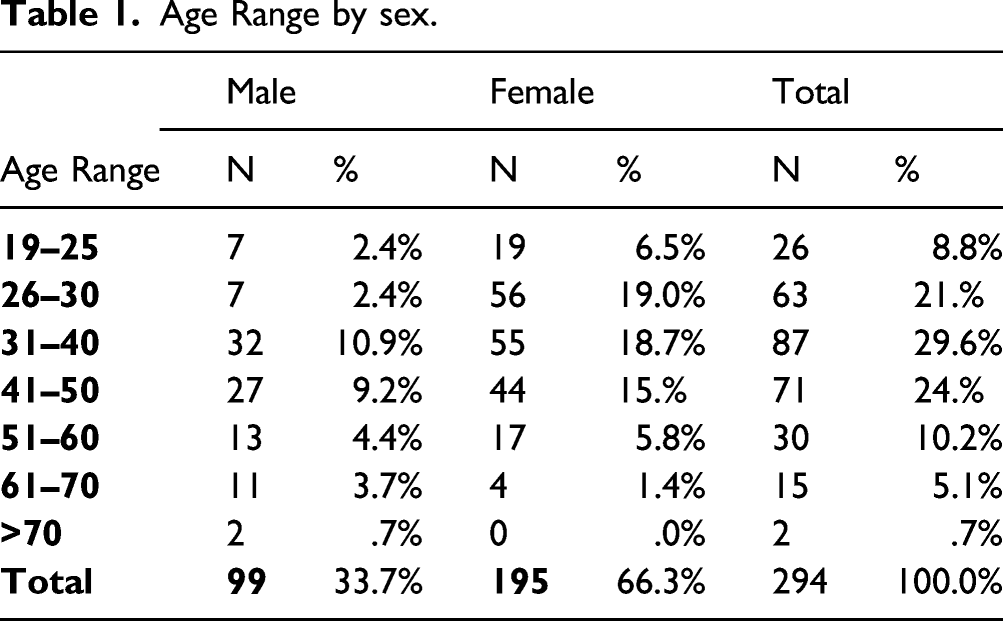
The significant difference in the number of participants by sex in research in the USA, with 589 volunteers, corroborates patterns of use according to gender, where there is an increase in the level of use among women, when compared to men. Women tend to use more social media, messaging, and spend more time using digital resources. “Gender” was considered statistically significant in terms of addictive habits of using smartphones. 14
In the USA, in another survey of 301 volunteers, the highest scores for digital dependence (nomophobia) were found in women. 15
A cross-sectional study with 401 volunteers revealed that there is a difference between the scores presented by men and women in nomophobic subjects with prevalence for women, characterizing that gender is a predictor of digital dependence, in particular nomophobia. 16
The age group 19–25 had the second lowest significant quantitative percentage of volunteers (8.8%), with women in this age group almost triple that of men.
Younger generations are more susceptible to dependence on the use of digital resources. 17
At the other extreme, the 61–70 range had the lowest significant number of volunteers (5.1%).
Distribution of the Final Score by sex.

There are no major discrepancies between the percentage averages between men and women, when comparing the scoring ranges. In the range 0–8 points, the percentage of those who believe they have no digital dependence is practically the same as men (43.4%) and women (41.5%). The bands 9–18 and 19–28 points for Light or Moderate dependence present the same difference between men and women with approximately 6% but with inverse dimensions between the two genders of these two bands. Women have a higher percentage (27.7%) than men (22.2%) at the Moderate level. In the range of points that indicates severe digital dependence (29 to 38 points), the significance of the result is very low (1.7%) and found only for women.
Distribution of the Final Score by Education.

Distribution of the Final Score by Age Group.

Factor Analysis 12
Bartlett’s Sphericity Test18,19
The first test performed was the Bartlett using the RedaS 11 statistical software package to verify whether the variables are correlated with each other, which will ensure the coherence of the set of items. In this test, the null hypothesis is that the correlation matrix is equal to the identity matrix. For this data set, a statistic equal to 2662,486 and a P-value less than 2.22 × 10⁻¹⁶ were found, implying that the covariance matrix is not equal to identity.
Kaiser Criterion–Meyer–Olkin (KMO) 19
The next criterion used to verify the adequacy of the Factor Analysis was the Kaiser–Meyer–Olkin or KMO Criterion, using the RedaS 11 package. The value found was very good and equal to .92341, as it is above .8, which is already considered a good result.12,20
Measure Sampling Adequacy—MSA.
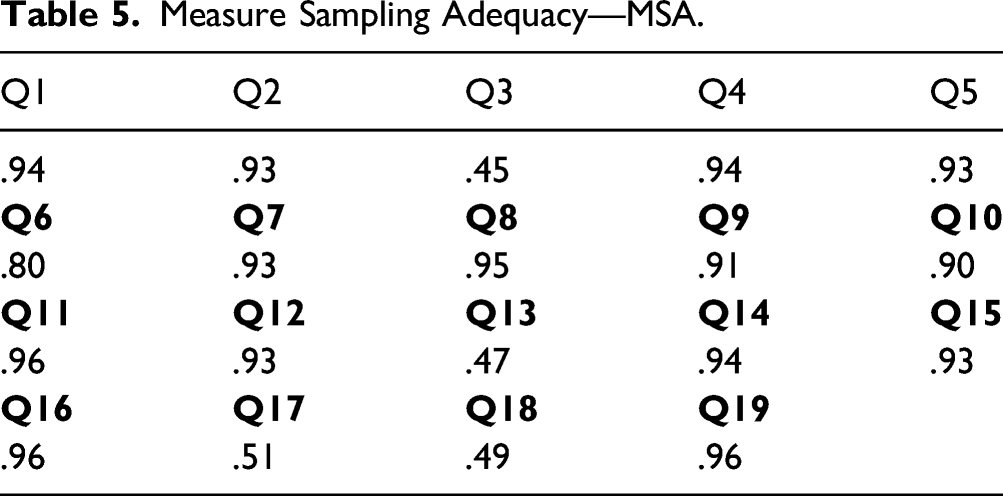
Due to the results found for the Bartlett and KMO tests, it is appropriate to perform Factor Analysis for the questionnaire.
Factorial Loads
Then, the factor loads were extracted to determine the number of factors, using the Kaiser Method of the correlation matrix, via Screeplot 21 where factors related to eigenvalues less than 1 were eliminated, as shown below:
By this criterion, there are 4 factors and the adequacy of the questionnaire was observed, where the commonality of 2 questions only showed to be below the value of .5, which is the minimum desired. 20 As these values approach, they start to meet this requirement, ensuring the questionnaire’s assertiveness for the research objective.
Internal Consistency by Cronbach’s Alpha
The last step of the factor analysis was to calculate Cronbach’s Alpha,22,23 using the psy 24 package, in order to measure the internal consistency of the questionnaire. The value found was .9047831, considered a good result, which means coherence between the items in the questionnaire.12,24
Results on Digital Dependence
Most of the volunteers (72.5%) were considered to be without digital dependence (42.2%) or with mild dependence (30.3%) located at the mild level. In the undergraduate volunteers, therefore, among the youngest (80%) there was no digital dependence in their behaviors, while in the Specialization students they added 56.2% and the Masters students added 66.1% in this condition.
Corroborated aspects related to the higher prevalence of women in digital use and greater signaling about levels of dependence for them.
Discussion
Based on the results presented, on the objectives and delimitation of the research, it was possible to observe important aspects of the employees' digital dependence, from the collective perspective of the organizations.
King et al 25 verified that there is a compromise in personal, social, academic, and professional life in volunteers with excessive use and/or dependent on digital technologies in their daily lives.
It is expected that the increased use of the Internet can have both positive and negative implications, in terms of better quality of life (contents such as health, culture, education, business, computers and technology, sports, science, arts, and politics) on the one hand and addictive potential (Instagram and sexual content) on the other. As Internet use is expected to be spent or even encouraged, the assessment of its implications can be of particular value in the general population or even more so in special populations. 26
Digital dependence has been growing in organizations without the necessary perception of their leaders, not prepared to identify and understand the effects of this phenomenon, which interferes in human behavior, in the organizational environment and, consequently, in culture, performance, and expected results. 1
The distribution of the final score, in Table 2, confirms the largest number of women participating in the survey and revealed that 72.5% of the sum of those without dependence with mild dependence characterizes the sample with low scores of digital dependency. Table 3 shows that among the youngest in undergraduate courses, 80% scored between 0–8 and 9–18 (without dependence—56.2% and Light—23.8%), with no significant digital dependency scores, while who have Specialization in these 2 same point ranges reached 70.4% in the sum. Among the volunteers with Master’s degrees, the sum of these same point ranges reached 66.1%, indicating that the younger the age, the less the digital dependence or the perception of it. This is confirmed in Table 4 where the total scores adding volunteers without digital dependence to those with mild dependence between 19 and 25 (73.1%), between 26 and 30 (49.2%), between 31 and 40 (72.4%), 41 and 50 (80.3%), 51 and 60 (86.7%), and 61 and 70 (100%) have high percentages, confirming the low digital dependence of the sample or low perception about this type of dependence.
Despite the innumerable benefits that information technologies provide to its users, the adverse effects of the indiscriminate use of personal technological devices in the workplace are a topic that needs to be explored. 27
One of the adversities is nomophobia 3 treated fundamentally in the areas of Psychology and Psychiatry, and it can also be revealed in organizations, due to the demands of companies for the availability of employees at all times. Thus, the topic becomes relevant for organizations in order to take care of the health and well-being of their employees. 28
Thus, the research mentioned here was applied, whose data set was satisfactory considering the number of items on the scale.
Descriptive statistics showed a high concentration in low values, which may mean that the volunteers are in a mild condition of digital dependence or without any dependence. This perception is not surprising because digital addicts generally do not see themselves in this condition and tend to respond with lower levels of dependency than they actually have. It is also necessary to consider the nature of the organizations where the volunteers work. Organizations belonging to digital technological branches tend to form a more natural perception of employees, to everything that is digital, making it difficult for employees to see.
Demographic data showed good frequency, showing consistent schooling to understand the items on the scale. They offer satisfactory variability between age groups, which minimizes the trend of prevalence of one age group, creating research bias. With the increase in research using this scale, it should be possible to observe behaviors about possible predominance between these ranges, expanding the meaning of using this scale.
Factor Analysis can be performed due to the low P-value in Bartlett’s Sphericity Test, indicating that there is a correlation between variables. In addition, according to the KMO criterion, the adequacy of the factor analysis with the value of .92341 was ratified, well above the .8 benchmark, which is considered good. 12
In that analysis, the Measure Sampling Adequacy (MAS) values for each question showed the questionnaire’s high suitability in relation to the research objectives.
Using the Kaiser Method, via ScreePlot for the choice of factors, 4 factors were found, maintaining the 19 questions (Annex 1), as found in other applications of this questionnaire. Of the 19 questions, 17 presented communalities above .50, while 2 questions with values below .50 when having their values adjusted by approximation were within these limits, demonstrating the adequacy.
The internal consistency extracted by Cronbach’s Alpha17,18 presented a value of .9047831, which confirms the alignment between the questions on the scale previously validated statistically and already in use.
Regarding limitations, which did not affect the achievement of the objectives, the novelty of the theme stands out, especially in organizations. Additionally, it is possible that certain distrust occurs in employees about what will be done with their responses, even though it is assured that the data would be treated collectively.
The field of behavioral addictions is still young, and there are many gaps remaining in what is currently known and what is in clinical practice. 29
Conclusion
The degrees of collective digital dependence (No Dependence, Light, Moderate, and Severe) were shown in the total sample according to research objective. For the studied sample, the perspective of the volunteers in general does not present high levels of digital dependence, but with differences among age groups.
Differences were observed in the results between men and women, confirming the higher prevalence of participation by women. It was observed in the sum of the last 2 scoring ranges (19–28 and 29–38) of Table 2, with 30.3% (27.7% + 2.6%) of women, against 22.2% of men. No man admitted to being at the serious level.
The final score in Table 4 showed a high percentage (72.5%) of Non-Dependent volunteers added to the Light level, revealing that this sample does not have serious problems of digital dependence.
Further investigations on this phenomenon in the organizations' environments are necessary to strengthen the findings, as the results can guide the performance of their leaders in the best coexistence of their teams with digital dependence, which may present different characteristics according to the various organizational groups.
Footnotes
Author Contributions
Gonçalves, LL—developed the project and wrote the manuscript, Nardi, AE—wrote the manuscript, Bortolanza, S—realized application of the questionnaire and set up database, King, M—realized application of the questionnaire and set up database, Santos, H—performed statistical analyses and discussed results, Rodrigues, D—performed statistical analyses and discussed results, and King, A.LS—contributed in work orientation and discussed the data
Declaration of Conflicting Interests
The author(s) declared no potential conflicts of interest with respect to the research, authorship, and/or publication of this article.
Funding
The author(s) received no financial support for the research, authorship, and/or publication of this article.
Ethical Approval
Does not apply because there is not presential contact whit volunteers, who do not identify. The research was online. There was no use of medication.
Annex 1
Scale Inserted in Google Forms to Be Filled out by Volunteers Validated Scale to Assess the Employee's Digital Dependence (EDDE) 30
Date: -----/----/------ Age: ---------------
Company: ( ) Public ( ) Private
Results
After answering all questions
Below are the values referring to the points obtained in your score: