
Abstract
Within the past decade, the U.S. health care market has undergone massive vertical integration, prompting economists to study the underlying causes and consequences of hospital-physician integration. This paper examines whether or not hospitals strategically choose to vertically integrate with clinical oncologists in order to capture facility fees, a commonly cited reason for increased consolidation in the health care market. To address this question, I match data on hospitals’ ownership of clinical oncologists with Medicare payment data disaggregated to the physician and specific service level. I leverage a 2014 policy change that drastically altered the payment structure of Medicare’s facility fees paid to hospitals for evaluation and management services—and yet, it did not alter the direct payments made to physicians. Contrary to popular belief, I find no evidence that the financial incentives of facility fees have an effect on the probability that a hospital and a clinical oncologist vertically integrate.
The structure of provider reimbursement for publicly insured patients remains intimately connected with the debate concerning the integration of hospitals and physicians; this topic continues to garner attention despite little empirical evidence that hospitals target physicians in order to capture the excess rents produced by facility fees.
Contrary to popular belief, I find no evidence that the financial incentives of facility fees have an effect on the probability that a hospital and a clinical oncologist vertically integrate.
If hospitals are not strategically targeting physicians in order to capture excess rents generated by Medicare’s payment structure, then the current perception—that is, facility fee payment incentives have led to exacerbated hospital-physician integration—should be reconsidered.
Background
Physicians practice in a variety of organizational settings such as independent practices and large integrated health systems. U.S. oncologists have faced dramatic increases in vertical integration with hospitals within the past 20 years—from roughly 30% in the early 2000s to 57% in 2016. Economic theory is ambiguous regarding the effects of vertical integration, and there is no consensus as to why hospitals and physicians vertically integrate.1,2 Many prominent cited rationales for vertical integration are unique to the health care marketplace and diverge from traditional economic literature. Early research from the 1990s, for example, posited that hospital-physician integration aimed to improve bargaining positions as managed care penetration became more prevalent. 3 Modern rationales, however, vary somewhat; whereas some scholars specify that physicians possess an increased desire to reduce administrative burden, others suggest changes in physician work-life preferences.4,5 In addition, economists have argued that financial incentives such as 340B programs and insurer contracts have spurred consolidation.6,7 Another often discussed financial incentive scholars have appealed to is that hospitals make a concerted effort to integrate with physicians to capture facility fee payments.8-16
Irrespective of whether a physician is vertically integrated or unintegrated—that is, hospital-employed or independent with hospital admitting privileges—when a patient is provided a service in a facility that is part of a hospital, payors such as Medicare typically pay provider-based facility fees in addition to a standard service payment. These facility fees are provided in order to help offset costs for operating hospitals that freestanding offices do not encounter. The only requirement for a facility fee payment is that the physician bills the service as hospital-based rather than as freestanding office-based. As expected, the vast majority of unintegrated physicians bill standard outpatient patient visits as freestanding office-based. A standard patient visit does not require a hospital’s infrastructure, and there is little reason for an unintegrated physician to perform many outpatient services in a hospital-based setting. This, however, is not the case for integrated physicians. Integrated physicians often bill standard patient visits as hospital-based services. Medicare rules allow them to bill as though they are working in a hospital, even for services provided in their offices—in turn, generating a facility fee. As a result, vertically integrated health systems can capture the increase in rents despite the fact that there is no physical change as to where the acquired physicians treat patients. Thus, facility fees may promote hospital-physician integration if hospitals attempt to capture them by acquiring physicians and converting their previous freestanding office-based services to hospital-based services.
The Medicare Payment Advisory Commission (MedPAC) has identified facility fees for evaluation and management (E&M) services of particular concern. In their March 2016 report, MedPAC demonstrated that a large portion of growth in outpatient volume can be attributed to the actions of hospitals first acquiring physicians then converting physician billing from previous freestanding office-based E&M services to hospital-based E&M services. Defined as new or existing patient office or other outpatient visits, E&M services have been found to be comparable across sites of care and provide substantial facility fees; additionally, E&M services have been identified by MedPAC as one of the service groups in which outpatient billing by hospital-owned physicians is increasingly prevalent. MedPAC estimated that in 2015 the Medicare program spent $1.6 billion more than it would have if prices for E&M services in a hospital-based setting were the same as freestanding office-based prices—an increase of about 42% off the base of physician new patient E&M services’ payments (MedPAC, 2017).
Overview of the Analysis
In this paper, I take seriously the claims that hospitals strategically target physicians in order to capture facility fees. By leveraging a 2014 policy change introduced by the Centers for Medicare & Medicaid Services (CMS), my paper analyzes whether or not facility fees incentivize hospitals to vertically integrate with clinical oncologists. The 2014 policy—which was announced on July 18, 2013 and took effect on January 1, 2014—collapsed the previous facility fee rates for varying durations of physician E&M services into a single rate for all hospital-based E&M services. I focus specifically on clinical oncologists because they are a physician group that is highly exposed to and strongly affected by the fee changes. Their exposure to this policy originates along two dimensions. First, E&M services are a high utilization service type for clinical oncologists accounting for 16% of all Medicare revenues in the period of study. Additionally, they provide a disproportionately large amount of facility fees relative to other service types—accounting for 22% of all facility fee payments generated by clinical oncologists. Second, oncologists primarily serve the age 65 and over population who are near-universally covered by Medicare—alleviating concerns relating to other confounding factors that typically exist in a setting where physicians receive the majority of their revenues from private health insurance payors.
While the goal of the 2014 policy was to eliminate incentives to up-code, empirically I find no change in oncologists’ billing behavior. What the policy did is differentially affect the facility fees that a hospital can capture for these services by integrating with oncologists. Specifically, certain physicians are more affected by this policy than others due to the heterogeneity in the durations of E&M services billed by physicians. This heterogeneity creates variation that allows me to assess the role of facility fees in hospital-physician integration. If the perceived wisdom is true—that is, if facility fees are in fact a driving force in hospital-physician integration—it is expected that physicians who experienced large reductions in potential facility fees should be less attractive to a hospital and thereby less likely to integrate. On the other hand, physicians who experienced gains in their potential facility fees should be more attractive to a hospital and thus, more likely to be targeted for hospital-physician integration. A unique feature of the 2014 policy I implement is that it directly altered facility fee payments made to hospitals, yet it left direct payments made to physicians for these services unaltered—thereby, not changing physicians’ incentives to integrate.
Using 2012 to 2017 data on the ownership status of the practices of the near-universal set of U.S. clinical oncologists obtained from SK&A (now known as IQVIA OneKey) matched to utilization and payment data disaggregated to each physician and specific service provided by CMS, I construct an index of the dollar change in potential facility fees that can be captured by a hospital integrating with a clinical oncologist—projecting the future fee schedule change occurring from the 2014 policy on 2013 billings. This index accounts for two sources of facility fee revenues an integrating clinical oncologist can generate for an acquiring hospital—the fees from converting all E&M services previously: (1) billed as freestanding to hospital-based and (2) billed as hospital-based at hospitals other than the acquiring system. In effect, this index serves as an intensity of treatment measure that captures the incremental effect of a reduction or an increase in facility fees generated under the 2014 policy. Operationally, I estimate a linear probability model that specifies the likelihood of a clinical oncologist integrating with a hospital as a function of this constructed index as well as a vector of physician characteristics.
Data
Integrated Physicians
My analysis utilizes the 2012 to 2017 SK&A oncologist subset to identify the vertical integration of hospitals and clinical oncologists. I define a clinical oncologist as any physician falling under the following specialties: gynecological/oncology, hematology/oncology, and medical oncology. Surgical oncology and radiation oncology physicians are excluded from the analysis sample because they bill few E&M services and are unlikely the target of a hospital’s effort to integrate with physicians to capture E&M facility fees. SK&A’s database has been increasingly implemented in studies of hospital-physician integration.1,6,14,17-20 Moreover, SK&A provides practice-level variables such as National Provider Identifier (NPI), office address, patient volume, number of providers, site specialty, and ownership. Studies of the completeness of the SK&A data set have found it to provide reasonably accurate up-to-date address and ownership information of physicians.21-23
Provider Utilization and Payment
I link the 2012-2017 SK&A data to the Medicare Fee-For-Service Provider Utilization and Payment Data Physician and Other Supplier Public Use File (PUF) on NPI. PUF is a public data set prepared by CMS; it contains information on utilization, payment, and submitted charges for 100% of final-action Medicare payments organized by NPI, Healthcare Common Procedure Coding System (HCPCS) code, and place of service. Additionally, for all PUF data years, provider demographics such as name, physician specialty, credentials, gender, complete address, and NPIs are provided. A supplementary PUF data set—Medicare Physician and Other Supplier Aggregate Table by Physician—is implemented and contains beneficiary demographics and health characteristics including age, sex, race, Medicare and Medicaid entitlement, chronic conditions, and risk scores.
Facility Fees
Data in the PUF only represent physician’s professional fees and do not include facility fee payments. To account for this, I augment my data set with hospital facility fee data using CMS’s Hospital Outpatient Prospective Payment System (OPPS) Addendum A and Addendum B. Full details on the steps used to construct the final analysis sample can be found in Appendix A.
Research Design
Institutional Setting
Table 1 provides a visual representation of Medicare’s payment structure by integration status and service location. As displayed in Table 1 Panel A, regardless of integration status, if a physician bills for a service provided to a patient as freestanding office-based, he or she will be reimbursed a physician’s professional fee at the freestanding office-based physician rate. If a physician bills a service as hospital-based, he or she will be reimbursed a physician’s professional fee at the hospital-based physician rate and a second facility fee payment will be made to the facility’s owner. Table 1 Panel B presents a numerical example of payments made by CMS for HCPCS code 99214—the most commonly billed E&M service for clinical oncologists, accounting for 47% of their E&M billings. Appendix Table B1 presents the full distribution of E&M services by HCPCS code and service location. In 2013, CMS reimbursed $78.46 to a physician for a 25-minute established patient visit billed as freestanding office-based. The same service billed as hospital-based is reimbursed $153.87—$56.91 paid to the physician and $96.96 paid to the hospital. Appendix Table B2-B3 show the equivalent analysis for the full range of E&M codes. Because a “facility” can be a “hospital-owned office,” hospital-physician integration can result in a total Medicare payment that is almost doubled for the exact same service in the exact same location. Therefore, the incentive exists for hospitals to acquire physicians and to convert E&M services previously billed as freestanding office-based to hospital-based—thus, capturing facility fee payments.
Medicare Payments: Freestanding Office-Based vs Hospital-Based.

Source. PUF, MPFS, and OPPS, 2013.
Note. Under the Medicare Physician Fee Schedule (MPFS), many procedures have a separate Medicare fee schedule for physicians’ professional services when billed in a facility (hospital-based setting) or in a non-facility (freestanding office-based setting). Generally, Medicare provides additional payments to physicians and to other health care professionals for procedures performed in their freestanding offices because they are responsible for providing clinical staff, supplies, and equipment. The HCPCS code for this service is 99214.
Paid under the MPFS.
Paid under the OPPS.
Empirical evidence demonstrates that clinical oncologists bill a drastically higher portion of their E&M services as hospital-based rather than as freestanding office-based once they vertically integrate. Figure 1 illustrates 2 distributions separated by integration status of E&M services billed as hospital-based by clinical oncologists. Approximately 60% of integrated clinical oncologists bill all their E&M services as hospital-based. Of the remaining 40% of integrated clinical oncologists, 35% of them bill all their E&M services as freestanding office-based; 5% of integrated clinical oncologists bill their E&M services as a mix of the two. In contrast, 90% of unintegrated clinical oncologists bill none of their E&M services as hospital-based. Rather, they bill all their E&M services as freestanding office-based. As a result, when hospitals integrate with clinical oncologists, they can expect newly acquired clinical oncologists to shift a large percentage of previously billed freestanding office-based E&M services to hospital-based E&M services—even if, as previously mentioned, the location of the service is unchanged.

Location where clinical oncologists’ E&M services were billed by integration status.
Figure 2 Panel A shows the distribution of potential facility fees a hospital can capture when integrating with an unintegrated clinical oncologist—instructing him or her to bill all previously freestanding office-based E&M services as hospital-based E&M services. On average, a hospital can capture $104 132 in facility fee payments for E&M services by vertically integrating with a clinical oncologist. The highest billing clinical oncologist can generate as much as $974 830 in facility fees for a hospital. In addition to facility fees a hospital can generate by moving the billed place of physician service, the hospital can also capture facility fees from previous hospital-based E&M services that a clinical oncologist was billing at other hospitals. Figure 2 Panel B shows the distribution of potential facility fees a hospital can capture from unintegrated clinical oncologists—assuming that previous hospital-based E&M services performed at a different hospital prior to integration will be shifted to the acquiring hospital. On average, a hospital can capture $5511 per year in facility fee payments in this manner with the highest billing clinical oncologist generating as much as $265 764 per year.

Potential effects of hospital-physician integration.
A critical point that is frequently ignored in the assertion that facility fees are a driving factor in hospital-physician integration is that Medicare physician’s professional fee rates are higher for services billed as freestanding office-based (refer to Table 1). This is because when a service is provided in a freestanding office-based setting, a physician is responsible for providing clinical staff, supplies, and equipment. Therefore, potential gains in facility fees to a hospital from hospital-physician integration are counterbalanced by loss of payments to a physician. Figure 2 Panel C presents the distribution of Medicare payments that a clinical oncologist

where
The mean losses to a clinical oncologist due to billing all his or her previously freestanding office-based E&M services as hospital-based E&M services were $22 197 per year; the clinical oncologist with the highest potential losses could lose $175 526 in Medicare payments. Anti-kickback and Stark laws do not apply to entities that employ physicians. 14 Therefore, physicians may still be willing to integrate if they can negotiate over the gains in facility fees or are otherwise “compensated” for their loss. This kind of contractual arrangement, however, has not been empirically demonstrated.
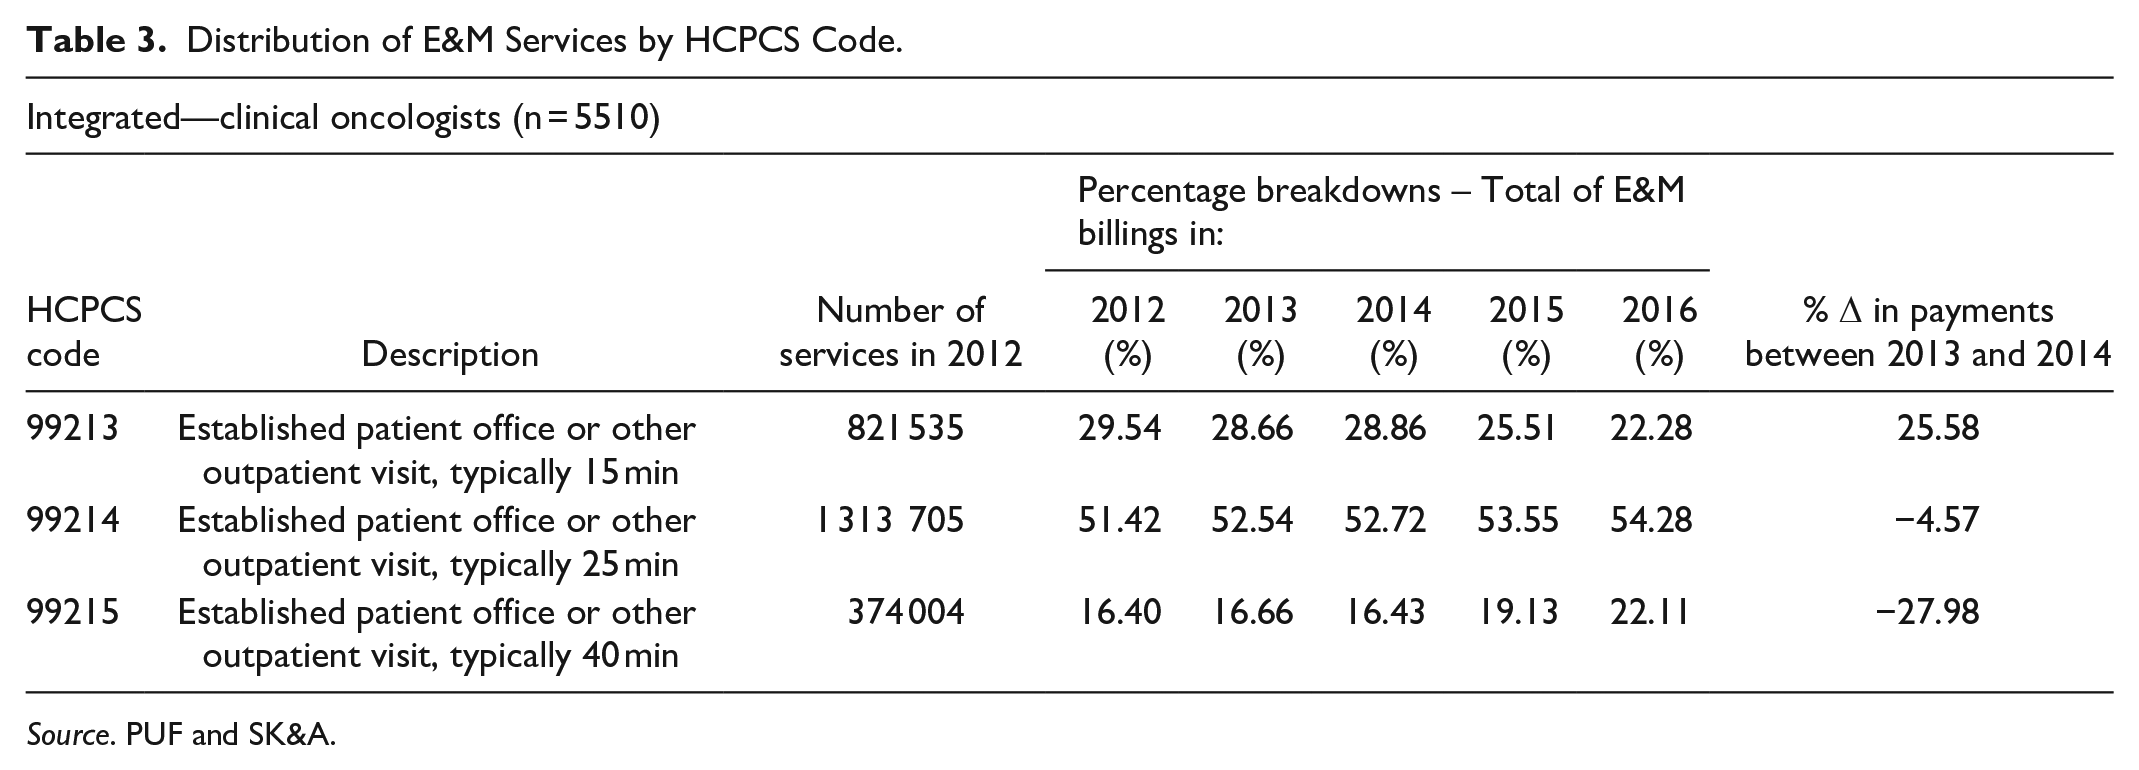
In order to systematically link facility fees to hospital-physician integration, exogenous variation in the amount of facility fees a physician generates is required. Therefore, to assess whether or not hospitals strategically choose to vertically integrate with clinical oncologists to capture Medicare’s facility fees, I leverage a 2014 policy change introduced by CMS (hereafter, 2014 single payment policy) that altered the facility fee payment structure for E&M services while leaving payments to physicians for these services unchanged. The 2014 single payment policy introduced new HCPCS code G0463 replacing the previous 10 HCPCS codes that varied by duration of a physician’s visit; the payment rate for the new G0463 code was based on the mean reimbursement rate of new and established codes from the 2012 OPPS claims data and was set at $92.53. Table 2 presents Medicare’s 2012 to 2014 facility fee schedule for new and established patient E&M services. The last column displays the percent change associated with the move to the single payment rate for G0463 in comparison to the patient clinic visit codes used for the years prior. The associated facility fee for the previous lowest reimbursed established patient E&M service, HCPCS code 99211, increased by 62.99%, whereas the associated facility fee for the previously highest reimbursed established patient E&M service, HCPCS code 99215, decreased by 27.98%. Descriptive evidence presented in Table 3 investigates whether billing behavior was altered after the implementation of the 2014 policy for the top 3 E&M services by volume (HCPCS code 99213-99215—accounting for 89% of all E&M services); it appears that after 3 years of implementing the 2014 single payment policy, billing behavior of integrated clinical oncologists did not change (Appendix Table B4 presents the full table for E&M services by HCPCS code).
Medicare’s Facility Fee Payments for E&M Services.

Source. OPPS.
Effective Jan. 1, 2014, facilities are required to report outpatient clinic visits using a new HCPCS level II code G0463 (hospital outpatient clinic visit for assessment and management of a patient), rather than using E&M HCPCS codes 99201-99205 (new patient) and 99211-99215 (established patient). The payment rate for G0463 is based on the mean reimbursement rate of new and established patient clinic visit codes (99201-99205/99211-99215) from the 2012 OPPS claims data.
Distribution of E&M Services by HCPCS Code.
Source. PUF and SK&A.
E&M services account for 16% of all Medicare payments made to clinical oncologists in the period of study (Appendix Table B5). Additionally, as displayed in Table 4, E&M services account for a disproportionately large share of facility fees relative to other service types—E&M services generate 22% of all facility fee payments. Thus, E&M services make up a sizable portion of clinical oncologists’ revenues and an even larger portion of facility fees this physician group generates.
Top 10 Medicare Facility Fee Categories.

Source. PUF and OPPS, 2013.
Billing Behavior Response to Hospital-Physician Integration
Clinical oncologists do not alter the ratio of E&M service durations once vertically integrating. This allows for the projection of a clinical oncologist’s prior year billings to future year billings—even after hospital-physician integration occurs. To demonstrate that billing behavioral changes do not occur in my sample of clinical oncologists after hospital-physician integration, I implement an event study analysis that estimates effects by year relative to year of integration. The estimation equation takes the following form:

where
Appendix Figure C1–C3 present the results of these event studies in which I model the outcome variable to be the share of clinical oncologists’ billings of HCPCS code 99213, 99214, and 99215—three codes which account for near 90% of E&M services for clinical oncologists. To facilitate interpretation, I plot the estimated coefficients and their 95% confidence intervals. Individual point estimates give the overall effect of hospital-physician integration on the shares of E&M services clinical oncologists bill in a specific year after hospital-physician integration. There is no observable change in the trend of the coefficients—implying that clinical oncologists do not alter billing behavior post-integration.
Constructed Measures
I construct two indices of the change to potential facility fees that a clinical oncologist can generate for an acquiring hospital resulting from the 2014 single payment policy. This is accomplished by using 2013 billing patterns and projecting the 2014 change in facility fees for E&M services. Due to data limitations, this research focuses on the acquisition of individual clinical oncologists by hospitals rather than physician practices by hospitals: First Office, represents the change in potential facility fees that can in principle be captured by a hospital integrating with clinical oncologist i—if clinical oncologist i moves all his or her office visits to a hospital:

where
Second Hospital, represents the change in potential facility fees that can be captured by a hospital integrating with clinical oncologist

where
Figure 3 presents the distribution of the combined effects of Office and Hospital in percentage terms relative to a baseline level of E&M facility fees—Baseline facility fees—each clinical oncologist generated in 2013 from which the incremental effect of the 2014 single payment policy on facility fees is measured:


Effect of the 2014 single payment policy.
The middle panel of Figure 3 presents the distribution for all unintegrated clinical oncologists in 2013. The 2014 single payment policy reduced the potential facility fees a hospital can capture from hospital-physician integration for the majority of clinical oncologists. The most negatively affected clinical oncologist lost 63% of his or her potential E&M service facility fee value to a hospital, and the most positively affected clinical oncologist gained 25%. Appendix Figure C4 presents the distribution of the combined effect of Office and Hospital in dollars. The policy decreased the mean value of a clinical oncologist to a hospital by $212 for the year; the most negatively affected clinical oncologist lost $133 102 in value, and the most positively affected clinical oncologist gained $174 008 in value. In comparison, data from 2011 indicate median losses among hospital-owned groups were $174 430 per full-time physician upon integration. 24 Considering this policy, at the extremes, can double or negate the yearly losses of a new physician to a hospital, it is plausible to posit that these changes in potential facility fees may strongly affect the probability of a hospital integrating with certain physicians.
While the mean effect of the policy is near zero, the wide variation around the mean is critical. This variation allows the constructed index to be interpreted as an intensity of treatment measure. Clinical oncologists near the mean can be viewed as having received low intensity of treatment, and clinical oncologists at the extreme tails of the distribution can be viewed as having received high intensity of treatment. The left panel of Figure 3 presents the distribution of my constructed index for clinical oncologists in the 10th percentile of those affected by the 2014 single payment policy. In contrast, the right panel of Figure 3 presents the distribution of my constructed index for clinical oncologists in the 90th percentile of those affected by the 2014 single payment policy.
Econometric Specification
I employ a linear probability model to estimate the effect of facility fees on the probability of clinical oncologist

where
The coefficient of interest in equation (1) is the effect of vector
To test for heterogeneous effects and to control for other determinants of hospital-physician integration—that if omitted may bias my estimates—I re-estimate equation (1) after interacting

The policy underlying my paper’s analysis is a consolidation of codes for different durations of E&M services into one code—that is, previously, a hospital was paid more for a 40-minute visit than for a 10-minute visit. After the policy change, that was no longer true. For physician payments, no consolidation of codes occurs; the policy change just affects facility fee payments. Therefore, effects of the 2014 policy change are correlated with the severity of patients that a clinical oncologist is treating. The vectors
Results
Initial estimates from equation (1) are presented in Table 5 Column 1; all monetary variables are reported in hundreds of thousands. Appendix Table B6 provides a comprehensive description of all variables used in this analysis. These estimates do not consider heterogeneous effects of the 2014 single payment policy (ie, indicators of being in the upper or lower tails of the index distribution and associated interaction terms) and only identify integration 1 year after the 2014 single payment policy was implemented. Virtually all coefficients relating to facility fees are statistically insignificant at conventional levels. Considering the vast majority of clinical oncologists were only marginally affected by the 2014 single payment policy, it is not surprising that on average the policy had no effect.
Linear Probability Model Regression Results.

Note. The dependent variable is a binary indicator taking the value of 1 if a clinical oncologist vertically integrated with a hospital in the year specified or the value 0 if he or she did not. Observations are at the physician level. Robust standard errors are in parentheses.
Significant at the 10% level.
Significant at the 5% level.
Significant at the 1% level.
For this reason, I next estimate specifications that capture the heterogeneous effects of the 2014 single payment policy. As previously discussed, by including an interaction of vector
Column 2 specifies the tails of the distribution of affected clinical oncologists to be at the 5th and 95th percentile. The estimated coefficient for Office is statistically insignificant. According to the estimates, a clinical oncologist not in the tails of the distribution of those affected by the 2014 single payment policy would have to experience a change of $100 000 in Office facility fees in order to have a 1 percentage point change in the probability of hospital-physician integration. At the 95% confidence interval, the estimates indicate a change of $100 000 in Office facility fees increases the probability of vertical integration by 8 percentage points or decreases the probability of vertical integration by 10 percentage points. This effect is not only statistically insignificant but also economically insignificant as it requires the change in Office facility fees to be upwards of $100 000 in order to experience single digit percentage point changes in the probability of hospital-physician integration.
Similarly, the estimated coefficient for Hospital is positive and statistically insignificant. According to the estimates, a clinical oncologist not in the tails of the distribution of those affected by the 2014 single payment policy would have to experience a change of $10 000 in Hospital facility fees in order to have a 3 percentage point change in the probability of hospital-physician integration. Analogous to how the coefficient for Office is economically insignificant, these estimates are as well. What is critical to my analysis, however, is what occurs for those most affected by the 2014 single payment policy—which is where I will now turn my attention.
The estimated coefficient for Office, Hospital, and their respective interactions with the indicators for being in the upper and lower tails of the distribution of those most treated by the 2014 single payment policy are of the expected sign but neither are statistically or economically significant. According to the estimate of the coefficient on
Column 3 specifies the tails to be the 10th and 90th percentile. In this specification, estimates of interest retain their magnitude and statistical and economic insignificance. The estimates of the interactions are statistically indistinguishable from zero.
Next, I demonstrate that many other monetary variables included in the regression analysis—which may critically contribute to the integration decision yet are independent of the variation resulting from the 2014 single payment policy—have the anticipated sign and play the role one would expect in hospital-physician integration. When hospitals and physicians participate in hospital-physician integration, they engage in a two-sided bargaining process. According to Column 2, the coefficient on Physician losses has a positive sign and is highly statistically significant. $10 000 Medicare payment losses for a clinical oncologist are associated with a 11 percentage point reduction in the probability of hospital-physician integration. Large values of Physician losses imply that integration would be costly to a clinical oncologist—mean losses to a clinical oncologist in payments stand at $22 197 per year. The coefficient on Baseline facility fees has a positive sign and is highly statistically significant. $10 000 Medicare payment losses for a clinical oncologist are associated with a 1.7 percentage point increase in the probability of hospital-physician integration. Large values of Baseline facility fees are indicative of a clinical oncologist being more attractive to a hospital that seeks to capture facility fees, irrespective of the change brought forth by the 2014 single payment policy; Baseline facility fees, however, is perfectly correlated with utilization and lacks any exogenous variation in the amount of facility fees a clinical oncologist generates.
In Column 4-9, I check the robustness of my estimates to the inclusion of an additional 1 or 2 years of integration. For these specifications, integration status is extended 2 to 3 years after the policy was implemented. This accounts for 3.5 calendar years after the change to Medicare’s facility fees was announced—allowing sufficient time for the consequences of the 2014 single payment policy to affect hospital-physician integration decisions. The issue of timing regarding integration is particularly important for interpreting a result of no effect. The estimated coefficients for Office remain positive, statistically insignificant, and similar in magnitude. The estimated coefficients for Hospital remain positive, statistically insignificant, and similar in magnitude; both remain economically insignificant. The estimated coefficient corresponding to
To my knowledge, the only prior study that empirically demonstrated a relationship between Medicare’s reimbursement structure and hospital-physician integration is Dranove and Ody 16 ; they argue that “payment differentials” incentivize physicians to engage in vertical integration with hospitals in order to negotiate over excess rents. In contrast to my study—which leverages a policy shock that explicitly alters facility fee payments for E&M services while leaving direct payments to physicians unaltered—Dranove and Ody 16 exploit a plausibly exogenous 2010 policy that lowered physician prices, but left prices in facilities the same, thereby altering a physician’s opportunity cost and his or her desire to vertically integrate. Using private insurance claims data and a measure of the intensity of the price change in a hospital-based setting that resulted from the 2010 policy, they estimate that the change in Medicare’s methodology explains 20% of the increase in physician employment. While Dranove and Ody 16 focus their attention on a different physician group and time period and exclude E&M services from their analysis due to data limitations, I nonetheless adopt the approach of testing the hypothesis that hospital employers and physician employees integrate in order to split higher relative revenues that facility fees create in Appendix D. I demonstrate that even when implementing this alternative mechanism, facility fees play virtually no role in vertical integration for the sample studied.
Overall, the evidence indicates that hospitals do not prioritize the capture of facility fees when proposing vertical integration. This contradicts the current perception of scholars and policy makers alike who deem that facility fees’ financial incentives in the Medicare payment structure have exacerbated integration.
Limitations
This study has several limitations. First, it focuses on a specific specialty (oncology) and population (Medicare fee-for-service); while oncology had the most integration activity of all specialties over the past two decades 25 and ranks high—top five by service volume—in Medicare billing data, this narrow focus limits the generalizability of the findings. Given the prohibitive cost of the SK&A data and the contracting process involved in acquiring them, this study is unable to conduct the same analysis for other specialty groups.
Second, there exists the possibility that the 2014 single payment policy was not a large enough shock to the incentive structure of hospitals to solicit a response. A sizable 16% of all revenues result from E&M services; potential correlations, however, could exist between the policy change and the general severity of a physician’s patient population and the types of services he or she is offering. Injectable drugs are a large source of oncologists’ revenue; potential correlation with 340B/injectable drug incentives may be another large and systemic driver of integration—making omitted variable bias a concern. The lack of a substantial pre-period results in an inability to test for pre-trends.
Third, I argue that the 2014 single payment policy only alters hospital incentives but not physician incentives to integrate. This assumption is predicated on the physician not receiving substantial kickbacks from a hospital if low reimbursement E&M services are converted to high reimbursement E&M services. Hospital-physician integration often results in physicians being salaried by hospitals that can be structured as a straight salary or as a productivity-based salary—in which pay is linked to how much a physician does but in a way that is not directly linked to revenue. Also, when physicians sell their practice, there is a price. This price could adjust based on the number of rents that are on the table during negotiations over practice buyout and salary structure.
Conclusion
Recent economic literature and policy interest have focused on the integration of hospitals and physicians—asking what the consequences of vertical integration are on physicians, patients, and payors. Few papers, however, have addressed the underlying reasons as to why hospitals and physicians vertically integrate. The received wisdom put forth in the Medicare literature maintains systems are integrating for the tangible financial benefits of Medicare’s facility fees. The exploitation of the facility fee payment structure is assumed to be an impetus in hospital-physician integration. However, the incentive to capture the mechanical increase in Medicare reimbursements generated from facility fees is just one possible explanation for the increase in hospital-physician integration.
My paper empirically examines whether hospitals make a concerted effort to integrate with physicians to capture facility fees. I leverage a 2014 policy change that collapsed facility fee rates for E&M services into a single rate for each hospital-based service—thereby, altering the amount of facility fees a hospital can capture when integrating with an unintegrated clinical oncologist. This paper demonstrates that facility fees do not lead to significant alterations in the probability of a hospital and a clinical oncologist vertically integrating. In other words, hospitals do not prioritize capturing facility fees’ financial incentives when proposing vertical integration with physicians.
While the simplest way to address the excess expenditures facility fees generate is to set payment rates equal wherever a service is provided, hospitals face a unique set of licensing and accreditation requirements that increase their cost structure. Hospitals incur costs to maintain standby capacity for handling emergencies and must comply with more stringent regulatory requirements than a freestanding office. 8 If hospitals are not strategically targeting physicians in order to capture excess rents generated by Medicare’s payment structure, then the current perception—that is, payment incentives have led to exacerbated hospital-physician integration—should be reconsidered.
Supplemental Material
sj-pdf-1-inq-10.1177_00469580211022968 – Supplemental material for Do Medicare’s Facility Fees Incentivize Hospitals to Vertically Integrate with Oncologists?
Supplemental material, sj-pdf-1-inq-10.1177_00469580211022968 for Do Medicare’s Facility Fees Incentivize Hospitals to Vertically Integrate with Oncologists? by Samuel Valdez in INQUIRY: The Journal of Health Care Organization, Provision, and Financing
Footnotes
Acknowledgements
I thank Mireille Jacobson, Jiawei Chen, and David Brownstone for helpful suggestions. I am grateful for the assistance provided by Cheryl Valdez.
Declaration of Conflicting Interests
The author(s) declared no potential conflicts of interest with respect to the research, authorship, and/or publication of this article.
Funding
The author(s) disclosed receipt of the following financial support for the research, authorship, and/or publication of this article: This research was partially supported by AHRQ 2T32HS000046. The content is solely the responsibility of the authors and does not necessarily represent the official views of AHRQ. The authors are solely responsible for any errors or omissions.
Supplemental Material
Supplemental material for this article is available online.
References
Supplementary Material
Please find the following supplemental material available below.
For Open Access articles published under a Creative Commons License, all supplemental material carries the same license as the article it is associated with.
For non-Open Access articles published, all supplemental material carries a non-exclusive license, and permission requests for re-use of supplemental material or any part of supplemental material shall be sent directly to the copyright owner as specified in the copyright notice associated with the article.