
Abstract
China’s pursuit of economic growth, rapid industrialization, and urbanization over the past few decades has resulted in high energy consumption, which in turn has caused serious environmental pollution problems, such as CO2 and PM2.5 emissions, the long-term exposure to which can seriously affect resident health. To resolve these air pollution problems, the Chinese government has put in place several policies to reduce air and environmental pollution. Past studies on energy and environmental efficiency have been mostly static, have ignored the dynamic changes over time and regional differences, and have rarely considered human health factors. Therefore, this study employed a modified meta 2-stage Epsilon-Based Measure (EBM) Malmquist model to explore the relationships between the economy, energy, the environment, health and media, and the regional differences in 31 Chinese cities from 2014 to 2016. It was found that (1) Haikou and Lhasa’s efficiencies were 1 and were the best in all 3 years, and Shijiazhuang, Jinan and Shenyang’s were the most improved; (2) there was a gap between the eastern, central and western technological frontiers, with Chengdu, Hohhot, Chongqing, and Nanchang having technological gap ratios below 0.70 in the western and central Chinese regions, and Haikou, Guangzhou, and Shanghai in eastern China having technological gap ratios above 0.90 in all 3 years; and (3) the variations in the health treatment stage were greater than in the production stage, indicating that technological changes and efficiency improvements in the health treatment stages in each city were not stable.
The US Environmental Protection Agency’s research institute’s “2019 Global Air Condition” report claimed that around 5 million people were affected by death or disease from long-term air pollution exposure in 2017, most of which were noncommunicable diseases such as cardiovascular diseases, stroke, chronic obstructive pulmonary diseases, and lung cancer. Therefore, air pollution poses one of the biggest single global environmental risks to human health, with 1 in 9 deaths being related to indoor or outdoor air quality. The World Health Organization (2016) reported that 92% of the world’s population live in areas where the local air pollution exceeds the World Health Organization’s PM2.5 limits.
Two main contributions include the following: First, as well as exploring the economic, energy and environmental pollution efficiencies, this study also analyzed the impact of government health care spending on health disease efficiency. Second, to study the dynamic changes over time, a modified meta 2-stage EBM Malmquist model was developed, that had a production first stage, in which labor, fixed assets and energy consumption were the inputs, gross domestic product (GDP) was the output, and the link variables between the production stage and the health treatment stage were CO2 and Air Quality Index (AQI), and a health treatment second stage, in which government health expenditure and media reports were the inputs, and respiratory diseases and birth rate were the outputs.
Due to the differences in industrial structures, energy consumption, social development, environmental pollution, and governance in the eastern and central and western regions, the environmental pollution in the central and western regions was found to be more serious, and the environmental pollution health problems need greater attention. The central and western regions also need to strengthen their technological research, development investment, and health care to improve their health and medical management technical levels to further narrow the gap with the eastern region.
Introduction
High economic growth means high energy consumption and serious environmental pollution problems, which can endanger resident health and safety. Exposure to ambient air pollution has been found to increase chronic health problems and resident mortality. The US Environmental Protection Agency’s research institute’s “2019 Global Air Condition” report 1 claimed that around 5 million people succumbed to death or disease in 2017 from long-term air pollution exposure, most of which were noncommunicable diseases such as cardiovascular diseases, strokes, chronic obstructive pulmonary diseases, and lung cancer. Therefore, air pollution is one of the biggest single global environmental risks to human health, with 1 in 9 deaths being related to indoor or outdoor air quality. The World Health Organization 2 reported that 92% of the world’s population live in areas where the local air pollution exceeds the World Health Organization’s PM2.5 limits.
China’s rapid industrialization and energy demand growth means that since 2000 China has been the world’s largest carbon dioxide emitter, accounting for 28% of global emissions, primarily because of its continued use of coal, most of which is used for China’s energy generation and industrial production. Because around 1.1 million Chinese die each year from air pollution related illnesses, the Chinese government has sought to mitigate environmental pollution problems by establishing new environmental regulations such as the “Air Pollution Prevention and Control Action Plan” for PM2.5 pollution, the “Environmental Protection Law” to supervise the environmental review system, and the “13th Five-Year Plan” to control nationwide environmental pollution.
Energy, economic growth, air pollution, and environmental pollution have been widely studied using impact factor analysis,3-22 with some studies having also examined the effects of air pollution on health,23-43 and some studies exploring the impact of energy and environmental efficiency on air pollution emissions.9,40,44-46
Therefore, the main past research directions on the effect of environmental pollution on health have been primarily from energy, economic, carbon dioxide emissions reduction, and environmental pollution perspectives, and rarely from health, economic, energy and environmental pollution perspectives. However, much of the past research has ignored the impact of economic development, energy use, environmental pollution, and public reports on human health, and the environmental factor focus has tended to be on CO2, with scant attention given to other important Air Quality Index (AQI) environmental indicators. Furthermore, because most of these impact studies have used regression and/or static Data Envelopment Analysis (DEA) efficiency analyses, the methods have been mainly radial (such as Charnes, Cooper and Rhodes [CCR] and Banker, Charnes and Cooper [BCC]) or nonradial (Slacks-Based Measure [SBM]). However, radial DEA models ignore nonradial slacks, and nonradial DEA models ignore the characteristics of the same proportion of radial slacks. As most previous research has been based on 1-stage DEA, there have been few studies that have looked at dynamic changes over time, which means that it has not been possible to gain insights into the dynamic changes in the economic, energy, and environmental sustainability or the cumulative effects on human health.
To overcome the high and low efficiency values caused by radial and nonradial bias, and to include consideration of human health issues, this study proposes a modified meta 2-stage EBM Malmquist model to explore the economic, energy, environmental, health, and media efficiencies in 31 cities in China from 2014 to 2016, and makes two main contributions. First, as well as exploring the economic, energy, and environmental pollution efficiencies, which include the AQI environmental indicators, this study also analyzes the impact of government health care spending on health disease efficiency. Second, to study the dynamic changes over time, a modified meta 2-stage EBM Malmquist model is proposed in which labor, fixed assets and energy consumption are the inputs in the production first stage, gross domestic product (GDP) is the output, and the link variables are CO2 and AQI, and a health treatment second stage, in which government health expenditure and media reports are the inputs, and respiratory diseases and birth rate are the outputs.
Literature Review
Past research on the economy, energy consumption, environmental pollution, and human health has had three main directions. First, there have been many studies on energy, economic growth, air pollution, and the associated impact factors that have not considered any associated health effects. For example, Wang et al 3 used a multidirectional efficiency analysis (MEA) to explore regional energy and environmental emissions efficiency in China from 1997 to 2010, and found that because of its higher energy and emissions ratio efficiencies, China’s MEA efficiency was better in the eastern region than in the central or western regions, Zhang and Choi 4 used an SBM-DEA model to analyze the environmental efficiencies in Chinese cities and found that most cities had relatively low energy efficiencies and the environmental efficiencies differed significantly, and Georgiev and Mihaylo 5 analyzed the Environmental Kuznets Curve (EKC) for 30 Organisation for Economic Co-operation and Development (OECD) countries, and found that there was the inverse U-shaped relationship between income and pollution, but this was not applicable to all gases; that is, the EKC existed only for carbon monoxide, volatile organic compounds, and nitrogen oxides, but for CO2, the curve was monotonically increasing. In other studies, Wu et al 6 used a 2-stage network DEA model to assess China’s energy and environmental energy conservation and emissions reduction efficiencies from 2006 to 2010, finding that they were better in eastern China than in the central or western regions, the central region had better production efficiency than the western region, and the western region had better processing efficiency than the central region; Lin and Du 7 used a nonradial directional distance function to assess the regional energy and carbon dioxide emissions efficiencies in China from 1997 to 2009, and found that in most parts of China, there were poor energy use and CO2 emissions performances, and that the ratio of coal to total energy consumption and industrial sector expansion was negatively correlated to China’s regional energy and CO2 emissions performances; and Li et al 8 established a dose-response relationships and willingness to pay model to determine minimum and maximum limits and explore the impact of air pollution on Chinese provinces, finding that the health-related economic losses caused by PM10 and SO2 accounted for 1.63 and 2.32% of GDP, the public health effects caused by PM10 and SO2 in Chongqing resulted in the largest economic losses, the economic loss per capita from the public health effect was the largest in Baoding City, Hebei Province, and the health-related economic losses in Xingtai, Hebei, accounted for the highest proportion of GDP, mainly because these three cities were typical heavy industry cities based on coal resources. Yao et al 9 collected Chinese provincial industrial sector panel data from 1998 to 2011 and used a meta-frontier nonradial Malmquist CO2 emissions performance index (MNMCPI) indicator to estimate China’s carbon dioxide emissions efficiency, finding that the average annual industrial sector CO2 emissions growth was 5.53%, and the average carbon dioxide emissions in the industrial sectors in the eastern, central, and western regions had declined. Qin et al 10 used DEA to explore energy efficiency in China’s coastal areas from 2000 to 2012, finding that except for Beijing and Hainan, the economic development levels were positively correlated with energy efficiency performances, energy efficiency performances were degraded when bad output was considered, and the Bohai Rim Economic Zone had the potential to improve its energy efficiency and air emissions. Du et al 11 explored China’s energy efficiency and carbon dioxide emissions from 2006 to 2012, and found that economic activity was the main driver of increased emissions, that changes in potential energy intensity, energy structure, and energy efficiency could reduce CO2 emissions in most provinces, and that the promotion of energy-saving technologies and emissions reduction in inter-regional technical differences could effectively reduce carbon dioxide emissions in areas with low technical efficiencies. To explore China’s total carbon dioxide emissions efficiency, Feng et al 12 decomposed CO2 emissions efficiency and emissions reduction potential into structure, technology, and management using a 3-hierarchal meta-frontier DEA, and found that because China had low structural efficiency, low technical efficiency and low management efficiency, the carbon dioxide emissions efficiency was relatively low, and suggested that to narrow the regional technological gaps, industrial structures be reformed, market-oriented reforms promoted, and environmental protections strengthened. Wang et al 13 used a meta-frontier DEA method to analyze carbon emissions in 58 countries from 2001 to 2007, finding that different reference technologies led to significant differences in carbon emissions, that Asia’s overall carbon emissions were lower than in Europe and the Americas, and that inefficient management and the production technology gap were the main reasons for the carbon dioxide intensity. Wang et al 14 explored the nonlinear relationship between economic growth and carbon emissions using smooth panel transition regression (PSTR) models, and found that China’s economic growth, its carbon dioxide emissions, and the impact of the urbanization level conversion rate on per capita carbon dioxide emissions was significantly higher than the GDP and per capita carbon dioxide emissions. Borozan 15 used DEA and Tobit models to analyze EU technology and energy efficiency from 2005 to 2013, finding that the technology and energy efficiencies in most countries varied widely and that human capital and innovative energy efficiencies had a significant impact. Cayir et al 16 used CCR DEA and Tobit regression models to analyze energy efficiency in China’s provinces and found that per capita GDP, population size, and renewable energy production all affected energy efficiencies, and some provinces needed to actively invest to improve their overall technology efficiency. He et al 17 used rough set theory (RS), a fuzzy artificial neural network, and DEA models to explore the impact of energy efficiency in China’s provincial industrial sectors, finding that as most provincial industrial sectors had low energy efficiencies, significant structural adjustments were needed. Li et al 18 used a dynamic DEA model to analyze the energy efficiencies in 31 cities in China from 2013 to 2016, and found that Beijing, Guangzhou, Shanghai, Lhasa, and Nanning had the best energy efficiencies, and that the average efficiency in the eastern region was better than in the western region. Wu et al 19 used a DEA model to explore the energy efficiencies in China’s industrial sector, finding that while sectoral energy efficiencies were still generally low, overall efficiency had maintained an upward trend over the 5 years. Yang and Wei 20 used game cross-efficiency DEA and Tobit models to analyze the total factor energy efficiency (UTFEE) in 26 cities in China from 2005 to 2015, finding that the energy efficiency in cities considering competition was lower than the traditional energy efficiency, most cities had no energy efficiency improvements, economic development, and city size promoted urban energy efficiency, and research investment had a negative impact on urban energy efficiency. Tian et al 21 used an EBM DEA model to explore the energy and emissions efficiencies in 19 Yangtze River economic belt (YREB) and 19 non-YREB provinces and cities, finding that the regional rankings and technology gaps in 5 of the non-YREB provinces and 4 of the YREB provinces had declined. Zhou et al 22 used a DEA model to measure the energy efficiencies in Chinese industries from 2010 to 2014, and found that most sectors and especially those related to energy extraction were underperforming and required energy conservation and emissions reduction efficiency improvements.
The second main research area has been on the health effects of human exposure to air pollution; however, the economic and energy factors have tended to be ignored. For example, Schiavon et al 23 analyzed the effects of human exposure to the air pollutants caused by traffic in urban areas using a COPERT algorithm and the AUSTAL2000 dispersion model, finding that the high emissions concentrations in street canyons had a significant impact on the human body; Fischer et al 24 explored the long-term exposure to air pollution and health problems in cities using land use regression (LUR) methods to track Dutch population data from 2004 to 2011, and found that long-term exposure to PM10 and NO2 resulted in nonaccidental mortality for every 10 μg/m3 increase, and that PM10 but not NO2 was associated with circulatory disease mortality; and Kelly and Fussell 25 used a linear concentration-response function to study the effects of exposure to PM2.5 pollution in Europe on human health, and found that long-term PM2.5 exposure seriously affected public health in Europe. In other studies, Lelieveld et al 26 used a global atmospheric chemistry model to analyze the effects of mortality in urban and rural environments and the human exposure to long-term PM2.5, finding that agricultural emissions had the greatest impact on PM2.5 in the eastern United States, Europe, Russia, and East Asia, that residential energy use had a major impact on premature deaths worldwide, and that there was a positive correlation between lung cancer and exposure to PM2.5 and other air pollution indicators. Loomis et al 27 examined the health effects of long-term exposure to air pollution in humans and found that there was a positive correlation between lung cancer and exposure to PM2.5 and other air pollution indicators. Lu et al 28 used a random effects models to investigate how PM10 and PM2.5 exposure affected nonaccidental mortality, cardiovascular mortality, and respiratory mortality, and found that for every 10 μg/m3 increase in PM10, the mortality rate increased by 0.36% to 0.42%, for every 10 μg/m3 increase in PM2.5, the overall nonaccident-related mortality increased by 0.40%, the mortality from cardiovascular disease increased by 0.63%, and the respiratory disease mortality rate increased by 0.75%. Khafaie et al 29 reviewed past research on air pollution and human health and found that short-term and long-term exposure to outdoor air pollution had an adverse effect on health. Tainio et al 30 found that the damage from cycling for one and a half hours a day or walking for more than 10 hours a day outweighed the benefits in areas with PM2.5 concentrations of 100 μg/m3; however, after riding for three and a half hours, the benefits of the physical activity far outweighed the damage caused by the air pollution. Xie et al 31 used a Computability Total Equilibrium Model (CGE) to analyze the impact of PM2.5 environmental pollution and health on China’s economy, finding that the PM2.5 pollution control in Tianjin, Shanghai, Beijing, Henan, Jiangsu, and Hebei was the best, that the health impacts in provinces with high PM2.5 concentrations had a significant impact on the economy, and that by 2030, China’s GDP losses would be 2% and the PM2.5 pollution associated medical expenses would be $25.2 billion. Khafaie et al 32 used research planning and key assessment methods to estimate the relationships between air pollution and health, Brook et al 33 found that PM2.5 contamination was the leading cause of global morbidity and mortality and a major cardiovascular risk factor, that the relative risk of cardiovascular mortality in Asia would increase by about 20% to 25%, and that arrhythmia and sudden cardiac death were related to PM2.5 pollution exposure. Cohen et al 34 used satellite estimation, chemical transport models, ground-level measurement models, and comprehensive exposure response function models to collect data from 1990 to 2015 and explore the mortality and diseases caused by air pollution at regional and national levels, finding that in 2015, PM2.5 exposure caused 42 million deaths, and that the global deaths from PM2.5 increased from 35 million in 1990 to 42 million in 2015. To investigate the mortality from NOx and black carbon (BC) exposure in Stockholm, Johansson et al 35 used a transport model and selected commuter preference data, and found that if the average population exposure to nitrogen oxides and black carbon (BC) were reduced by about 7% in the most densely populated areas of central Stockholm, the relative risk of mortality from NOx would reduce by 8%. Newell et al 36 explored the health effects of exposure to particulate air pollution and found that a 10 μg/m3 increase in PM2.5 increased cardiovascular mortality by 0.47% and respiratory mortality by 0.57%, and that an increase of 10μg/m3 in PM10 resulted in a 0.27% increase in cardiovascular mortality and a 0.56% increase in respiratory mortality. Kinney 37 reviewed the impact of climate change on air quality and human health, and concluded that the impact of the climate on ozone was most common in the north-central and northeastern states of the United States and could result in thousands of ozone-related deaths, and that the PM generated by wildfires was an increasingly serious health risk in many parts of the world. Zigler et al 38 used causal inference methods and a spatial hierarchical regression model to investigate the impact of substandard environmental air quality on PM2.5 and the national ambient air quality in 2005, finding that a reduction in PM2.5 and health insurance health outcomes could not be attributed to substandard areas in other parts of the eastern United States. Chen et al 39 explored the relationships between environmental air pollutants in primary schools and lung function in Chinese cities from 2014 to 2016, finding that short-term exposure to air pollution was associated with a decline in lung function in children and that girls had more adverse reactions than boys. Chen et al 40 analyzed 2532 third- to fifth-grade primary school students from 2 different air pollution exposed schools in Jinan, China, from 2014 to 2016, and found that higher air pollution exposure was associated with an increased prevalence for respiratory diseases in children, and especially allergic rhinitis. Lu et al 41 used PM2.5 data from a 1 km high-resolution annual satellite search to estimate the concentration of PM2.5 in China from 2001 to 2017 and its adverse health effects, concluding that urbanization caused an increase in PM2.5 concentrations and had a significant impact on mortality. Bayat et al 42 used an Environmental Benefits Mapping and Analysis Program (BenMAP-CE) to analyze the human health problems caused by exposure to air pollutants in 349 communities in Helan, Germany, and found that 7146 people in the community had died of ischemic heart diseases, strokes, lower respiratory tract infections, lung cancers, and chronic obstructive pulmonary diseases in 2017. Huang et al 43 explored the relationships between Beijing residents in China affected by PM2.5, finding that household income and education were negatively correlated with ambient air quality in 2014, and therefore Beijing residents with lower incomes and education levels had increased potential health risks.
The third main research direction had been on the impact of energy and environmental efficiency on air pollution emissions. Wang et al 44 used production-theoretical decomposition analysis (PDA) to explore China’s energy and emissions efficiencies from 2005 to 2010, finding that economic development was the main reason for the increased carbon dioxide emissions and that the carbon dioxide emissions and the pollution factors varied greatly across China. Yao et al 9 analyzed the carbon dioxide emissions efficiencies in China’s provincial industrial sectors from 1998 to 2011 using a meta-frontier nonradial Malmquist CO2 emissions performance index (MNMCPI) indicator and found that the annual average growth rate in carbon dioxide emissions in China’s provincial industrial sectors was 5.53%, the average carbon dioxide emissions from the industrial sectors in all regions showed a downward trend, the average annual energy efficiency growth rate was 2.297%, and the carbon dioxide emissions efficiency change (EC) in 21 provinces had an upward trend. Guo et al 45 used dynamic DEA models to evaluate energy and emissions efficiencies in OECD countries and China, finding that from 2000 to 2010, the average overall efficiency was 0.78, most countries had improved energy inventory adjustment rates, and 27 countries needed to increase their energy stocks to improve efficiency performances. Khoshroo et al 46 used a DEA model to evaluate farm emissions efficiencies in 30 turnip farms in Fars, Iran, and found that compared with other factors such as manpower, diesel, seeds, and fertilizers, machinery had the largest impact on total energy conservation. Chen et al 40 used a modified Undesirable Dynamic Network model to analyze China’s energy emissions, environment, health, and media dissemination efficiencies, finding that the production efficiency stage was better than the health treatment stage, and that Beijing, Guangzhou, Lhasa, and Nanning had high overall efficiencies.
Therefore, there have been 3 main research directions: examinations of economic, energy, and environmental efficiencies, analyses of the impact of energy and environmental efficiency on air pollution emissions with no consideration of the associated health issues, and discussions on health and environmental pollution with no consideration of the relationships between economic, energy, and environmental issues: studies in which have tended to employ static analyses. To go some way to filling this research gap, this article used a modified meta 2-stage EBM Malmquist model to dynamically examine the efficiency relationships between health, the economy, energy use, media, and environmental pollution in 31 different Chinese cities from 2014 to 2016.
Methods
Charnes et al 47 first proposed a CCR DEA model based on constant returns to scale assumptions, which Banker et al 48 subsequently extended to returns to scale to establish the BCC model, which was able to measure both Technical Efficiency (TE) and Scale Efficiency (SE). However, as both the CCR and BCC were radial DEA models, they ignored the nonradial slacks when evaluating the efficiency values. Therefore, Tone 49 developed the Slacks-Based Measure (SBM) that considered the input and output slacks using nonradial estimation and a single scalar value. However, the SBM DEA ignored the radial slacks when evaluating the efficiency values; therefore, to address these radial and nonradial mode shortcomings, Tone and Tsutsui 50 developed the input-oriented, output-oriented, and nonoriented EBM (Epsilou-Based Measure) DEA model.
In traditional DEA efficiency evaluations, the efficiency conversion between two variables is conducted using input and outputs, with the conversion being seen as a “black box,” which Zhu 51 claimed contained some subprocesses that constituted a value chain system. Consequently, Färe et al 52 proposed Network Data Envelopment Analysis, in which the production process was seen as being composed of many subproduction technologies, with each subproduction technology being regarded as a subdecision unit (sub-Decision Making Unit [DMU]), and with the optimal solution being obtained using traditional CCR and BCC models and by estimating the system efficiency of each individual subprocess. Therefore, to estimate the efficiency of a system, it is necessary to evaluate the efficiency of each subprocess. For example, Chen and Zhu, 53 Kao and Hwang, 54 and Kao 55 divided the business process into subprocesses and linked the stages through some intermediate outputs, after which they calculated the efficiency in each stage under different conditions to determine which subprocess was causing the efficiency losses in the system. After Fare, in 2009, Tone and Tsutsui 56 proposed a weighted slack-based measures network DEA model, which used the links between the various DMUs as the basis for the network DEA model analysis, treated each department as a sub-DMU, and then used the SBM mode to determine the optimal solution, and Castelli et al 57 provided a comprehensive taxonomic review of the models and methods developed for different multistage production structures. Although research has focused on evaluating 2-stage process efficiencies, 2-stage DEA also allows for a dynamic approach, in which the DMUs are evaluated in different time periods and carryovers are introduced to connect the DMUs over time. 58 Tone and Tsutsui 56 proposed the following slacks-based network nonoriented DEA model:
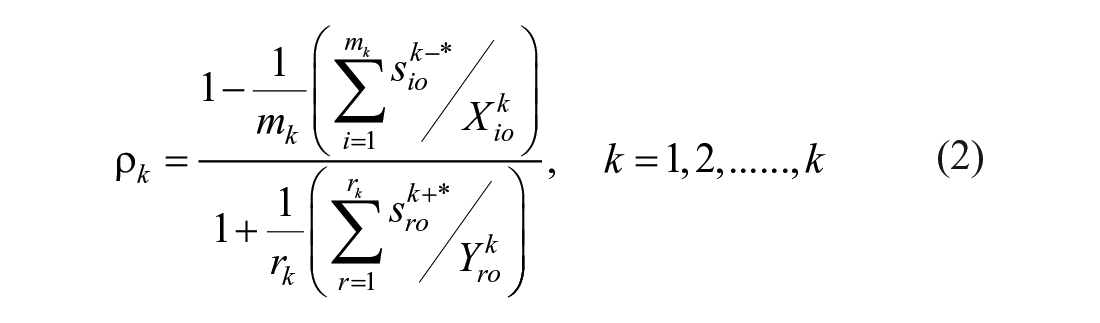
If the input slacks and output slacks are considered at the same time, then nonoriented efficiency can be evaluated using Equation 1:


Based on Equation 1, the definition for the nonoriented DMU efficiency can be expressed as
where
The relationship between Stage 1 and Stage 2 input and output items are shown in Figure 1.

Input-output relationship.
Dynamic analyses have also been widely discussed, with the main dynamic analysis being the Malmquist Productivity Index (MPI), which is a measure of the change in total factor productivity over time, which allows for the stability of each DMU to be judged and the DMU efficiency trends to be observed. The MPI is based mainly on Färe et al 59 where DEA is first used to estimate the distance function, after which the Malmquist total factor productivity change index is calculated and the Malmquist total factor productivity change index decomposed into a technical efficiency change, which is also known as the catch-up effect, with the technological change known as the frontier-shift effect. The change in technical efficiency is the degree to which each DMU is supported to achieve the efficiency goal, and the technological change is the calculation of the efficiency frontier variations in the DMU in different time periods.
However, while the EBM DEA can solve radial and nonradial problems, it fails to deal with the 2-stage problem, and while the Network DEA model can solve multistage problems, it fails to deal with radial and nonradial problems. As different countries have different social and cultural backgrounds, economic environments, management models, production structures and efficiencies, manufacturers in different countries have different production technologies. Therefore, if a traditional DEA, which assumes the same technical level for all DMUs, is used for efficiency estimations, it may not be accurate. Furthermore, as understanding the efficiency trends in different regions over time is also necessary, this article combined the Färe et al 59 meta-frontier model, the Malmquist Productivity Index, and the 2-stage modified EBM DEA model of O’Donnell et al 60 and Tone and Tsutsui50,56 to propose a modified meta 2-stage EBM Malmquist model.
Modified Meta 2-Stage EBM Malmquist Model
This study collected data from 31 cities in China. The first stage had labor, fixed assets, and energy consumption as the inputs, GDP as the output, and CO2 and AQI as the stage links, and the second stage had health expenditure and media reports as the inputs and birth rate and respiratory diseases as the outputs. As this dynamic study considered poor output, a second stage and different production techniques, Tone and Tsutsui’s 50 EBM model was modified as a modified meta 2-stage EBM Malmquist model, the description for which is given in the following.
Modified meta 2-stage EBM
Traditional DEA efficiency evaluations usually assume that all producers have the same production technology level; however, in reality, DMUs often have different production technologies because of different geographical locations, national policies, and social and economic conditions. Battese and Rao 61 and Battese et al 62 proposed a meta-frontier model that was able to compare the technical efficiencies of different groups, which was improved by O’Donnell et al 60 to accurately calculate the group and common technical efficiency values and the MTR
There are
Due to differences in management, resources, regulations, and environments, all firms (

Subject to


Y: DMU output; X: DMU input;
If
From the above equations, the overall technological efficiency in all cities can be determined under the meta-frontier. Using Equation 2, the overall technological efficiencies of all cities can be determined under the meta-frontier.
Undesirable EBM 2-stage group frontier model
The western and eastern Chinese cities are divided into g DMUs, each of which is assigned an optimal output weight; therefore, the efficiency of the DMU under the group frontier can be solved using the following equations.

Subject to


Technology gap ratio
The production frontier of the g groups are included in the meta-frontier. The technical efficiency under the meta-frontier must be less than the technical efficiency under the group frontier, with the ratio of the two frontiers being the Technology Gap Ratio (TGR):

Modified Meta 2-Stage EBM Malmquist Model
This article examined the technical efficiency changes and technological changes in 31 Chinese cities from 2014 to 2016, for which the meta-frontier model proposed by O’Donnell et al 60 was used to accurately calculate the group efficiencies, and the Rambaldi et al 63 Meta-MPI employed to assess the production and health stage efficiencies and the MTRs.
The MPI was used to measure total factor productivity in different periods to judge the efficiency stability and to observe the efficiency trends in the unit under evaluation. The MPI has been mainly influenced by Färe et al, 59 who used DEA to estimate distance functions, after which the Malmquist total factor productivity change index was calculated and the Malmquist’s total factor productivity change index decomposed into a technical efficiency and technological changes. When examining regional differences, the Malmquist Productivity Index can be converted into a Meta-Malmquist, which can be divided into a Group Specific Technology Malmquist Productivity Index (GMPI) and a Meta Technology Malmquist Productivity Index (MMPI).
The GMPI in k division’s input and output set for period t and period t + 1 are

The MMPI is defined by Equation 7:


As can be seen in Figure 2, in period t, the individual group frontier is
In period t,

In period t+1,

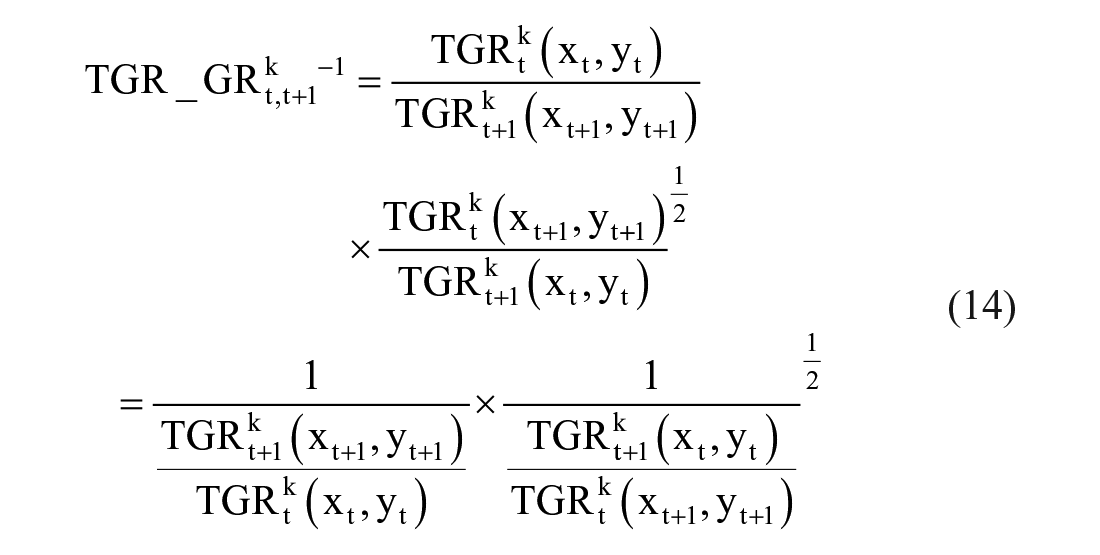
The technology growth rate (TGR) of k group in 2 periods are

Technology efficiency change (


Technology growth rate:

This is then converted into a distance function decomposition

Meta-Malmquist Productivity Index model.
a. Technological efficiency change decomposition

from which Equation 8 is obtained:


based on the TEC

from which Equation 9 is obtained:

b. Technological change
The technological change is as shown in Equation 10:

Putting Equations 9 and 10 together,
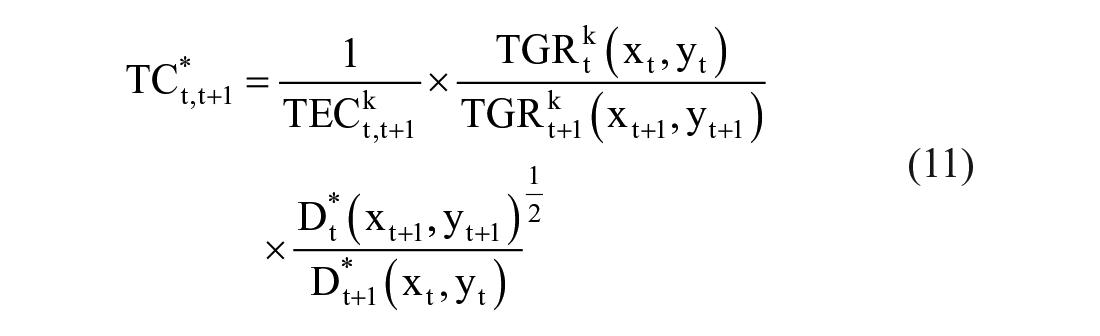
and putting Equations 10 and 11 together,

which are then summed to get Equation 11:


Empirical Analysis
Data Sources and Description
Thirty-one cities in mainland China were selected as the research sample, which were divided into eastern cities (Beijing, Shanghai, Shijiazhuang, Tianjin, Fuzhou, Guangzhou, Haikou, Hangzhou, Jinan, Nanjing), northeast cities (Changchun, Shenyang, Harbin), western cities (Chengdu, Chongqing, Guiyang, Huhehot, Kunming, Lanzhou, Lhasa, Nanning, Urumqi, Xian, Xining, Yinchuan), and central cities (Changsha, Hefei, Taiyuan, Wuhan, Zhengzhou Nanchang).
There are 661 cities at or above county level in the 31 administrative regions in mainland China. Because of the size of mainland China, there are significant regional economic development, population density, geographical, historical, and cultural differences. The capital cities in each province/municipality/autonomous region have the most resources, the best talents, and the most advanced management and technical levels.
Data for mainland China’s GDP in 2018 64 indicated that 32% of the national GDP in 2018 came from all 31 provincial capitals mentioned above. The GDP in 28 cities exceeded 700 billion CNY, 16 cities exceeded 1 trillion CNY, and 5 cities exceeded 2 trillion CNY, with the combined GDP of 16 cities, most of which were provincial capitals, accounting for 31% of the national GDP. The data showed that the GDP in the 18 cities in the midwest was far ahead of the other cities in the province/autonomous region. Due to the backwardness of the central and western regions relative to the developed coastal regions, most regional economic development of the central and western regions in mainland China before the late industrialization period was in the provincial capitals, which drove the development of the surrounding regions. These provincial capitals or municipalities, such as Chengdu, Chongqing, Lhasa, Xi’an, Lanzhou, Xining, and Urumqi, have the best R&D, higher education, and finance resources in each respective province. The central provincial capital also plays an important leading role in surrounding cities.
These 31 sample cities also have the highest population densities, human resources, and education levels in the country, with the total population in all 31 cities accounting for 18% of the total population in all 661 cities above the county level in 2018. Five cities with total populations of more than 10 million people—Beijing, Shanghai, Tianjin, Chongqing, and Chengdu—are all sample cities. The populations in Shijiazhuang and Xi’an at the end of 2018 were also around 9.8 million. 64
Finally, as the technical characteristics, administrative functions, economic statuses, social and cultural levels, public management levels, resource utilization, and talent accumulation were similarly high, they had better comparability.
This study used panel data for 31 Chinese cities. Economic and social development data from 2013 to 2016 were collected from the Statistical Yearbooks of China, the Demographics and Employment Statistical Yearbooks of China, and the City Statistical Yearbooks, and air pollutant data were collected from the China Environmental and Protection Bureau Annual Reports and the China Environ-mental Statistical Yearbook.
Figure 3 shows the framework and the variables for the 2-stage meta dynamic Malmquist model for the efficiency measurements.

Framework model.
Based on the inputs and outputs used in past literature, the inputs were labor and energy consumption as in Du et al, 11 Hu and Wang, 65 and Wu et al 6 ; desirable output GDP as in Yang and Wei 20 ; fixed assets as the carryover as in Wang et al 44 ; air, CO2, and AQI links as in Li et al 18 ; and second-stage media reports and health expenditure inputs, desirable birth rate output and undesirable respiratory disease output as in Tian et al. 21 The variables used in the study are explained in the following:
First stage: production stage
Input variables
Labor input: Employees; this study used the number of employed people in each city at the end of each year; unit: person.
Energy consumption was calculated from the total energy consumption in each city; unit: 100 million Dun.
Fixed assets: the capital stock in each city was calculated using the fixed assets investment in each city: unit: 100 million CNY.
Output variables
Desirable output (GDP): the GDP in each city was used as each city’s output: unit: 100 million CNY.
Link production stage and health stage variables
Carbon dioxide: CO2, a common greenhouse gas.
AQI: the Air Quality Index, which measures the pollutant concentrations for PM2.5, PM10,sulfur dioxide (SO2), and nitrogen.
Second stage: Health treatment stage
Input variables
Health expenditure: government investment on the treatment and management of health issues; unit: CNY
Media reports: related air pollution news data were collected from the Xinhuanet media official website using the search string “province + air pollution.” Statistics were calculated in units (years), with the number of statistics being the total amount in the year. The official news websites were selected because of the quantity of news published and their wide influence: unit: piece
Output variables
Overall Technology Gap Ratio Analysis
Table 1 and Figure 4 show the TGRs for the 31 provincial capitals from 2014 to 2016. The technology frontiers in each year in Haikou and Lhasa were 1, indicating that there was no technology gap. As Haikou and Lhasa are relatively underdeveloped regions, there have fewer air pollutants generated by industrial emissions. Therefore, whether in the production or the health treatment stage, the annual efficiencies and technology gaps between the 2 cities were 1.
Technology Gap Ratio From 2014 to 2016.

Note. TGR = technology gap ratio trend.
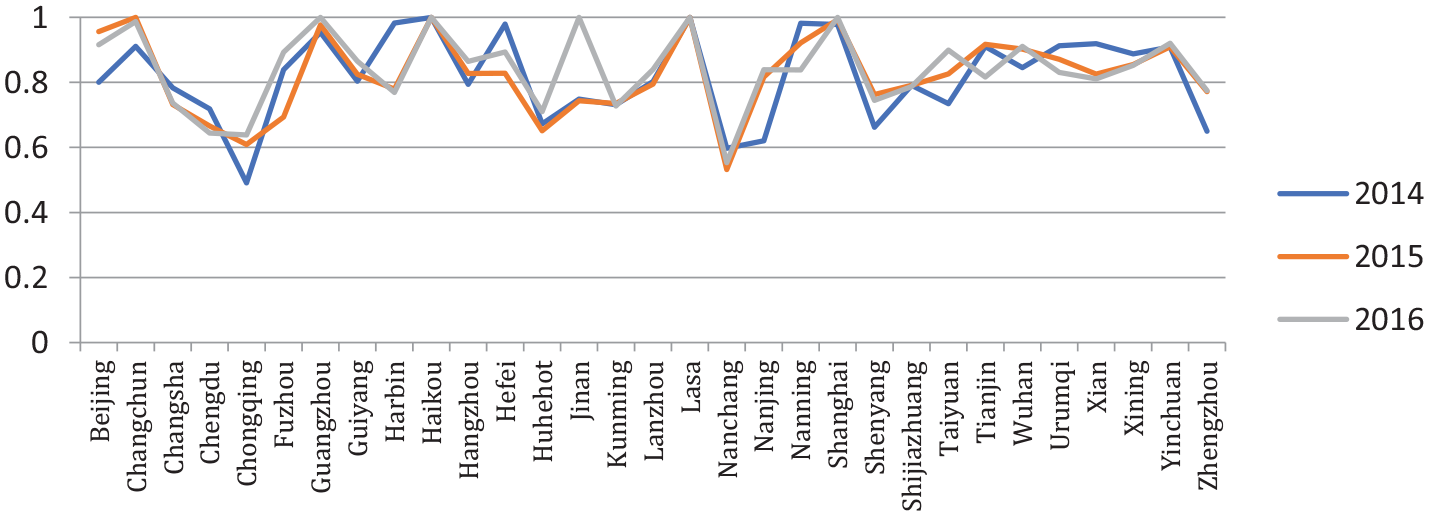
The 2014-2016 technology gap ratio trends (TGRs) for each city.
The annual technology gap ratios in Changchun, Guangzhou, Shanghai, Yinchuan, Guiyang, Hangzhou, Lanzhou, Tianjin, Wuhan, Urumqi, Xi’an, Xining, Beijing, Hefei, and Nanning were between 0.80 and 1, and in Changchun, Guangzhou, Shanghai, and Yinchuan were between 0.90 and 1. Eight other cities had technical boundary values between 0.80 and 0.90; those in Changsha, Kunming, Shijiazhuang, Chengdu, Hohhot, Zhengzhou, and Shenyang were between 0.60 and 0.80, and Nanchang’s was below 0.6.
Six cities had large changes in their technology frontiers over the 3 years; for example, Jinan’s moved from 0.7 to 1, and Nanjing’s rose from 0.6 to 0.8. As there were more cities with technology frontiers above 0.8, it was concluded that in general the technology gaps were small; however, a small number of cities had urban technology frontiers below 0.6, indicating that there were some large technology gaps.
Ten cities had rising technology frontier values; for example, Nanjing had the largest increase from 0.62 in 2014 to 0.84 in 2016; the technology frontier values in 6 cities rose and then fell, and in 7 cities fell and then rose; however, Harbin had the most significant drop from 0.98 in 2014 to 0.77 in 2016.
The technology frontier values in Chengdu, Hohhot, Chongqing, and Nanchang in the western regions of China were all below 0.70, and besides Lhasa, all cities with a technology frontier value of 0.90 such as Haikou, Guangzhou and Shanghai were located in the eastern part of China, indicating that there was a technology frontier gap between the eastern and western regions.
Annual Efficiencies
Table 2 shows the annual efficiencies for the 31 cities from 2014 to 2016. Haikou and Lhasa had annual efficiencies of 1, and had no need for further improvements, and Guangzhou and Shanghai had efficiencies between 0.80 and 1, and therefore had only a small need for improvements. However, Changsha had an annual efficiency between 0.70 and 0.80, Hohhot and Yinchuan had annual efficiencies between 0.60 and 0.70, Hangzhou and Nanchang had annual efficiencies between 0.40 to 0.60, and Shijiazhuang had an annual efficiency below 0.40; therefore, in many cities, significant improvements were needed. In 21 cities, however, the annual efficiencies changed significantly over the 3 years; for example, Jinan’s rose from 0.50 to 1, and Shenyang’s rose from 0.40 to 0.80; however, in general, there were more cities with annual efficiencies below 0.60.
Annual Efficiencies From 2014-2016.

From the average overall efficiency scores and rankings in Table 2, the average annual overall efficiency scores in most eastern coastal areas were found to be better than those in the western and central regions. Of the top 10 cities, 4 were east coast cities, 4 were from the western region, and 1 city was from the central region. Of the bottom 10 cities, 6 were from the western region, 2 were from the east coast (Shijiazhuang and Tianjin), 1 was from the central region, and 1 was from the northeast region. The efficiencies varied significantly between the western region cities. Of the 12 cities in the west, except for Lhasa (ranked 1), Urumqi (ranked 5), Hohhot (9), Nanning (7), and Yinchuan (11), the other 7 cities ranked lower than 20.
The average total efficiencies in 7 cities were lower than 0.5, 5 of which were western cities: Chengdu, Chongqing, Guiyang, Kunming, and Xi’an; therefore, these cities still have a significant need for improvements.
Production Stage and Health Treatment Stage TGR
Table 3 shows the production stage and health treatment stage technology gap ratios for the 31 provincial capital cities from 2014 to 2015. Except for the technology gap in the production stage and the treatment stage in Lhasa, which were both 1, the technology gap in the production stage and the treatment stage in the other cities was different.
Production Stage and Health Treatment Stage TGR.

Note. TGR = technology gap ratio trend.
Production stage
The TGRs varied across the 31 cities. Guangzhou, Haikou, and Lhasa’s TGRs were 1, and Beijing and Shanghai’s were close to 1. As the economic growth in Haikou and Lhasa is related mainly to the tourism and service industries, they have low industrial development and low industrial air emissions; therefore, in both the production and health treatment stages, the annual efficiencies and technology gaps were 1; however, the other cities had a greater need for improvements.
The annual TGRs in Changchun, Hangzhou, Jinan, Nanning, Shenyang, Tianjin, Wuhan, and Zhengzhou were between 0.80 and 1; in Changsha, Guiyang, Hohhot, Lanzhou, Nanchang, Shijiazhuang, Taiyuan, Urumqi, Xining, and Yinchuan were between 0.60 and 0.80; and in Chengdu, Chongqing, and Kunming’s were below 0.6. Eight cities had rising TGRs, with Taiyuan’s increasing from 0.60 in 2014 to 0.76 in 2016, but the TGRs in 4 cities declined, with the largest fall being in Harbin, which fell from 0.94 in 2014 to 0.65 in 2016. Fourteen cities had fluctuating TGRs, with 4 cities rising and then falling, and 10 cities falling and then rising.
Health treatment stage
The annual health treatment TGRs in Guiyang, Haikou, Lanzhou, Lhasa, Shijiazhuang, Xining, and Yinchuan were 1 and Changchun’s was close to 1, the TGRs in Guangzhou, Hefei, Kunming, Shanghai, Taiyuan, and Xi’an were between 0.90 and 1, and in Fuzhou, Harbin, Wuhan, Urumqi, and Zhengzhou were between 0.80 and 0.90. The annual TGRs in Changsha and Hangzhou were between 0.60 and 0.80 and in Hohhot, Nanchang and Shenyang were below 0.6, with Nanchang’s being the lowest over the 3 years at only 0.45. Seven cities had large TGR fluctuations; for example, Jinan and Tianjin had change ranges of around 0.36.
Seven cities had rising health treatment stage TGRs, with Jinan’s rise from 0.64 in 2014 to 1 in 2016 being the largest, and 5 cities had declining TGRs, with Tianjin’s being the largest dropping from 0.93 in 2014 to 0.57 in 2016. Eleven cities had fluctuating TGRs; 4 rose then fell and 7 fell then rose.
The TGRs in most cities in both the production and the health treatment stages fell then rose over the 3 years; however, Shenyang and Taiyuan had continuous upward trends in both stages, and Xi’an had a continuous decline. Overall, more cities had TGRs over 0.8 in the health treatment stage than in the production stage.
No differences in the average technology gaps in the production and the health treatment stages were found in Changchun, Changsha, Guangzhou, Wuhan, and Shanghai, with the average TGRs in these 5 cities being close to 1, which indicated that only small improvements were necessary.
Beijing, Hangzhou, Hohhot, Jinan, Nanchang, Nanjing, Nanning, Shenyang, Tianjin, and Zhengzhou had higher TGRs in the production stage than in the health treatment stage. Five of these cities are located on the east coast, 2 are located in the west and 2 are located in the central region. Therefore, greater priority needs to be focused on TGR improvements in the second stage.
Chengdu, Chongqing, Fuzhou, Guiyang, Harbin, Hefei, Kunming, Lanzhou, Shijiazhuang, Taiyuan, Urumqi, Xi’an, Xining, Yinchuan had higher average TGRs in the health treatment stage than in the production stage. Nine of these cities are in west, 2 are eastern coastal cities in the east, and 1 was from the northeast. Therefore, greater priority needs to be focused on TGR improvements in the first production stage.
Production and the Health Treatment Stage Efficiencies
Table 4 shows the annual production and health treatment stage efficiencies in the 31 provincial capital cities from 2014 to 2016. Due to better air management, less air pollutant emissions, and good weather conditions, Haikou and Lhasa had low pollutant discharges and the average efficiency scores in both the production and health treatment stages were 1; however, the average 2-stage efficiencies in the other cities varied considerably.
The 2014 to 2016 Production and Health Treatment Stage Efficiencies.

Production stage
The annual production stage efficiencies in Haikou and Lhasa were 1 in all years, indicating that there was no need for further improvements, in Beijing, Guangzhou, Nanning, and Shanghai were between 0.8 and 1; in Hangzhou, Huhehot, Nanjing, Tianjin, Urumqi, Changsha, Nanchang, Wuhan, Harbin, and Zhengzhou were between 0.6 and 0.8; and in Chengdu, Xi’an, Yinchuan, Chongqing, Kunming, Lanzhou, Xining, Guiyang, Taiyuan, and Shijiazhuang were below 0.6, with Shijiazhuang’s being the lowest at only 0.3. In 5 cities, the efficiencies changed significantly over the 3 years, with the changes in Shenyang being the largest at 0.48. Eleven cities had increasing efficiencies, with Shenyang having the largest increase from 0.52 in 2014 to 1 in 2016; however, Yinchuan’s efficiency was in decline. Seventeen cities had fluctuating production stage efficiencies, which first declined and then rose.
Health treatment stage
Haikou and Lhasa had health treatment stage efficiencies of 1; Shanghai, Yinchuan, and Fuzhou’s ranged from 0.8 to 1; and Xining and Changsha’s ranged from 0.6 to 0.8; however Beijing, Changchun, Chengdu, Guiyang, Harbin, Hangzhou, Huhehot, Kunming, Nanchang, Nanjing, Shenyang, Shijiazhuang, Taiyuan, Tianjin, Wuhan, Xi’an, and Zhengzhou had health treatment stage efficiencies below 0.6, with those in Chengdu and Tianjin being only between 0.2 and 0.3 in all 3 years and those in some years in Beijing and Harbin being only 0.20. Seven cities had large health treatment stage efficiency fluctuations, with Hefei’s changing by 0.68 and Jinan and Chongqing’s changing by 0.59 and 0.43. Six cities had increasing health treatment stage efficiencies with Hefei’s being the largest, rising from 0.32 in 2014 to 1 in 2016. Four cities had declining health treatment efficiencies and 19 first declined then rose.
The production and health treatment stage efficiencies in many cities, such as Beijing, Chengdu, Chongqing, Fuzhou, Harbin, Lanzhou, Nanchang, Shanghai, Urumqi, and Xi’an, first declined and then rose over the 3 years; however, in both stages, Guiyang had a continuous upward trend. In general, the production stage efficiencies were higher than the health treatment stage efficiencies, with more cities having health treatment stage efficiencies below 0.6. However, both Haikou and Lhasa had production and health treatment stage efficiencies of 1 in all 3 years. The production stage efficiency changes in Kunming and Shenyang were greater than 0.30, and the maximum fluctuation range was 0.48, and the health treatment stage efficiency changes in Hefei, Jinan, Chongqing, and Shenyang were also more than 0.3, with the maximum change range being 0.68.
Except for Haikou and Lhasa, of the other 29 cities, 20 cities had significantly higher average production stage efficiencies than average health treatment stage efficiencies, indicating that significant improvements were needed in urban health treatment efficiency. In Changsha, Fuzhou, Guiyang, Kunming, Lanzhou, Shijiazhuang, Urumqi, Xining, and Yinchuan, the average health treatment efficiencies were significantly higher than the average production stage efficiencies, and except for the eastern cities of Fuzhou and Shijiazhuang and the central city of Changsha, the other 6 cities were all from western China; therefore, these cities all need to give priority to production stage efficiency improvements.
MI (Malmquist Index), EC (Efficiency Change), TC (Technological Change)
Table 5 shows the MI, EC, and TC in the 31 provincial capital cities from 2014 to 2016, and Table 6 shows the impact of the productivity progress, efficiency changes, and technological changes.
The 2014 to 2016 Annual MI, EC, and TC.

Note. MI = Malmquist Index; EC = Efficiency Change; TC = Technological Change.
Impact of EC and TC on MI in Each Year of 2014 to 2016.

Note. MI = Malmquist Index; EC = Efficiency Change; TC = Technological Change.
In 2014, 10 cities had declining productivity due to efficiency declines, and 20 cities had productivity improvements, 10 because of the joint influence of technological and efficiency changes, 9 due to technological changes, and 1, Haikou, because of efficiency improvements.
In 2015, 15 cities had declining productivity due to efficiency declines and 14 had productivity improvements; 7 cities because of the joint influence of technological and efficiency changes and 7 cities because of technological changes.
In 2016, 3 cities had declining productivity; Yinchuan because of a decline in efficiency, Lhasa because of a decline in technology, and Shijiazhuang because of both technology and efficiency declines; however, 36 cities had productivity improvements, all of which were due to efficiency improvements.
Most cities in 2014 and 2016 had productivity improvements. In 2014, productivity improvements were due to an efficiency change in only 1 city, but in 2016, the productivity improvements in 26 cities were because of efficiency improvements. In 2015, there were both productivity improvements and declines, with the declines being because of efficiency declines, and the productivity improvements being because of the joint influence of technological and efficiency changes.
Both Lhasa and Haikou experienced only minimal changes in their respective Malmquist indices, efficiency change indices, and technological change indices. Yinchuan had a productivity decline for 3 consecutive years due to efficiency declines, and there were also productivity declines in Harbin, Lanzhou, and Urumqi; however, the indices in Changchun, Chongqing, Guiyang, Jinan, Nanchang, Chengdu, Fuzhou, Kunming, and Shanghai improved in all 3 years.
MI, EC, and TC
Table 7 shows the MI, EC, and TC for the production and health treatment stages from 2014 to 2016, from which it can be seen that the productivity change fluctuations in the production stage were smaller than in the health treatment stage. Except for Urumqi and Yinchuan, the production stage productivity index in most regions was greater than 1 in all 3 years, which indicated that the urban productivity growth was improving. The productivity indices in Hohhot, Lanzhou, Lhasa, Taiyuan, Wuhan, and Xining were below 1 for 2 years, indicating declining productivity growth; however, in 2016, they all rose to 1. Lanzhou, Nanning, Taiyuan, Wuhan, and Xining had productivity declines in 2014, but all exceeded 1 in the following 2 years, indicating productivity growth. The biggest increase in productivity was in Jinan, which had a significant increase in 2016, followed by Shenyang, which continued to rise from 1 in 2014 to 1.6 in 2016.
Production and Health Stages MI, EC, and TC From 2014-2016.
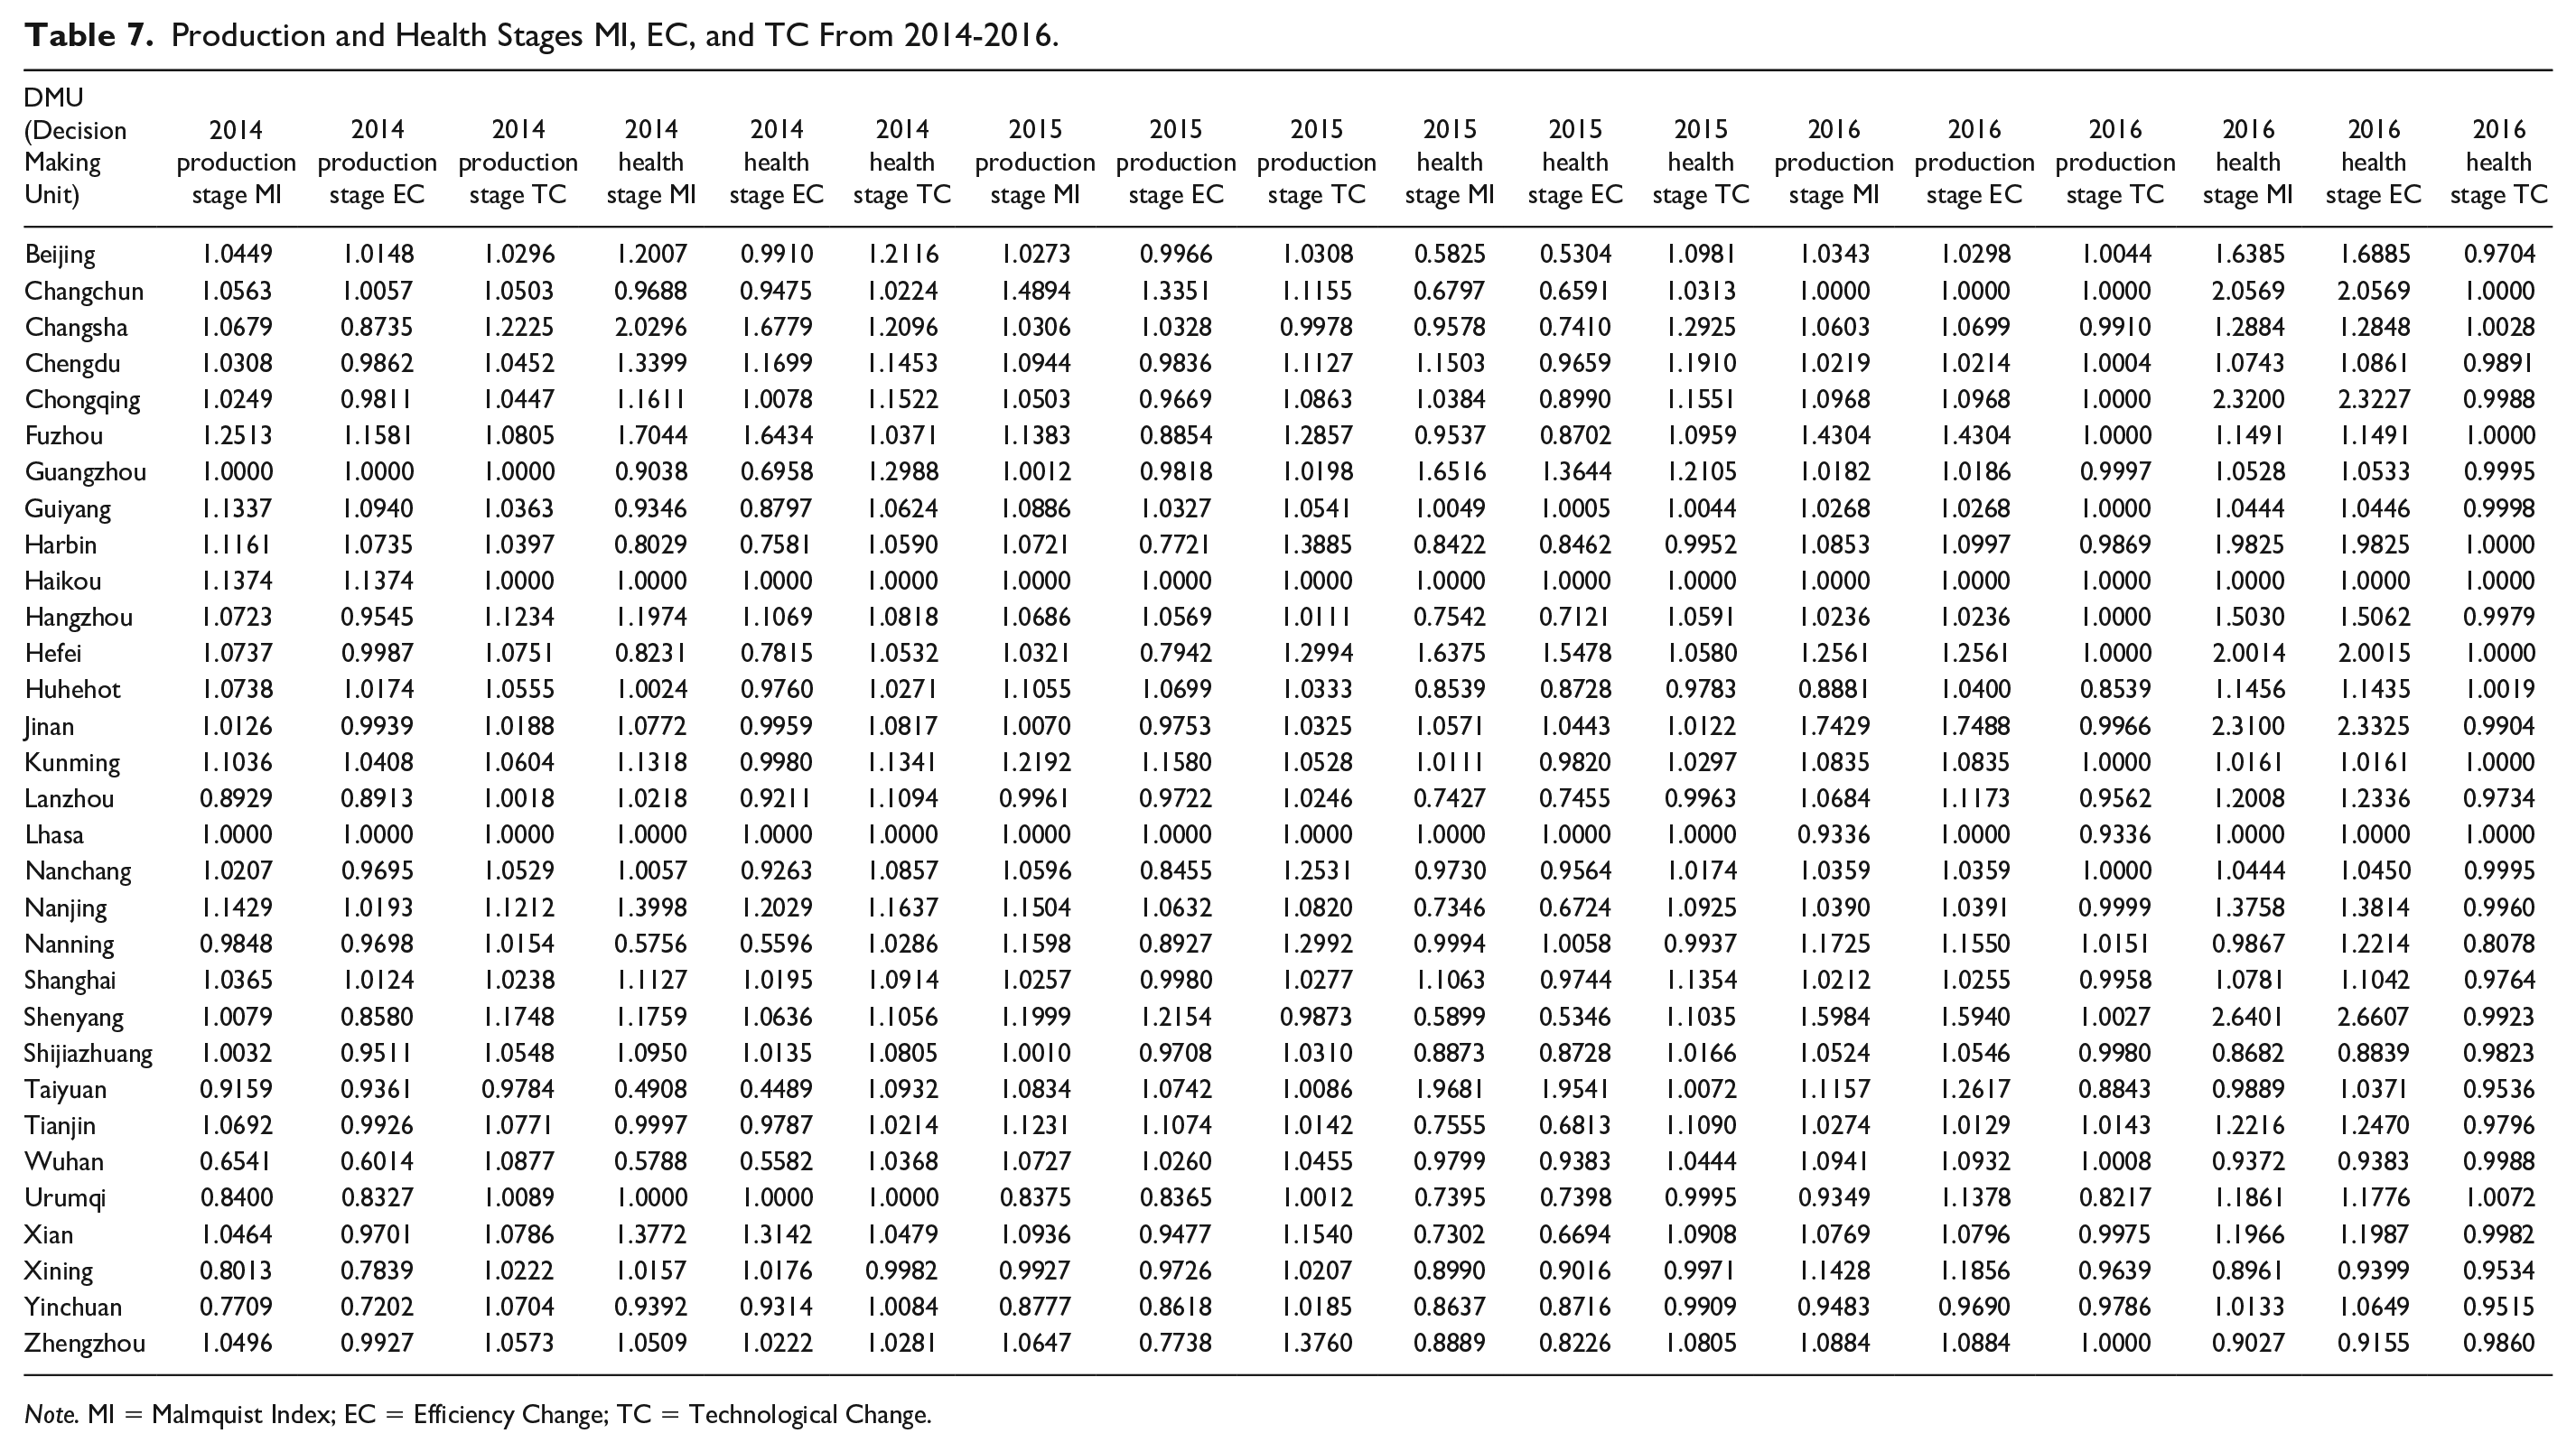
Note. MI = Malmquist Index; EC = Efficiency Change; TC = Technological Change.
The city productivity growth in health treatment stage varied significantly, with the productivity growth index exceeding 1 in very few cities. Only Chengdu, Haikou, Jinan, Lhasa, and Shanghai experienced productivity growth in the 3-year health treatment stage. The health treatment stage productivity indices for Beijing, Changsha, Fuzhou, Hangzhou, Hohhot, Lanzhou, Nanchang, Nanjing, Shenyang, Tianjin, Urumqi, and Xi’an in 2015 were less than 1, but in 2016, the health treatment stage productivity indices in Beijing, Changchun, Chongqing, Harbin, Hangzhou, Hefei, Jinan, Nanjing, and Shenyang increased significantly with Shenyang having the largest increase; therefore, there was significant growth in the health treatment stage.
Guiyang, Harbin, and Hefei had sustained productivity growth in the health treatment stage, with Guiyang’s productivity index in the last 2 years being greater than 1. The productivity indices continued to fall in Chengdu, Kunming, and Shanghai, but as the productivity indices were all greater than 1, in general, the productivity in these cities improved in the 3 years. The productivity indices in the health treatment stage indicated that some cities in the central, western, and eastern regions needed to increase their health treatment productivity.
Table 8 shows the impacts of the productivity changes, efficiency changes, and technology changes in the production and health treatment stages.
Impact of EC and TC on MI at Various Stages From 2014-2016.
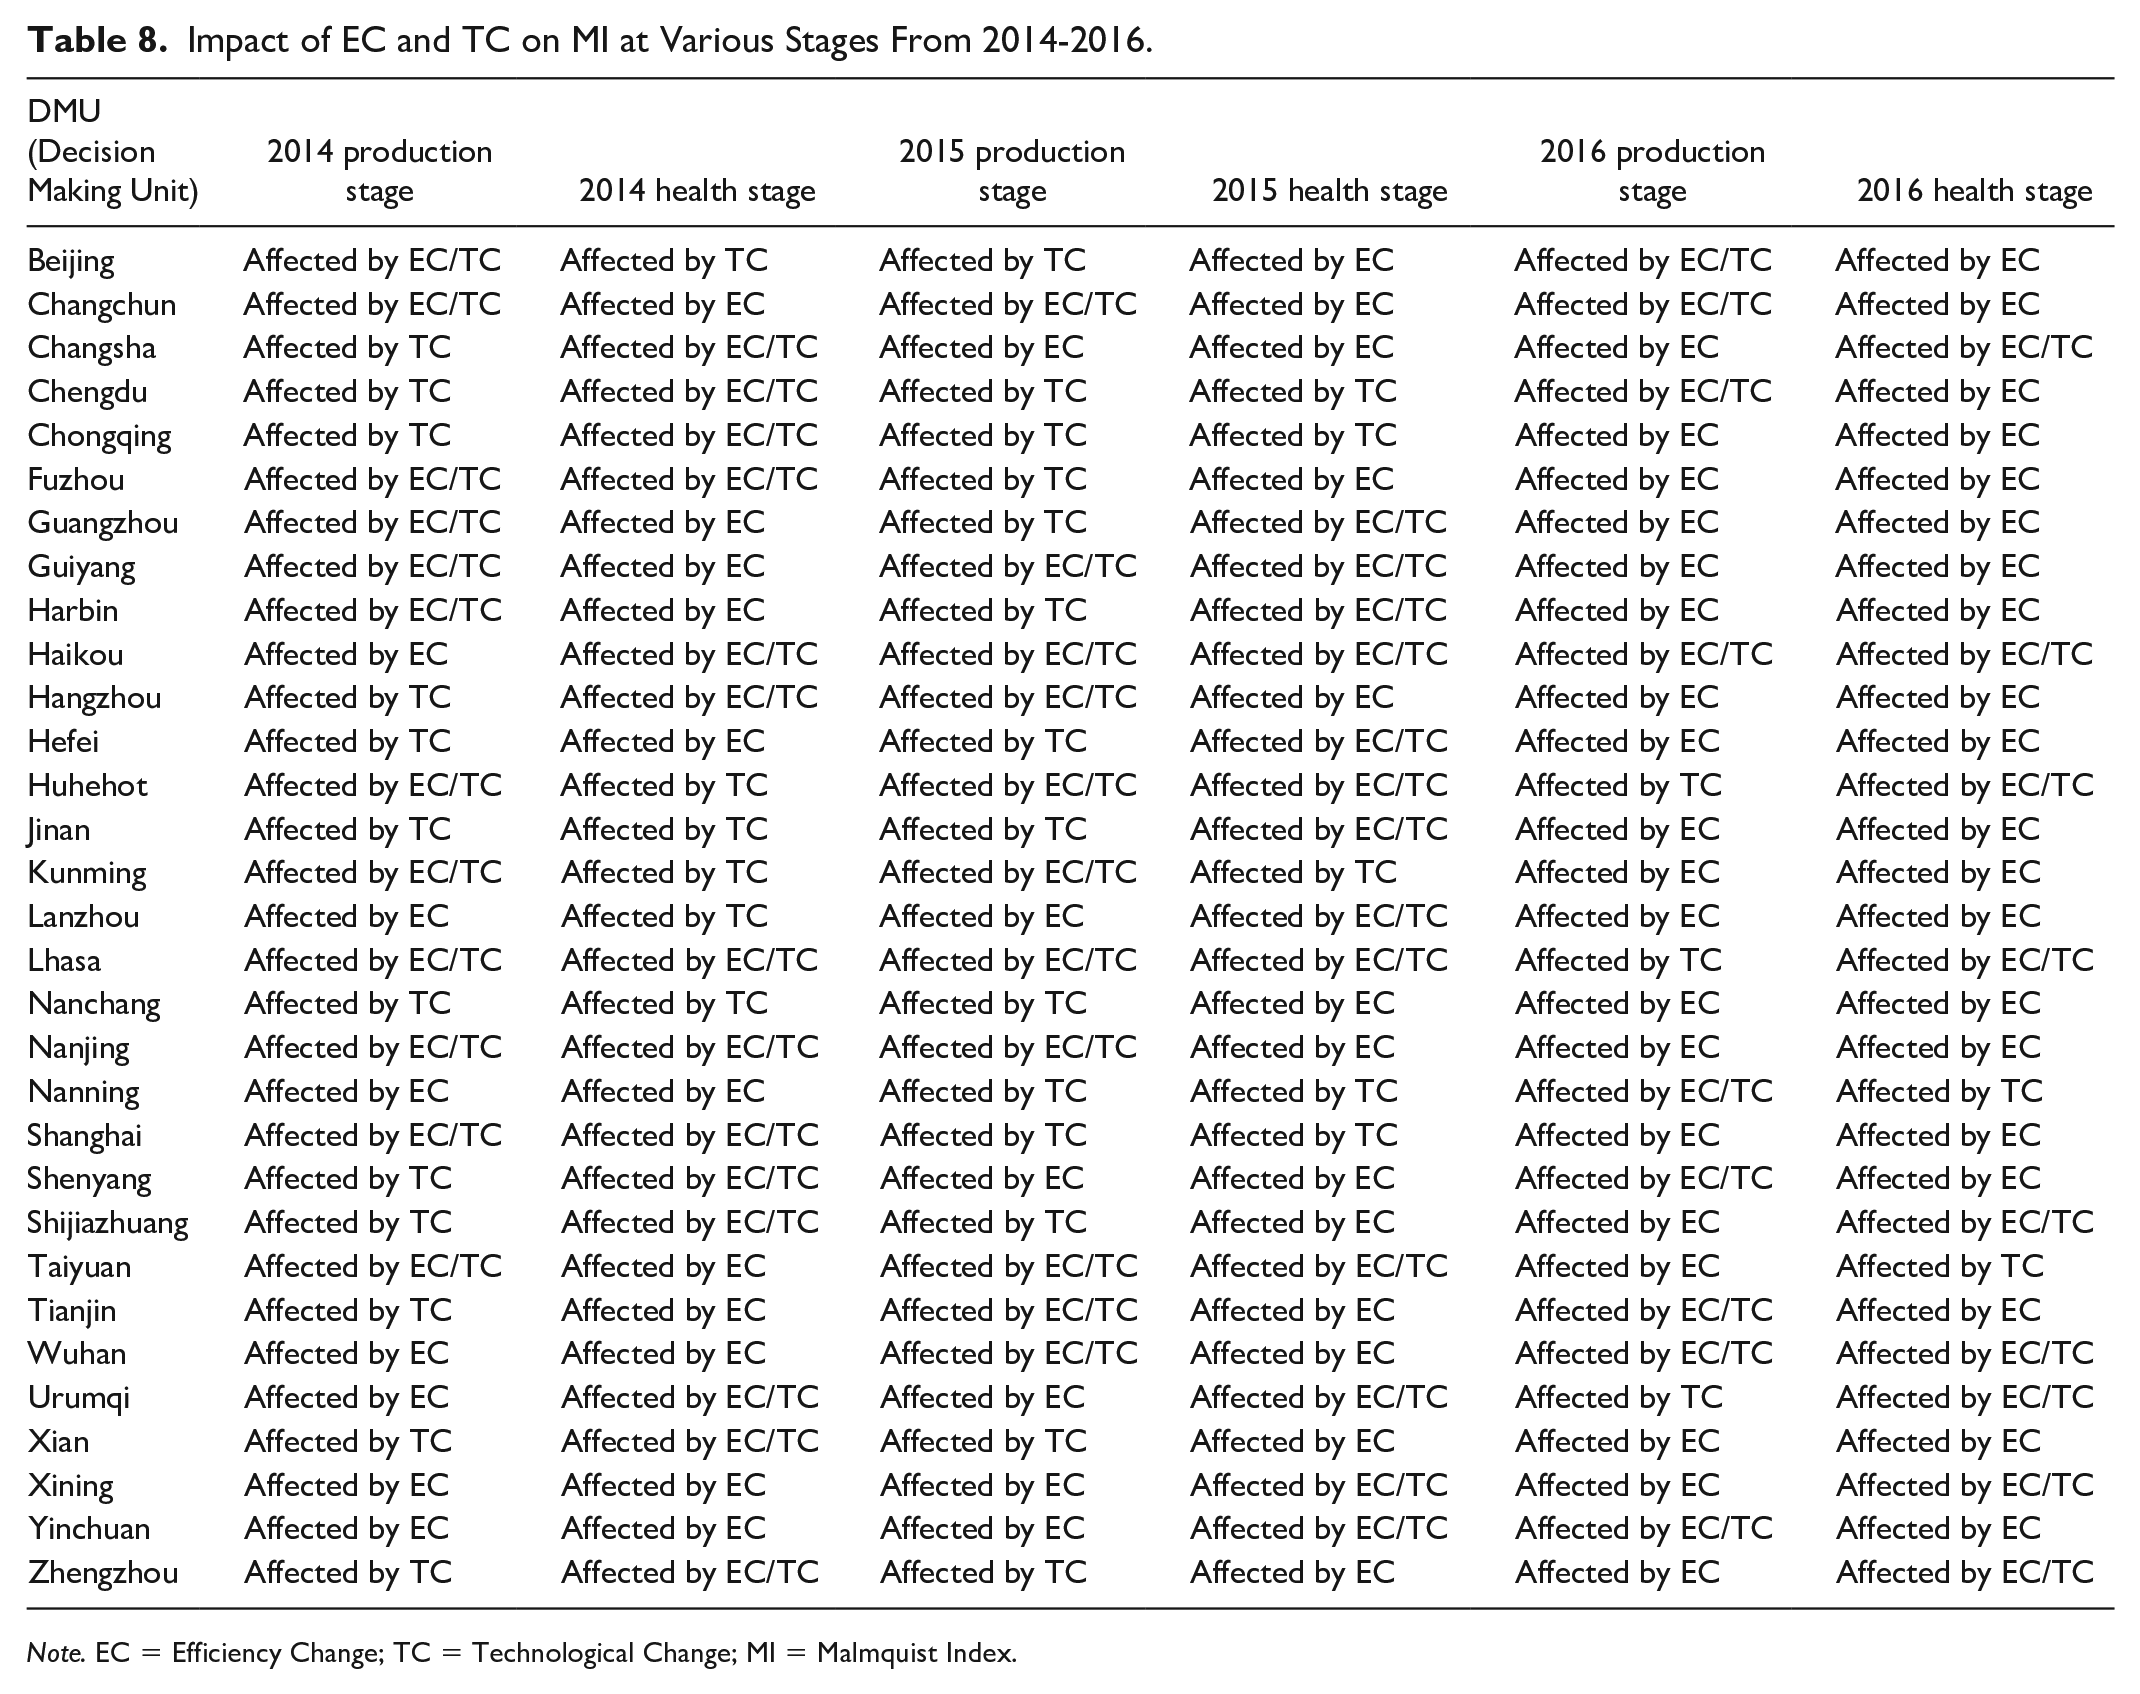
Note. EC = Efficiency Change; TC = Technological Change; MI = Malmquist Index.
2014
Production stage
In the 2014 production stage, Guangzhou and Lhasa’s productivity change indices, efficiency change indices, and technology change indices were 1; however, in 7 cities, productivity declined, 6 due to efficiency declines and 1, Taiyuan, due to a combination of technology and efficiency declines. Over the 3 years, 22 cities had productivity improvements, 1 because of efficiency changes, 12 because of technology changes, and 9 because of a combination of efficiency and technology changes.
Health treatment stage
In 2014, for Haikou, Lhasa, and Urumqi, the productivity change indices, efficiency change indices, and technology change indices in the health treatment stage were 1; however, 20 cities had productivity declines due to declines in efficiency. Over the 3 years, 18 cities had productivity improvements, 6 because of technology changes, 11 because of efficiency and technology changes, and 1, Xining, because of an efficiency change.
In 2014, Lhasa’s productivity change index, efficiency change index, and technology change index were 1 in both the production and the health treatment stages. More cities had productivity improvements in the production stage than in the health treatment stage, most of which were because of technology changes. In the health treatment stage, most productivity changes were because of a combination of efficiency and technology changes.
2015
Production stage
In 2015, Haikou’s and Lhasa’s productivity change indices, efficiency change indices, and technology change indices were all 1 in the production stage, and in 4 cities, the productivity declined due to efficiency declines. However, there were productivity improvements in 25 cities in the production stage, 2 because of efficiency changes, 14 because of technology changes, and 9 because of a combination of efficiency and technology changes.
In most cities, the productivity changes in the production stage were affected by efficiency improvements, or by both efficiency improvements and technological progress. Approximately half the productivity improvements in the production stages in 2014 and 2015 were affected by changes in efficiency and half the cities were affected by technological progress changes. The production stage efficiencies in Changsha, Zhengzhou, Chongqing, Hangzhou, Hefei, Jinan, Nanchang, Shenyang, Shijiazhuang, Tianjin, and Xi’an in 2014 were mainly affected by technological progress changes. In 2015, the production stage productivity changes in 11 cities were mainly affected by technological progress, and in 13 cities were mainly affected by technological progress. In 2016, most cities were affected by efficiency improvements or a combination of efficiency improvements and technological progress, and only 3 cities were affected by technological progress.
Health treatment stage
In 2015, Haikou’s and Lhasa’s productivity change indices, efficiency change indices, and technology change indices were all 1 in the health treatment stage; however, in 20 cities, the productivity declined, 13 of which were due to efficiency declines, 1 due to technology declines, and 6 due to a combination of efficiency and technology declines. Nine cities had productivity improvements, 4 due to technology changes, and 5 cities because of a combination of efficiency and technology changes.
In 2015, Haikou’s and Lhasa’s productivity change indices, efficiency change indices, and technology change indices were 1 in both the production and the health treatment stages. While most cities had productivity improvements in the production stage, most had productivity declines in the health treatment stage. Most productivity changes in the production stage were due to technical changes, and most productivity changes in the health treatment stage were due to a combination of efficiency and technology changes. Lanzhou, Urumqi, Xining, and Yinchuan, however, had productivity declines in both the production and health treatment stages, and the productivity changes in Changsha and Shenyang were due to efficiency changes.
2016
Production stage
In 2016, Changchun’s and Haikou’s productivity change indices, efficiency change indices, and technology change indices in the production stage were all 1; however, 4 cities had declining productivity, 3 due to the technology declines and 1, Yinchuan, due to a combination of technology and efficiency declines. Twenty-five cities had productivity improvements, 19 due to efficiency changes and 6 due to a combination of efficiency and technology changes.
Health treatment stage
In 2016, Haikou’s and Lhasa’s productivity change indices, efficiency change indices, and technology change indices were all 1 in the health treatment stage; however, 6 cities had productivity declines, 2 due to technology declines and 4 due to a combination of efficiency and technology declines. Twenty-three cities had productivity improvements, 20 because of efficiency changes and 3 because of a combination of efficiency and technology changes.
In 2016, Haikou’s productivity change index, efficiency change index, and technology change index were 1 in both the production and the health treatment stages. Most cities had productivity improvements in the production stage but most had productivity declines in the health treatment stage. Most productivity changes in the production stage were because of technical changes, and most productivity changes in the health treatment stage were due to a combination of efficiency and technology changes.
In 2 out of the 3 years, all 3 of Haikou’s and Lhasa’s indices were 1, and the productivity declines and productivity improvements in both the production and health treatment stages in 2014 and 2016 were similar. However, in 2015, most cities had productivity declines in the health treatment stage, with those in 2014 and 2015 being mainly due to efficiency declines. In the production stage, the productivity improvements were mainly due to technology changes and in the health treatment stage, the improvements were mainly due to efficiency and technology changes. The reasons for the 2-stage productivity improvements in 2016 were mainly due to technology changes; however, the production stage productivity declines in most cities were because of technology declines, and the health treatment stage productivity declines were because of the combined effects of efficiency and technology declines. There were more cities with productivity improvements in the production stage than in the health treatment stage. However, Yinchuan had productivity declines in both stages for 2 consecutive years, mainly because of efficiency declines.
In 2014, the productivity changes in the health treatment stage in Beijing, Hohhot, Jinan, Kunming, Lanzhou, and Nanchang were affected by technological progress, and the other cities were affected by efficiency changes, or the combined effects of technological and efficiency changes; however, most cities were affected by efficiency changes in 2015, with the impact of efficiency and technological progress changes only being found in Chengdu, Chongqing, Kunming, Nanning, and Shanghai. The health treatment stage productivity changes in Nanning and Taiyuan in 2016 were affected by technological progress changes, while the other cities were mainly affected by efficiency changes or a combination of efficiency and technological changes. Management-level improvements played a very important role in the productivity improvements in various cities; when technological progress and management levels are improved together, it can have a very significant impact on productivity improvements.
Conclusion
This article selected research sample data for 31 mainland Chinese cities from 2014 to 2016 and used a modified meta 2-stage EBM Malmquist model to analyze each city’s production and health treatment stage economic growth and environmental efficiencies by examining the annual TGRs, annual efficiencies, annual productivities, annual efficiency changes, and annual technology changes, from which the following conclusions were made.
Lhasa and Haikou emerged as the benchmarks, Nanchang had the largest TGR, Shijiazhuang had the worst overall performance, and Yinchuan had productivity declines for 2 consecutive years in both stages.
While most cities had small TGRs, the overall efficiency was poor, and therefore, the need for improvements was large.
There was an upward trend in the technological boundaries, annual efficiencies fell then rose, and the efficiency fluctuations were more severe than the TGR fluctuations. The TGRs in most cities were generally improving, but the efficiencies were not stable.
The TGRs and efficiency performances in the eastern regions have more developed economies and were significantly better than in the central and western regions.
The MI, EC, and TC analyses indicated that productivity was generally improving, primarily because of efficiency index changes
The TGRs were better in the health treatment stage that in the production stage. However, the production stage efficiencies and productivity index change performances were better than in the health treatment stage. In the health treatment stage, there were large gaps between the cities, and the efficiency improvement and productivity change spaces were large.
The production stage and health treatment stage trends were similar, with the main trends being falls and then rises; however, some cities had consistent trends in both stages. The technology gaps in each stage were continuously improving in most cities.
The need for improvements in the health treatment stage was larger than in the production stage, which indicated that the technological and efficiency improvements in the health treatment stage were not stable.
Based on these results, the following policy recommendations are given:
For Beijing, Changchun, Chengdu, Harbin, Hangzhou, Nanchang, Nanjing, Nanning, Shenyang, Tianjin, Xi’an, and Zhengzhou, in which the production stage efficiencies were significantly better than the health treatment stage efficiencies, it is necessary to strengthen the health governance efficiencies by strengthening the health care systems to prevent diseases caused by air pollutants. It is necessary for these cities to learn from Japan, the United Kingdom, or the Nordic countries’ advanced medical systems and to combine China’s national conditions and regional characteristics to find a system that best suits the country.
For Changsha, Fuzhou, Guiyang, Kunming, Lanzhou, Shijiazhuang, Urumqi, Xining, and Yinchuan, in which the health treatment stage efficiencies were significantly better than the production stage efficiencies, priority should be given to enhancing the production stage efficiencies. Except for Shijiazhuang and Fuzhou, these cities are either located on the north coast or in western China, the respective economic development levels are somewhat lower, and the economic development is based on high energy-consuming and high-polluting enterprises such as the petrochemical industry, and there is greater environmental pollution pressure. Therefore, it is most important to improve fossil energy efficiency by adopting new technologies and controlling and reducing pollutant emissions through technological upgrades to reduce air pollution.
Lhasa, Haikou, and Guangzhou, which had good input-output ratios in both the production and health treatment stages, need to understand the reasons for these results to maintain their advantages. For example, Lhasa on the Qinghai-Tibet Plateau and Haikou on Hainan Island have relatively backward economic development, with Lhasa in particular relying heavily on government subsidies and the development of energy and tourism services, which means that it is able to achieve good environmental and health governance efficiency results. Therefore, as they further develop, the Lhasa and Haikou governments need to be vigilant about the environmental problems that accompany urban expansion, to focus on sustainable green socioeconomic development, and pay attention to air pollution as the number of cars and residents increase.
Exchanges between the eastern, central, and western regions need to be strengthened and cooperative mechanism built to improve environmental and health governance in the eastern, central, and western cities. As the eastern cities lead new technology research and development, they could transfer these new and mature technologies to the central and western cities and assist in technology upgrades. Except for Haikou and Lhasa, most other leading cities in the technology index were located in the coastal areas of mainland China and have relatively advanced socioeconomic development levels. Therefore, promoting regional cooperation could result in the integration of high-quality resources, the sharing of advanced experiences, and the construction of collaborative environmental and health governance systems. Currently, there are several of these collaborative regional development plans in place, such as the Chengdu-Chongqing Shuangcheng Economic Circle, the Beijing-Tianjin-Wing Area, the Yangtze River Delta Economic Belt, and the Guangdong-Hong Kong-Macao Economic Zone. The eastern cities need to take lessons from the advanced technology and management in developed countries and combine their respective energy structure characteristics, industrial advantages, and environmental characteristics to construct health management models to respond to environmental pollution health issues. Eastern cities should use their strengths to communicate with western economies to gain relevant experience and technology and improve their overall management.
All regions need to find the endowments that match their regional characteristics, develop emerging industries that have competitive advantages, and realize energy and industrial structural adjustments. Different cities need to combine their geographical characteristics, resource endowments, economic structures, and energy advantages to build healthy governance models that are consistent with regional characteristics. For areas with relatively serious air pollution, there needs to be a focus on improving health care investment and the management of the diseases associated with air pollution by developing medium- and long-term response plans. For example, the major cities in western China—Urumqi, Lanzhou, Xining, Yinchuan, Chengdu, Ningxia—and other cities should combine their resource endowments and find a path suitable for local sustainable socioeconomic development. As these cities are located in plateau and mountain areas that have very rich natural resources and cultural tourism resources, the reasonable development of tourism resources could realize sustainable tourism and service industry developments.
Energy structural adjustment is the foundation of local economic and social development. The central and western regions can use rich optoelectronics, wind power, and so on to enhance the development and utilization of these clean energy sources. The western region also has water resource advantages, but ensuring clean water resources has become an important challenge. The area covered by the Chengdu-Chongqing Economic Circle, for example, has rich water, wind energy, and shale resources; therefore, developing an energy structure that complements the development of multiple clean energies could alleviate the environmental challenges resulting from fossil energy consumption.
Improving the efficiency of environmental governance and health governance by further improving the level of administrative management should be a priority in each city. Traditional economic consumption-based economic growth has resulted in serious environmental pollution problems. For areas with relatively serious air pollution, the negative health effects caused by air pollution should be reduced. As most cities need to focus on improving their environmental governance efficiency, the establishment of a scientific and effective environmental governance system could use local resources more effectively and improve the well-being of the people.
Footnotes
Authors’ Note
Tai-Yu Lin is now affiliated with Department of Business Administration, National Cheng Kung University, Taipei.
Declaration of Conflicting Interests
The author(s) declared no potential conflicts of interest with respect to the research, authorship, and/or publication of this article.
Funding
The author(s) received no financial support for the research, authorship, and/or publication of this article.