
Abstract
Quantitative metrics are used to develop profiles of health care institutions, including hospitals, nursing homes, and dialysis clinics. These profiles serve as measures of quality of care, which are used to compare institutions and determine reimbursement, as a part of a national effort led by the Center for Medicare and Medicaid Services in the United States. However, there is some concern about how misclassification in case-mix factors, which are typically accounted for in profiling, impacts results. We evaluated the potential effect of misclassification on profiling results, using 20 744 patients from 2740 dialysis facilities in the US Renal Data System. In this case study, we compared 30-day readmission as the profiling outcome measure, using comorbidity data from either the Center for Medicare and Medicaid Services Medical Evidence Report (error-prone) or Medicare claims (more accurate). Although the regression coefficient of the error-prone covariate demonstrated notable bias in simulation, the outcome measure—standardized readmission ratio—and profiling results were quite robust; for example, correlation coefficient of 0.99 in standardized readmission ratio estimates. Thus, we conclude that misclassification on case-mix did not meaningfully impact overall profiling results. We also identified both extreme degree of case-mix factor misclassification and magnitude of between-provider variability as 2 factors that can potentially exert enough influence on profile status to move a clinic from one performance category to another (eg, normal to worse performer).
Keywords
Reliability of comorbidity data as case-mix factors adjusted in health policy models has been questioned and its impact of misclassification on profiling has been studied outside dialysis.
Misclassification on case-mix using different data sources did not meaningfully impact profiling results in dialysis practice.
Center for Medicare and Medicaid Services (CMS) may continue to use the current sources of comorbidity data in profiling purposes, but still need to monitor extreme degree of case-mix factor misclassification and magnitude of between-provider variability that can potentially influence profile status in end-stage renal disease (ESRD).
Introduction
With the availability of increasingly large amounts of patient outcome data and the growing interest in measuring quality of patient care delivered by health care providers, quantitative metrics have been developed to profile hospitals, dialysis clinics, and even individual providers. Much is at stake for individual facilities as well as organizations, whose profiles are used to compare against national averages or norms in the United States, and may result in reduced reimbursement for services for sub-par performance, increased inspection by regulators, and continuous surveillance for quality assurance.1,2 Therefore, there is a growing interest on ensuring the validity of the metric, ascertainment of patient characteristics and comorbidities, and statistical methods from which these profiles are developed.3-5 One major concern is the impact of misclassification of case-mix factors, typically used as adjustment variables, on the outcome of interest.
In the United States, the majority of end-stage renal disease (ESRD) patients on dialysis are covered by the Center for Medicare and Medicaid Services (CMS), a federal health insurance program. For this population, Medicare claims and the Medical Evidence report (the CMS-2728 form) represent the 2 primary data sources for comorbidity determination that are presently used in health care policy and research in ESRD. Two main uses in practice are its use in Quality Incentive Program (QIP) and epidemiology research via its availability in US Renal Data System (USRDS). The comorbidity information available on the CMS-2728 form, a data form that is unique to the ESRD population, is a list of known patient comorbidities at incidence of dialysis. These data, not meant for direct reimbursement claims, are entered at the dialysis facility by the physician, nurse, or administrative staff based on hospital and ambulatory care medical records. Center for Medicare and Medicaid Services (via University of Michigan—Kidney Epidemiology and Cost Center [UM-KECC]) methodologies for profiling the USRDS dialysis facilities are based on the previous year’s claims data. Comorbidity assessment from claims data, captured from diagnostic (ICD) and procedure codes (CPT), is generally considered more reliable than assessment based on information available on the CMS-2728 form, which is required to be completed once at incidence of dialysis.6,7 However, CMS-2728 data are still used for health care policy development because they are much easier to access and process, compared to the resources required to create claims-based models.
However, there has been a concern for many years regarding the accuracy of data in CMS-2728.8,9 Earlier studies have attempted to validate comorbid conditions reported on CMS-2728 versus clinical data or claims data; the results showed sensitivity <0.6, specificity >0.9, agreement and Kappa statistics <0.5.7,8,10-12 On the other hand, case-mix adjustment based on administrative claims data (compared to more reliable medical records) is generally considered suitable for profiling hospital performance. 13 In other words, using information garnered from claims data in case-mix profile development models appear to have acceptable quality. With this background, we decided to assess the impact of misclassification in case-mix factors on profiling in dialysis.
In this article, we compared dialysis profiling results using comorbidity data from Medicare claims versus CMS-2728 with 30-day standardized readmission ratio (SRR) as the outcome metric. In addition, we conducted simulation studies to examine the potential effect of misclassification on the estimation of regression coefficients in the statistical models used in the development of profiling strategies as well as profiling itself. We sought to check if real data analysis and simulation study provide consistent results and messages.
Methods
Underlying Models
CMS has employed a hierarchical logistic regression exchangeable model for profiling health care providers.14,15 Given binary outcome

where

where the superscript ME denotes measurement error and indicates parameters to be estimated with observed covariate W. When X is categorical, for example,


We assume that W only depends on X, not Y, that is, ME is non-differential. 18
Profiling Schemes
SRR for the

where
To assess the profiling performance, we focused on the 2 evaluation criteria—profiling sensitivity and specificity. Of note, the identification of truly “worse” providers could be of particular importance as they could face financial penalty in the form of reduced reimbursement for services rendered.
Sensitivity (SN) for profiling as worse providers is

Specificity (SP) for profiling as worse providers is

where “Normal” performance implies “No reduction in payment,” when quality linked to payment. 21
USRDS Example
In this section, we conducted a case study using 30-day unplanned hospital readmission (namely, SRR) as the profile outcome. We analyzed SRR and the subsequent effects on dialysis facility rating scores using either Medicare claims or CMS-2728 (see Supplemental Table S3), the 2 commonly used sources of comorbidity data in nephrology. We wanted to determine if case-mix adjustment using different data sources would alter the final dialysis facility rating.
CMS utilizes 2-stage model: the first stage of the model is a double random effect logistic regression model where both dialysis facilities and hospitals are modeled as random effects; the second stage is a mixed effect logistic regression model to calculate SRR when profiling dialysis facilities, in which dialysis facilities are modeled as fixed effects and hospitals are modeled as random effects with its standard deviation estimated from the first stage. For each index hospitalization, past year comorbidity based on Medicare claims were grouped as the Hierarchical Condition Categories, see Supplemental Table S4 for the list.
In this analysis, we assessed misclassification under a simplified model only including dialysis facilities as random effects. This random intercept logistic regression model was used by CMS for hospital-wide readmission measure, and we followed the set of guidelines provided by CMS for data processing.19,22 The algorithm to assign index discharges and unplanned post-index readmission within 30-day from index discharge was derived from the hospital-wide all-cause unplanned readmission measure, and we modeled the case-mix-adjusted 30-day SRR. For case-mix, we adjusted the following factors: age, sex, body mass index, primary cause and years of ESRD, duration of index hospitalization, and a total of 11 comorbidities (alcohol dependence; drug dependence; tobacco use; diabetes; cancer; chronic obstructive pulmonary disease; and cardiovascular diseases including atherosclerotic heart disease, congestive heart failure [CHF], cerebrovascular disease, peripheral vascular disease, and other cardiac).8,10
The dialysis facility profile that used claims data prior year to dialysis initiation was regarded as the reference standard. 10 We compared it against the 2 alternative approaches using comorbid conditions captured from CMS-2728: (1) using CHF as recorded on CMS-2728, while all other conditions from claims, and (2) using all of 11 comorbidities from CMS-2728. We chose 11 comorbidities as in previous studies on concordance of data in CMS-2728 and claims.8,10 These 11 comorbidities on CMS-2728 can be compared with those with ICD-9 codes. The other variables such as “institutionalization” does not have ICD-9 codes. Also, CHF is among the important risk factors in kidney disease (https://nccd.cdc.gov/CKD/Calculators.aspx) and its prevalence is not only relatively high but also differs substantially between the 2 data sources (57% based on claims and 39% based on 2728 form, to be shown below). We selected CHF to examine the impact of misclassification as an illustrative purpose. Also, the list of the final risk adjusters could differ year to year, as reflected in different years’ manuals. 23 Data analyses were carried with SAS® 9.4, following the technical notes from the CMS guidelines. 19
Among 90 373 elderly patients 67 years old or older captured from the USRDS starting dialysis during July 1, 2006, to June 30, 2009, we extracted hospitalization information during January 1, 2010, to June 30, 2012. After excluding small facilities with 10 or less index discharges, there were 63 142 index discharges corresponding to 20 744 patients discharged from 2740 dialysis facilities. The overall 30-day unplanned all-cause readmission rate was about 29%, similar to 30% national readmission rate in the 2014 Dialysis Report. 22 The number of index discharges per facility showed the mean and median of 23 and 20 with standard deviation of 12.
Table 1 shows that after using CHF information recorded on the CMS-2728 in place of the claims data, the estimated odds ratio for each predictor did not change or only minimally changed in the multiple regression. However, there were 3 facilities whose profile status did change; 2 were upgraded and 1 downgraded in their performance ratings, as seen in Table 2. We further computed the prevalence of CHF, SN, and SP among 2740 facilities and reported the results in Supplemental Table S1. The prevalence dropped from 56.6% using claims data to 38.9% when using CMS-2728. However, the prevalence of CHF among the 2 upgraded facilities remained similar; worse to normal: 86.8% (claims) versus 84.2% (CMS-2728), and normal to better: 64.3% (claims) versus 67.9% (CMS-2728). In contrast, the prevalence of CHF dropped from 100% (claims) to 0% (CMS-2728) in the facility downgraded from normal to worse. This may imply that extreme under-reporting (eg, no recording of a key factor) can make a difference in the end result.
USRDS Case Study: Model Fits with Hierarchical Logistic Regression.

Note. Models: A = 11 types of comorbidity conditions based on past year claims prior to dialysis initiation. B = Replace CHF from CMS 2728 form. C = Replace all 11 types of comorbid conditions based on CMS-2728 form. USRDS = US Renal Data System; OR = odds ratio; CI = confidence interval; ESRD = end-stage renal disease; BMI = body mass index; AHD = atherosclerotic heart disease; CHF = congestive heart failure; COPD = chronic obstructive pulmonary disease; CBVD = cerebrovascular disease; PVD = peripheral vascular disease.
USRDS Case Study: Profiling.

Note. Models A = Comorbidity based on past year claims prior to dialysis initiation. B = Replace CHF from CMS 2728 form. C = Replace all 11 types of comorbidity conditions based on CMS-2728 form. USRDS = US Renal Data System.
Next, SRR estimates and profiling status were compared when all of the 11 comorbid conditions were obtained from claims data versus CMS-2728. Figure 1 demonstrates that the bootstrapped means of SRR obtained with the 2 data sources were highly correlated

Standardized readmission ratio (SRR) derived from claims data versus CMS-2728 data using bootstrap.
Simulation Study
We further designed a set of simulation studies to address the 2 objectives: (1) to investigate the effect of misclassification on estimations of fixed coefficients and random intercepts and (2) to compare profiling behavior/performance under different misclassification settings.
Guided by the original CMS model developers, we chose
The unobserved (X) and observed
The first experiment using 1000 simulations examined the effect of misclassification on regression parameters. From Table 3, when SN or SP for variable
Effect of Misclassification on the Estimation of Fixed Effect Coefficients.

Note. SN = 1 and SP = 1 represents no misclassification. Results are based on 1000 simulations. Data are generated from equation (1). SN = sensitivity; SP = specificity; Var = Variance; MSE = mean squared error; CP = coverage probability.
Table 4 summarizes CP based on whether the 95% Wald’s CI contains the true value of random intercept for the
Effect of Misclassification on the Estimation of Coverage Probability for Random Intercepts Based on True Profiling Status.

Note. 1000 simulations are used. SN = sensitivity; SP = specificity.
The second experiment, using 100 simulations, investigated the effect of misclassification on profiling under the same set of simulation parameters as in the first experiment. Simulation findings indicate that profiling results appeared to be robust. The case of
Effect of Misclassification on Profiling.
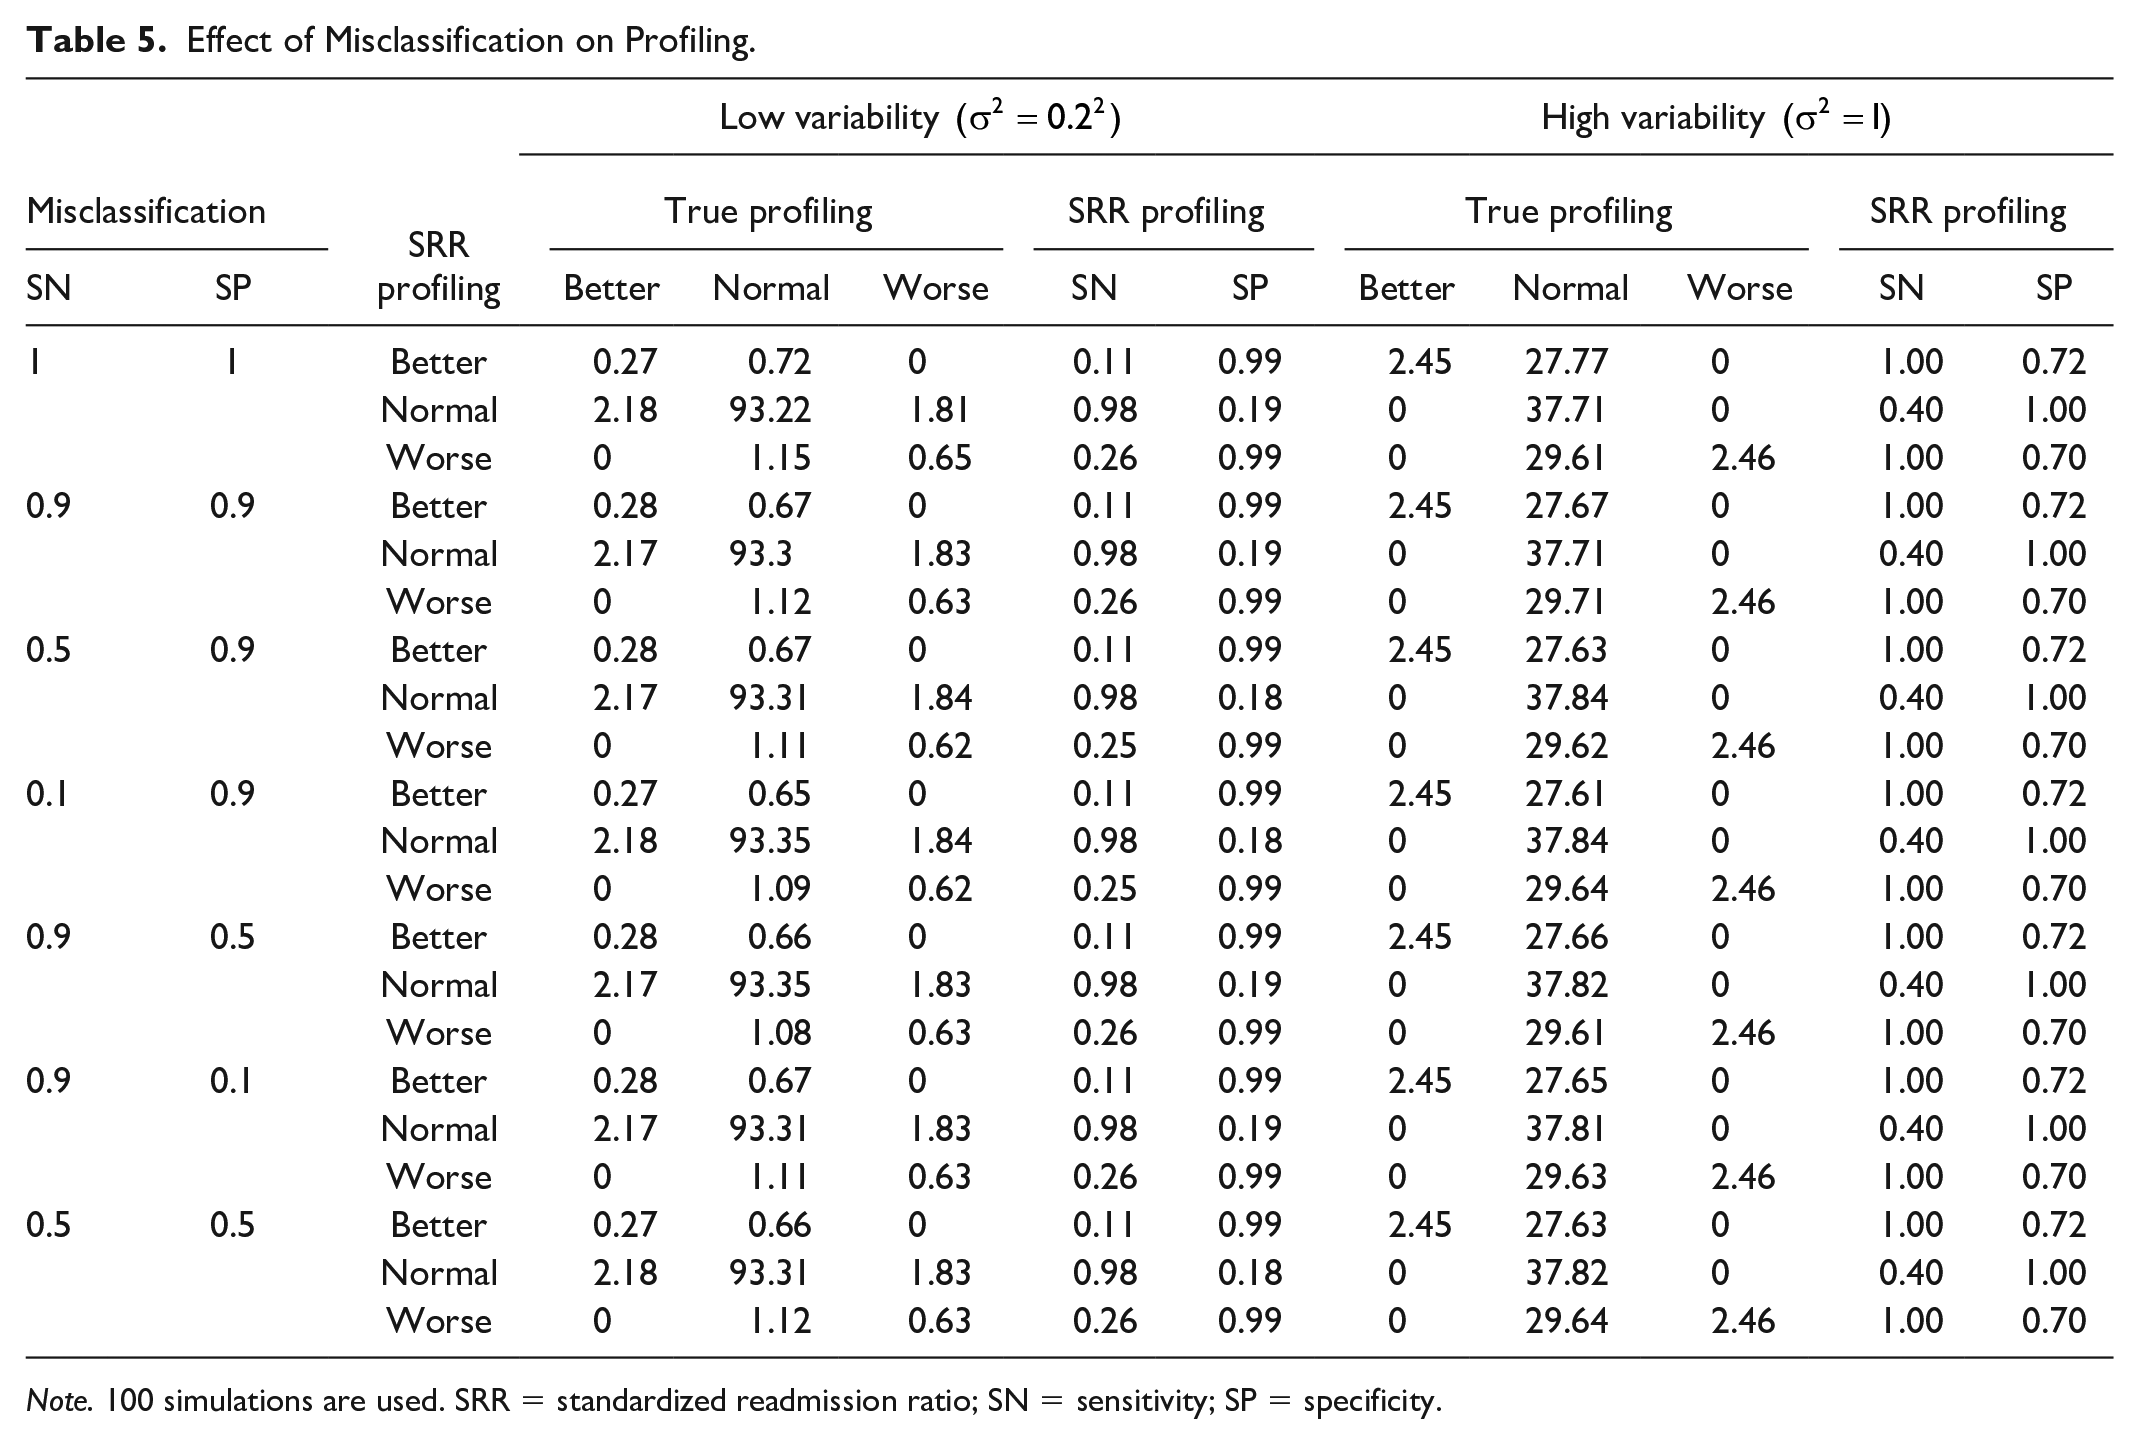
Note. 100 simulations are used. SRR = standardized readmission ratio; SN = sensitivity; SP = specificity.
Discussion
In this era of “pay for performance” and initiatives to enhance patient choice in choosing health care, it is important to understand how case-mix adjustments using various data sources can affect the results of profiling health care providers. 1 For patients on dialysis with Medicare coverage and for research purposes, there are 2 major data sources for comorbidity ascertainment in the USRDS: Medical Claims and CMS-2728 Medical Evidence form (incident dialysis comorbidity information). In health care policy, CMS-2728 is used to capture the comorbidities in the development of the standardized mortality ratio (SMR) and standardized hospitalization ratio (SHR), which are the 2 components of the “Dialysis Facility Compare Star Rating” (https://www.medicare.gov/dialysisfacilitycompare/), a program aimed to provide consumers with information when choosing outpatient dialysis services.28-30 However, the SRR in the ESRD QIP, another program implemented by CMS, used prior year claims data for comorbidity adjustment. Thus, the method for case-mix adjustment in dialysis clinic profiling differs even within the same cohort of ESRD patients and the same operating agency and may change over different years. The QIP has been used for both payment reduction for facilities that underperform and a publicly available online rating on the CMS “Dialysis Facility Compare” Web site to inform consumers.31,32
In this study based on both real and simulated data, we found that commonly encountered, moderate miscoding in covariates or case-mix may have limited influence on profiling. This phenomenon might be partly explained by similarity in profiling versus prediction, where there is no strong need for the modeling of ME to play an important role in prediction problems. In contrast, misclassification generally affects the regression coefficients (measure of association) in the statistical model, well explained by mathematical theory; that is, regression dilution. 18
Between-provider variance can play an important role in the profiling results.20,33 Simulation results without misclassification in predictor in Table 5 agree with those from a previous study.
20
For true worse or true better providers, simulations suggest low SN (0.11 for true better, 0.26 for true worse)/high SP (0.99) under smaller variance versus high SN (1.0)/not high SP (0.7) under larger variance. For true normal providers, simulations suggest high SN (0.98)/low SP (0.19) under smaller variance versus low SN (0.4)/highest SP (1.0) under larger variance. Given that true worse/better providers were based on upper/lower 2.5% under our simulations (unlike 20% better in Ding et al
33
), profiling based on random intercept model can be more useful under smaller between-provider variance if the goal is to flag out a small percent of outliers, that is, to avoid misclassification of a large number of true normal providers. On the other hand, the case of larger variance showed improved coverage probability overall for the random intercept indicating each provider, and high sensitivity and specificity (in sum as summary measure, which is called the Youden Index). From our USRDS data example, the variance of the random intercepts for facilities on the logit scale was estimated to be
In addition, we found that regardless of adjusting comorbidities from either the CMS-2728 form or claims data, SRR estimates from the 2 approaches agreed closely (
Also, in studies using simulations to evaluate the impact of under-coding of cardiac disease severity on hospital profiles or report cards, investigators found that the outlier status of most hospitals was robust to under-coding. However, miscoding of very influential predictors of mortality, such as shock or renal failure, could lead to a change in the 30-day mortality rate profile. 37
In our real data analysis example, the prevalence of individual comorbid conditions was lower when taken from the CMS-2728 form (Supplemental Table S2), but similar profiling results were observed with the same statistical model using either data source. However, it was also revealed that profiling status can change in the extreme facilities when misclassification severely varied across providers; see Supplemental Tables S1 and S2. When we replaced 1 covariate (CHF) ascertained from CMS-2728 form, 3 out of 2740 (0.1%) facilities changed the profiling status (facility #1 to #3, Supplemental Table S2). When we replaced all 11 types of comorbidity conditions with different data sources, 12 out of 2740 facilities (0.4%) changed profiling status (facility #2 to #13, Supplemental Table S2). A total of 4 facilities (facility #3 to #6) can newly face penalty when CMS-2728 form (less reliable data source) was used. In CMS dry run of SRR for dialysis facilities, CHF was removed from past-year comorbidity due to its presence in many ESRD patients and modifiability. 23 Our real data analysis (Supplemental Table S2, facility #1, #2, and #3) may suggest a potential flaw in current dialysis facility QIP when using SMR as outcome. Standardized mortality ratio was adjusted for comorbidities from patient’s CMS-2728 form, for example, CHF. 23
There is already existing literature on the agreement between different data sources for comorbidities (eg, CMS 2728 vs claims) in ESRD and on the impact of using different data sources on profiling models outside ESRD. Thus, we consider our work as the combination of these two, accompanied by “statistical” evaluation (eg, mean squared error, coverage probability and sensitivity/specificity) and the first study of its kind in ESRD. Readers may find our findings are generally supported by theory, empirical real-world data analysis, and statistical simulation (where truth is known), and in agreement with previous related findings. Other unanswered questions include whether the duration of time between dialysis initiation and the CMS-2728 form completion date affects misclassification, and if facilities with dialysis patients of greater vintage (prevalent time on dialysis) may also face more misclassification. The process of data input onto the CMS2728 is extremely variable and done to various degrees of accuracy. It is supposed to be done within 45 days of first dialysis treatment for ESRD, at the dialysis outpatient clinic, not in the hospital. Notably, there is no penalty if the completion and submission of the form to the local dialysis network are delayed. The local dialysis network will generate a form listing the incomplete 2728 submissions. There are no published data frequency of incomplete submissions at 45 days. These could serve as good future research questions.7,8,10,38,39
The limitations of our study should be noted. First, in the simulation study, we only considered simple scenarios with limited configurations; for example, misclassifications and size constant across providers, non-differential ME, and 2 covariates. Although simple settings can better elucidate mechanisms and facilitate interpretations, future investigations are warranted under more complicated settings. Second, there are different profiling models besides the CMS model/method that we selected. For example, random versus fixed effects, 2-stage, Cox and piecewise Poisson model, and observed or predicted value (vs expected value in standardized ratios) have been used and results with different policy implications have been observed.1,10,12,24,40 These contradictions can be investigated for further elucidation and possible resolution in future. Third, we did not have a gold standard for comorbidity determination so claims data served as the reference standard, which is currently utilized by CMS for profiling hospitals based on 30-day readmission ratios.13,19
Based on simulation and real data example, we conclude that misclassification on covariates can affect regression coefficients in the models used for profiling, but less on profiling itself. However, extreme scenarios (such as in completely missing or omitted data in an important covariate) and between-provider variability can influence and make a difference in the final profile status.
Supplemental Material
Supplemental_material – Supplemental material for Assessing the Impacts of Misclassified Case-Mix Factors on Health Care Provider Profiling: Performance of Dialysis Facilities
Supplemental material, Supplemental_material for Assessing the Impacts of Misclassified Case-Mix Factors on Health Care Provider Profiling: Performance of Dialysis Facilities by Yi Mu, Andrew I. Chin, Abhijit V. Kshirsagar and Heejung Bang in INQUIRY: The Journal of Health Care Organization, Provision, and Financing
Footnotes
Acknowledgements
We thank Dr Lorien Dalrymple for her early contribution to the conception of the work.
Authors’ Note
The interpretation and reporting of the data are the responsibility of the authors and in no way should be seen as an official policy or interpretation of the US government.
Declaration of Conflicting Interests
The author(s) declared no potential conflicts of interest with respect to the research, authorship, and/or publication of this article.
Funding
The author(s) disclosed receipt of the following financial support for the research, authorship, and/or publication of this article: H.B. and Y.M. were partly supported by Dialysis Clinic, Inc. H.B. was additionally supported by the National Institutes of Health through grant UL1 TR001860. The interpretation and reporting of the data are the responsibility of the authors and in no way should be seen as an official policy or interpretation of the US government.
IRB Approval
The University of California has determined that studies using USRDS data do not constitute human subject research.
Supplemental Material
Supplemental material for this article is available online.
References
Supplementary Material
Please find the following supplemental material available below.
For Open Access articles published under a Creative Commons License, all supplemental material carries the same license as the article it is associated with.
For non-Open Access articles published, all supplemental material carries a non-exclusive license, and permission requests for re-use of supplemental material or any part of supplemental material shall be sent directly to the copyright owner as specified in the copyright notice associated with the article.