
Abstract
The purpose of this study was to determine whether a patient satisfaction survey in the outpatient clinic setting using questions with either a positive or negative tone would produce consistent responses. This was a prospective study using a 20-question paper survey delivered to medical students who were asked to rate on a scale of 1 to 10 to what degree they either agree or disagree with statements regarding their most recent personal outpatient clinic health care visit (any medical specialty). The same survey was administered again through an e-mail link 1 week later. One hundred fifty (77%) students completed the 20-item survey and 53 (35%) of the participating students completed the follow-up e-mail survey. Seven of the 10 question pairs on the paper survey revealed statistically significant differences in responses based on tone, with greater values for disagreement with negatively toned questions than values representing agreement with positive-toned questions. The match rates for similar questions posed on the paper survey and then the e-mail survey 1 week later ranged between 27.8% and 56.6%. This study demonstrated that, with an outpatient health care patient satisfaction survey, disagreement with a negative-toned question was stronger than agreement with a positive-toned question. There was poor correlation between survey responses when first posed on a paper survey and then repeated on a digital survey 1 week later. These findings suggest that the wording of survey questions may affect responses and that survey answers change with time and across delivery platforms.
Customer feedback has long been considered a critical marketing and strategic planning tool for a variety of industries. In the fields of marketing and debate, it is commonly recognized that the wording of questions can affect responses.
Our study demonstrated that, with an outpatient health care patient satisfaction survey, disagreement with a negative-toned question was stronger than agreement with a positive-toned question. It was also noted that individual survey answers change over time and survey platform (paper vs digital formats).
These findings suggest that the wording of survey questions and also timing and method of delivery may affect patient satisfaction survey responses and these attributes should be considered when designing patient satisfaction measurement tools.
Introduction
As with many other service industries, health care delivery represents a highly complex process that is difficult to define or measure. 1 In addition to outcomes data, patient satisfaction surveys remain an important means of producing actionable data about the patient experience. 2 These data can be used to provide meaningful comparisons of hospitals, clinics, and other health care facilities such that consumers can make well-informed decisions on where to seek care. In turn, health care providers are incentivized to continuously improve health care from both an outcomes and patient satisfaction perspective. 3
Customer feedback has long been considered a critical marketing and strategic planning tool for a variety of industries. 4 Value, as defined by the consumer, is arguably the ultimate goal of any right-minded market competitor. In its simplest form, customer feedback is obtained by asking the customer to describe, or in a more quantifiable fashion, rate the customer experience. This may be achieved through personal interviews or focus groups. In the digital age, customer questionnaires have become cheaper and easier to administer. The now ubiquitous web page pop-up survey and e-mail inquiry have replaced many face-to-face or phone interviews. Survey results can be used to help optimize the delivery of consumer-based value, measure employee performance, provide starting points for continuous improvement, and guide future strategy—all at a relatively low cost.
In the past, most surveys were designed and administered by individual health care entities with wide variation in survey design, administrative technique, and interpretation. Recent efforts to standardize patient satisfaction measurement has led to the development of private companies and government entities with the goal of measuring patient satisfaction in a consistent and reliable fashion. 5
In the fields of marketing and debate, it is commonly recognized that the wording of questions can affect responses. 4 It is not known to what degree patient satisfaction surveys are affected by simple changes in wording or punctuation. Words such as clean, pleasant, helpful, efficient, knowledgeable, good, nice, convenient, and friendly are seeded with positivity and may surreptitiously elicit different emotional responses. Negatively toned words and phrases—such as dirty, unpleasant, not helpful, inefficient, not knowledgeable, bad, inconvenient, and unfriendly—may yield the opposite effect irrespective of the context.
We compared the results of a patient satisfaction paper survey and a follow-up e-mailed survey to determine the effects, if any, of the tone of survey questions on the degree to which respondents agreed or disagreed with several aspects of their most recent outpatient health care visit.
Methods
Study Design, Setting, and Participants
This cross-sectional study was conducted at a tertiary care university medical college and was approved by the institutional review board. Eligible respondents were first- and second-year medical students who were asked to recall their most recent personal outpatient clinic health care visit. Unanswered or illegible responses were excluded, but partial responses from incomplete surveys were included. The survey was offered to 195 medical students on November 13 to 14, 2018 in a small group learning session.
Survey Design and Distribution
The initial paper survey contained 20 statements reflecting on their most recent health care visit with the option to circle 1 answer between 1 and 10 (1 = strongly disagree, 10 = strongly agree) for each question. These 20 items consisted of 10 positive-toned statements, and 10 statements assessing an equivalent concept, presented in a negative tone. Participants were asked to provide an e-mail address for a follow-up survey to be administered 1 week later. The follow-up survey was delivered as an e-mail link to a Qualtrics web-based, mobile-phone–accessible survey. Respondents were asked to click on a link that took them to a Qualtrics generated Web site with a series of 20 statements. Each item could be answered using a slider bar with answers ranging from 1 to 10, similar to the paper survey. The order and content of the statements in the follow-up survey remained the same, though distribution differed in 2 respects: (1) it was delivered and administered in electronic format via e-mail and (2) delivery was 1 week after the paper survey. Participants were told that they could choose to not answer questions or to end their participation at any time. Participants were allowed 4 weeks to respond to the e-mail survey until they were considered ineligible for the follow-up e-mail survey.
Statistical Analysis
Data were assembled using REDCap version 8.8.2. Statements were grouped in correlate pairs and a Likert scale was utilized for all statements: 1 = strongly disagree, 10 = strongly agree. Averages were determined for all item responses. To compare the strength of agreement or disagreement with the negative-toned statements to those with a positive tone, the formula −x + 11 was applied to the averages of the negative-toned statements. For example, a response of 10 (strongly agree) would be converted to 1 (strongly disagree), 9 to 2, and so on. Differences were computed: (adjusted negative response − positive response), averaged displayed, and a paired t test run for each pair. Weighted Kappa was computed to determine the level of agreement between the positive and recoded negative-toned responses. For the paper survey, students were required to respond to all 20 statements to be included in the analysis. Responses to the paper survey administered in person were primarily complete; n = 9 excluded for missing responses. The e-mailed follow-up survey had a lower response rate with highly varied completeness; only 26 students answered all 20 statements. Due to this limitation, those who responded to any pairs of positive/negative statements were included in the analysis for that particular question set. We did not require they answer all 10 pairs; each pair has a unique reported number of respondents. The proportion of responses which “matched” between survey 1 and survey 2 were assessed for each individual question where a response was present for each format. All data management and statistical analysis were conducted using SAS 9.4 (Carey, NC).
Results
Among the 195 medical students offered the paper survey, 150 responded to all 20 statements in full (77%); 54 of these students responded to at least 1 matched pair of statements in the follow-up survey administered 1 week later, used for comparison (Table 1). Average scores (n = 150) for the positive statements ranged from 6.37 ± 1.88 to 8.83 ± 1.21. Average scores for the negative statements (n = 150) ranged from 1.83 ± 1.07 to 4.52 ± 1.35. Responses for negative statements adjusted for equivalent positive tone (“average response adjusted”) ranged from 6.43 ± 2.13 to 9.17 ± 1.07. The average of the differences between the positive-toned statements and the negative-adjusted statements ranged from 0.05 ± 1.40 to 0.48 ± 1.37 and 7 out of 10 of the statement pairs had differences that reached statistical significance (≤0.05), and these values were positive, demonstrating stronger disagreement with a negative-toned statements than agreement with a positive-toned statement. Weighted Kappa considers disagreement closer to the diagonals less heavily than those further away from the diagonals, values ranged from 0.49 to 0.65 indicating moderate to good agreement.
Complete Responses to All Questions in the Paper Survey (N = 150).

Note. Weighted Kappa considers disagreement closer to the diagonals less heavily than those further away from the diagonals; none contain “0”; thus, we reject the null that there is “no agreement” for all. Paired t test P values ≤ 0.05 were considered statistically significant and are highlighted in bold text.
Shaded rows: Negative connotation.
Likert scale presented for all statements: 1 = strongly disagree, 10 = strongly agree.
Adjusted:
Differences computed: (adjusted negative response − positive response).
For the follow-up digital survey (Table 2), statements were placed in 10 matched pairs and pairs for which both the positive and negative statement were answered were considered complete. Average scores for the positive statements ranged from 6.30 ± 2.42 to 8.60 ± 0.99. Average scores for the negative-toned statements ranged from 2.04 ± 1.04 to 4.85 ± 2.56. Responses for negative statements adjusted for equivalent positive tone (“average response adjusted”) ranged from 6.15 ± 2.56 to 8.96 ± 1.04. The average of the differences between the positive-toned questions and the negative statements adjusted for completed pairs ranged from −0.15 ± 1.01 to 0.34 ± 0.81 and only 1 out of 10 of the pairs had a difference that reached statistical significance (≤0.05), and these values were positive, demonstrating stronger disagreement with a negative-toned statement than agreement with a positive-toned statement. For this follow-up survey weighted kappa, values ranged from 0.52 to 0.82 indicating moderate to good agreement.
Follow-up Survey via E-mail.
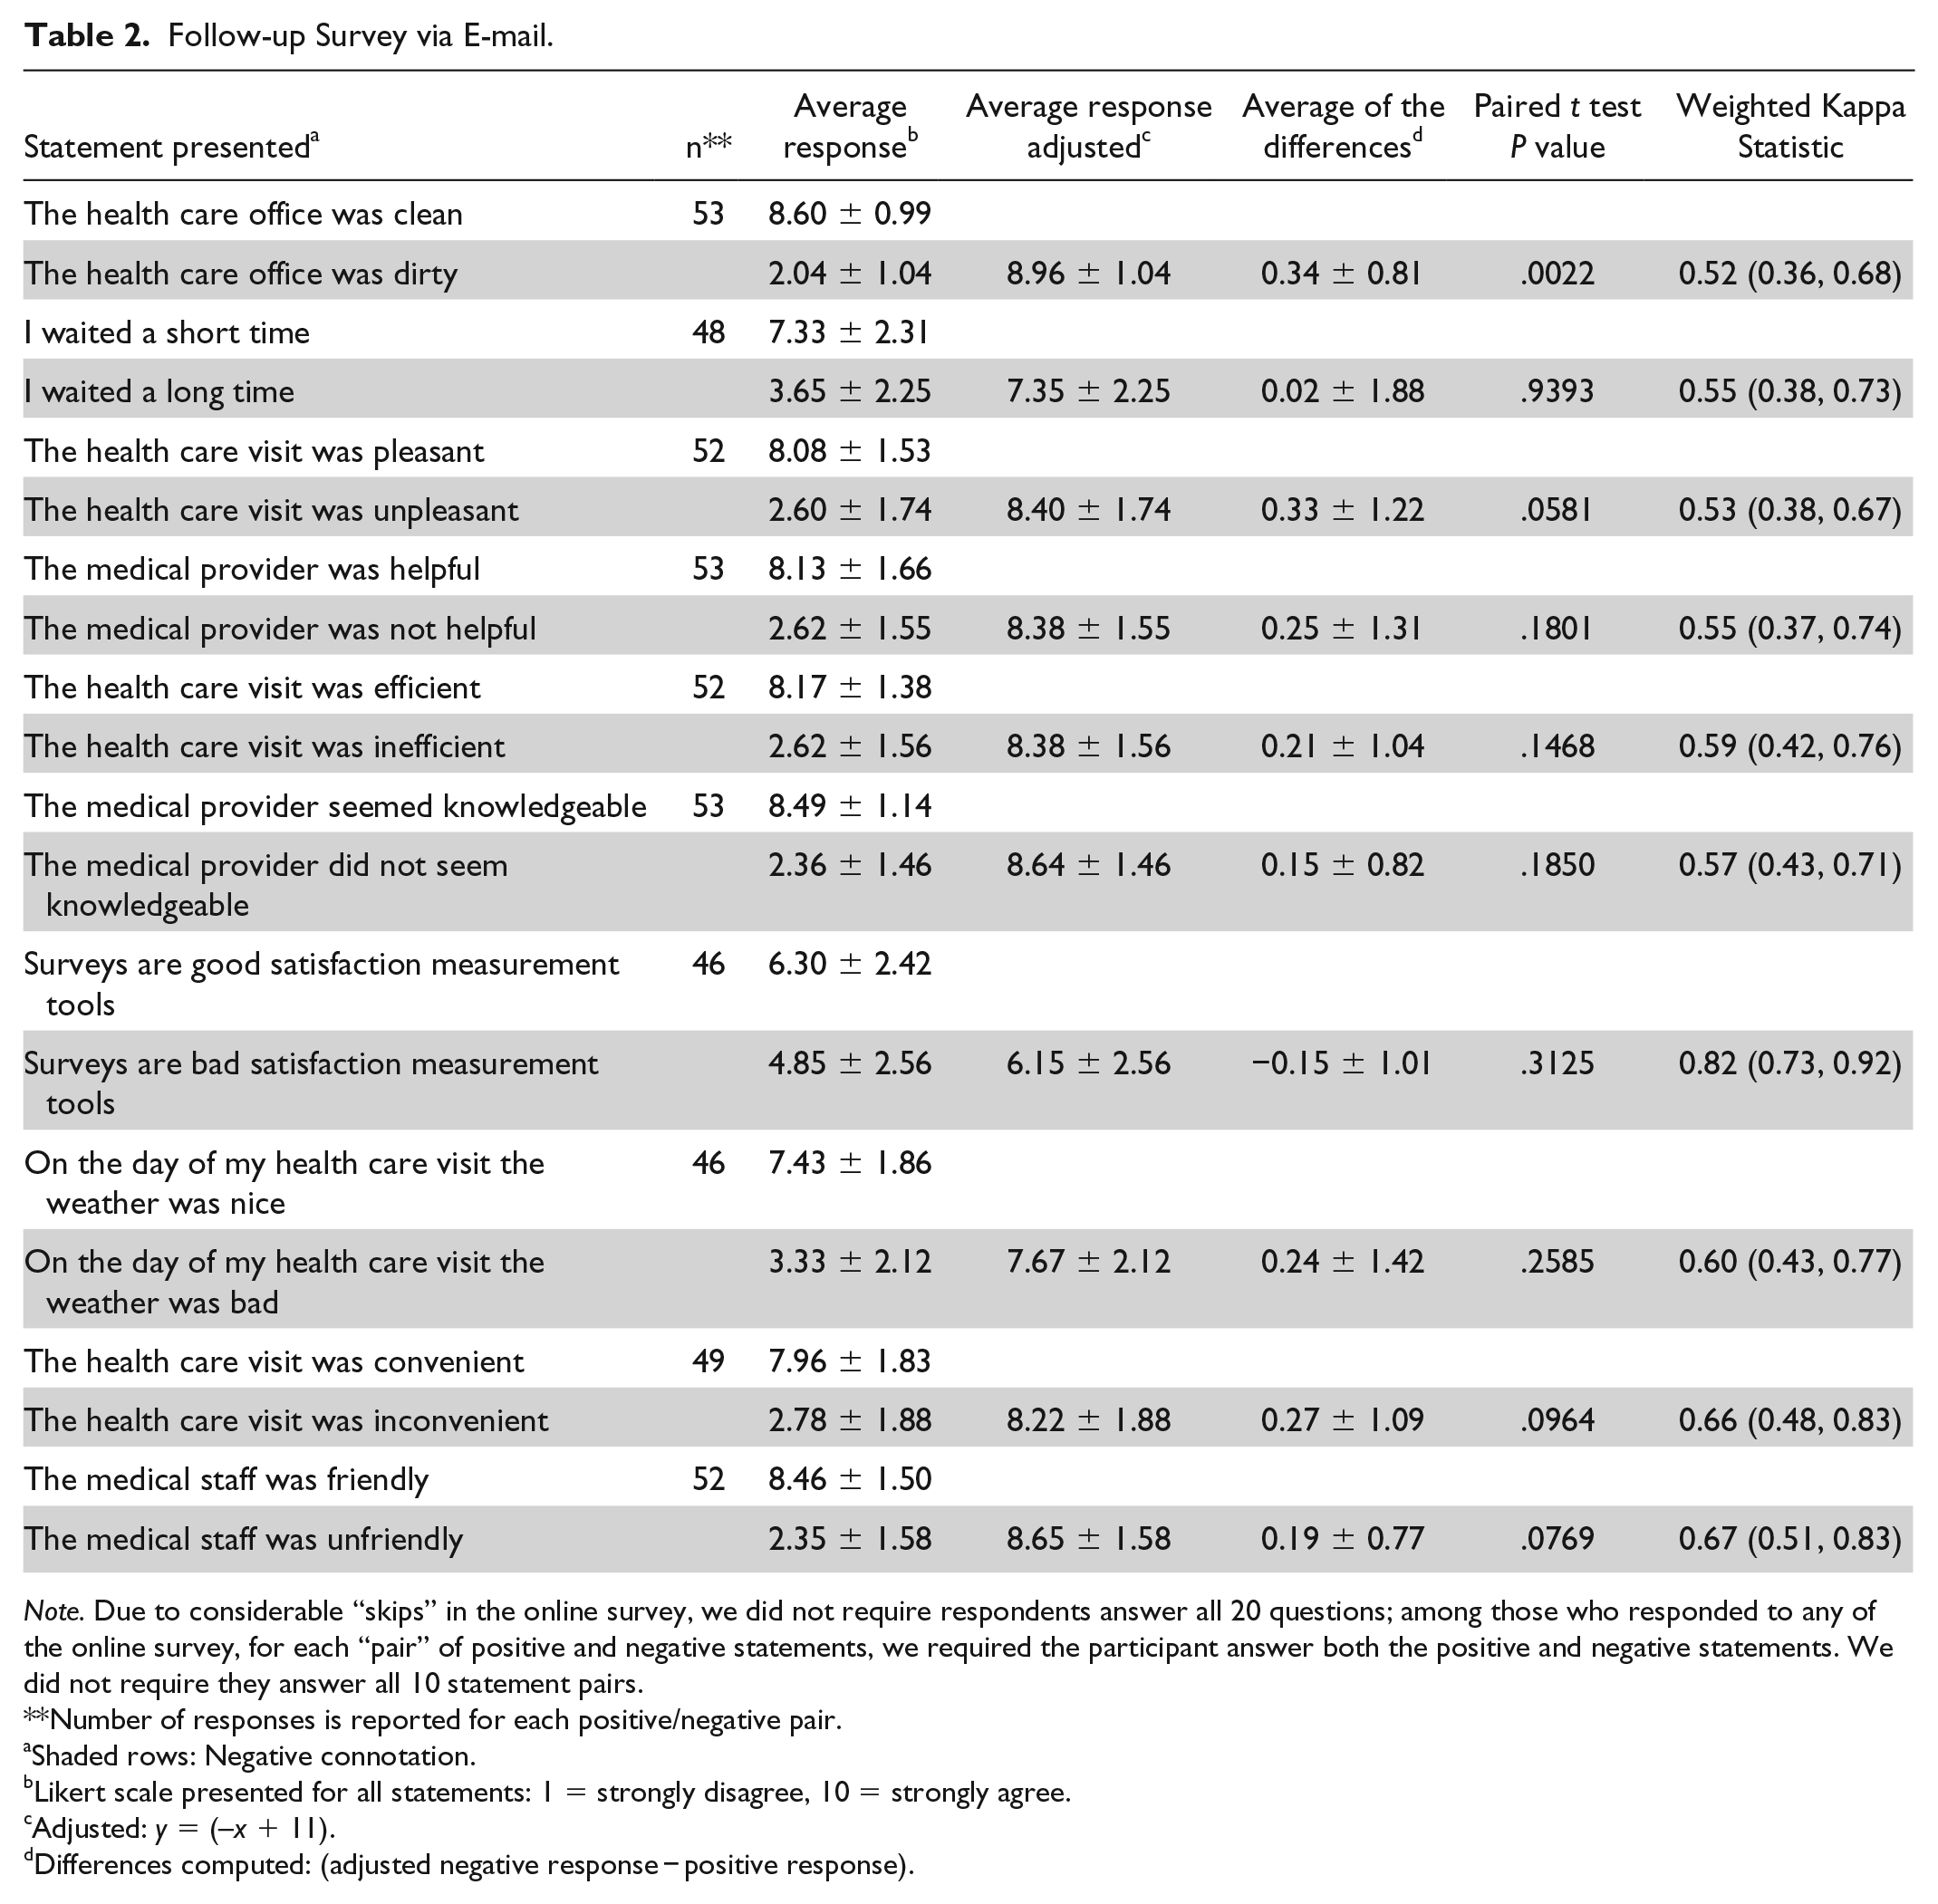
Note. Due to considerable “skips” in the online survey, we did not require respondents answer all 20 questions; among those who responded to any of the online survey, for each “pair” of positive and negative statements, we required the participant answer both the positive and negative statements. We did not require they answer all 10 statement pairs.
Number of responses is reported for each positive/negative pair.
Shaded rows: Negative connotation.
Likert scale presented for all statements: 1 = strongly disagree, 10 = strongly agree.
Adjusted: y = (–x + 11).
Differences computed: (adjusted negative response − positive response).
Table 3 demonstrates ranges of values across the digital and paper survey and the percentage of response matches between survey 1 and survey 2. None of the survey items compared between survey 1 and survey 2 matched more than 56.6% of the time (range: 27.8%-56.6%). This demonstrates that the answers changed with time and/or between delivery platforms (ie, paper vs e-mail link survey). The study was not sufficiently controlled to determine whether this change was due to these variables or to random or systematic error.
Ranges of Values Across the Digital and Paper Survey and % Response Matches Between Survey 1 and Survey 2.
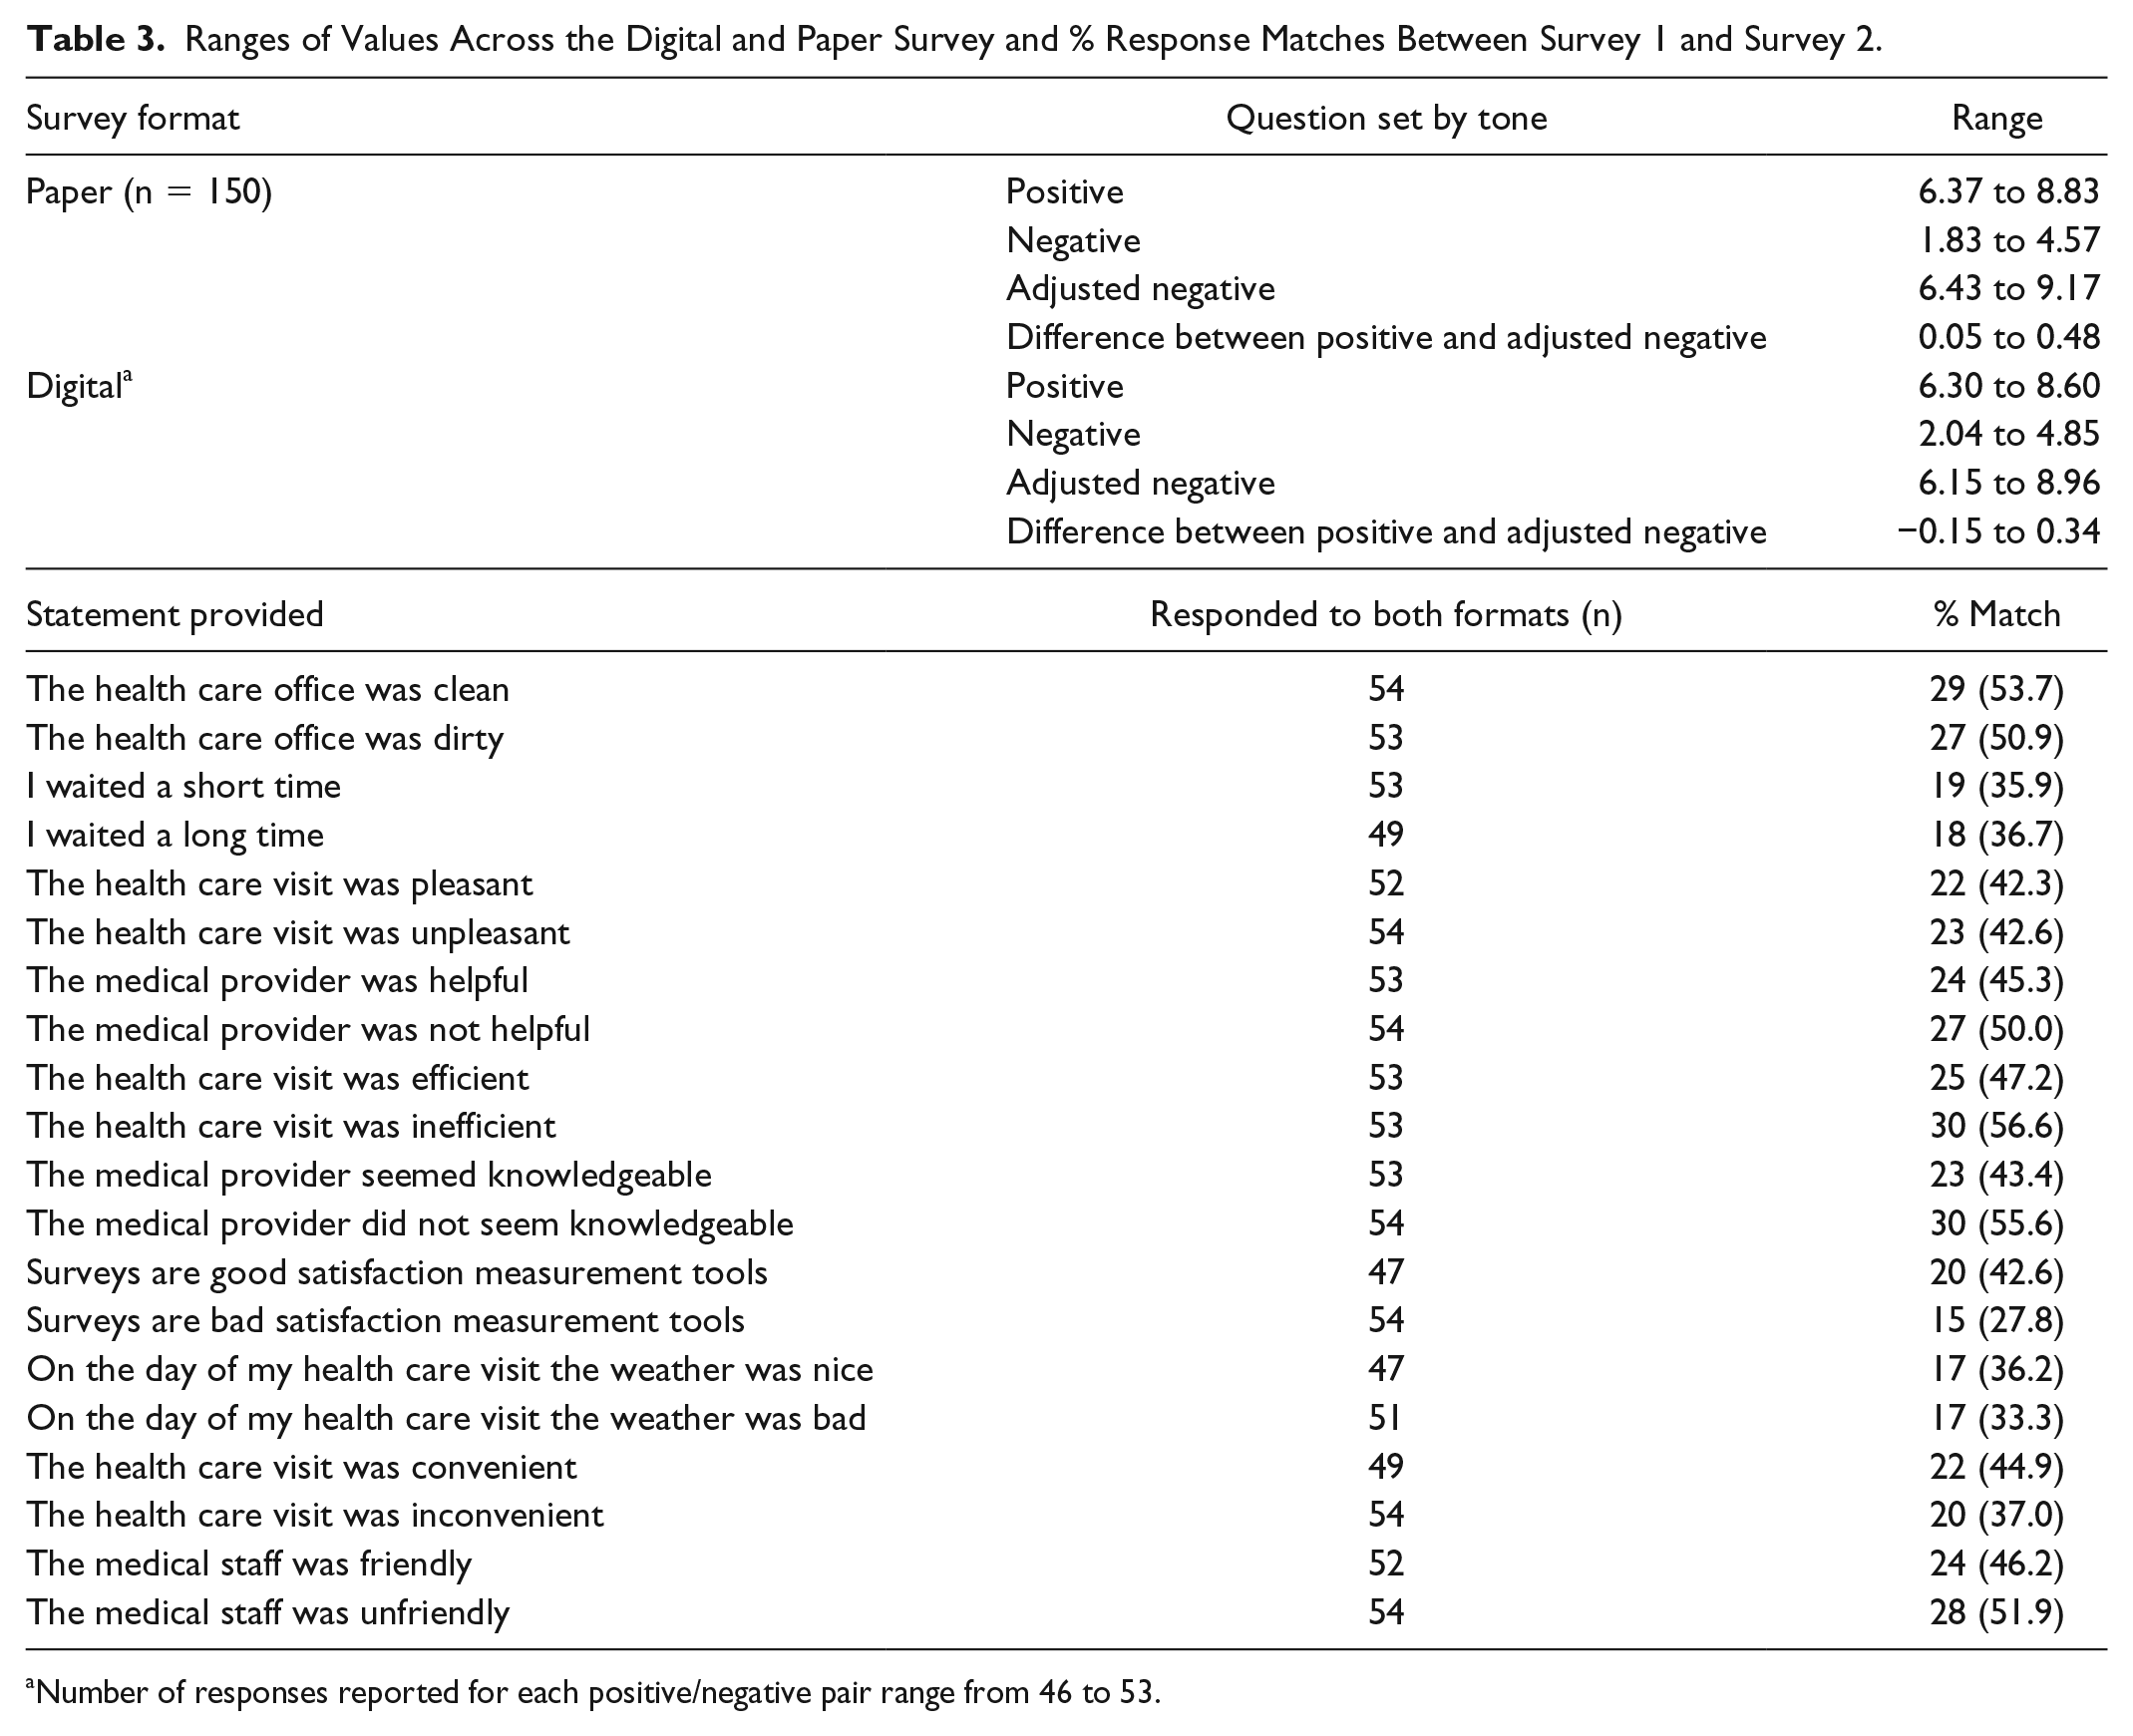
Number of responses reported for each positive/negative pair range from 46 to 53.
Discussion
Our study demonstrates that the wording of questions may affect the strength of agreement or disagreement with statements in patient satisfaction surveys. We found that, on average, a statement with a positive tone (ie, The medical staff was friendly.) that is switched to a negative tone (ie, The medical staff was UNfriendly.) elicited a more polarized response. With our question set, disagreement with a negative-toned question was stronger than agreement with a positive-toned question. The effect of tone reversal was statistically significant for 7 out of 10 of our paper survey-based health care delivery questions but only 1 out of 10 of the follow-up digital survey. The lack of statistical significance noted in the follow-up digital survey may be due to the decreased number of completed responses.
It is not always entirely clear what constitutes a positive or negative health care experience. Much of this depends on the expectations of the patient.6,7 Those with low expectations may be delighted with mediocre performance. Those with inflated expectations may be disappointed, even when provided excellent service. It is expected that positive outcomes would be associated with increased patient satisfaction scores,8-11 but this is not always the case.12,13 As one of many examples, patients with drug-seeking behavior may have inappropriate demands and disappointment with medical decision-making designed with the patient’s best interests in mind. 14
Despite the challenges of measuring patient satisfaction, the value of a health care service must be defined from the patient’s point of view. 15 This is perhaps most easily accomplished by asking the patient to rate his or her experience. Patient feedback is relatively easy and inexpensive to obtain with questionnaires or surveys. Sample questions are publicly available through government Web sites and many medical associations. Health care entities are likely to continue to migrate to government-endorsed survey models (ie, HCAHPS) as reimbursement is increasingly placed at risk with pay-for-performance algorithms. 5 Many of these surveys are provided at no cost and include comprehensive instructions on administration and interpretation.
Efforts have been made to diminish variance that is attributable to the patient satisfaction measurement methods rather than to the constructs the measures represent. For example, the use of both positively and negatively worded items in questionnaires has demonstrated a reduction in response bias. 16 HCAHPS 5-star quality ratings must be calculated with at least 100 completed surveys over a given four-quarter period and are adjusted for the effects of patient mix, survey mode, and quarterly weighting. 5 Standardization of question wording and survey administration methods are designed to remove variables that may contribute to undesired variation. Nonetheless, studies have demonstrated variation in questionnaire responses due to race/ethnicity, 17 changes in language concordance, 18 or verbal tone.19,20 A variety of common method biases exist with questionnaires and these are difficult to define and measure. 16 System and random error cannot be completely removed.
The interval between a health care service and the assessment of the service affects patient satisfaction. 21 There are few published data on the durability of HCAHPS survey responses. While it is understood that the timing of patient satisfaction measurement is important, HCAHPS surveys are routinely administered between 48 hours and 6 weeks after discharge. 22 It is assumed that HCAHPS survey results are durable within this timeframe. The results from this study suggest that data sets will need to be stratified by “time since hospital discharge” for fair comparison, although larger well-controlled studies will be required to demonstrate the extent of this effect.
The authors acknowledge that the study design was subject to selection bias. Medical students were chosen as study participants in an effort to increase response rate and to increase likelihood that survey instructions would be understood and followed. Outside of a research setting, it would not be expected for any participant to enthusiastically fill out a secondary, repetitive questionnaire. The authors recognize that medical students are not representative of the general population; however, it was felt that the use of this group of participants would not interfere significantly with the study’s goals.
Conclusion
This study demonstrated that, with an outpatient health care patient satisfaction survey, disagreement with a negative-toned question was stronger than agreement with a positive-toned question. It was also noted that individual survey answers change over time and survey platform (paper vs digital formats). These findings suggest that the wording of survey questions and also timing and method of delivery may affect patient satisfaction survey responses and these attributes should be considered when designing patient satisfaction measurement tools. Further testing is needed to determine to what degree this affect is ameliorated by standardization of survey questions and administration methods.
Footnotes
Declaration of Conflicting Interests
The author(s) declared no potential conflicts of interest with respect to the research, authorship, and/or publication of this article.
Funding
The author(s) disclosed receipt of the following financial support for the research, authorship, and/or publication of this article: Michael K. Davis, MD, MBA, received funding, in the form of salary support, in part, by a Children’s Miracle Network Research Discovery Award.