
Abstract
This study examined income-based disparities in financial burdens from out-of-pocket (OOP) medical spending among individuals with multiple chronic physical and behavioral conditions, before and after the Affordable Care Act’s (ACA) implementation in 2014. Using the 2012-2015 Medical Expenditure Panel Survey data, we studied changes in financial burdens experienced by nonelderly U.S. populations. Financial burdens were measured by (1) high financial burden, defined as total OOP medical spending exceeding 10% of annual household income; (2) health care cost-sharing ratio, defined as self-paid payments as a percent of total health care payments, excluding individual contributions to premiums; and (3) the total OOP costs spent on health care utilization. The findings indicated reductions in the proportion of those who experienced a high financial burden, as well as reductions in the OOP costs for some individuals. However, individuals with incomes below 138% federal poverty level (FPL) and those with incomes between 251% and 400% FPL who had multiple physical and/or behavioral chronic conditions experienced large increases in high financial burden after the ACA, relative to those with incomes greater than 400% FPL. While the ACA was associated with relieved medical financial burdens for some individuals, the worsening high financial burden for moderate-income individuals with chronic physical and behavioral conditions is a concern. Policymakers should revisit the cost subsidies for these individuals, with a particular focus on those with chronic conditions.
Keywords
Introduction
In a 2018 survey by Gallup, nearly 60% of U.S. adults expressed concerns about the costs of health care in the case of a serious illness, and more than 40% were apprehensive about their ability to pay for normal health care costs. 1 Foregoing medical care due to affordability concerns was prevalent among uninsured nonelderly adults as well as those with private and public insurance sources. 2 This is an even more pressing concern for the half of Americans who have chronic physical and behavioral conditions, such as diabetes, hypertension, and mood disorders, which require continuing medical care.3,4
Health care use and financial obligations rise substantially with the number of chronic conditions3,5,6 and can create hardship for those with multiple conditions, especially among lower income populations. Patients with multiple chronic conditions often face substantial out-of-pocket (OOP) spending.7,8 There are significant income-based disparities in financial burdens from spending for medical care, and these burdens likely fall hard on families with low and moderate incomes.9-12 These disparities are especially exacerbated for those with both chronic conditions and behavioral conditions. 13
The Affordable Care Act (ACA) implemented several major policies 14 that aimed to improve the affordability of health care in poor- and low-income households, which often cope with a high prevalence of chronic and behavioral conditions.13,15 These policies included Medicaid expansion in more than 30 states to individuals with family incomes below 138% of the federal poverty level (FPL), premium subsidies for enrollees in health insurance exchanges with incomes between 100% and 400% FPL, and in addition, cost-sharing subsidies (eg, lower deductibles) were available in exchange plans to those with family incomes between 100% and 250% FPL. The ACA also directly addressed OOP spending by placing restrictions on maximum personal OOP payments for health care. Furthermore, under the ACA, private insurers were also prohibited from charging higher premiums, setting limits on selected benefits, or denying coverage because of pre-existing health conditions. All the policies discussed went into effect in 2014. While there is some evidence that the ACA implementation was associated with reduced financial burdens,11,16,17 little is known about whether the problems were lessened for those with multiple chronic conditions, particularly in lower income households. Individual OOP medical spending includes self-paid expenditures from using health care, such as deductibles, co-insurance, and co-payments, as well as personal contributions to health insurance premiums. Prior to the ACA, the financial vulnerability of lower income families due to health care expenditures was highly prevalent, 18 especially for those with chronic conditions. 8 The ACA has resulted in substantial gains in insurance coverage and improved access to care for those with chronic conditions. 19 The OOP contributions to premiums were likely lowered, too, because of tightened premium rules and the elimination of underwriting denials based on pre-existing conditions. However, it is unclear whether financial burdens were reduced in low and moderate-income families, especially among those with chronic or behavioral conditions. Privately insured individuals still have substantial premium and cost-sharing obligations, even when subsidies are available for exchange plan enrollees. 20 Moreover, the newly insured may have pent-up demand for health care, resulting in higher OOP cost-sharing payments through an increase in health care utilization after gaining coverage through the ACA.
In this study, we examined the financial burdens experienced by individuals with multiple health conditions from different income groups after the ACA was implemented in 2014. We considered both chronic physical conditions and behavioral conditions, because they can result in higher health care costs when co-occurring and because they are more prevalent among low-income individuals. 13
Methods
Data
We analyzed a nationally representative sample of civilian noninstitutionalized individuals, including both children and adults younger than 65 years, using the 2012-2015 Medical Expenditure Panel Survey (MEPS) data. 21 The MEPS is a national survey that includes details of demographic and socioeconomic data, medical conditions, health care utilization, detailed insurance coverage, and sources of medical spending for community-dwelling individuals and family members. The most recent available medical conditions data are from 2015.
The MEPS Household Component follows the same definitions of family, income, and poverty categories as the Current Population Survey by the U.S. Census Bureau. Data on the person-level total annual earnings are collected from more than 20 sources (eg, wages, salaries, Social Security, etc). 21 The MEPS uses the annual total family income to further calculate the percentage of family income in terms of the applicable FPL.
The Household Component of MEPS also collects total health care expenditures, which is the sum of direct payments for several categories of care provided to a person during the year (office- and hospital-based care, home health care, dental services, vision aids, and prescribed medicines). These include OOP payments and payments by different insurance and other sources. Data from the MEPS Person Round Plan files were used for OOP premiums contributed by privately insured individuals and families to their health plans, including the premiums paid for plan dependents.
Measures
The data from each year were used to construct the measures. The annual total OOP medical spending includes the OOP payments for utilization of health care and the OOP health insurance premiums paid by enrollees. The OOP payments include both 100% self-paid expenses for health care and the OOP payments to fulfill insurance requirements (deductibles, coinsurance, and co-payments). The MEPS collects the data of OOP premium information from each plan policyholder, including OOP premiums for the family plan. The annual OOP premium was prorated by multiplying the monthly premium by the months of coverage during a year. Following prior literature, 10 we imputed the Medicare Part B premiums for nonelderly adults in Medicare who were not dually enrolled in Medicaid. Approximately 2% of the nonelderly individuals in our sample had zero or negative family income values, for which we imputed US$100 to calculate the financial burden. 10
We examined 3 financial burden measures in this study. First, we estimated the high financial burden due to medical spending, defined as annual total OOP medical spending for health care and premiums exceeding 10% of annual household income.10-11,22 Second, we also examined the health care cost-sharing ratio, constructed by dividing the annual self-paid costs from health care utilization by the total expenditures for health care in the family. The spending and income were both measured at the family level, so each person in the family was assigned the same financial burden level. Finally, because a change in the cost-sharing ratio could represent changes in the OOP costs or changes in the total health care spending, we also included an outcome measure representing total OOP costs spent on health care utilization, including the OOP costs on health services and prescription drugs for the family.
To construct our analytic samples, chronic and behavioral conditions were defined following prior literature. 13 Data from each year were used to categorize individuals into condition groups. The chronic conditions of interest included 10 self-reported “priority conditions” from MEPS: hypertension, heart disease, stroke, emphysema, chronic bronchitis, high cholesterol, non-skin cancer, diabetes, arthritis, and asthma. These conditions were selected by the Agency for Healthcare Research and Quality (AHRQ) because of their prevalence and high costs. 21 Individuals were categorized with a behavioral health condition (anxiety, depression, other mood disorders, psychoses, personality disorders, or substance use disorders) based on the AHRQ Clinical Classification Codes 650-652, 656-663, and 670 from the MEPS Medical Conditions files.13,21,23 All medical conditions were originally reported by the Household Component respondent and recorded by the interviewer as verbatim text. Professional coders coded the text information to the International Classification of Diseases, Ninth Revision, Clinical Modification (ICD-9-CM) codes, which were further aggregated into clinically meaningful categories that group similar conditions using the Clinical Classification Software. 23
Other Measures
We also examined a list of individual factors selected based on the predisposing characteristics (eg, race/ethnic characteristics, age, sex) and enabling characteristics (eg, education, language proficiency, and health care appointment availability) in Andersen 24 behavioral model of health care use. All the individuals in the sample were grouped into mutually exclusive race/ethnicity groups, including Hispanic, non-Hispanic white, non-Hispanic black, and non-Hispanic others. Other socioeconomic characteristics included education (less than high school degree, high school degree and college degree) and employment status (employed or had a job to return to throughout the measurement year). We measured whether an individual was able to get appointments as needed, as well as whether the person had English proficiency. Attitudes toward medical care were measured by assessing opinions about receiving help from a medical professional (variable equal to 1 if respondent strongly agreed that one can overcome illness without help from a medically trained person). Furthermore, family size was measured by numbers of family members, and the family size was considered in the analyses.
Analytic Approach
Our study hypothesis was that lower income groups experienced greater reductions in financial burdens after the implementation of the ACA, compared to those with incomes greater than 400% FPL. The study employed a repeated cross-sectional design to assess changes in income-based differences in financial burden measures under the ACA across several groups. Prior literature has indicated substantially higher health care costs to those with co-occurring chronic and behavioral conditions compared to people with only chronic conditions 13 ; thus, our study samples are defined according to the presence of chronic conditions and/or behavioral conditions: (1) no chronic conditions or behavioral health conditions, (2) 1 to 2 chronic conditions without behavioral conditions, (3) 3 to 4 chronic conditions without behavioral conditions, (4) at least 5 chronic conditions without behavioral conditions, (5) 1 to 2 chronic conditions plus behavioral conditions, (6) 3 to 4 chronic conditions plus behavioral conditions, and (7) at least 5 chronic conditions plus behavioral health conditions. Household income was classified into 4 income classes: less than 138% FPL, between 138% and 250% FPL, between 251% and 400% FPL, and greater than 400% FPL.
Statistical analyses were conducted at the individual-year level. A separate logistic regression model was used to estimate the changes in the probability of having a high financial burden under the ACA by income, within each condition group. Generalized linear models (GLMs) were estimated to assess the changes in the 2 continuous variables—the cost-sharing ratio and the total OOP costs, by income within each condition group. 25 We performed modified Park tests for the 2 continuous outcome measures to determine the appropriate family distribution for the GLMs.25,26 We used family income levels of greater than 400% FPL as the reference group. A binary variable indicated the period after the ACA was implemented (2014 and 2015). The interaction terms between income levels and the ACA indicator in these models captured the relative changes in outcome measures before and after the ACA, by income groups. Marginal effects of the interaction terms were reported in the results. The estimated effects indicated the average change among individuals in different income groups from pre- to post-ACA, contrasted to the change among individuals from the reference income group over the same time periods.
For the regression models, we controlled for various individual characteristics as described above, as well as fixed year effects to capture the changes in outcome measures over time and regional effects to capture the regional differences in the outcome measures. The analysis also controlled for family size to account for its impact on health care spending at the family level. By removing the effects from these control covariates, we isolated the ACA association with changes in financial burdens in the modeling.
All analyses accounted for the complex survey design by using sampling weights, primary sampling units (PSU), and strata, following the instructions provided by the MEPS to generate nationally representative estimates. 27 When the MEPS strata and PSU design variables (VARSTR and VARPSU, respectively) are properly specified (readily available in MEPS), the analysis will employ the robust variance estimator, which correctly accounts for all correlations nested below the first-stage sampling level (the PSU), including intra-family correlation. Thus, clustering at all stages of sample selection is accounted for with the PSU design variable specified. 28
Results
The sample characteristics during the study period are presented in Table 1, with the sample sizes for each subgroup in the analysis. More than half of those who had at least 5 chronic conditions had income levels below 250% FPL. Forty-four percent of people with at least 5 chronic conditions plus behavioral conditions had income levels below 138% FPL.
Characteristics of Study Samples in 2012-2015.

Note. The survey sampling weights were used to adjust sample characteristics to be nationally representative. The sample characteristics during the study period are presented in Table 1. FPL = federal poverty level.
Multivariable regression results that controlled for a list of covariates are presented in Table 2. As shown, reductions in the OOP cost-sharing ratios were found in several condition groups after the ACA. For example, individuals with at least 5 chronic conditions without behavioral conditions from families with income levels below 138% FPL and between 138% and 250% FPL had decreased cost-sharing ratios (7.6 and 10.44 percentage points, respectively), compared to those with incomes greater than 400% FPL. Majority of other groups did not experience any cost-sharing reductions after the ACA.
Regression Results of 3 Outcome Measures (Marginal Effects in Percentage Points, Standard Errors).

Note. Health care cost-sharing ratio was defined as the annual self-paid costs of using health care divided by the total expenditures for health care in the family. High financial burden due to medical spending, defined as annual total OOP medical spending for health care and premiums exceeding 10% of annual household income. Total out-of-pocket spending from using health care was defined as the total annual self-paid costs of using health care including both expenses for medical services and prescription drugs. Marginal effects of these interaction terms were reported in the results. They indicated the average change among individuals from one income group from pre- to post-ACA, contrasted to the change among individuals from the reference income group from pre- to post-ACA. The regression models were adjusted for various covariates, including race/ethnic characteristics, age, sex, education, English proficiency, health care appointment availability, employment status, attitudes toward medical care, family size, as well as fixed year and regional effects. All analyses accounted for the complex survey design by using sampling weights, primary sampling units, and strata provided by the MEPS. FPL = federal poverty level; ACA = Affordable Care Act; MEPS = Medical Expenditure Panel Survey; GLM = generalized linear model.
P < .05. **P < .01.
The full regression results were included in the online Appendices 1-3.
We also found significant variations in high financial burdens experienced by different income groups after implementation of the ACA. Relative to individuals with income levels over 400% FPL, those who had 1 to 2 chronic conditions and were from families with incomes between 138% and 250% FPL were 7.30-percentage-point less likely to experience a high financial burden after the ACA. In contrast, moderate-income individuals (between 251% and 400% FPL) from the sickest group—those with at least 5 chronic physical conditions, along with behavioral conditions—experienced a 37.95 percentage-point increase in the likelihood of having a high financial burden after the ACA, compared to those from families with an income more than 400% FPL. Similarly, those who had 3 to 4 chronic conditions without behavioral conditions in the lowest income group also had increased probabilities of having a high financial burden after the ACA compared to those from the reference income group.
As shown in Table 2, we found that those who had 1 to 2 chronic conditions but no behavioral conditions with incomes between 138% and 250% FPL and those with incomes between 251% and 400% FPL both experienced a decrease in the OOP costs compared to the reference group. Individuals in other groups did not have changes in the amount paid OOP for health care after the ACA. This confirmed that the finding of a decreased cost-sharing ratio in this group after the ACA was due to lowered OOP costs and not increased total spending.
In Figures 1-3, we further summarized the average regression-adjusted trends of cost-sharing ratios, having high financial burdens and the amount of OOP spending for health care, for individuals from the 4 income classes within each condition group, before and after the ACA. As shown, individuals with family incomes between 251% and 400% FPL who had at least 5 chronic conditions with behavioral conditions saw an increased probability of having a high financial burden from 0.23 to 0.47 (the difference is 0.24) after the ACA. The probability for those with incomes greater than 400% FPL decreased from 0.20 to 0.06 after the ACA. Thus, the difference between these 2 changes was 0.38 (0.38 × 100 is 38% percentage points change as displayed in Table 2).

Average estimated health care cost-sharing ratio before and after ACA by income.

Estimated probabilities in high financial burden before and after ACA by income.
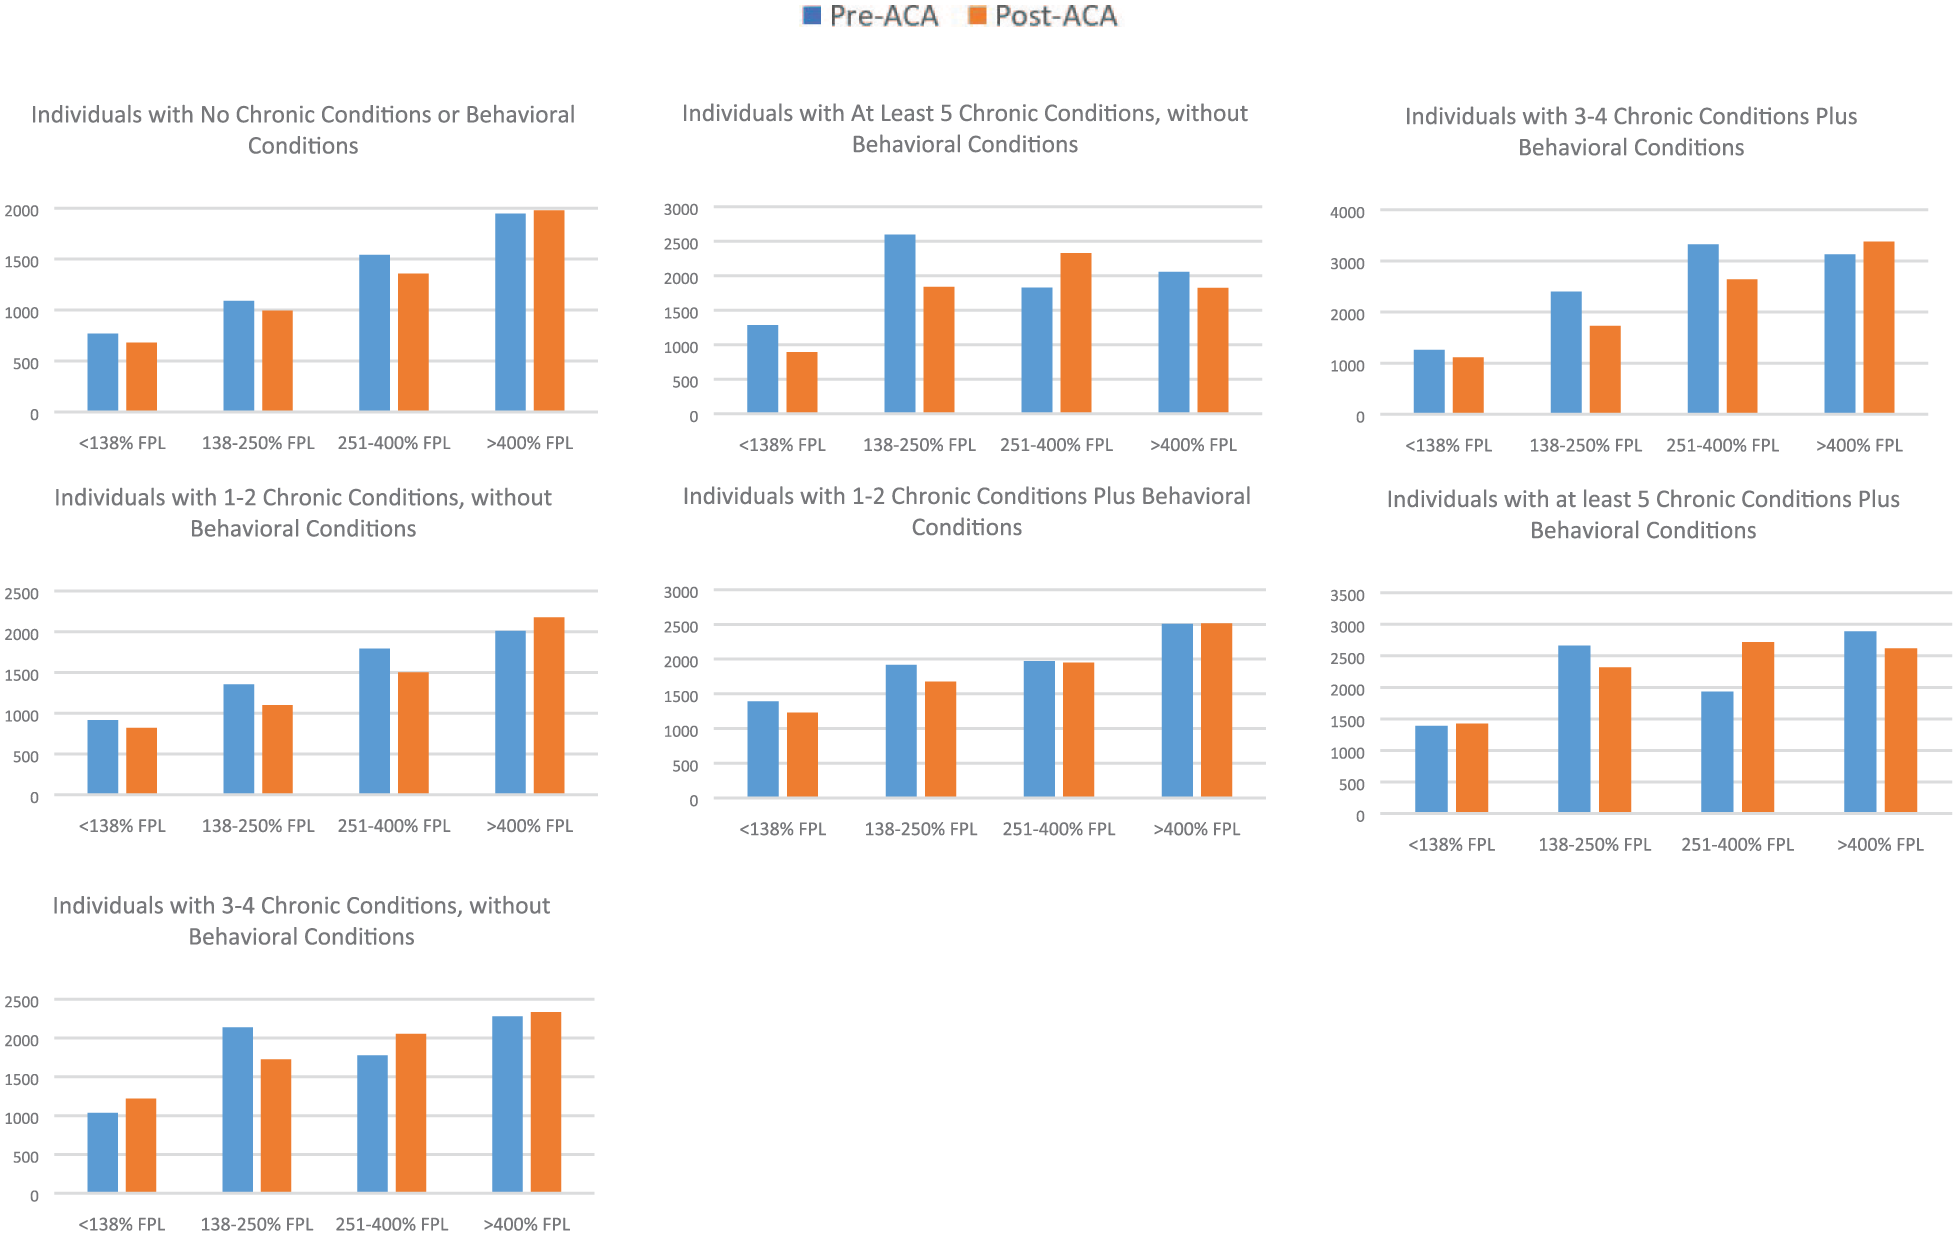
Average estimated total out-of-pocket costs from utilization of health care before and after ACA by income.
Discussion
In addition to the expanded coverage from the ACA, there was some optimism that medical care would also be more affordable, especially for those with low and moderate incomes. Prior to its implementation, costs were disproportionately burdensome for the lower income groups, especially for those with heavier disease burdens. Our study examined the changes in income-based differences for high financial burdens from medical spending among individuals with multiple chronic physical and behavioral conditions after the ACA. The findings indicated reductions in the proportion of those who experienced a high financial burden, as well as reductions in the OOP costs for some individuals. This finding is consistent with prior literature that demonstrated reduced financial burdens for those in small group plans and young adults with mental conditions who were eligible for dependent coverage under the ACA.16,17 Our study also indicated that the reduced financial burdens only accrued to several lower income groups with multiple chronic physical conditions without behavioral health conditions.
Our finding that there was a substantial rise in the likelihood of high financial burdens among those with low and moderate incomes who had multiple physical and/or behavioral chronic conditions was unexpected. There are several possible explanations. First, only 29 states and the District of Columbia expanded Medicaid under the ACA by 2015. Those with multiple chronic conditions with incomes below 138% FPL living in nonexpansion states could still encounter catastrophic health expenses entirely OOP. Second, those with moderate-income levels were not eligible for Medicaid, which has very low or nonexistent OOP requirements. Thus, these individuals faced sizable OOP premium contributions likely paired with high deductibles with individually purchased insurance plans. Those with moderate incomes who enrolled in the marketplace exchanges established by the ACA may also face substantial medical spending. The premium subsidies are scaled by income for exchange enrollees, and the cost-sharing subsidies only extend to those with incomes up to 250% FPL. Even with premium subsidies, individuals with family income levels between 250% and 400% FPL still face premiums up to 8.21% to 9.69% of their annual income for the Silver plan in the insurance exchanges. 29 In fact, many individuals with family incomes between 200% and 400% FPL remained uninsured due to insurance costs. 13 With more than 60% of Americans not being able to pay US$1000 for an emergency, 30 even relatively modest medical expenses can be burdensome for families with lower incomes and costly conditions. 31
While the ACA expanded coverage options through the exchanges and provided subsidies for enrollment in different metal levels of plans, these plans included substantial cost-sharing with deductibles, co-payments, and co-insurance OOP costs. For instance, in 2018, the average deductible for the Silver plan in the exchange marketplace was US$4034 for a single individual. 32 Furthermore, for many of those in the moderate-income category who had been previously uninsured, the new expanded coverage of the ACA likely triggered pent-up demand.
The substantial increase in the prevalence of high financial burdens among moderate-income individuals with chronic conditions was not limited to those in marketplace exchanges. Because the proportion of people with employer-sponsored insurance (ESI) is much greater than that with the ACA exchange coverage, our finding of increased financial burdens may also be driven by ESI enrollees with moderate incomes. In fact, about 1 in 5 large employers have shifted health care costs to their employees since the ACA was implemented. 33 Currently, about 25% of those with income levels less than 400% FPL are enrolled in high-deductible plans, and the majority of low-income enrollees in these plans have reported financial difficulties with their OOP medical spending. 11 Prior literature has suggested that with various insurance plan options, consumers may not select the most cost-effective plans as a result of low literacy in basic insurance concepts. 34 While the purpose of the high-deductible plans is to induce enrollees to be more conscious about spending, the deductible requirements may have added to the financial hardships of enrollees with chronic conditions. 35 Some participants in these plans may have a steep learning curve to better manage their care in a cost-effective manner.
The fact that financial burdens remained unchanged or even increased after the ACA among those with behavioral conditions is concerning. Because of their low participation rates in both public and private insurance plans, behavioral health specialists are much less likely to participate in insurance plans’ networks compared with providers in other specialties. For example, more than one-third of psychiatrists do not accept new private patients, and a substantially higher proportion of psychiatrists do not accept new Medicaid patients compared to other physician specialties. 36 In fact, the narrow networks of mental health providers in the ACA Marketplaces have also raised criticisms by others. 37 As a result, many with behavioral conditions must seek care from out-of-network providers and pay higher OOP prices.38,39
Our study has a few limitations that merit comment. First, state identifiers were not available in the MEPS data. Thus, we could not separately examine whether changes in financial burdens experienced by individuals in the Medicaid expansion states differed from those in nonexpansion states. Second, as with most surveys, income data may be under-reported. However, since the MEPS summarized family income based on a comprehensive list of income sources following the same definition used by the Census Bureau, the impact of under-reporting was minimized. Moreover, our study only covered the first 2 years of the ACA. It could be that the effects we observed are transient and will resolve as pent-up demand settles down in a few years. However, some individuals may not increase health care use as a result of concerns to potential OOP expenses for cost-sharing requirements. The observed changes in financial burdens may have only captured part of the medical spending for some families. 2 Thus, the financial burden of OOP medical spending for moderate-income individuals should be reevaluated in the near future.
Furthermore, findings from this study should not be interpreted as establishing causality. We measured changes in financial burdens in different income groups before and after the ACA was implemented, during a period when other changes were occurring. Thus, we cannot exclude the possibility that a concurrent change unrelated to the ACA confounded the results. There are several ways other changes could influence the OOP spending. For example, the adoption of high-deductible plans was rising with a substantial increase in the deductible amount required by plans. 39 Furthermore, because of a repeated cross-sectional design, the chronic and behavioral conditions may only be captured at a given time during a year, while the outcome measures and the ACA indicator were both constructed on an annual basis. Thus, the observed differences between pre- and post-ACA may have detected both actual differences between periods and the unobserved measurement timing that impacted the condition measures. Moreover, the ACA included multiple changes that may have impacted OOP costs. While the expanded insurance coverage may result in improved access and delivery of various clinical services, these data could not be used to definitively attribute the changes to benefits mandated by the ACA. For example, some services used to calculate OOP costs in our study were not part of the ACA’s Essential Benefits. Thus, services such as dental care cannot definitively be attributed to changes in the OOP costs from the ACA. Finally, the ACA may have had different financial burden impacts for those who switched type of insurance than those who newly gained coverage, even for individuals within the same income group. Their OOP financial burdens could have changed in various directions, but we would not have detected these differences in our analysis.
This study offers a comprehensive picture of financial hardships experienced by Americans with complex medical conditions in lower income families, even after the ACA. While the ACA improved the affordability of care for some vulnerable populations, financial burdens among other moderate-income groups appear to have worsened. Our findings raise the concerns over continued health care financial stress experienced by moderate-income individuals with chronic physical and behavioral conditions even after the ACA implementation. Future efforts that target the financial burdens of coverage for vulnerable populations should not overlook moderate-income groups, especially those with chronic conditions.
Supplemental Material
Appendix_1 – Supplemental material for Income-Based Disparities in Financial Burdens of Medical Spending Under the Affordable Care Act in Families With Individuals Having Chronic Conditions
Supplemental material, Appendix_1 for Income-Based Disparities in Financial Burdens of Medical Spending Under the Affordable Care Act in Families With Individuals Having Chronic Conditions by Wendy Yi Xu, Sheldon M. Retchin, Eric E. Seiber and Yiting Li in INQUIRY: The Journal of Health Care Organization, Provision, and Financing
Supplemental Material
Appendix_2 – Supplemental material for Income-Based Disparities in Financial Burdens of Medical Spending Under the Affordable Care Act in Families With Individuals Having Chronic Conditions
Supplemental material, Appendix_2 for Income-Based Disparities in Financial Burdens of Medical Spending Under the Affordable Care Act in Families With Individuals Having Chronic Conditions by Wendy Yi Xu, Sheldon M. Retchin, Eric E. Seiber and Yiting Li in INQUIRY: The Journal of Health Care Organization, Provision, and Financing
Supplemental Material
Appendix_3 – Supplemental material for Income-Based Disparities in Financial Burdens of Medical Spending Under the Affordable Care Act in Families With Individuals Having Chronic Conditions
Supplemental material, Appendix_3 for Income-Based Disparities in Financial Burdens of Medical Spending Under the Affordable Care Act in Families With Individuals Having Chronic Conditions by Wendy Yi Xu, Sheldon M. Retchin, Eric E. Seiber and Yiting Li in INQUIRY: The Journal of Health Care Organization, Provision, and Financing
Footnotes
Declaration of Conflicting Interests
The author(s) declared the following potential conflicts of interest with respect to the research, authorship, and/or publication of this article: S.M.R. is a commissioner with the Medicaid and CHIP Payment and Access Commission (MACPAC), which advises Congress and the Secretary of Health and Human Services on policies and payments related to Medicaid and the Children’s Health Insurance Program. The viewpoints expressed in this manuscript are the author’s perspectives and do not represent the positions of MACPAC. He also receives fees as a member of the Board of Directors of Aveanna Healthcare, a privately held company that provides home care to children and their families. Drs W.X. and E.S. and Y.L. do not have conflicts of interests to be disclosed.
Funding
The author(s) disclosed receipt of the following financial support for the research, authorship, and/or publication of this article: This study received financial support from the Institute for Population Research and core support from the NIH center grant P2CHD058484 awarded by the National Institute of Child Health and Human Development.
Supplemental Material
Supplemental material for this article is available online.
References
Supplementary Material
Please find the following supplemental material available below.
For Open Access articles published under a Creative Commons License, all supplemental material carries the same license as the article it is associated with.
For non-Open Access articles published, all supplemental material carries a non-exclusive license, and permission requests for re-use of supplemental material or any part of supplemental material shall be sent directly to the copyright owner as specified in the copyright notice associated with the article.